1. Introduction
When there is relative movement between a fluid and a solid surface, a boundary layer is formed. This is the layer of fluid in the immediate vicinity of the bounding surface where the effects of viscosity are significant, and it can be either laminar or turbulent. Simplified, the laminar boundary corresponds to a smooth flow, whereas the turbulent boundary layer contains eddies. At the same time, the solid surface experiences a force of resistance in the fluid due to frictional and pressure forces: the “drag force”. Practically, this is the component of the surface force parallel to the flow direction (the other component of the surface force that is perpendicular to the oncoming flow direction is the “lift force”). A laminar boundary is associated with less skin friction than a turbulent one, but it tends to break down more suddenly. In the case of a full-size body (e.g., a wing surface), as the flow develops along its surface, the initial laminar boundary layer becomes thicker (and thus less stable) as the flow continues back from the leading edge, and at a certain distance, the laminar boundary layer breaks down and transitions into a turbulent one. It becomes apparent that any spatial delay of this transition is advantageous since the surface experiences lower drag. Furthermore, turbulent flow is a source of aerodynamic noise generated from the unsteady nature of this kind of flow. Finally, apart from the laminar-to-turbulent flow transition and the aerodynamic noise, a third important effect due to excessive momentum loss near the solid surface in a boundary layer trying to move downstream against increasing pressure (adverse pressure gradient) is the boundary layer detachment/separation from the surface (into a wake).
The tremendous technological and financial impact of the possibility of controlling the abovementioned flow field effects, e.g., in the aerospace industry and the aircraft market, has been recognized since decades and many methods for flow manipulation (e.g., lift enhancement and drag reduction) have been developed. Most of them refer to efficient mechanical devices, which however may be complicated, heavy, massive sources of noise and vibrations, or maintenance critical, thus partially offsetting the active airflow control value. As a counterweight, units based on atmospheric-pressure, low-temperature plasmas of electrical discharges have been devised for active airflow control. These are the plasma actuators. Two plausible principal physical mechanisms have been proposed on the operation of the plasma actuators. Either an electrohydrodynamic body force provokes collisions between ionic and neutral species, leading thus to the production of so-called electric or ionic wind [
1,
2], or electric energy is instantly transformed into heat energy, leading to the formation of moving blast waves responsible for large-scale flow field structures [
3,
4].
Excellent reviews on plasma actuators exist [
5,
6], gathering the fundamental concepts and the state-of-the-art in the field. We typically deal with surface electrical discharges exploiting unique features from the dielectric barrier discharge (DBD) [
7]. This includes arc transition prevention due to the dielectric barrier, which in turn results in a low gas temperature, high engineerability, responsivity within the sub-microsecond time scale, absence of moving components, implicit conversion of electric power into a moving fluid, long background of studies and applications in various interdisciplinary scientific fields [
7,
8,
9], etc. The great number of reports published over the last decade on the topic of plasma actuators and the ongoing research has a twofold meaning. First, it proves the importance and the potentiality of these devices, whereas second, it states that many issues have not yet been met and further challenges still exist (e.g., energy conversion efficiency factor enhancement). Numerous studies focus on the geometry-configuration optimization [
10,
11,
12], the dielectric barrier specifications [
12,
13], the material endurance [
13,
14], the role of the driving voltage characteristics [
12,
15,
16,
17], the boundary layer separation control [
18,
19], the laminar-to-turbulent transition delay [
20], etc., just to name a few.
As a contribution to the field, the present study is devoted to the implementation of a particular single dielectric barrier discharge (SDBD) [
21] plasma actuator and its test under sinusoidal high voltage. Kapton
® polyimide films are used as the dielectric barrier due to their ability to be mounted onto curved aerodynamic surfaces. On the other hand, silver (Ag) conductive paint is selected for the formation of the electrodes due to its provided feasibility to design electrodes of every shape with negligible thickness on a variety of surfaces. Both choices make the actuator fully flexible, and this is the main claim of the present communication. The actuator is probed by means of electrical and optical techniques. Electrical measurements are conducted to investigate the time evolution of the power consumption and the endurance of the actuator, over the time window of a day. High-resolution optical emission spectroscopy (OES) provides an insight into the emitting species of the plasma as well as an estimation of the temperature of the air above the actuator. Then, pitot-like tube and schlieren imaging give access to the induced fluid speed and the pattern of the relevant flow field, respectively. Eventually, the overall experimental results allow for a brief discussion on the physical mechanisms governing the aerodynamic specifications of this flexible plasma actuator.
2. Experimental Setup
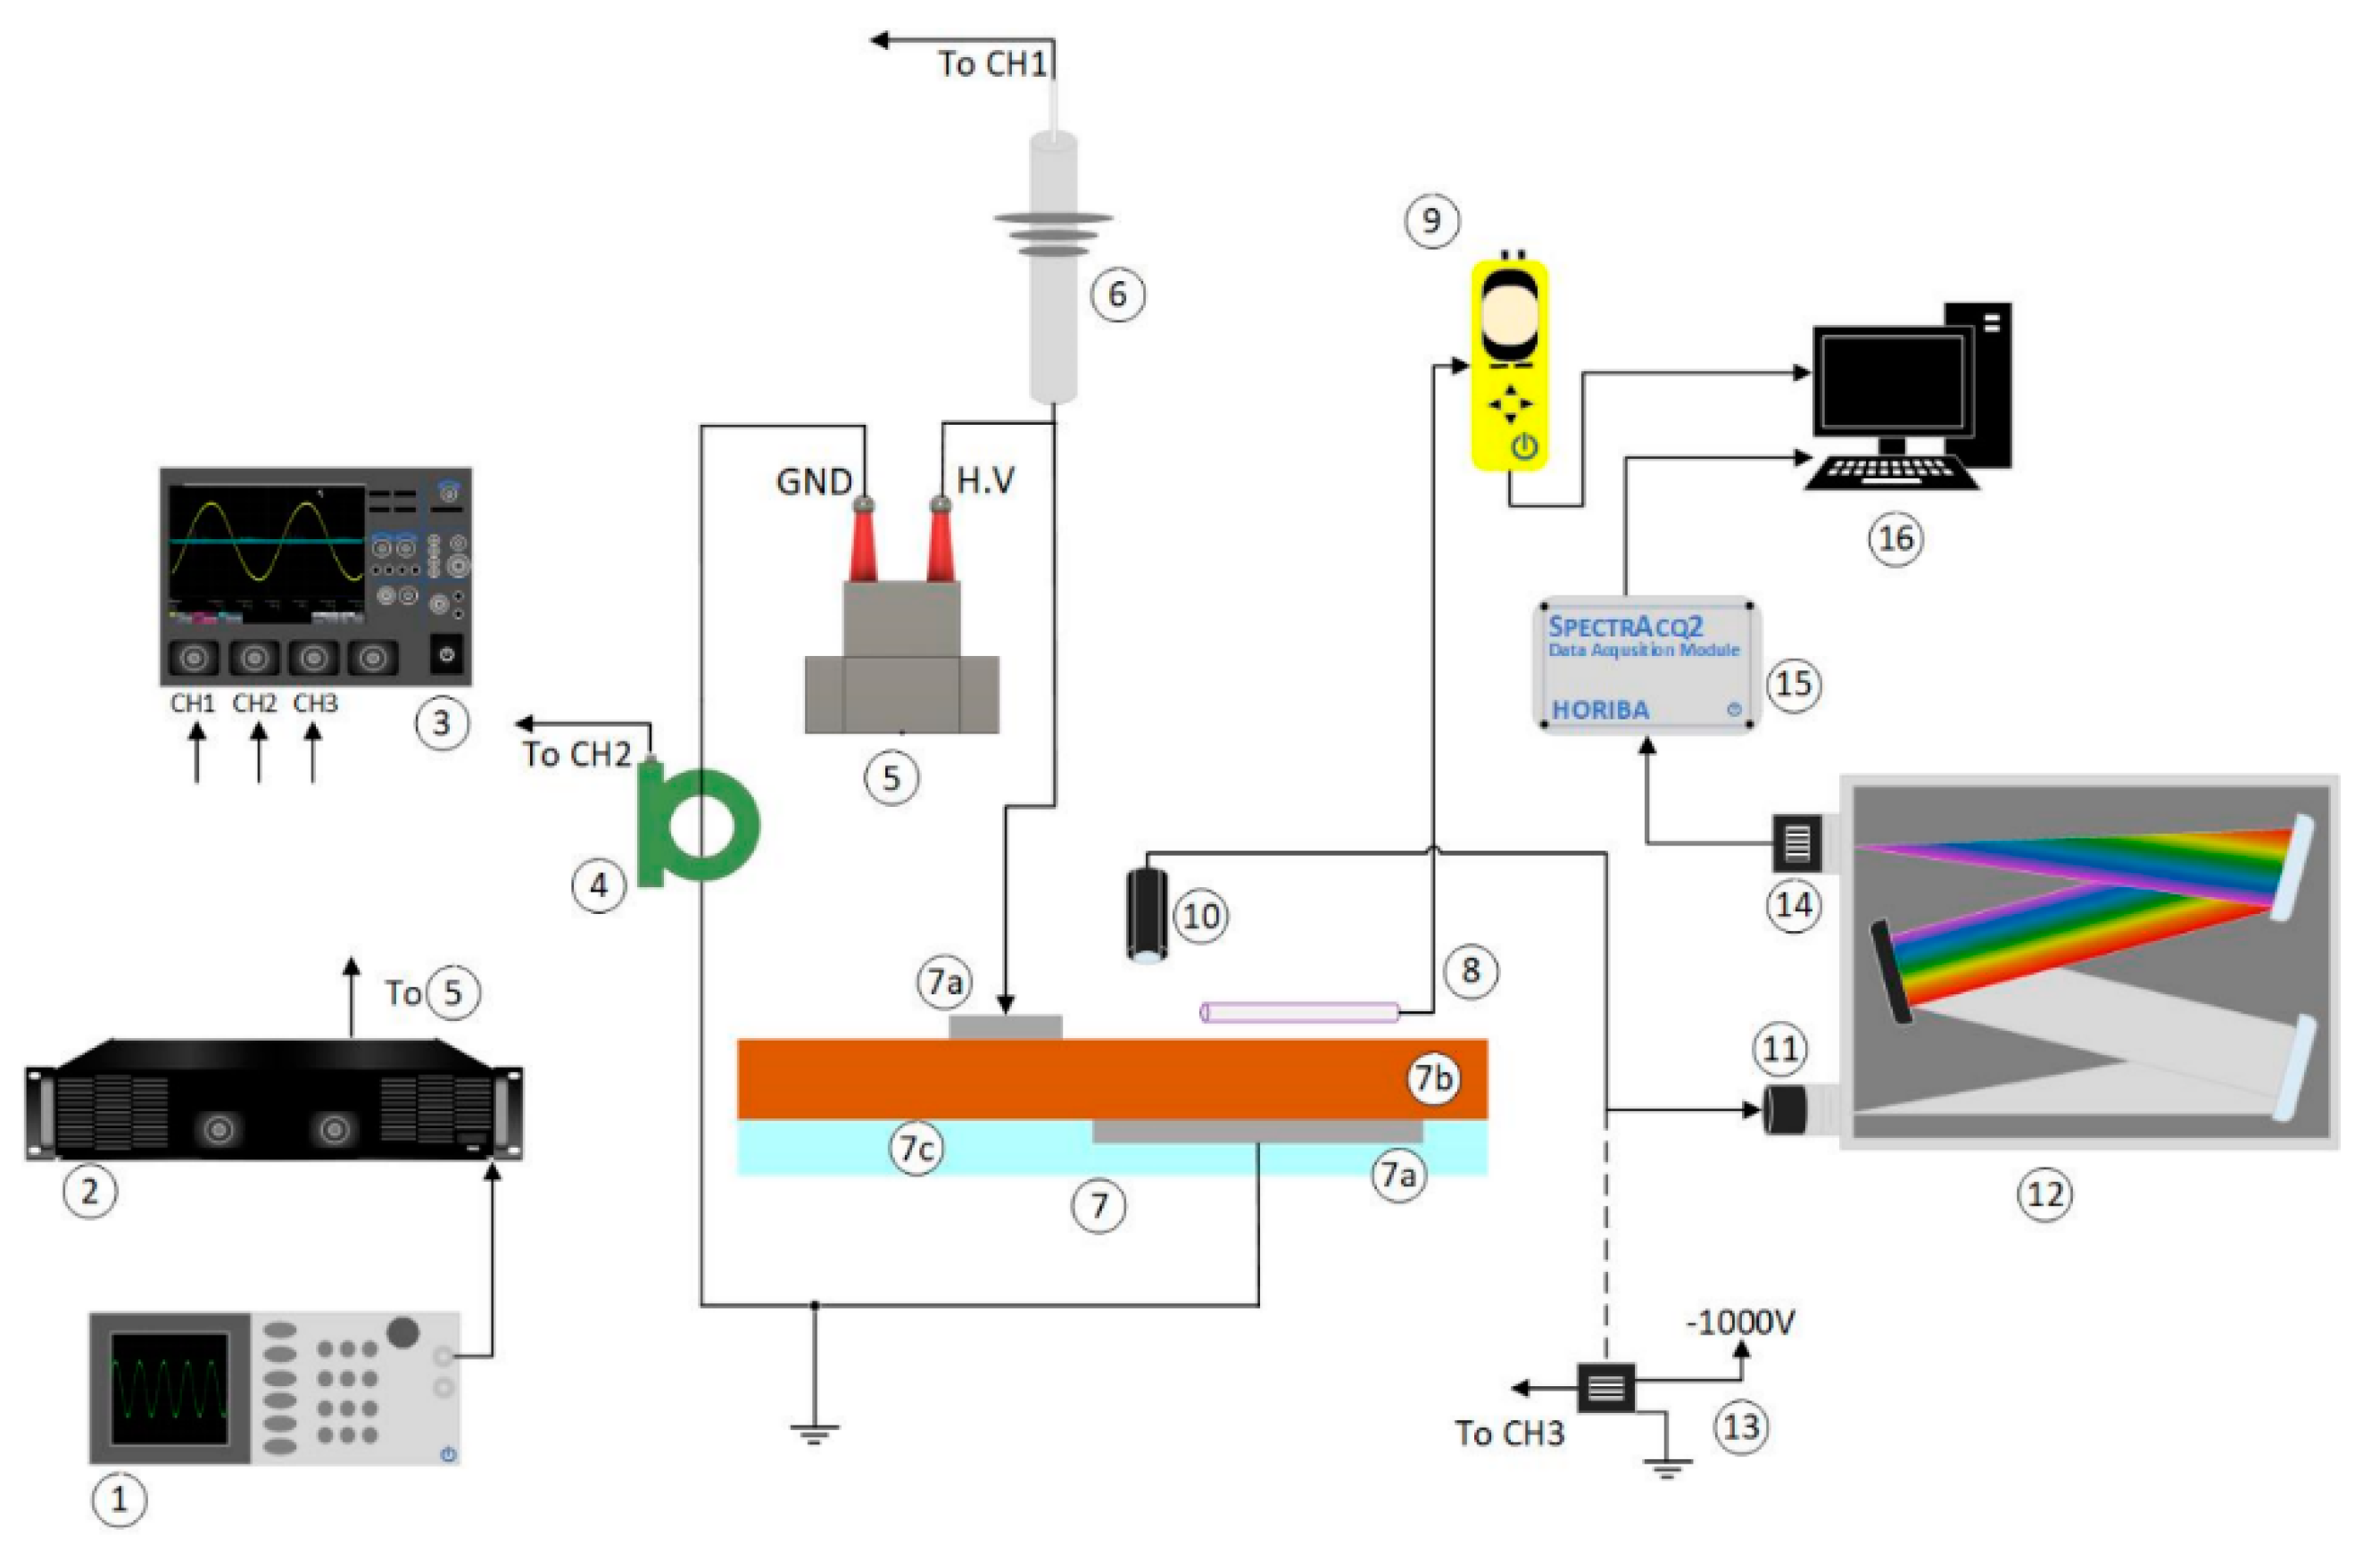
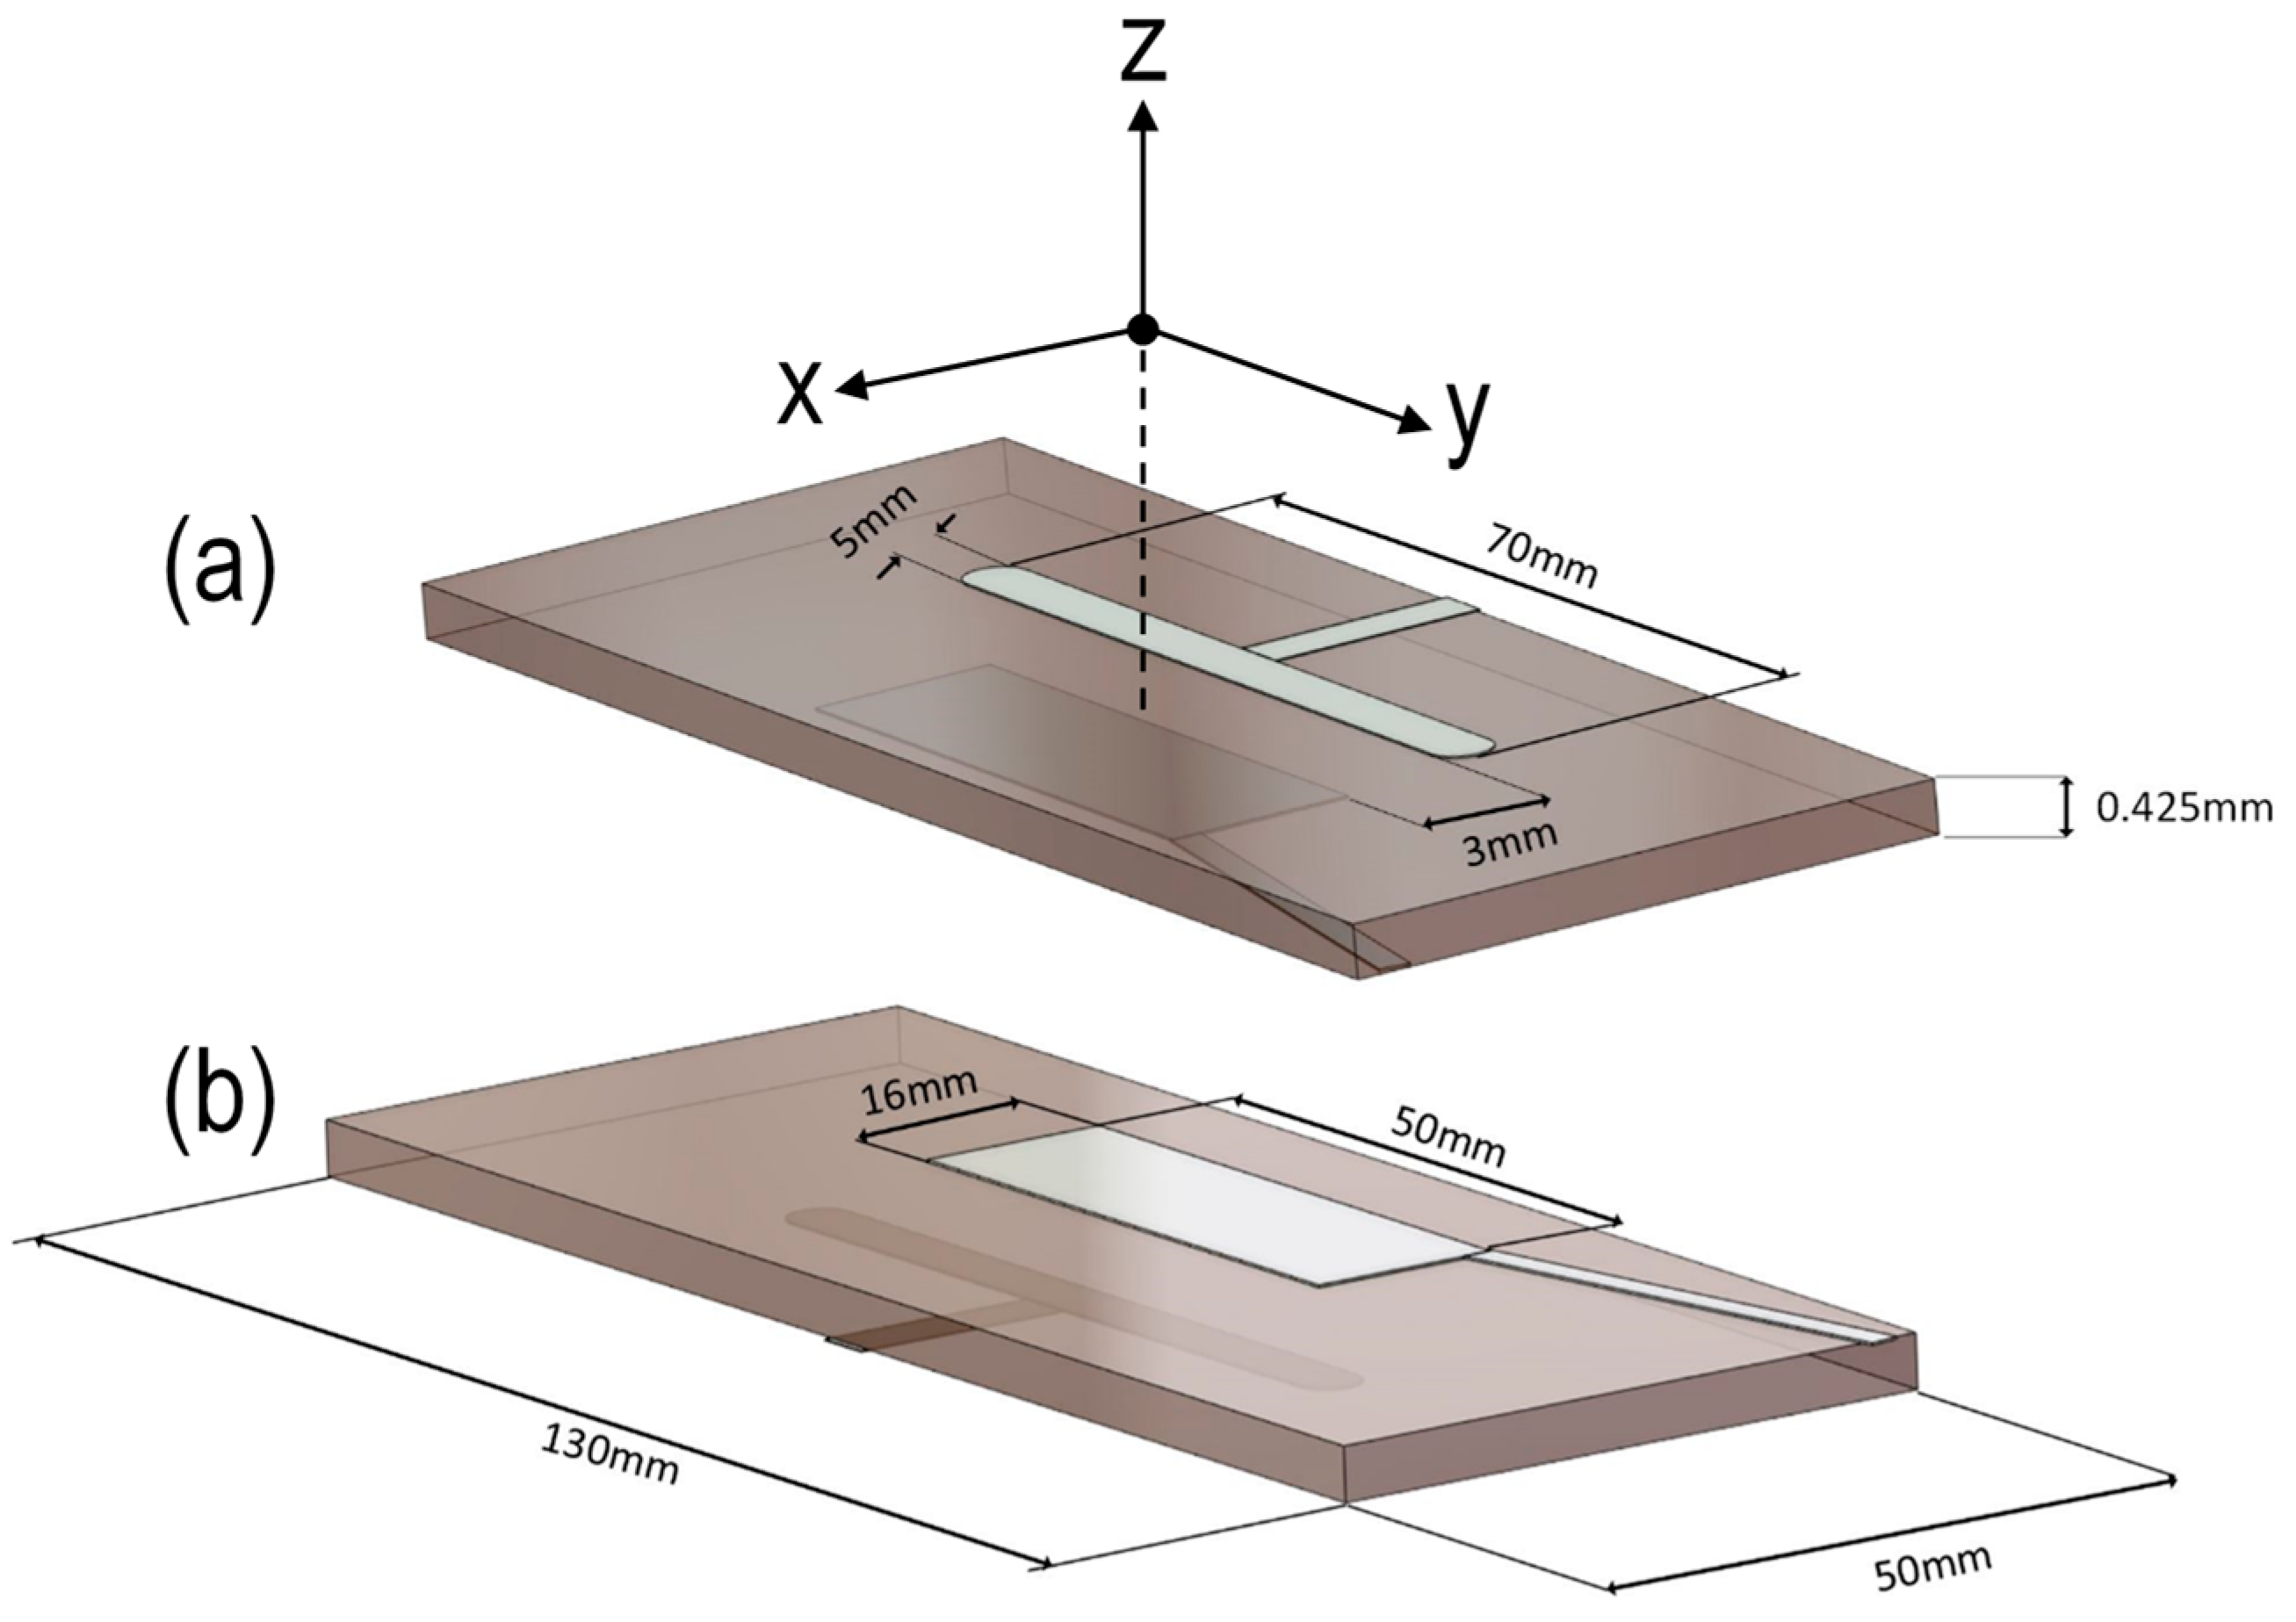
Figure 1 shows the experimental setup, including the plasma actuator itself and the diagnostics employed in the present work. The actuator design is illustrated in detail in
Figure 2. It is an SDBD-based one, with the dielectric barrier to be a stack of Kapton
® polyimide films. The patterns of the electrodes are formed on the polyimide films by means of silver ink (resistivity 100 μΩ cm) and stencils. The grounded electrode is encapsulated within a two-component epoxy resin.
The high voltage is generated by amplifying a reference sinusoidal signal (10 kHz) and supplying the primary winding of a specially designed, ferrite core, step-up transformer. The output high voltage, v(t), is permanently monitored with a passive probe (Tektronix; P6015; DC-75 MHz). The DBD current, i(t), is recorded with a wideband current transformer (Pearson Electronics; 6585; 400 Hz–200 MHz). The wavelength- and space-integrated light, emitted from the plasma, is collected with a high-grade fused silica optical fiber (Newport; 77576; 260–2200 nm), and then, it becomes time-resolved with a photo-electron multiplier tube (PMT; Hamamatsu R928; 185–900 nm). All waveforms are recorded by a four-channel, wideband, digital oscilloscope (LeCroy; WaveRunner 44Xi-A; 400 MHz; 5 GSamples s−1).
The mean electric power consumed by the actuator is calculated by integrating the product [v(t:t + 5T) × i(t:t + 5T)] over five sequential voltage periods, i.e., 5T, and by dividing the result by this factor. The process is repeated for five independent [v(t:t + 5T) × i(t:t + 5T)] products. Two such measurement sets are realized on different dates. Hence, in total, 10 instantaneous power waveforms (5T duration each) are considered for extracting mean values and standard deviations (error bars in the graphs) of the electric power.
The time- and space-integrated light is guided by the abovementioned optical fiber to a monochromator (Jobin Yvon; THR 1000; 170–750 nm; 2400 grooves mm
−1) and the optical emission spectrum is thus identified. The wavelength calibration of this unit is carried out with an Hg (Ar) pencil-style lamp (Newport; 6035). Special attention is paid to calibrating the relative spectral efficiency of the entire optical system. This is accomplished with a quartz-tungsten-halogen lamp (Newport; 6334NS; 250 W) operated at 3400 K. The rotational temperature of principal excited molecular species is estimated by fitting their experimental rotational distributions to the corresponding theoretical ones, using a lab-built software [
22]. In addition, a 0.25 m imaging spectrograph (Newport; MS260i) is used for exploring wider wavelength ranges. It is equipped with two motorized gratings: one holographic (2400 grooves mm
−1; blaze wavelength 250 nm; 180–700 nm) and one ruled (600 grooves mm
−1; blaze wavelength 400 nm; 250–1300 nm). The photodetector of this spectrograph is a linear CCD array (200–1100 nm). Optical matchers are used in both cases (monochromator and spectrograph) for optimal alignment of the fiber image.
The speed of the plasma-induced fluid is recorded in real time with a pitot-like tube (glass capillary tube; Øout = 1.3 mm; Øin = 0.8 mm) and appropriate hardware (Trotec; TA400). Precise, point-specific measurements are allowed due to the tube mounting on a x–y–z linear micro-translation stage.
Finally, flow field patterns are visualized by means of schlieren imaging. The main parts of the system are provided by Edmund Optics®. It contains a high-power green light emitting diode, two aluminized first surface spherical mirrors (152.4 mm in diameter, 1524 mm focal length and 1/8 wave surface accuracy) overcoated with silicon monoxide, and two Foucault knife edge testers mounted on separate micro-translator stages (one horizontal and one vertical). The components are arranged in a Z–type configuration. A camera (Nikon; D3300) is added to the system enabling photographic records. The camera is equipped with a zoom lens (Canon; FD 70–210 mm). The settings for the schlieren photos are ISO 400, exposure time 1/4000 s, and f-number 4. The settings for the conventional photos of the plasma are ISO 6400, f-number 5.6, and 1/30 s at 14 kVpp and 1/40 s at 16 kVpp (“kVpp” stands for kV peak-to-peak).
3. Results and Discussion
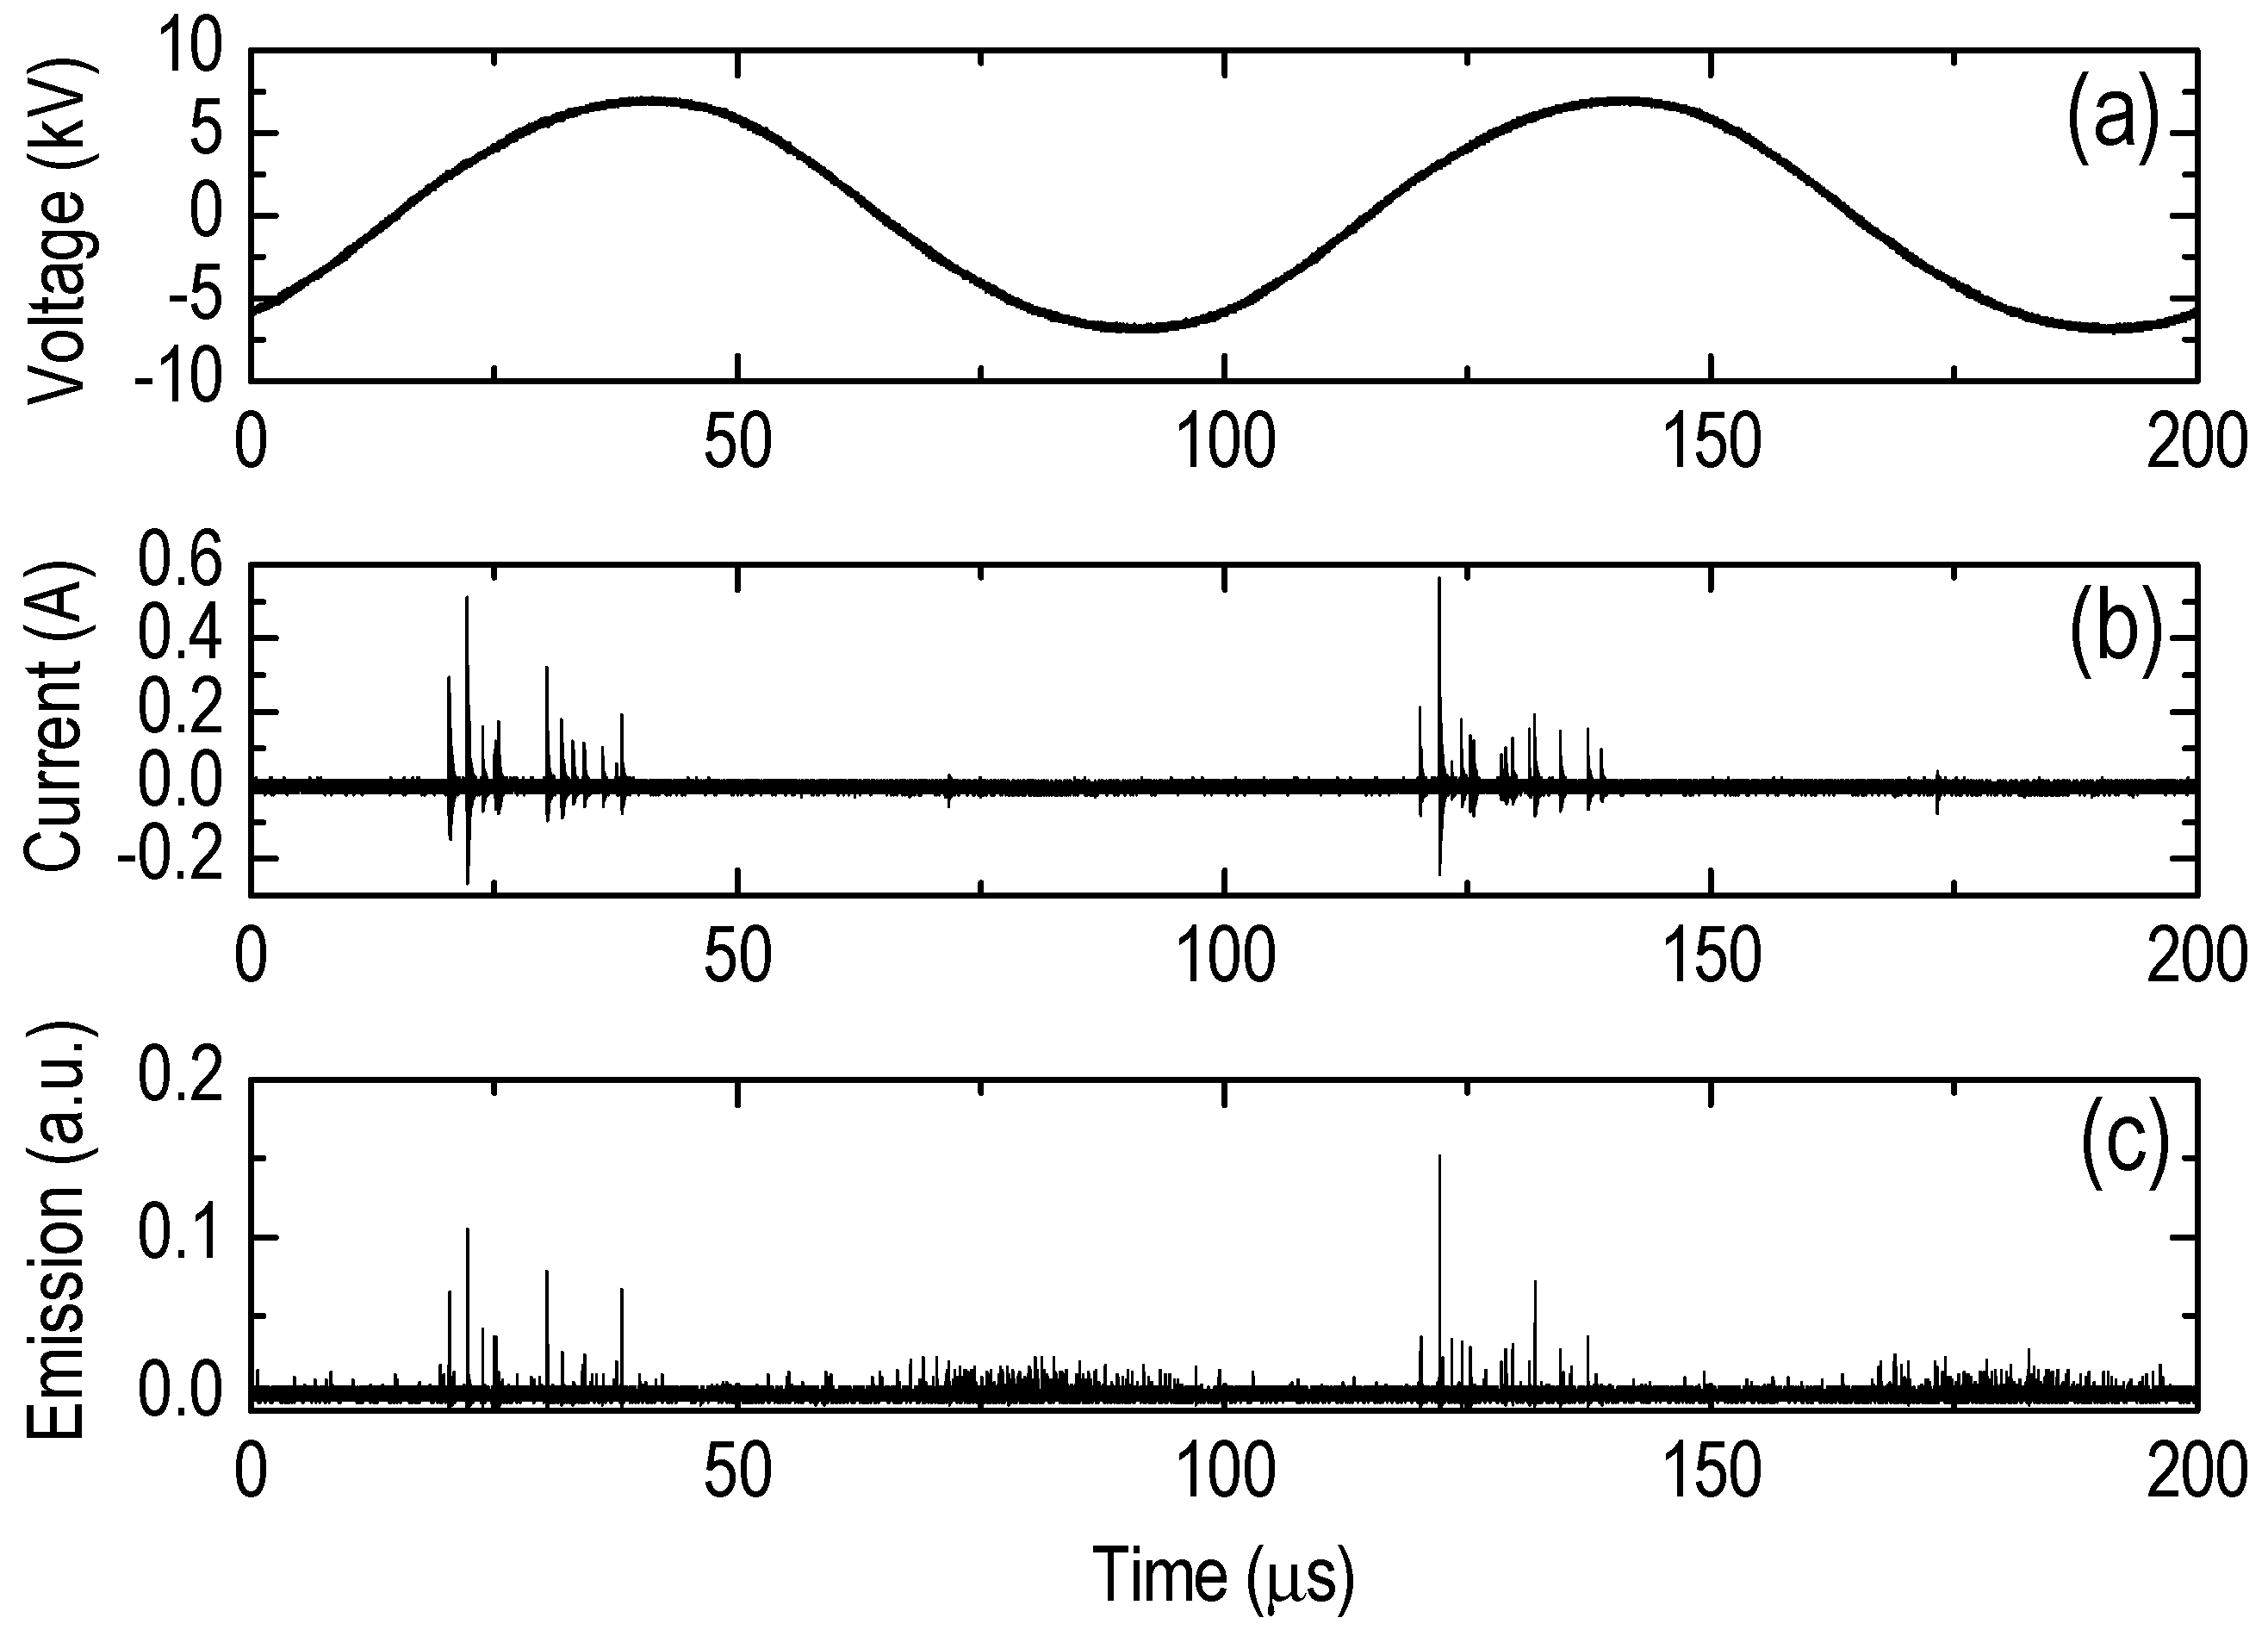
Figure 3a–c provide representative oscillograms of the actuator driving voltage, DBD current, and plasma emission integrated over ultraviolet-near infrared (UV–NIR) wavelengths, respectively. Clearly, the main ionization and excitation processes are related to the rising part of the driving voltage, whereas much weaker current and emission are observed during the falling part. This fact has been mentioned and studied extensively in other DBD-based setups, showing that the propagation of cathode- and anode-directed streamers is involved [
23].
During the rising part of the voltage, primary electrons propagate towards the anode, promoting ionization and excitation processes. The qualitative similarity between the current and emission impulses (
Figure 3b,c) is underlined. At the same time, the resultant heavy positive ions are accelerated towards the dielectric-covered cathode, transferring momentum and energy to the surrounding air molecules, leading eventually to the flow field patterns that are illustrated below. On the other hand, during the falling part of the voltage, we probably deal with anode-directed streamers. According to this assumption, since the exposed electrode is now negatively driven, electrons are repealed towards the dielectric-covered electrode. They are following the field lines and diverging from each other giving a diffused and weaker excitation.
The impulsive form of the current (
Figure 3b) and the optical emission (
Figure 3c) are in accordance with the conventional photographs of the DBD pattern shown in
Figure 4. The induced plasma is associated with filamentary DBDs. The number and the electron density of the filaments along the flat electrodes increase for higher voltage amplitude, but a homogeneous glow discharge is never reached with the voltage amplitudes used here. It is considered that the electric field is quite elevated due to the electrode design (thickness of a few micrometers only). Thus, important fluid perturbations are anticipated because of electrohydrodynamic forces [
2,
24,
25,
26]. Schlieren images are in line with this statement (discussed later).
Based on the above observations, it becomes apparent that the power is principally delivered to the actuator during the positive cycle of the driving voltage.
Figure 5 shows that, under the present experimental conditions, the actuator consumes a mean power of less than 10 W. An increase at the voltage amplitude of just 2 kV
pp leads to power doubling (
Figure 5a versus
Figure 5b). However, the consumption remains practically unchanged over at least 24 h of operation (accumulative). The latter is an implication of a quite reliable actuator.
However, despite the consistency of the actuator in terms of power consumption, both dielectric and electrode degradation are observed as the operation time accumulates.
Figure 6 demonstrates this aging effect, as it is exhibited on the top surface of the actuator. The photo in
Figure 6b refers to 24 h of accumulative operation and the worst-case stress scenario (i.e., 16 kV
pp). The actuator of
Figure 6b remains functional, but the quantification of its material degradation and its possible efficiency deterioration might be the task of another study.
A better insight into the species contributing to the plasma-induced flow field may be gained by the OES spectrum of
Figure 7a. Although a much wider wavelength range has been examined (see
Section 2 for grating specifications), only N
2(SPS) and
(FNS), shown in
Figure 7a, are detectable. The identification is organized in
Table 1. Interestingly, with regard to ionic species, the nitrogen molecular ion is solely observable, and despite its weak relative spectral emission, its role in the flow field formation is emphasized. Otherwise, the spectrum is mainly populated by excited nitrogen molecules, whereas species such as NO
γ, OH, and N
2(FPS) are not detected.
Furthermore, high-resolution spectra can give the patterns of the rotational distributions of excited molecules, which thus serve as probe molecules for the gas temperature evaluation. In
Figure 7b, the rotational distribution of the N
2 (SPS) species (337.13 nm in
Table 1) is presented, being determined both experimentally and numerically. The numerical fitting of the latter to the former implies a gas temperature up to around 410 K at the maximum applied voltage (16 kV
pp). Further experiments have given values around 318 K at 12 kV
pp and 336 K at 14 kV
pp. Apart from the positive ions, the role of this rather elevated temperature in the flow field pattern should also be considered. This remark becomes more critical if one considers the local temperature, which is expected to be higher than the average one measured here. The term “local” means the temperature within specific elementary volumes of the plasma, contrary to the integrated emissive volume probed here (see the caption of
Figure 7). In the frame of this work, the relative contribution of each factor, i.e., ions versus temperature, to the flow field modifications cannot be conclusive, but this topic remains challenging (see the further discussion below based on the schlieren imaging results).
Figure 8 presents the point-specific speed of the fluid over the actuator surface (z = 0.75 mm; y = 0 mm) at various positions far away from the discharge gap (x = 8, 18, and 24 mm) versus the time. These graphs unveil the variation in the speed that may take place as a function of the space coordinates and the time elapsed. Speed fluctuations are highly pronounced at longer distances from the discharge gap and they almost fade as the gap is approached (sequence
Figure 8c →
Figure 8b →
Figure 8a). It is thus suggested that a transition from laminar to turbulent flow takes place along the x direction, even if we remain close to the surface of the actuator.
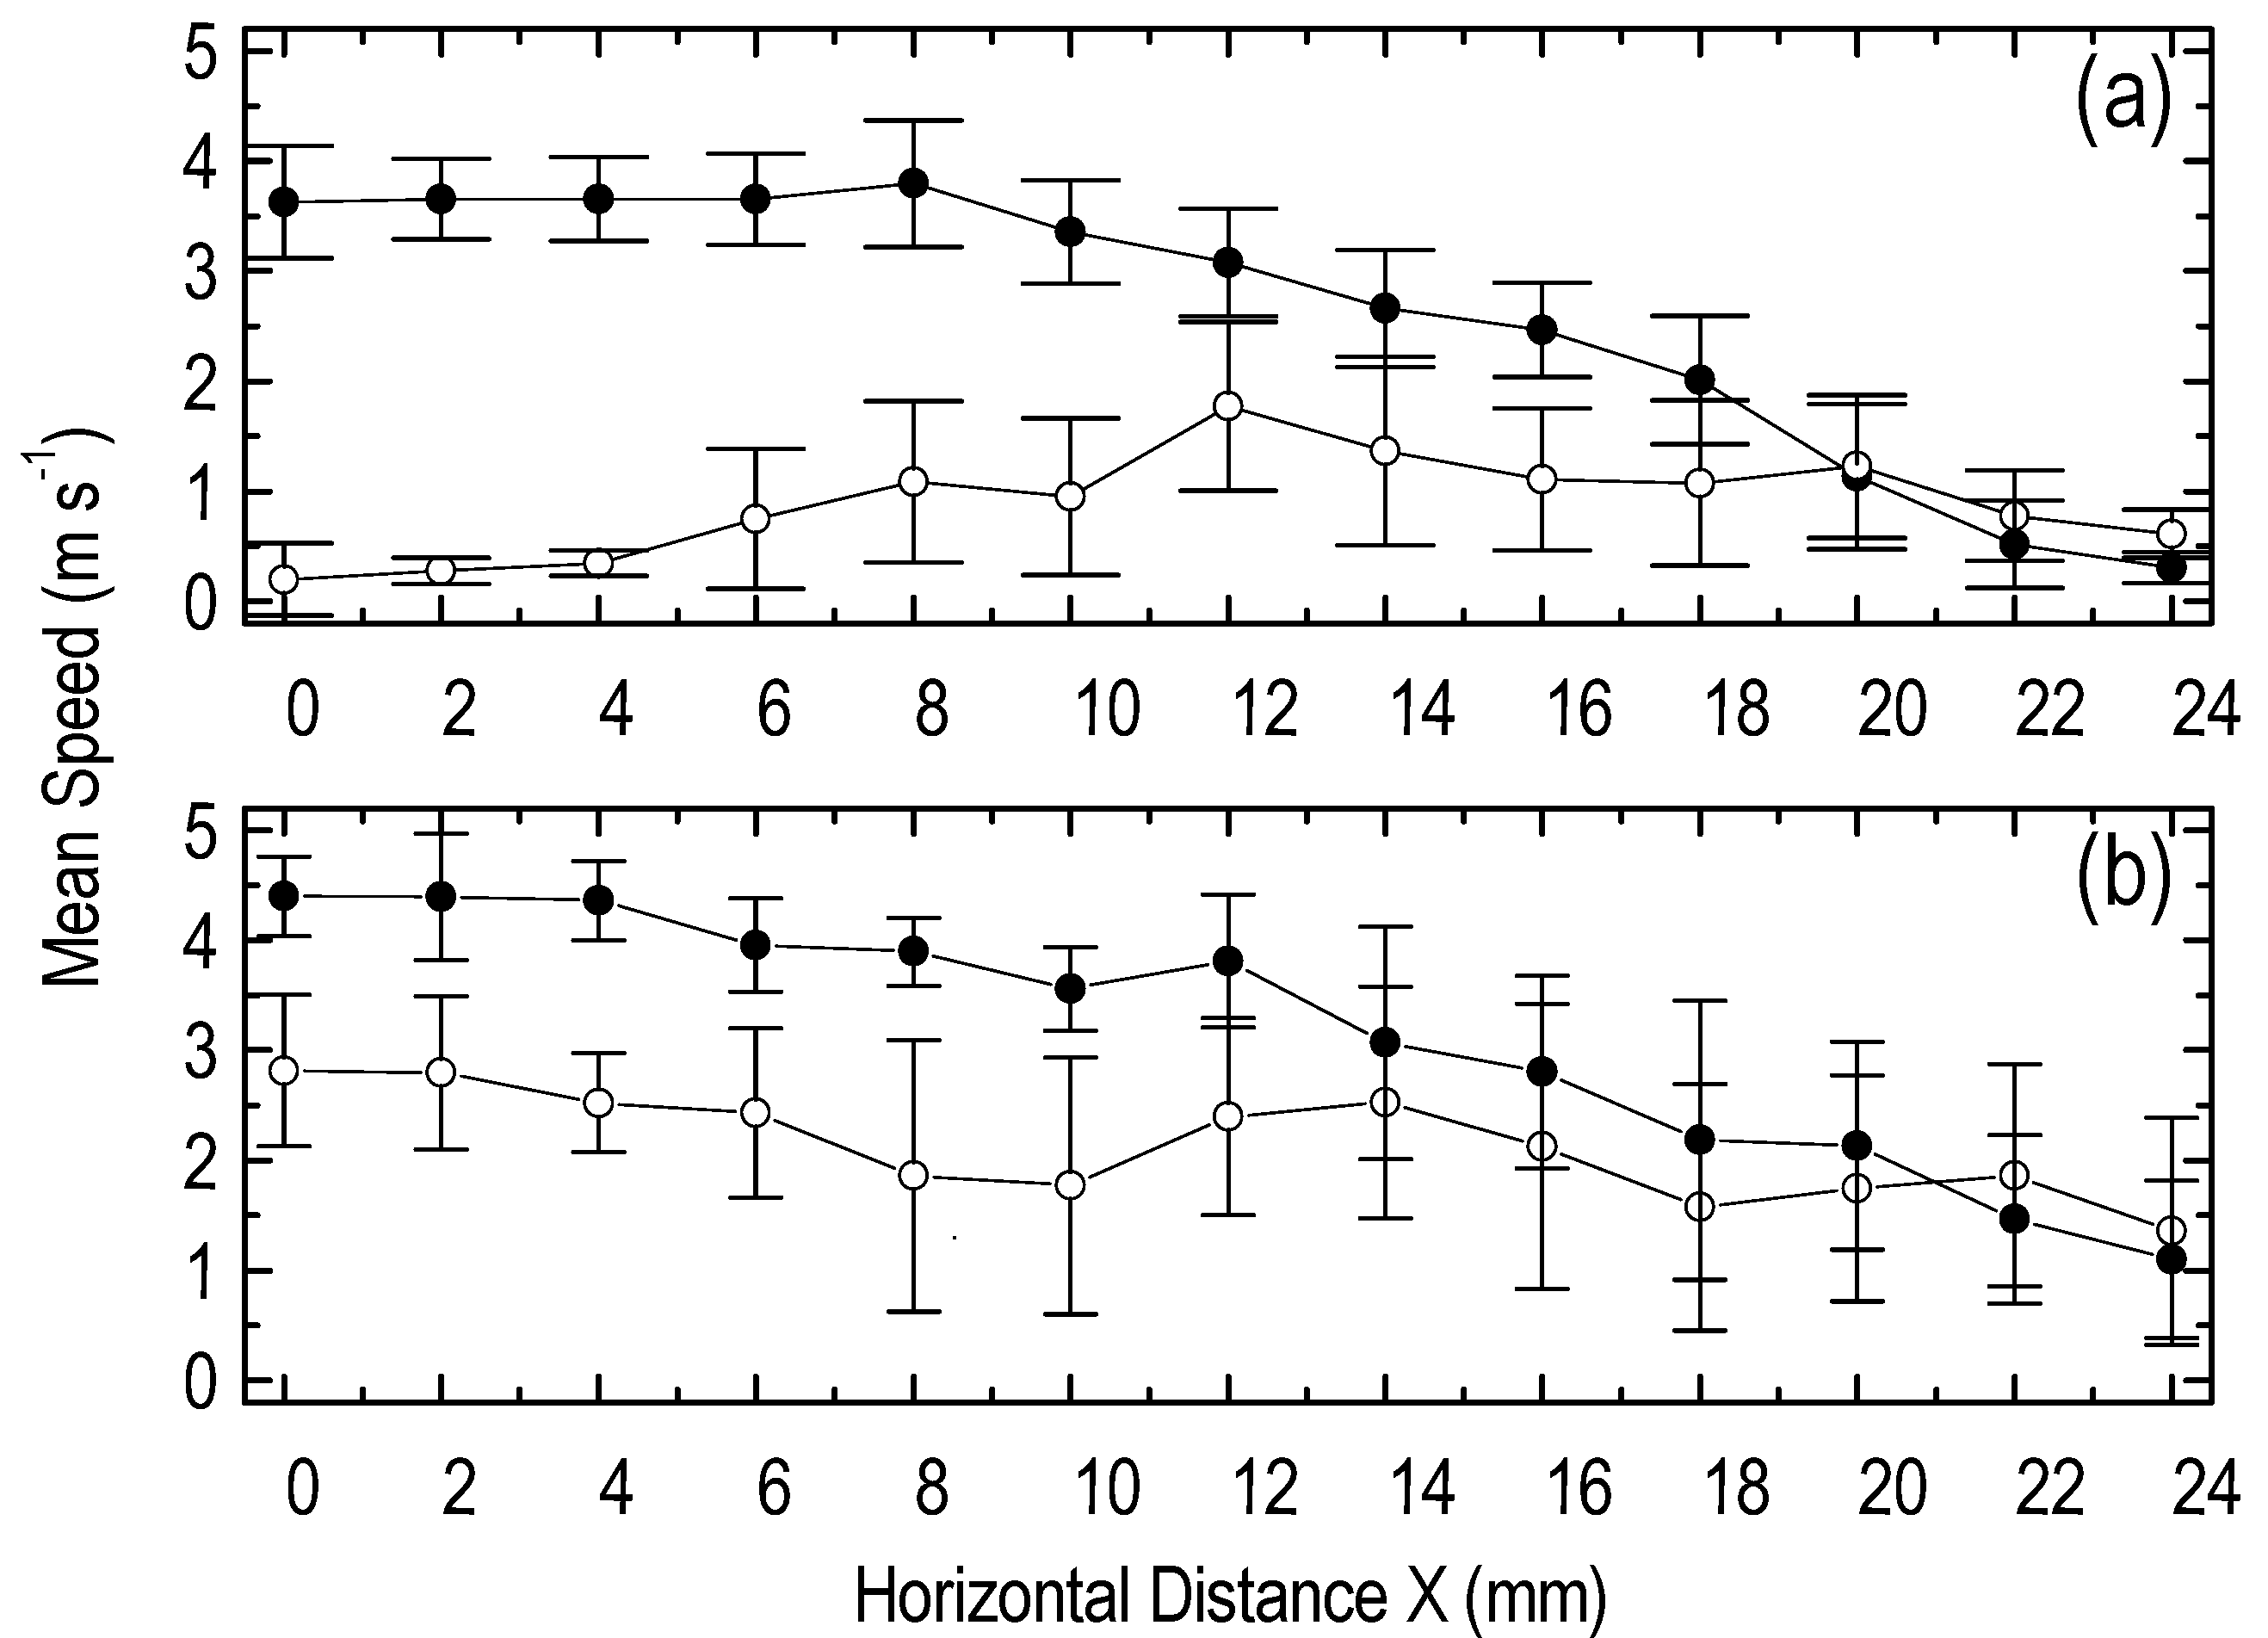
Based on time-resolved speed graphs such as those of
Figure 8, the mean speed is calculated from each 300 s graph, and the 2D distribution (xz-plane) of the gas mean speed is mapped as in
Figure 9 (y = 0). As regards the fluid speed close to the actuator surface (z = 0.75 mm; solid symbols in graphs), an increased speed is measured close to the discharge gap (x = 0 mm), whereas it decays monotonously along longer distances (up to x = 24 mm). This trend persists independently of the applied voltage amplitude. However, at 16 kV
pp (
Figure 9b), a slightly higher speed is achieved compared with that at 14 kV
pp (
Figure 9a). On the other hand, an abrupt decrease in the speed is observed at an almost double distance from the actuator surface (z = 1.4 mm; open symbols in graphs), and this is more noticeable when the actuator is driven by a lower voltage (
Figure 9a). Another remarkable fact is the increased values of the standard deviations (error bars) calculated in the case of z = 1.4 mm compared with those found for the measurements closer to the surface (z = 0.75 mm). This fact should not be attributed to experimental uncertainties but, as it is mentioned above, it is rather related to the transition from a laminar flow layer to a turbulent phase. The subtleties of this assumption are considered below along with the schlieren imaging results.
The vertical (i.e., along the
z-axis) variation in the mean speed for two representative positions behind the discharge gap is plotted in
Figure 10. In both cases, i.e., x = 4 mm and x = 12 mm, as the actuator surface is approached, the fluid speed increases constantly, whereas it becomes negligible at a vertical distance z = 1.5–2 mm. Comparing
Figure 10a,b, the turbulent nature of the flow as we move behind the discharge gap is mirrored in the increasing standard deviation values, similarly to what is implied by the data in
Figure 8.
A direct comparison of the above measured parameters with the corresponding values appearing in the bibliography does not make sense since an identical plasma actuator operating at the same conditions has not been evaluated earlier. Nevertheless, we can appose indicative information from experiments on SDBD plasma actuators in terms of fluid speed, electrical features, electrode dimensions, etc. For an actuator with both electrodes exposed (Al tapes of 200 mm length, 5 mm width, and 0.1 mm thickness), a 2 mm PMMA barrier, an electrode gap equal to 5 mm, and a sinusoidal (700 Hz) driving voltage at 40 kV
pp, a maximum speed of about 4.5 m s
−1 has been noted [
27]. In the same work, an electrode width of 20 mm, an electrode gap of 0 mm, a frequency of 1.5 kHz, and a voltage of 40 kV
pp led to a maximum speed of about 6.5 m s
−1. In another case [
4], where a 300 mm long actuator consisting of 0.1 mm thickness Kapton
® barrier, 12.7 mm wide covered grounded electrode, and 6.35 mm wide exposed high-voltage electrode were used, the time-averaged consumed power was reported to be less than 0.3 W mm
−1 when the actuator was driven by short nanosecond pulses at frequencies less than 3 kHz and typical peak voltage at 16 kV. The velocity field generated in still air gave ensemble-averaged speed values up to 0.5 m s
−1, 20 mm downstream of the discharge for repetition frequency 2 kHz. In a last instance [
28], a 0.15 mm thick Kapton
® barrier, a 0.025 mm thick copper foil, and a 12.7 mm wide exposed electrode were employed. For a 24 mm wide insulated lower electrode and 16 kV
pp triangular (5 kHz) high voltage, a maximum fluid speed between 2.5 and 3 m s
−1 was recorded.
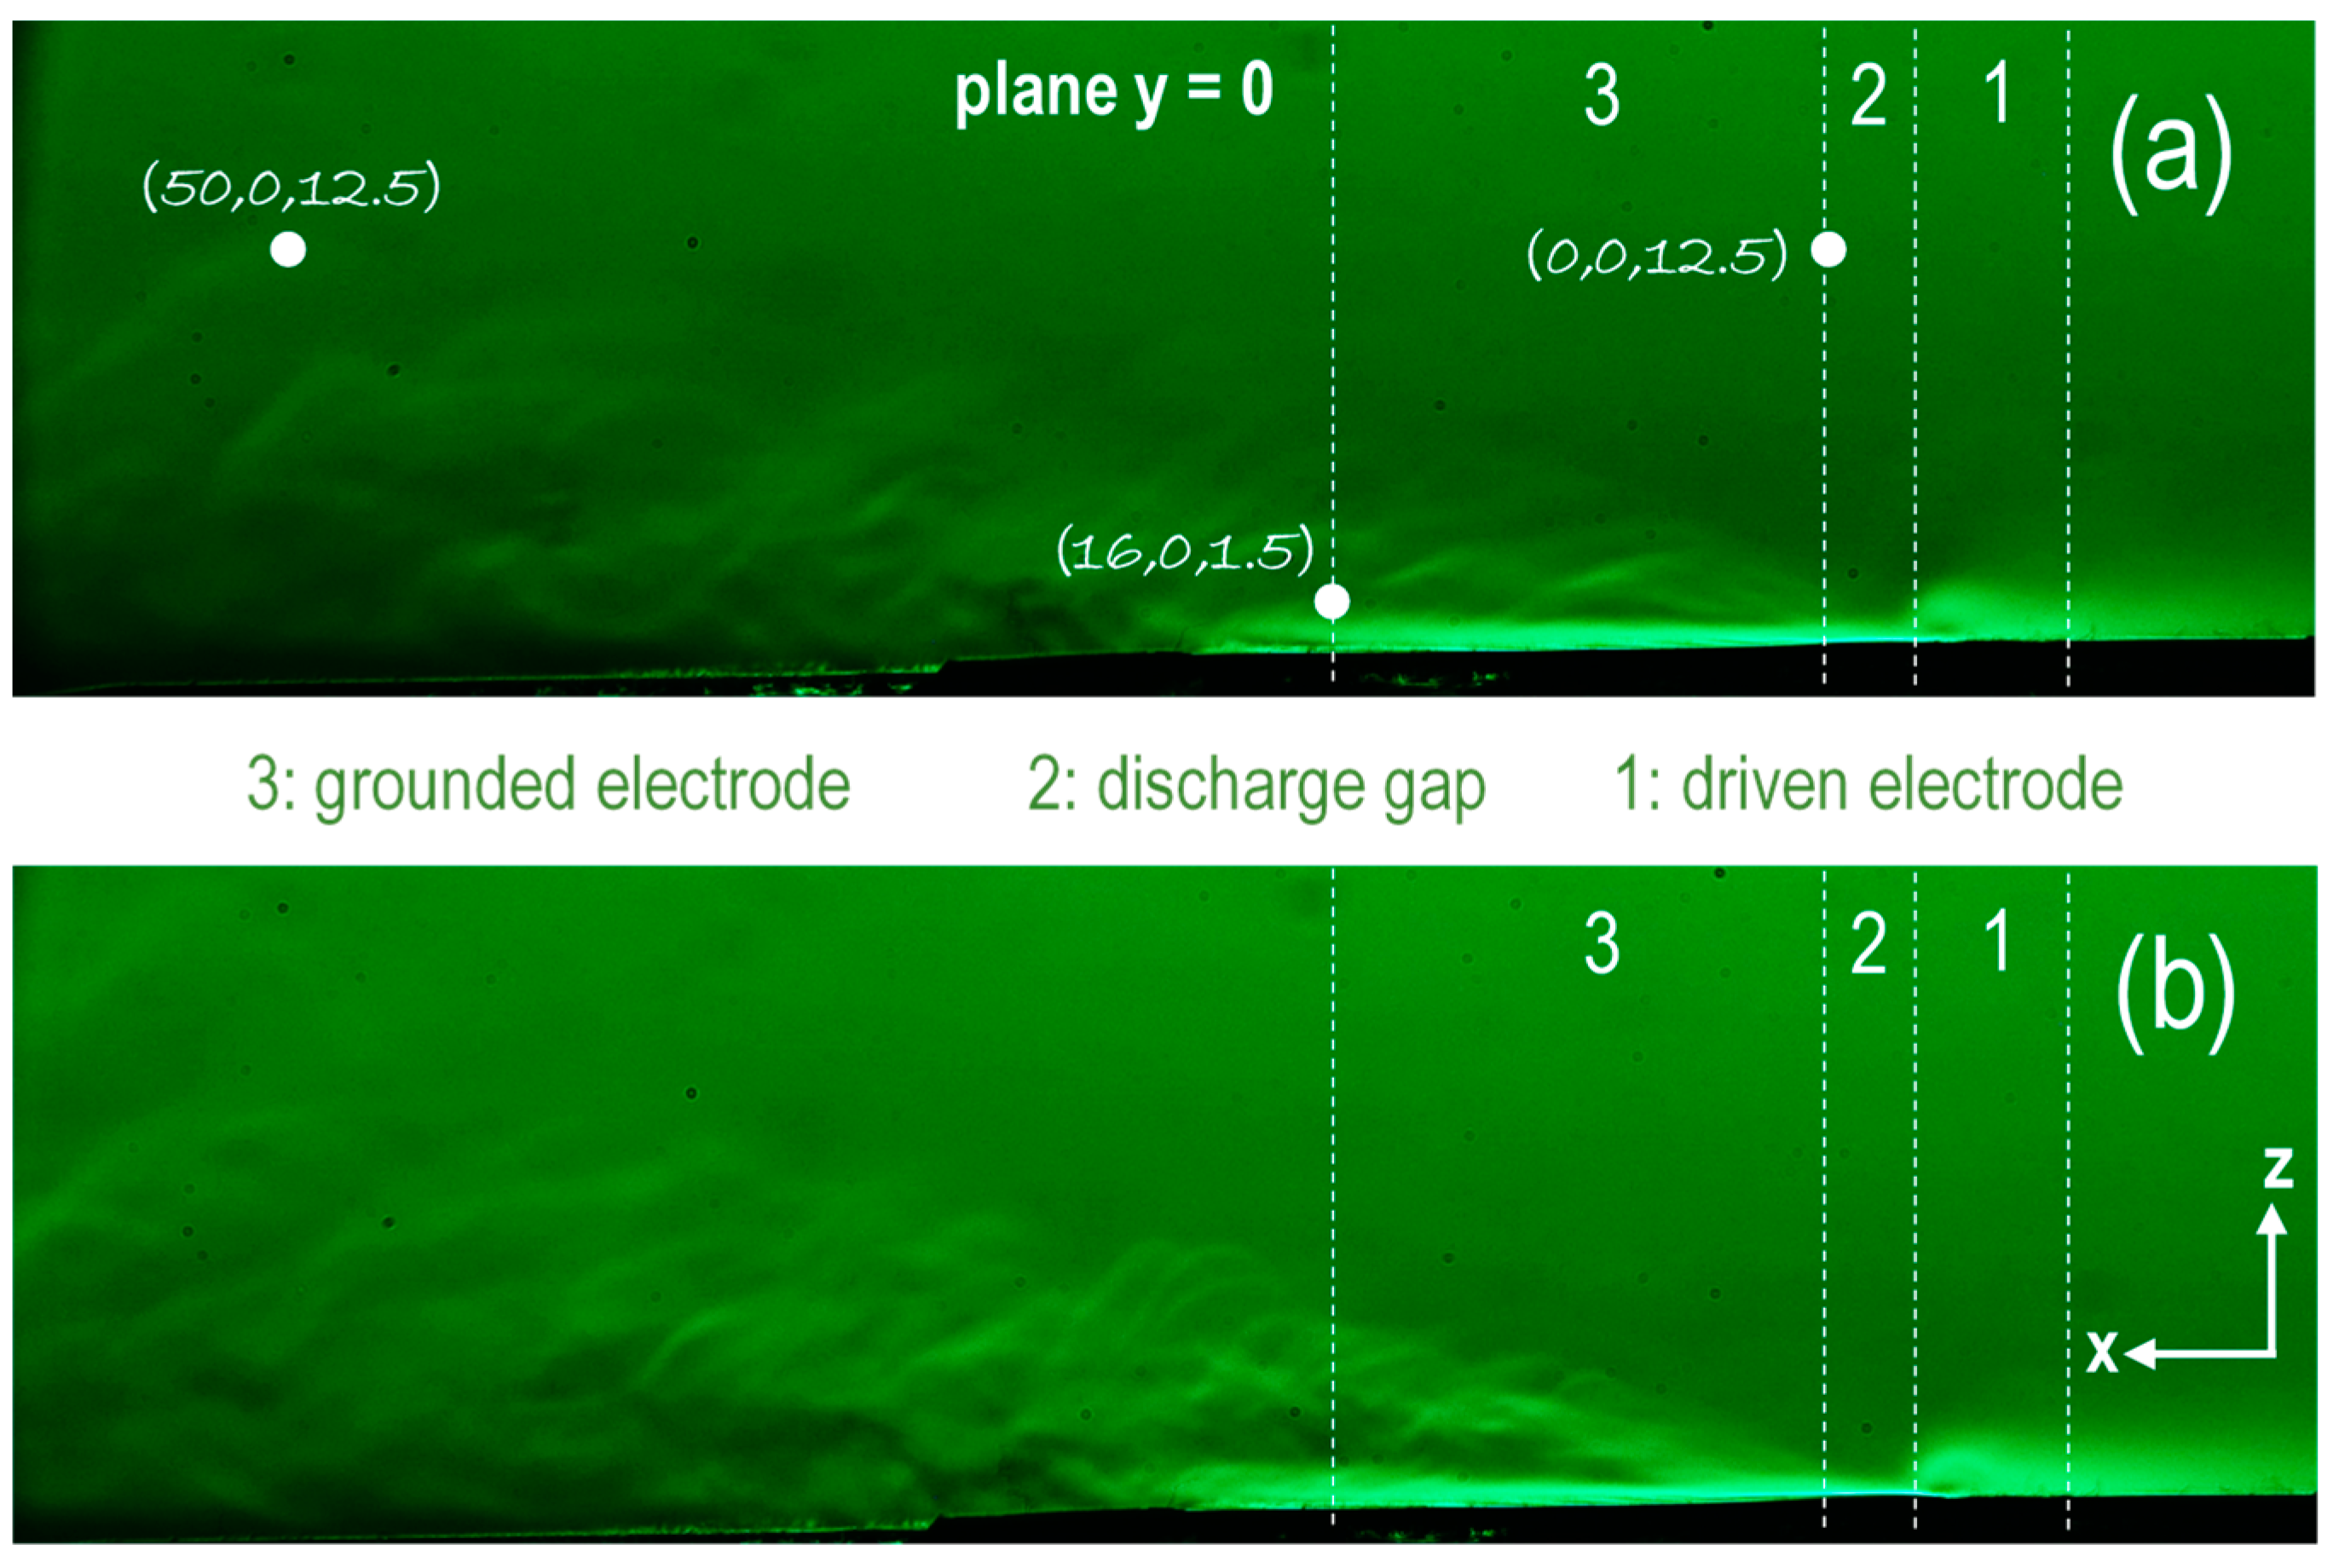
Regarding the present actuator, the above speed plots provide a reasonable picture of the flow field pattern within the 2D space. This picture is validated by the schlieren images of
Figure 11. It is noticed that schlieren images, unavoidably, correspond to side-on snapshots (xz-plane). This may point to an integration of optical events along the Y direction and their projection onto the xz-plane. However, following this angle, three different regions and regimes of flow field are readily distinguished. The first region (1) refers to the area above the high-voltage-driven electrode. This area is associated with an eddy-like flow field, which appears concentrated on the electrode edge adjacent to the discharge gap. The second region (2) is the interelectrode one, i.e., the gap itself, where a laminar flow well bounded onto the actuator surface is established. The thickness of this layer is approximately 1 mm. The third region (3) is the extended area above the grounded electrode, where the boundary laminar layer continues to propagate onto the surface. Nonetheless, it becomes progressively thicker along the
x-axis, and a clear transition to intense perturbated (turbulent) flow field is observed along the
z-axis. In addition, it tends to bend upwards as it approaches the end of the grounded electrode, resembling the separation effect. The perturbated field occupies more and more space as the distance along the
x- or/and
z-axis increases. This result is reflected in the speed and standard deviation values discussed above. The distinction of the three areas holds true for both voltage amplitudes in
Figure 11. Nevertheless, the 16 kV
pp case promotes more intense perturbations.
Lastly, the flow field perturbations induced by the actuator propagate to long distances, even behind the grounded electrode. The snapshots of
Figure 11 unveil perturbations far away from (i) the grounded electrode left edge (up to about 60 mm on the
x-axis) and (ii) the electrode plane (up to about 20 mm on the
z-axis). Such an intense directed motion of neutrals should be attributed to collisions with ions drifting into high local electric fields. The extremely thin electrodes were painted on the dielectric point to electric field enhancement as a dominant factor determining the effectiveness of momentum coupling into the surrounding air [
28]. The role of temperature remains ambiguous even after the present results. However, similar electrohydrodynamic and thermal effects have been extensively studied by our group numerically [
24,
25,
26,
29], and the adaptation of the available numerical models to the present actuator case is in progress.


 ,
, 


