
Cooperative Visual Augmentation Algorithm of Intelligent Vehicle Based on Inter-Vehicle Image Fusion


Abstract
:1. Introduction
- (1)
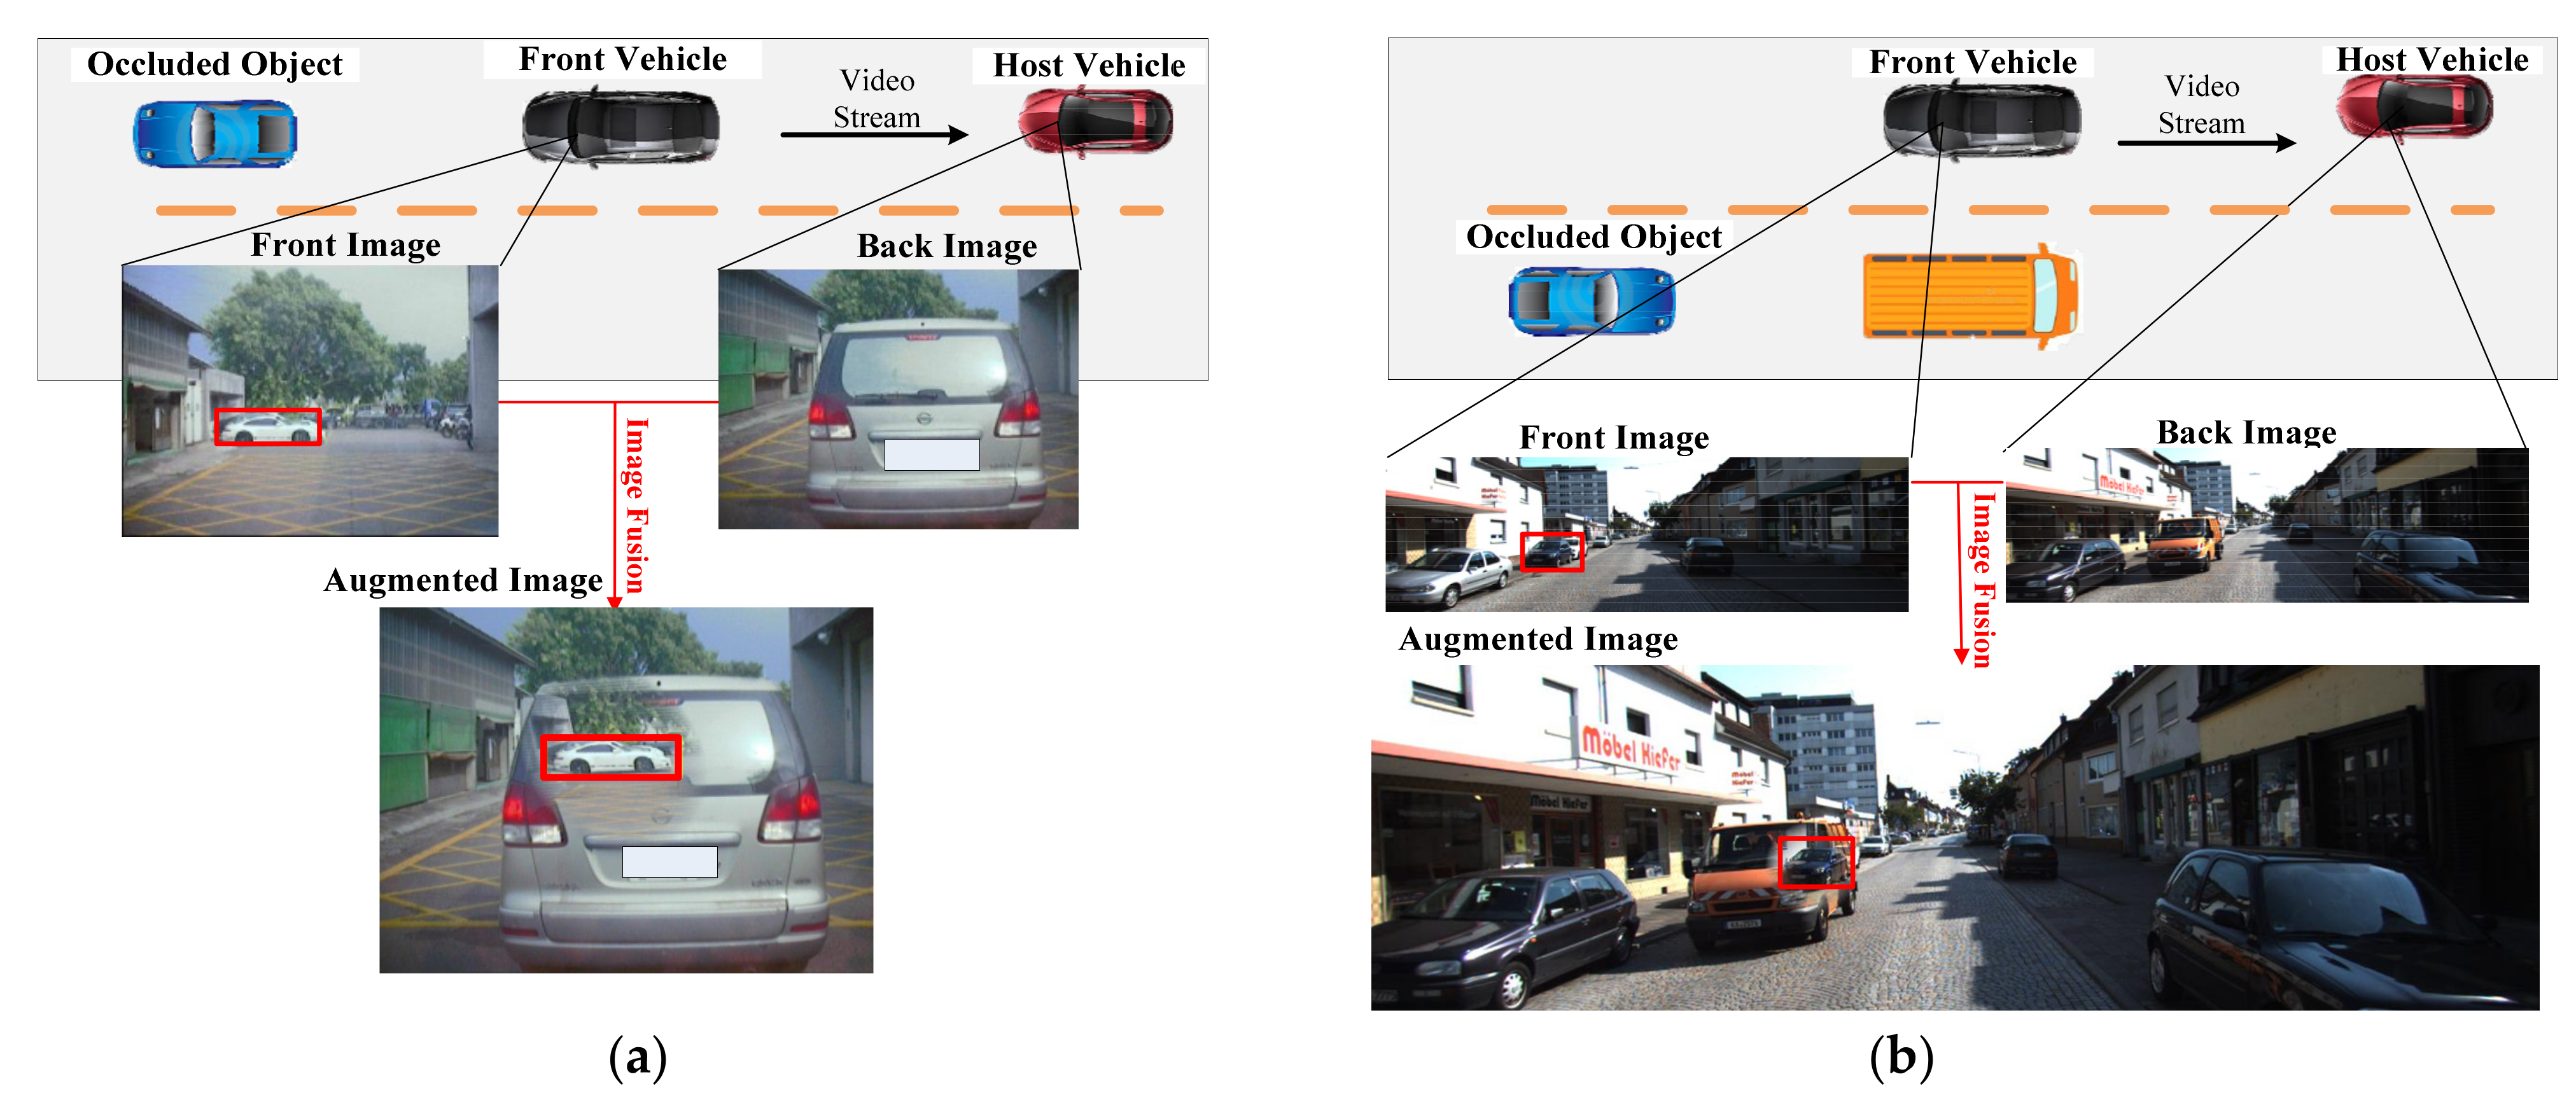
- A new collaborative visual augmentation method to eliminate blind spots is proposed. Our method can extend the visual perception ability of the driver or autonomous driving system to the obstacle area by fusing images from forward vehicles.
- (2)
- We also propose a deep-affine transformation to realize the visual fusing. Depth information and geometric constrains are introduced to optimize the affine matrix parameters.
- (3)
- We improve the results of the visual augmented method by projecting occluded objects onto host vehicle images. KITTI data are used as the evaluation dataset.
2. Architecture of Cooperative Visual Augmentation Algorithm
3. Implementation
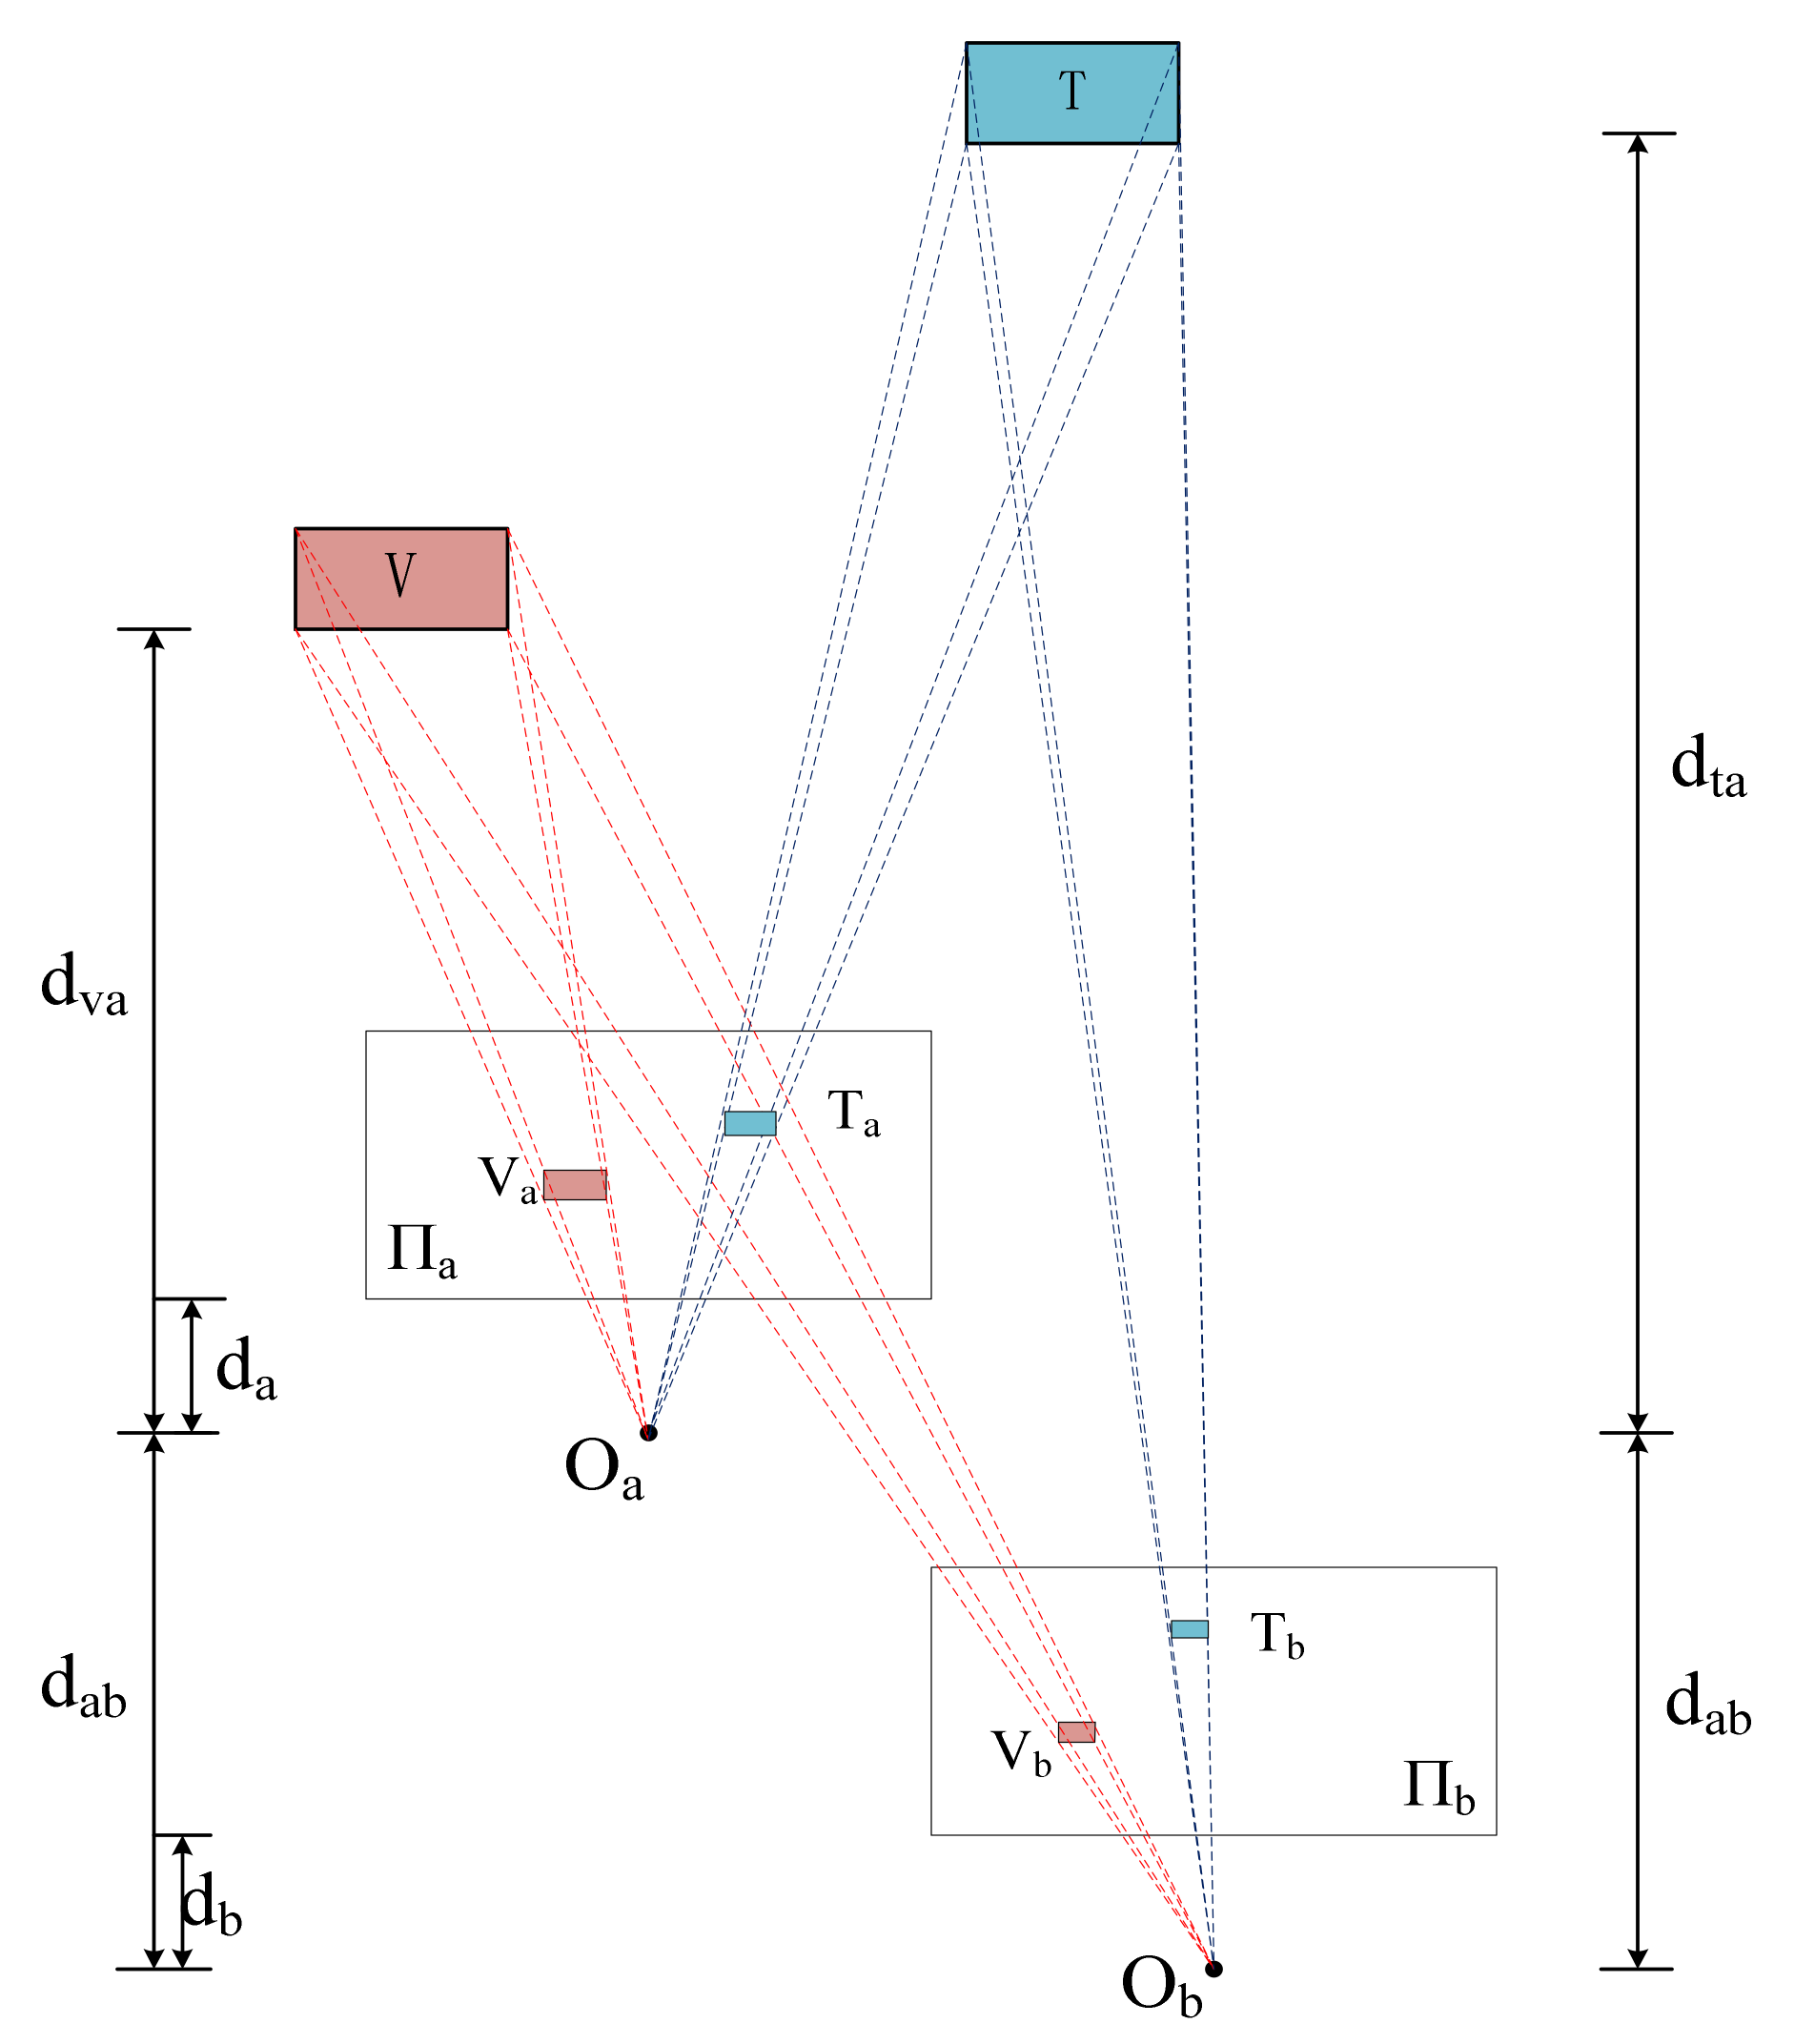
3.1. The 3D Inter-Vehicle Projection Model
- (1)
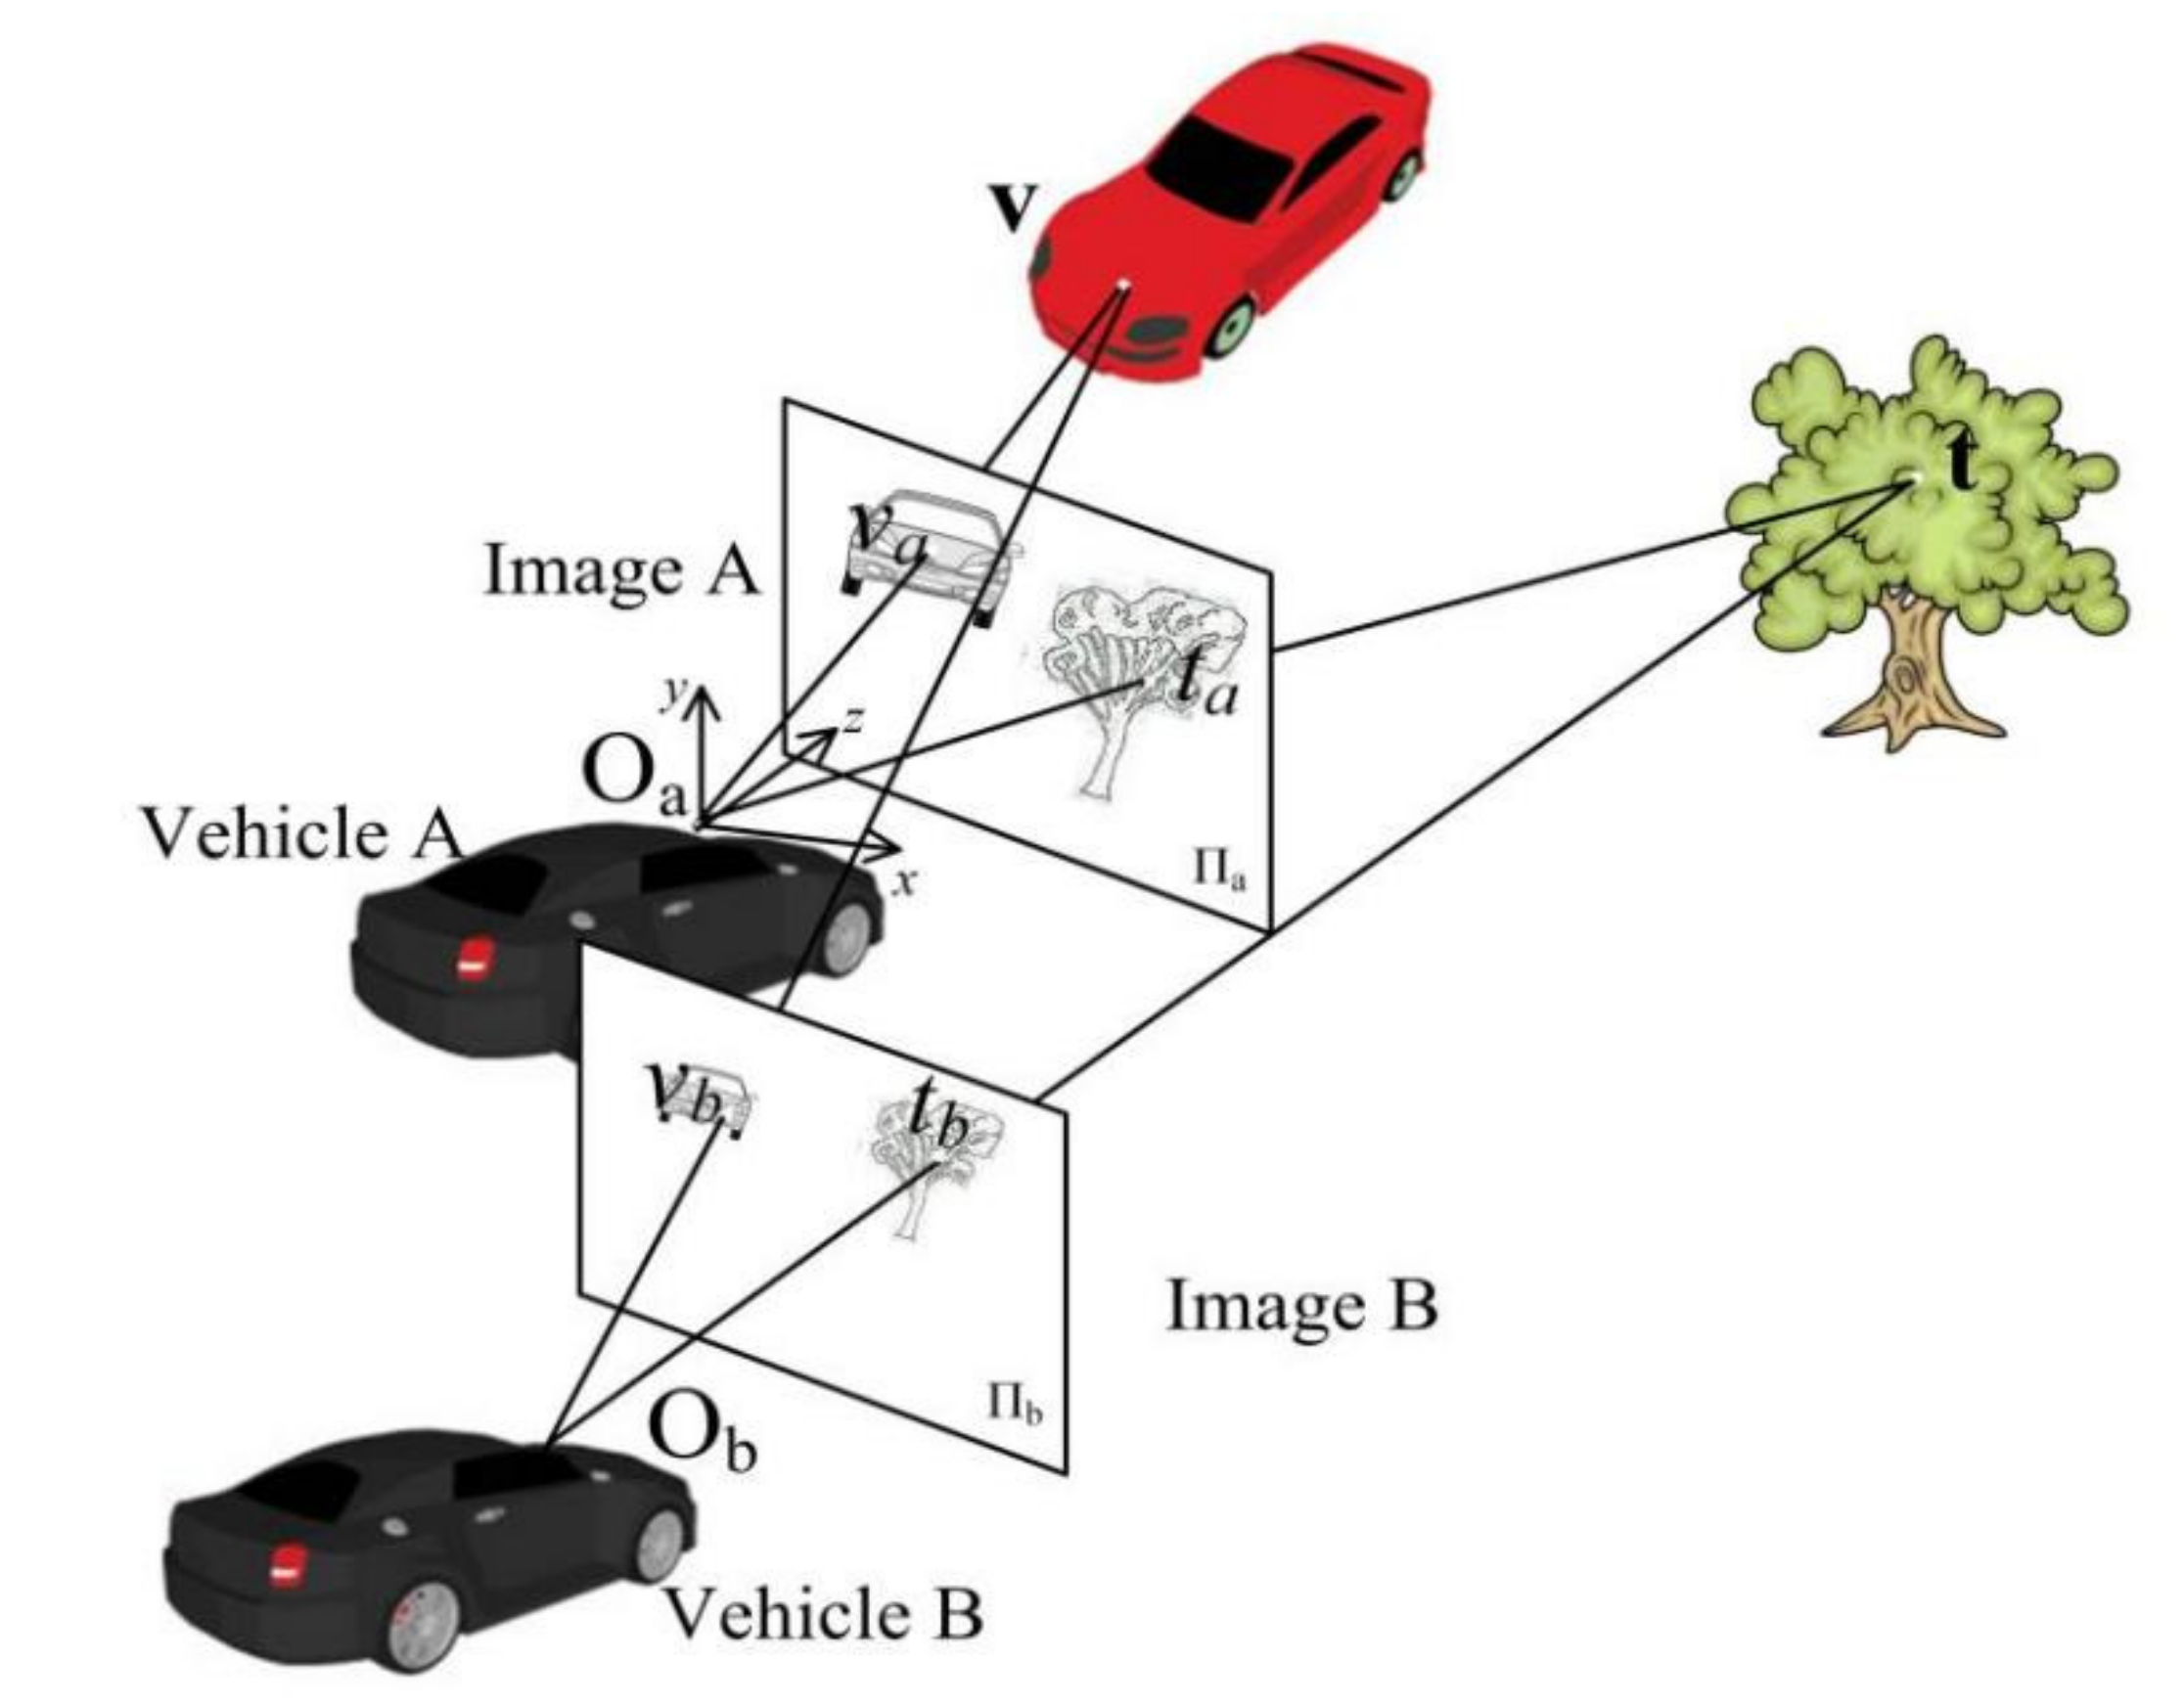
- Suppose we have points (i = 1, …, n) seen by both vehicles, matching pair points will be obtained correspondingly.
- (2)
- The projection matrix, geometric transformation parameters, are estimated based on the n matching points pair .
- (3)
- Through H and , the occluded point can be calculated.
3.2. Feature Pair Selection
- (1)
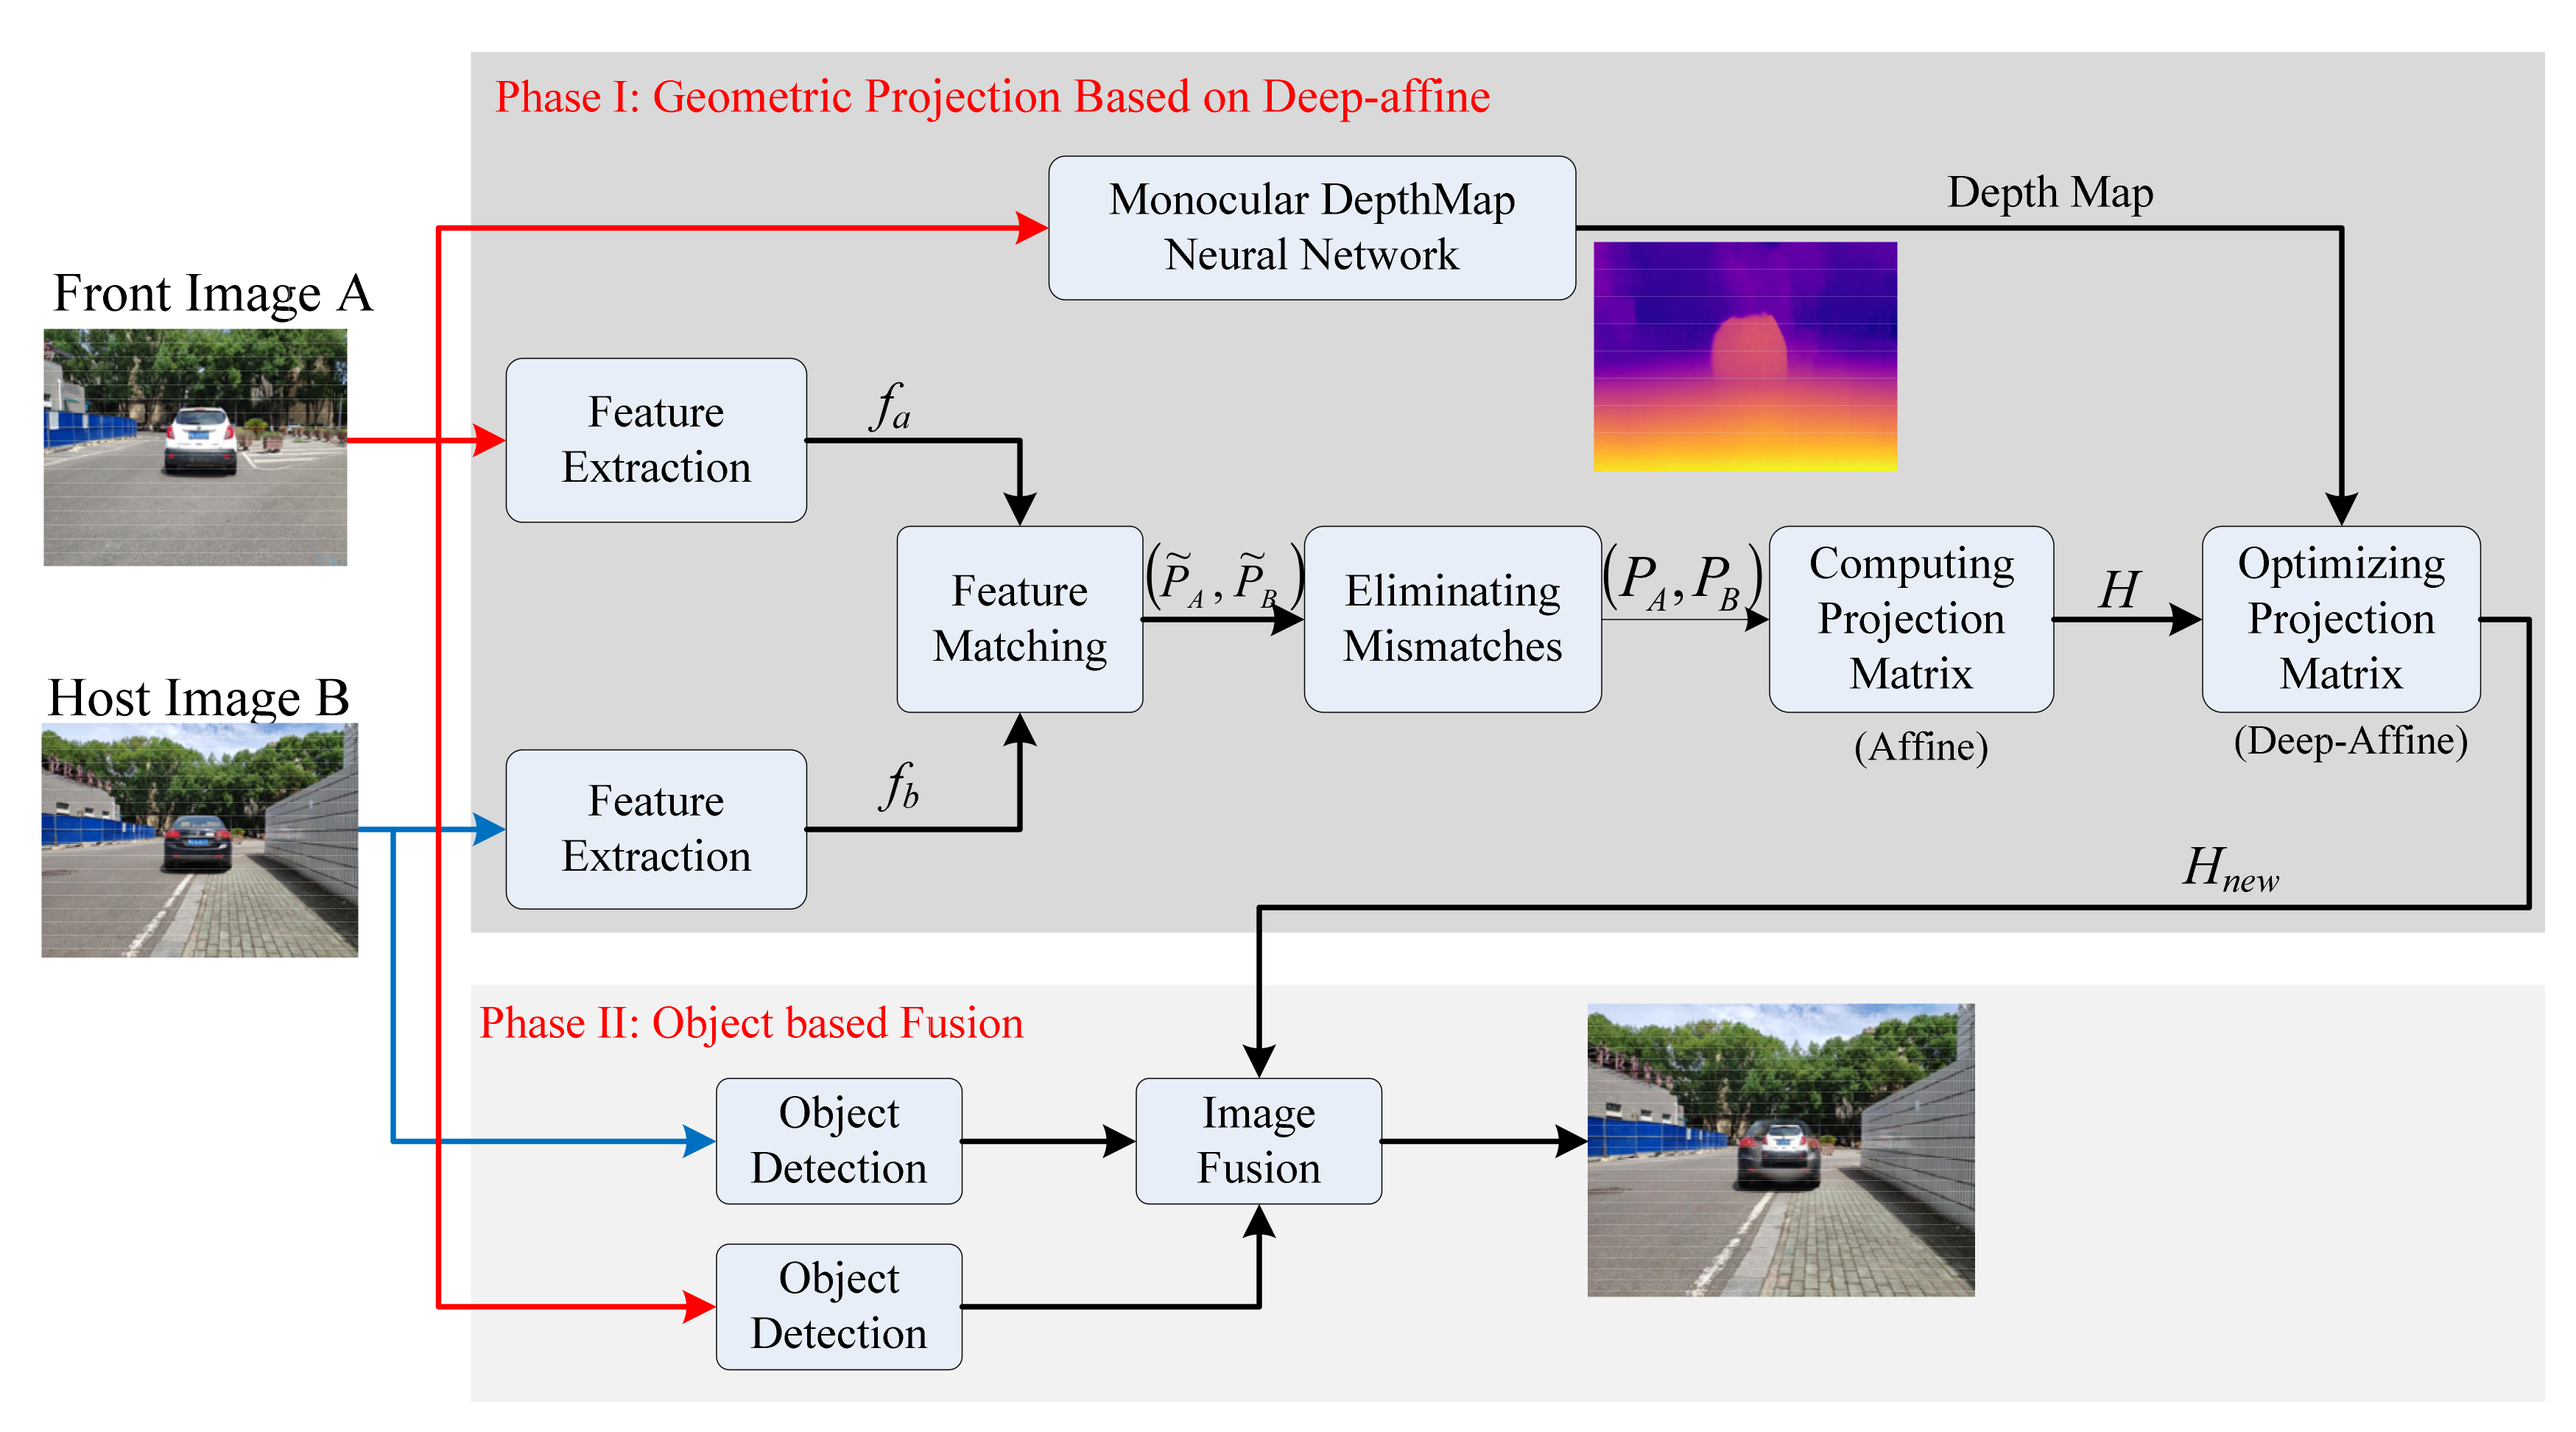
- Feature detection: Lowe’s SIFT method [23] is used to realize feature selection and description. It uses a 128-element-long feature vector descriptor to characterize the gradient pattern in a properly oriented neighborhood surrounding a SIFT feature. The features are invariant to incidental environmental changes in lighting, viewpoint, and scale.
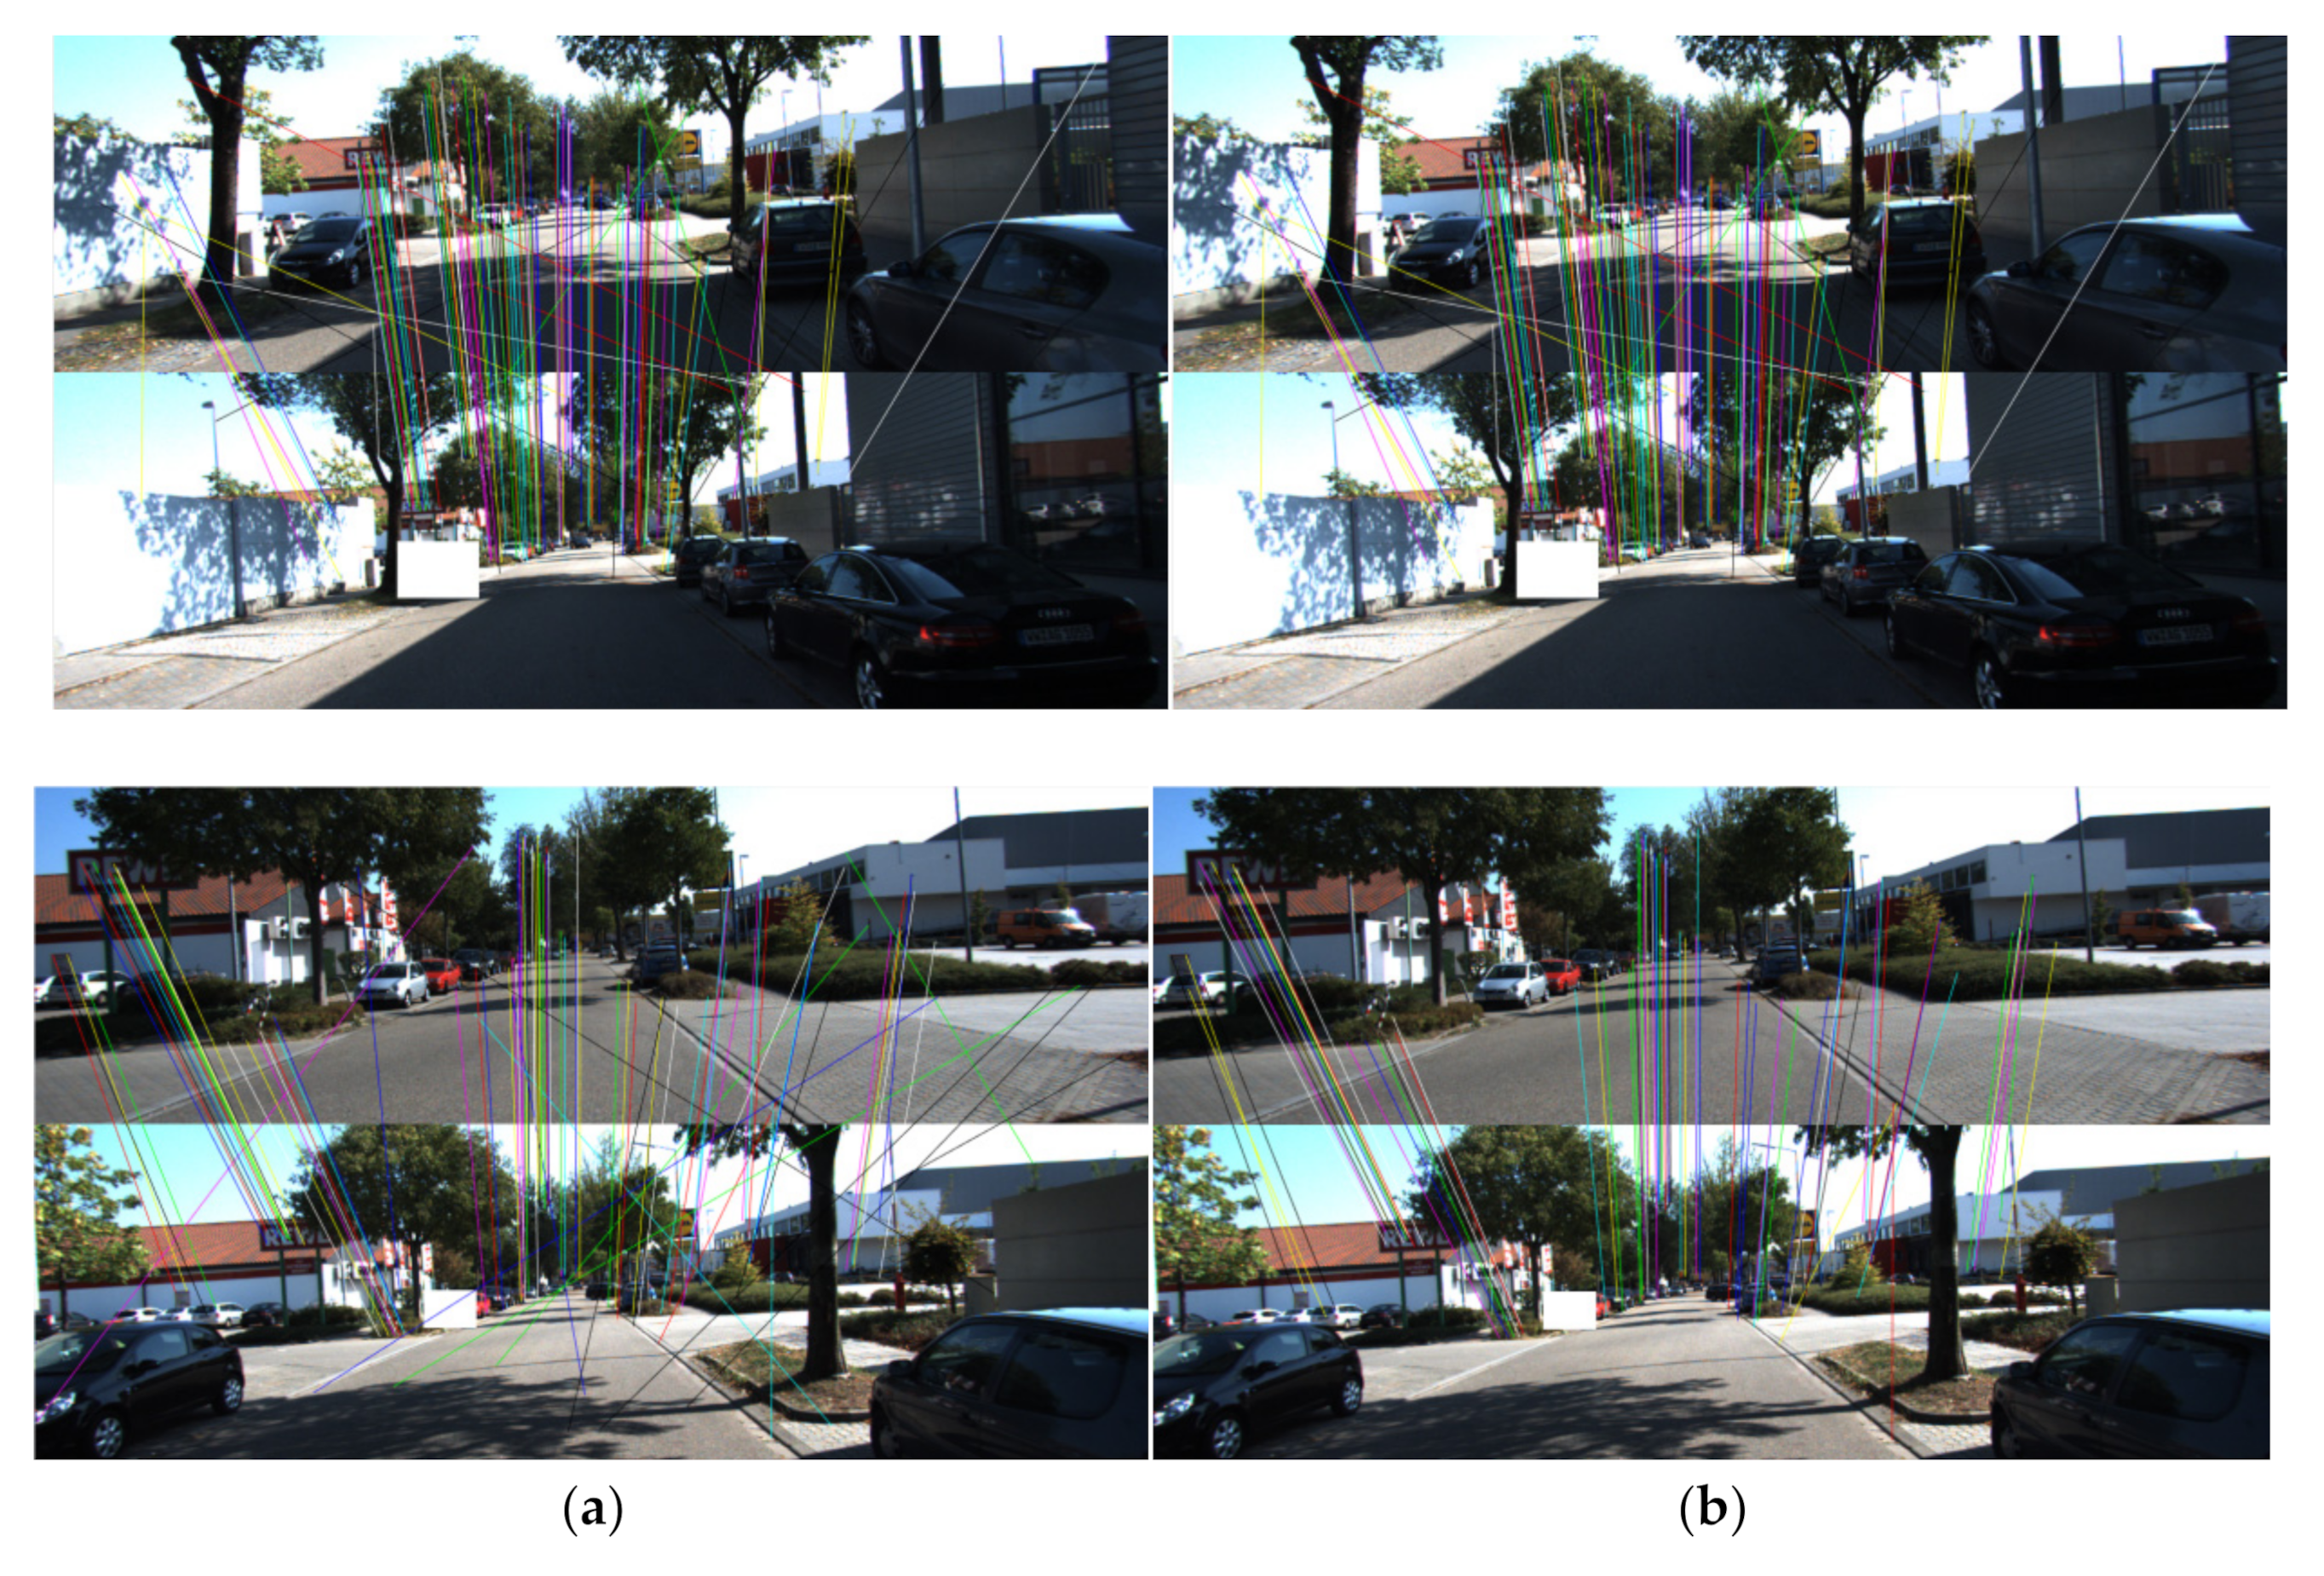
- (2)
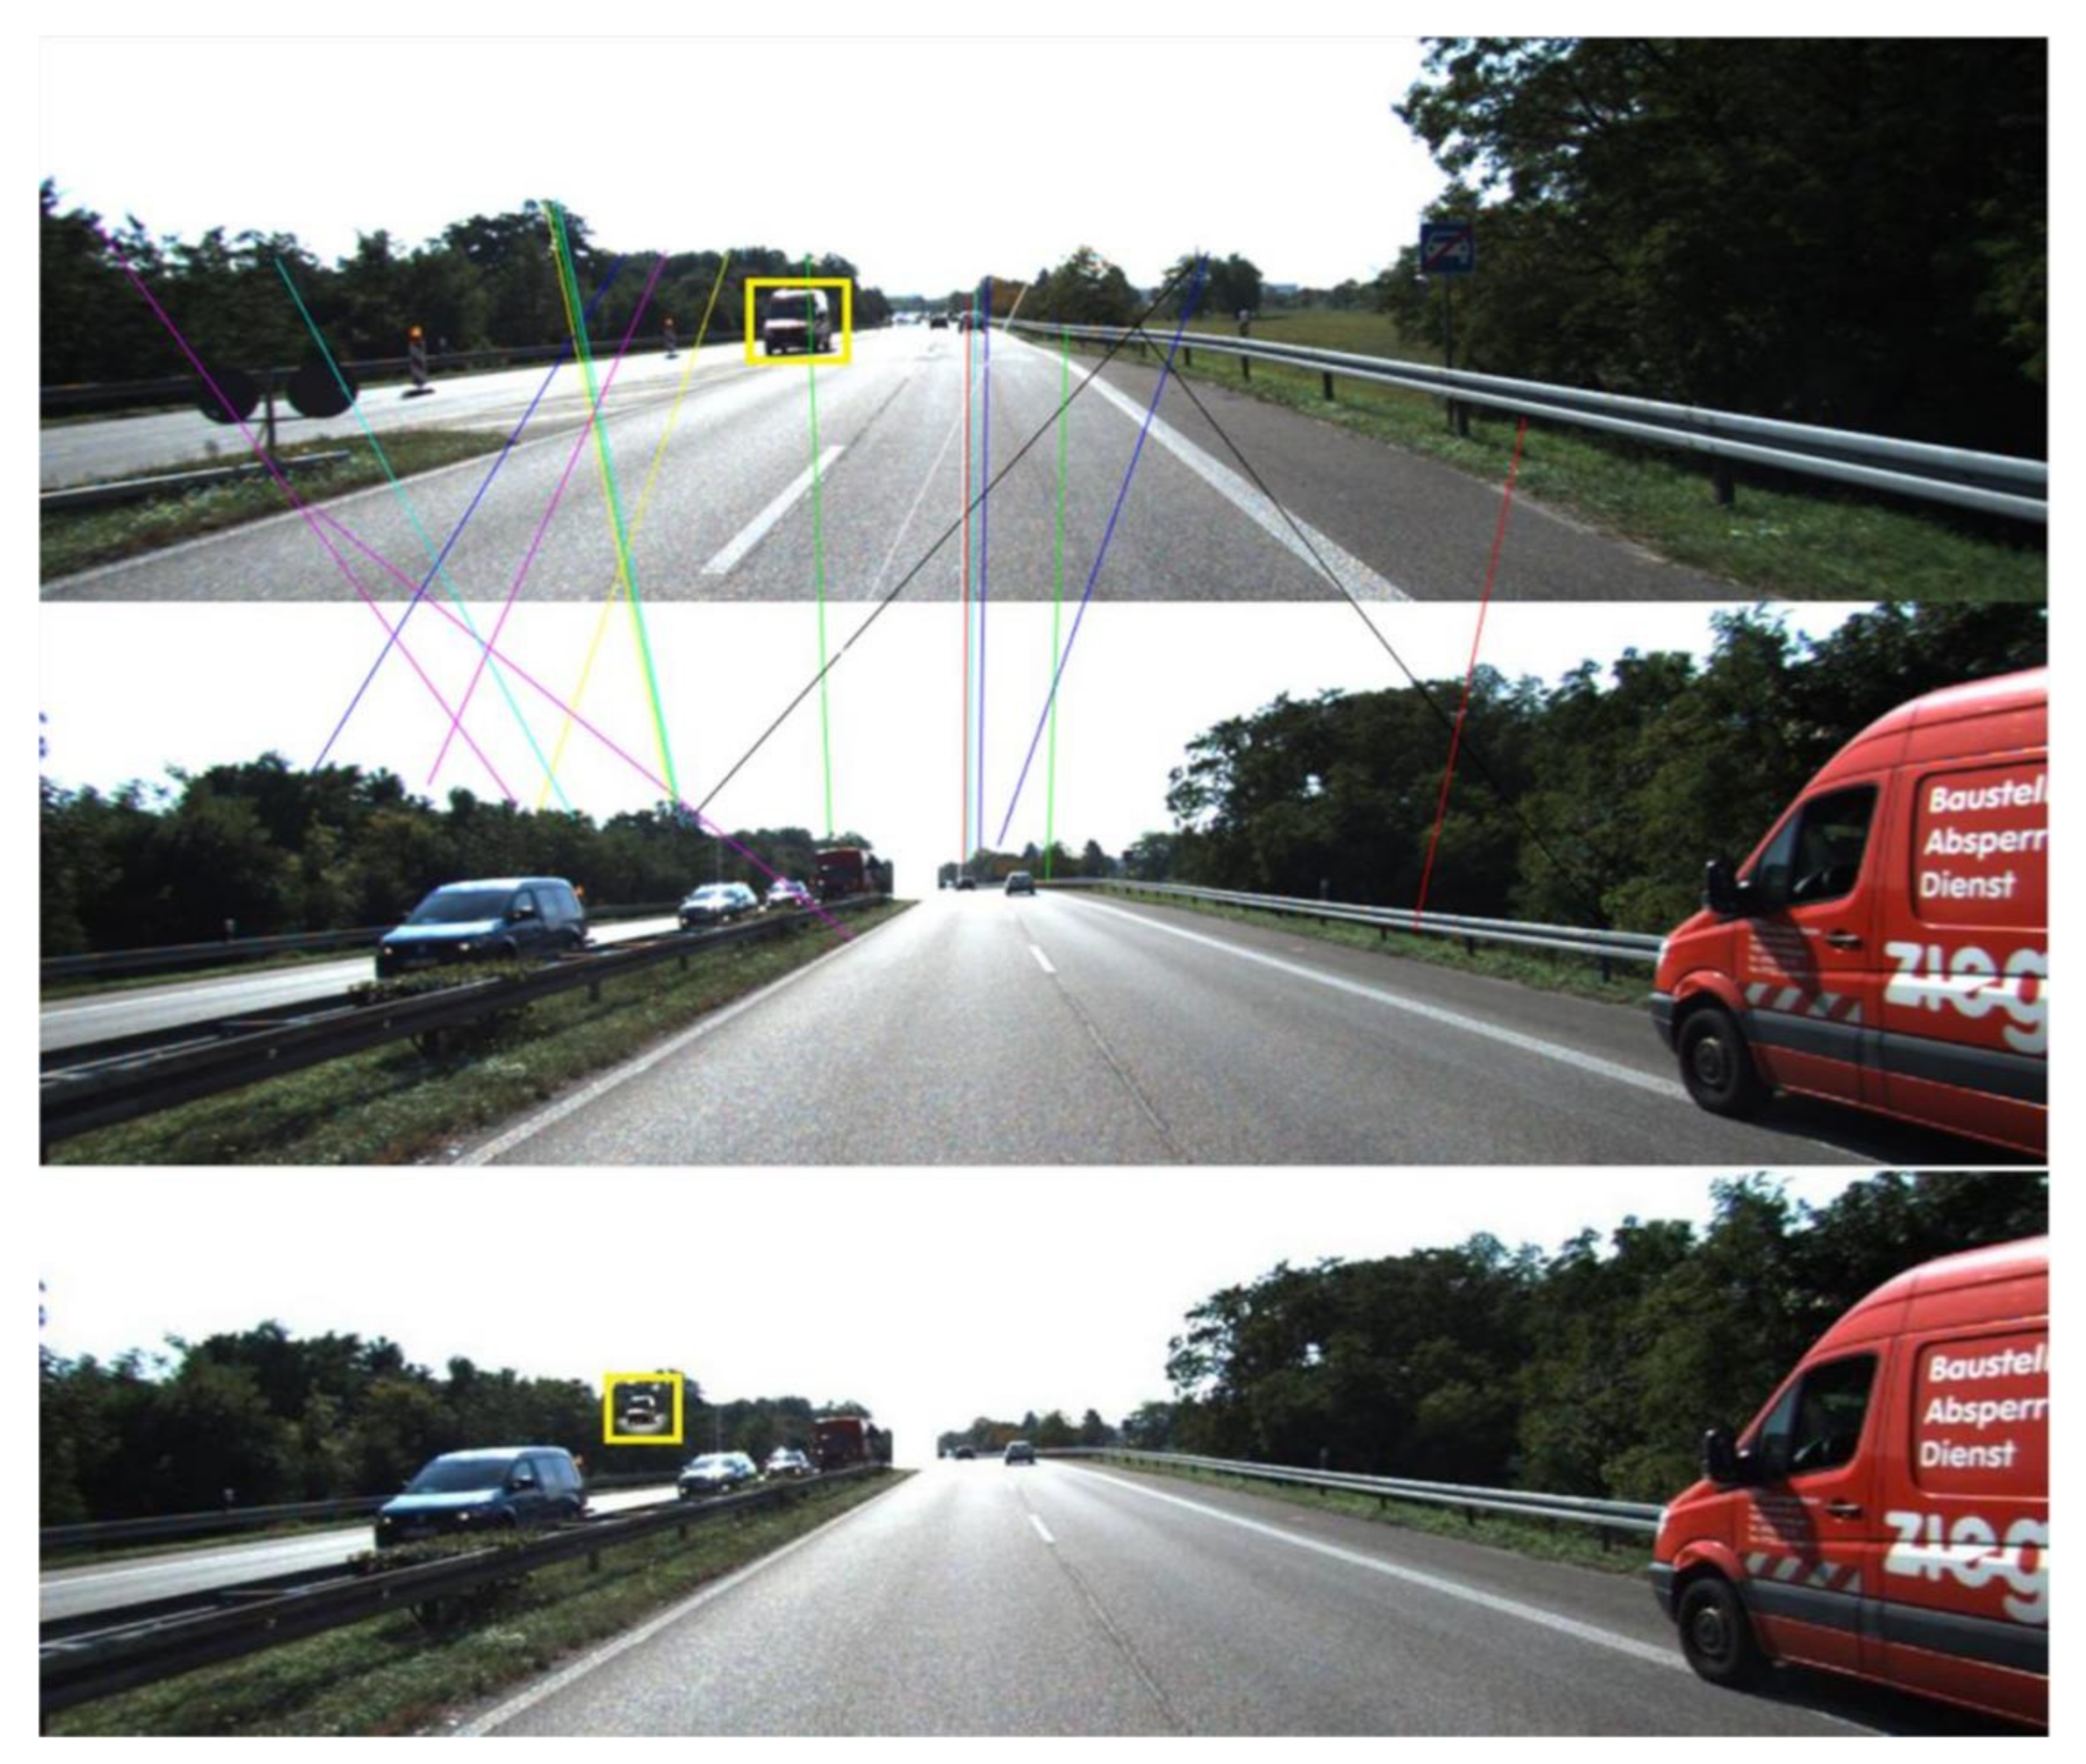
- Feature matching: By searching the most similar descriptors, SIFT features in front and back images are matched. Brute-force algorithm [23] is adopted here to match feature pairs. The Euclidean distance, used as the matching score, was computed between feature vectors. The selected matching point pairs (also named feature pairs in the following) need to satisfy Equation (1).is a pair of corresponding points in image A and image B. and represent feature descriptor of and . means the best matching pair and is the second best one. Figure 7a in experiment part displays the matching result, and it is obvious that error matching pairs exist only based on similarity.
- (3)
- Mismatched elimination: To achieve more accurate feature pairs, we use the RANSAC algorithm [24] to eliminate mismatched feature pairs. Randomly selected n small subsets “seed” (n pairs of matching points), and the calculation of fundamental matrix F is repeated n times. The value of calls the residual error, which is ideally supposed to be zero. F will be computed by those outlier-free seeds and will produce small residual errors in for mostly inlier matching pairs. We preserve those seeds that produce the minimum median residual errors, so that error pairs are filtered. Figure 7b in experiment part displays the result of features after the RANSAC procedure, and most error feature pairs are eliminated.
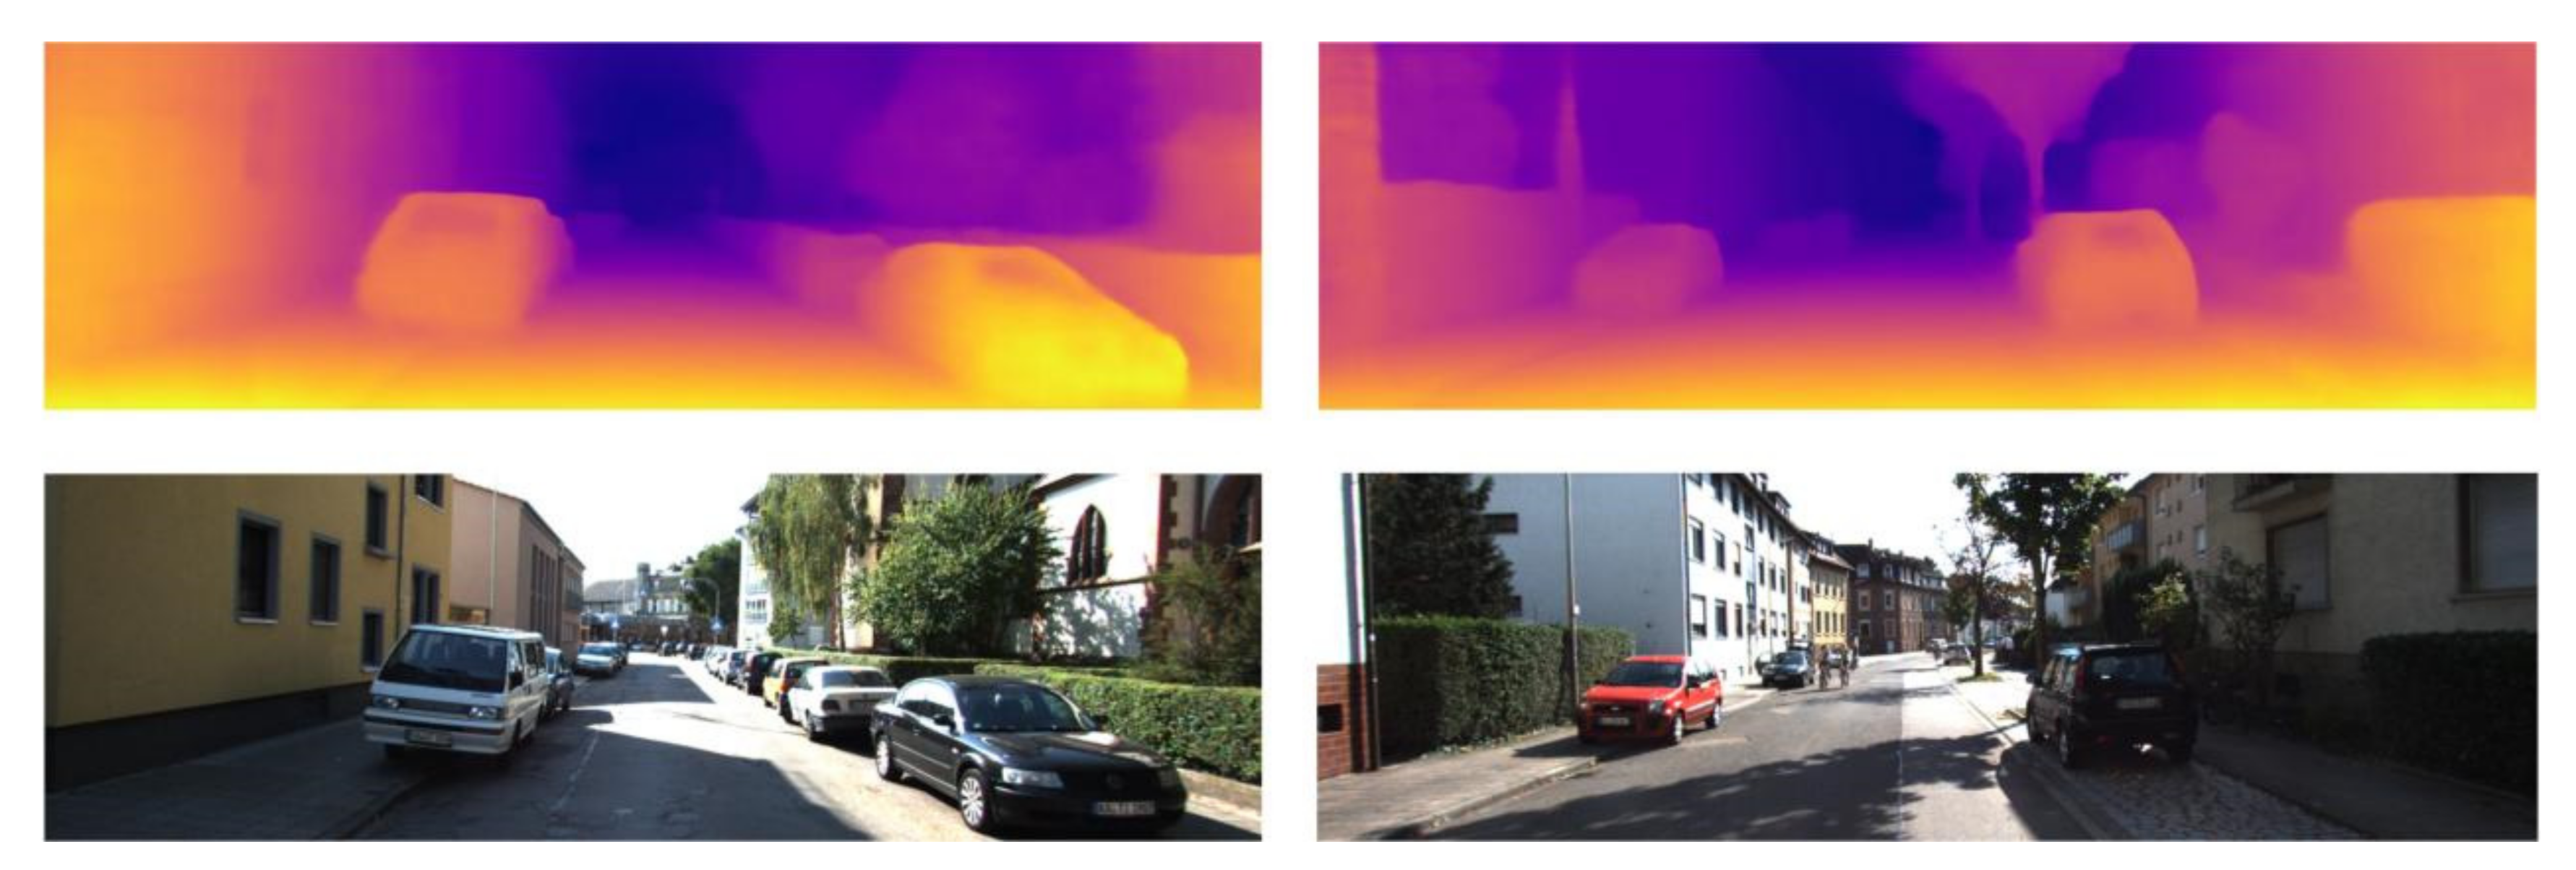
3.3. Acquisition of Depth Map
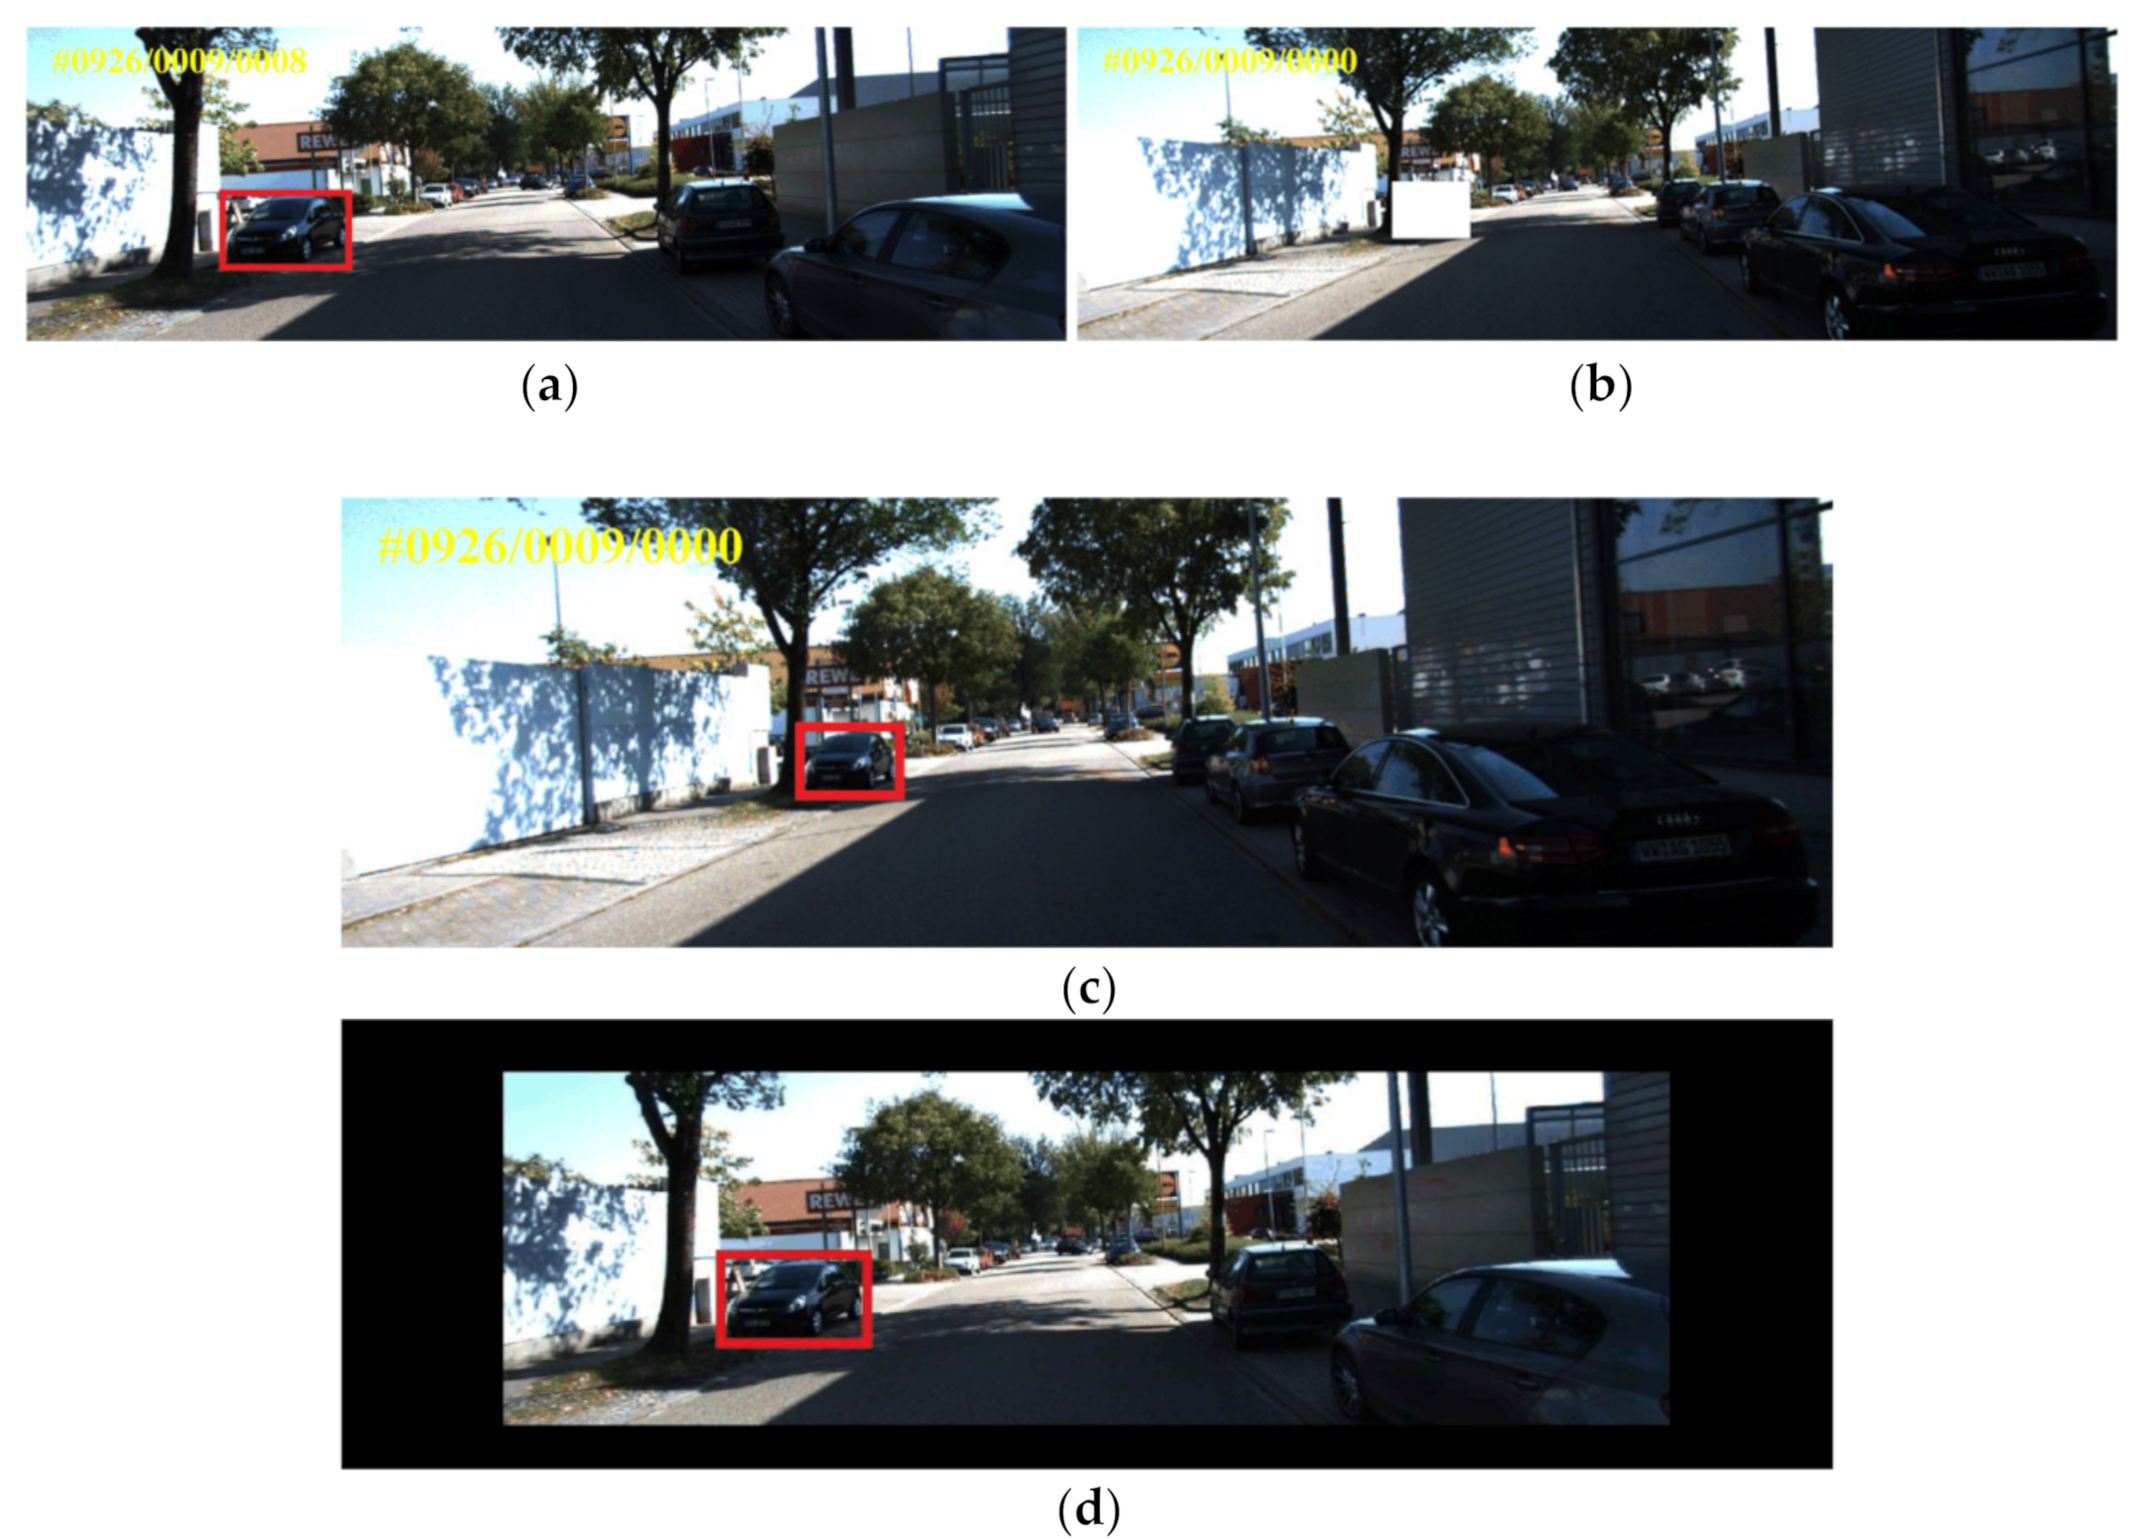
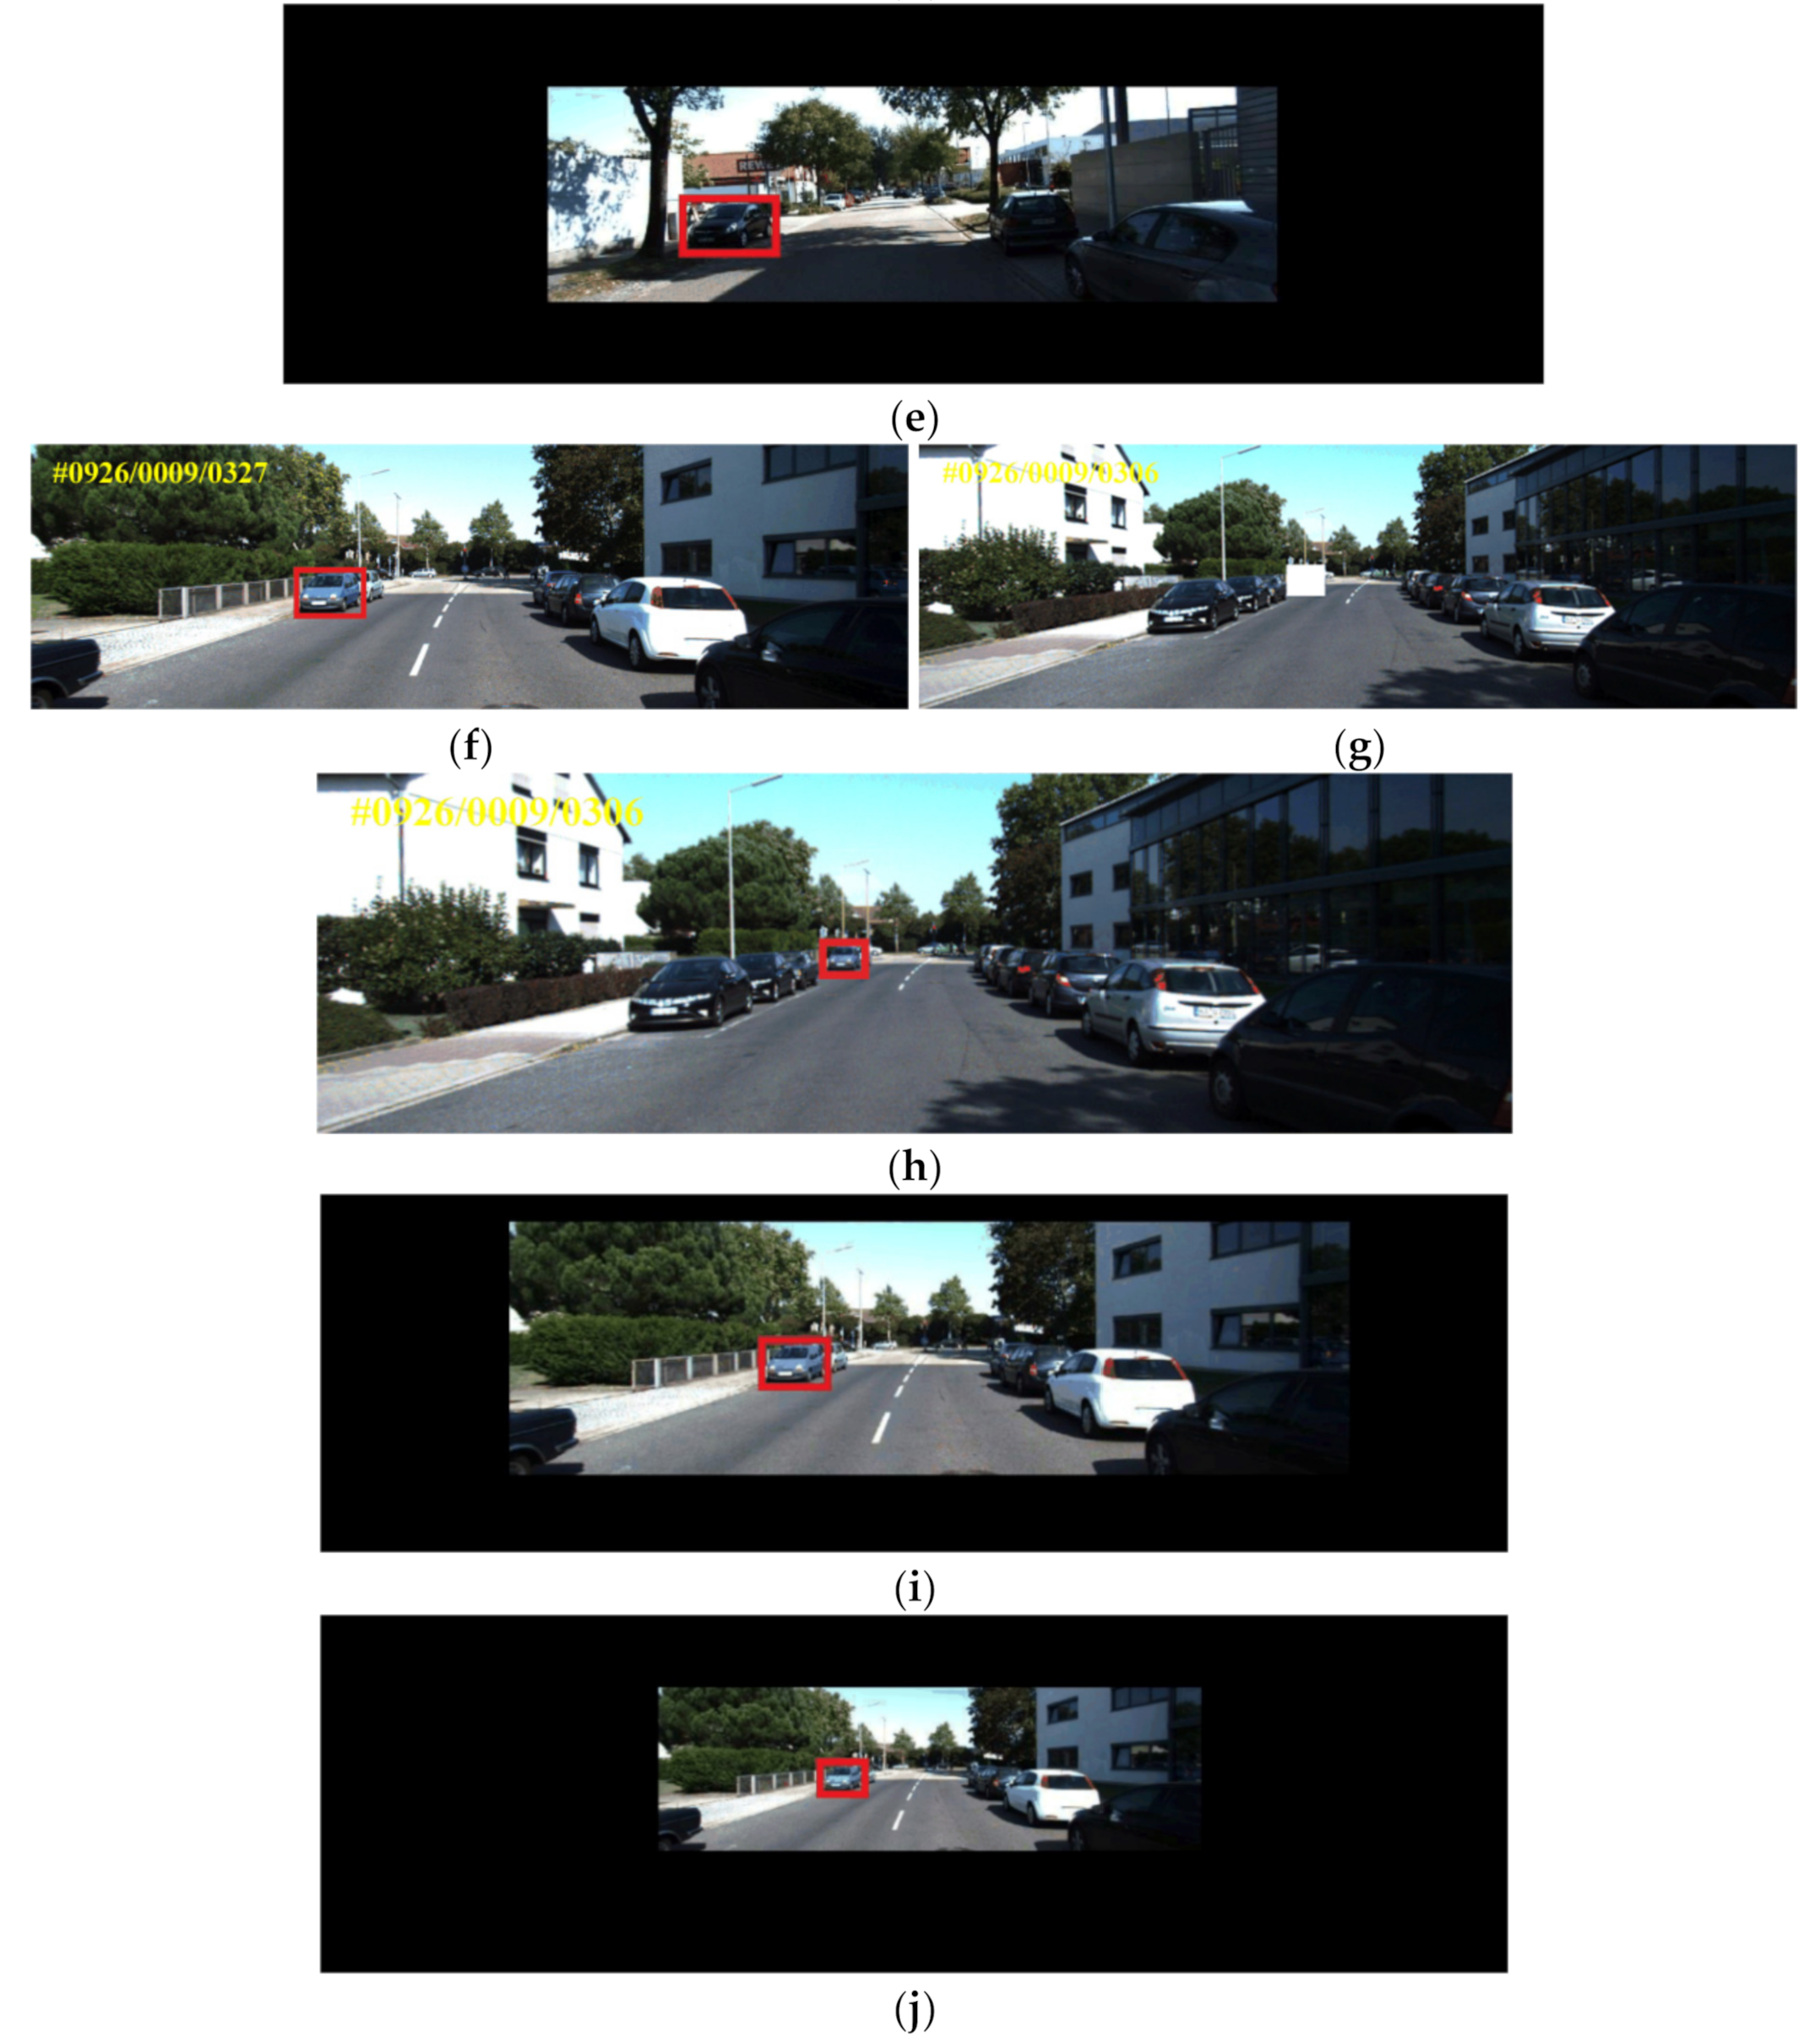
3.4. Deep-Affine Transformation
3.5. Object-Based Image Fusion
4. Experiment Results
4.1. Datasets
4.2. Feature Pair Selection Results
4.3. Depth Map Acquisition Results
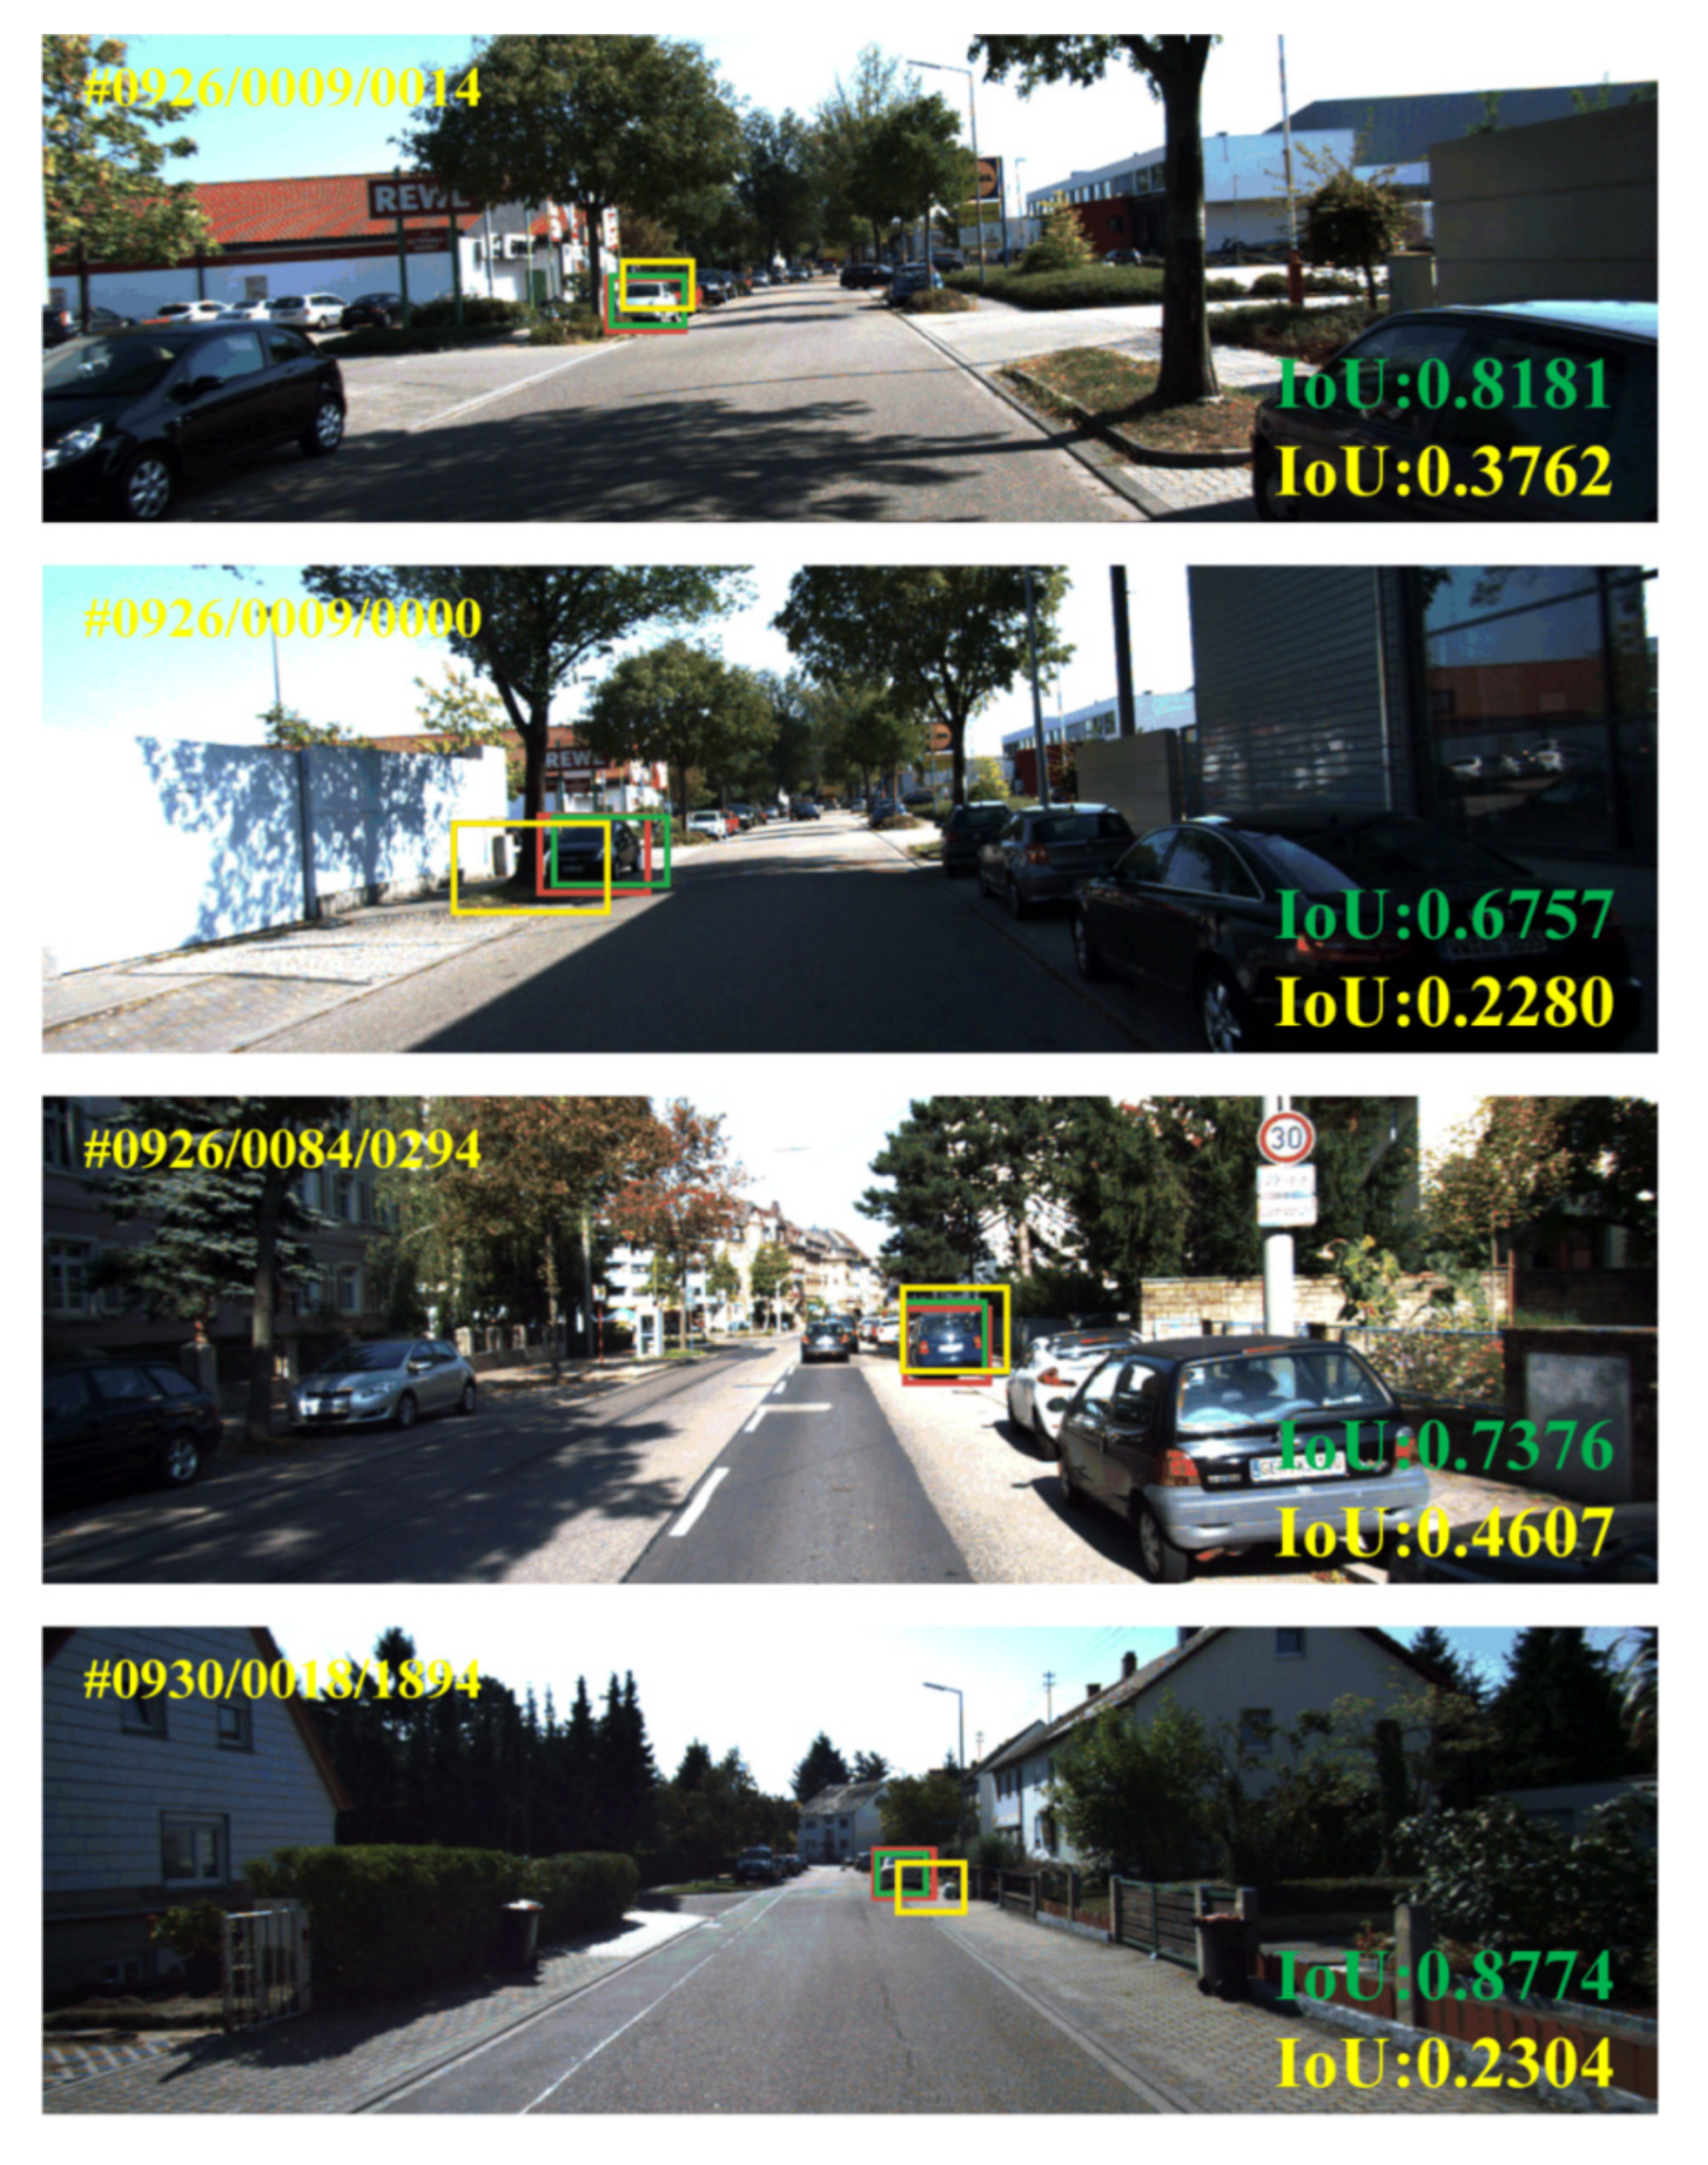
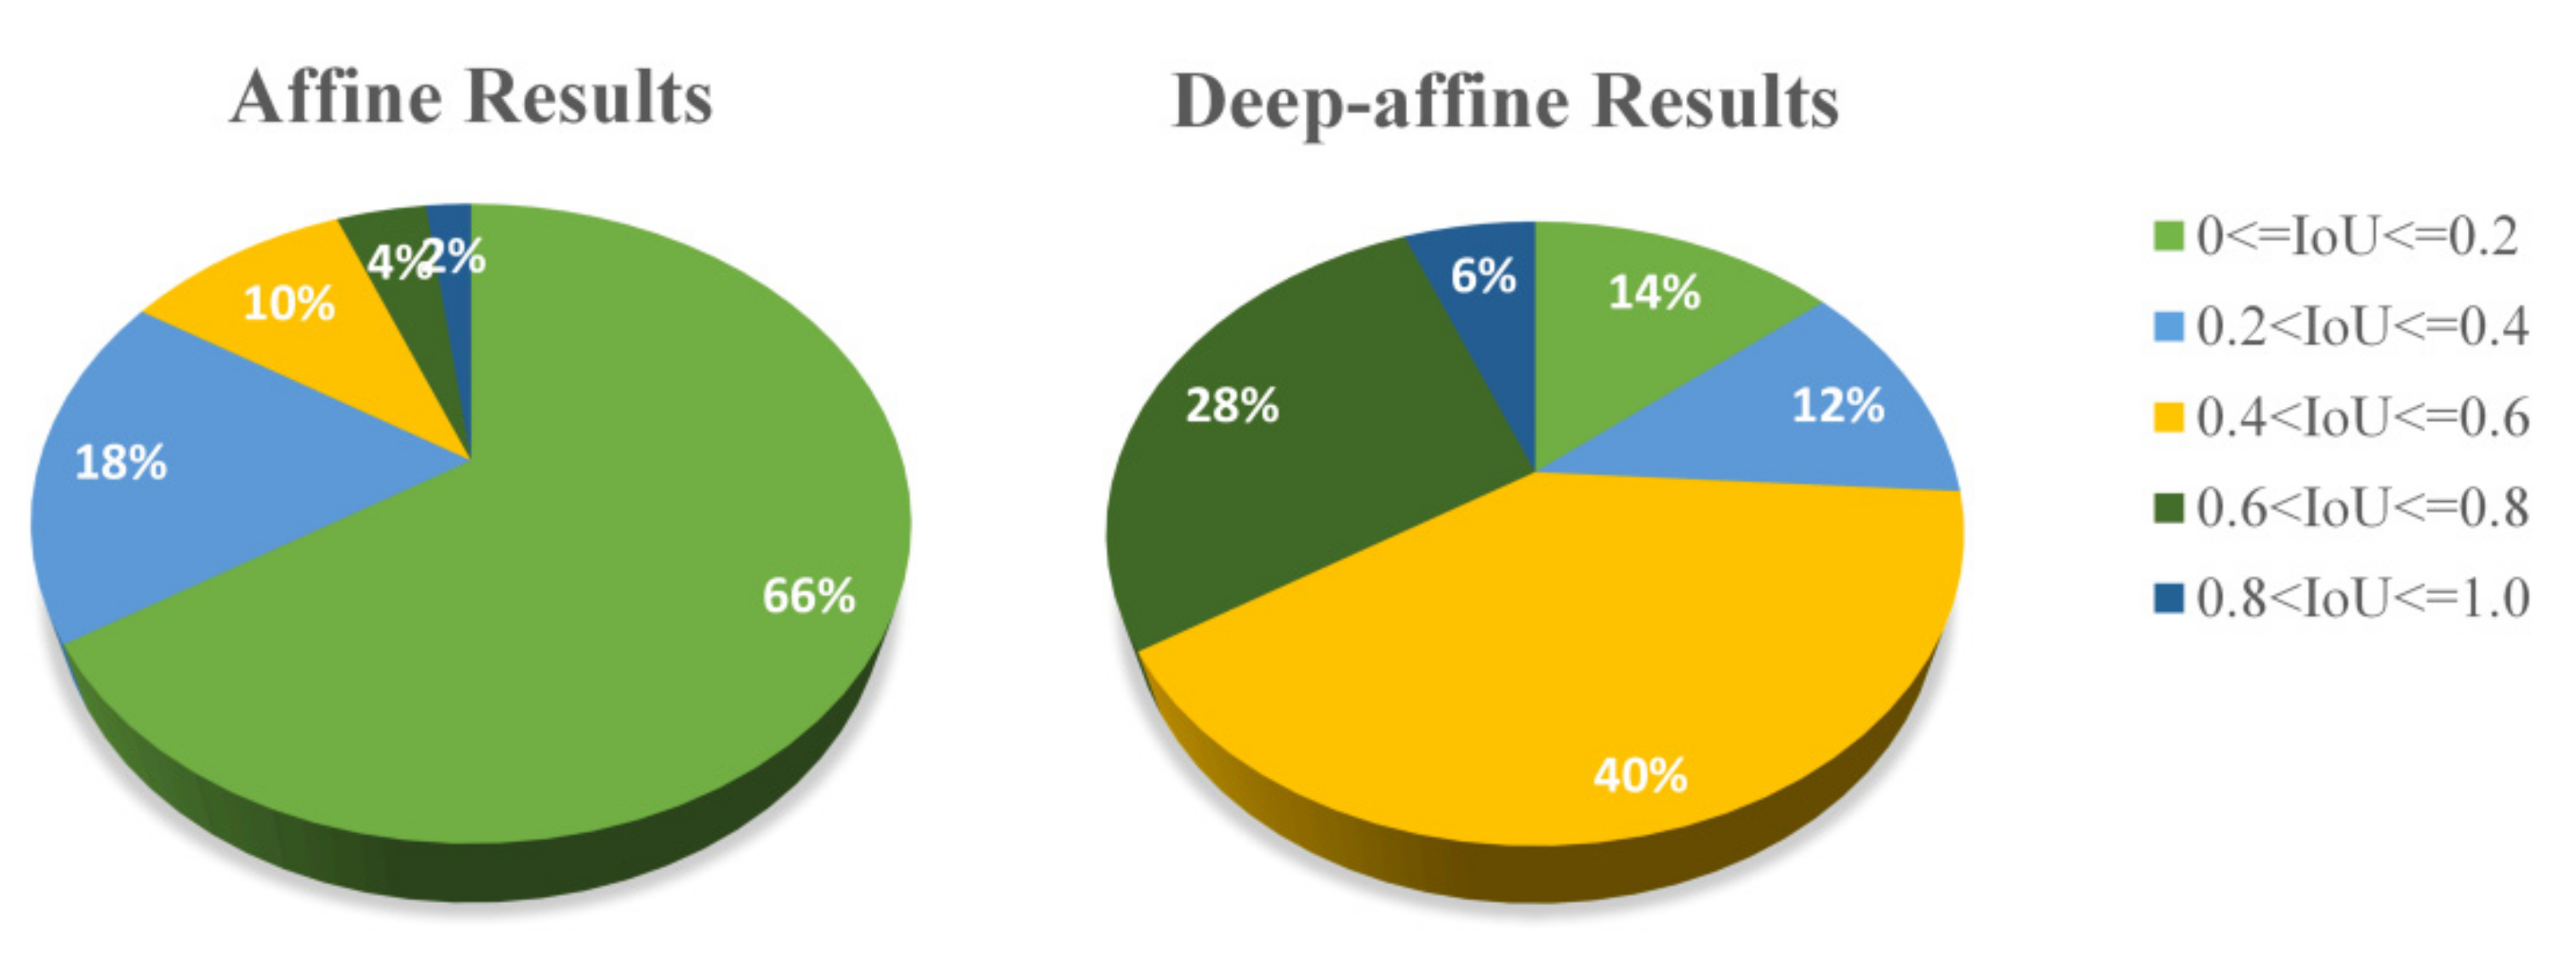
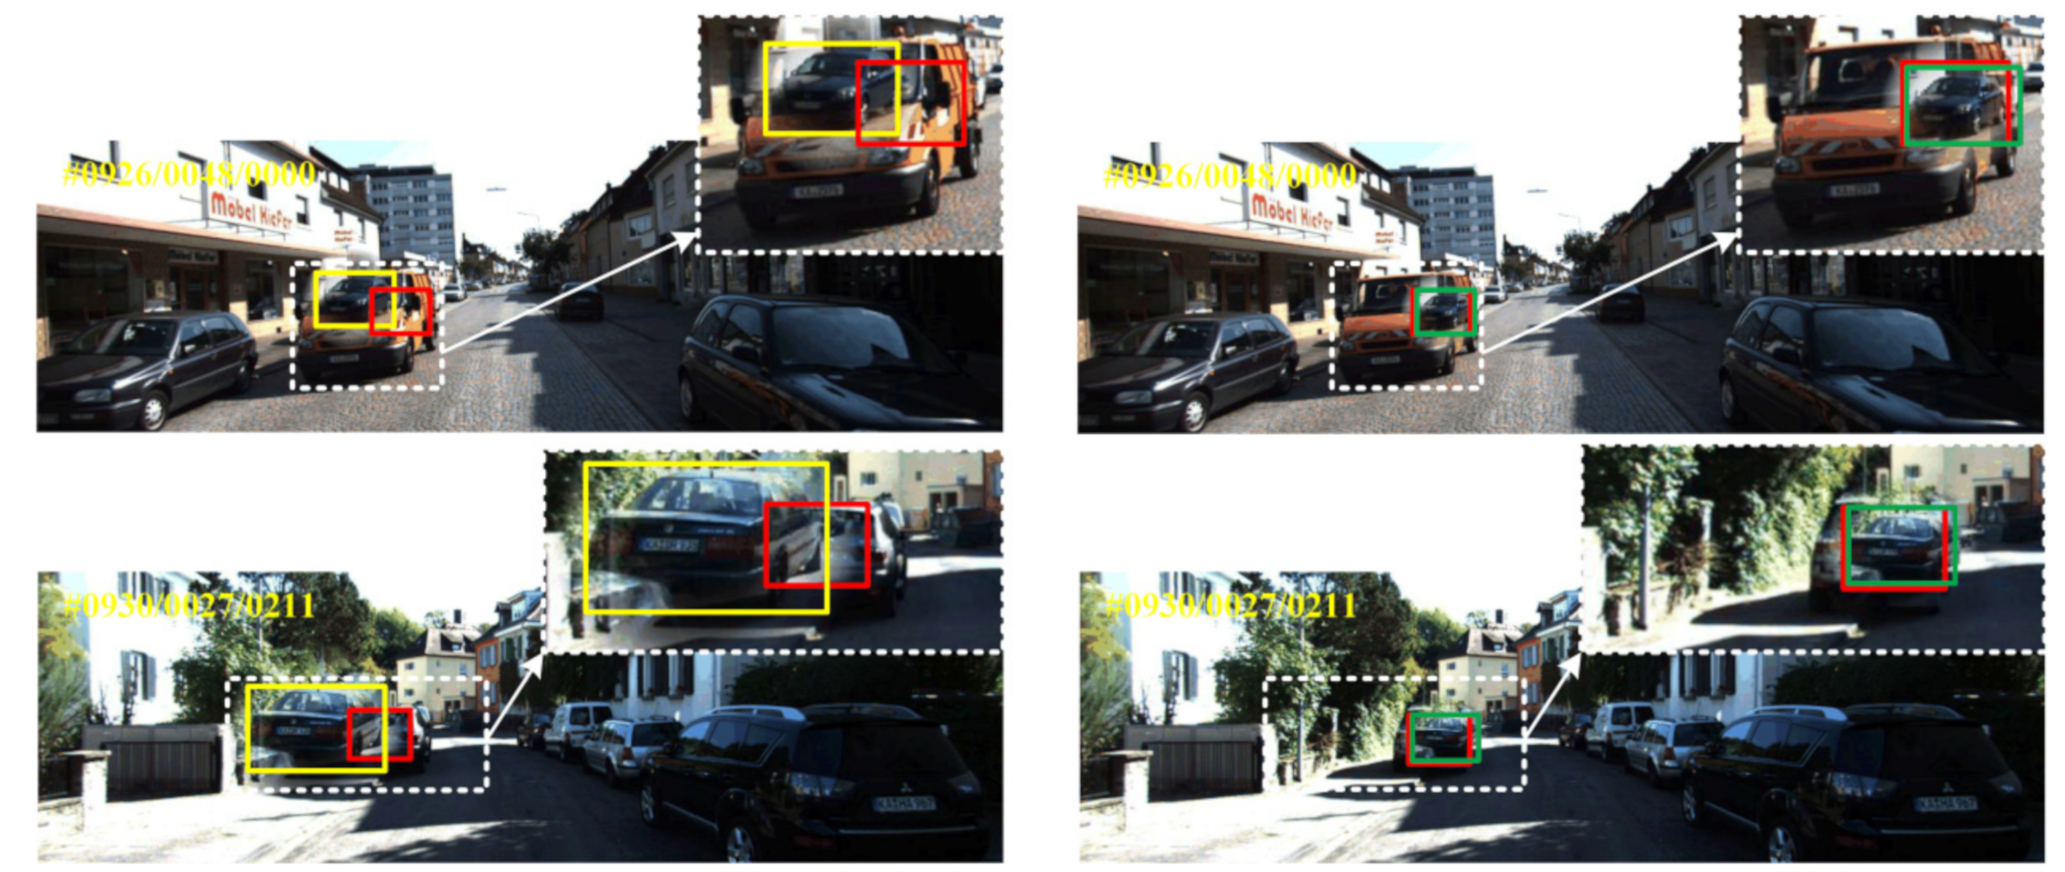
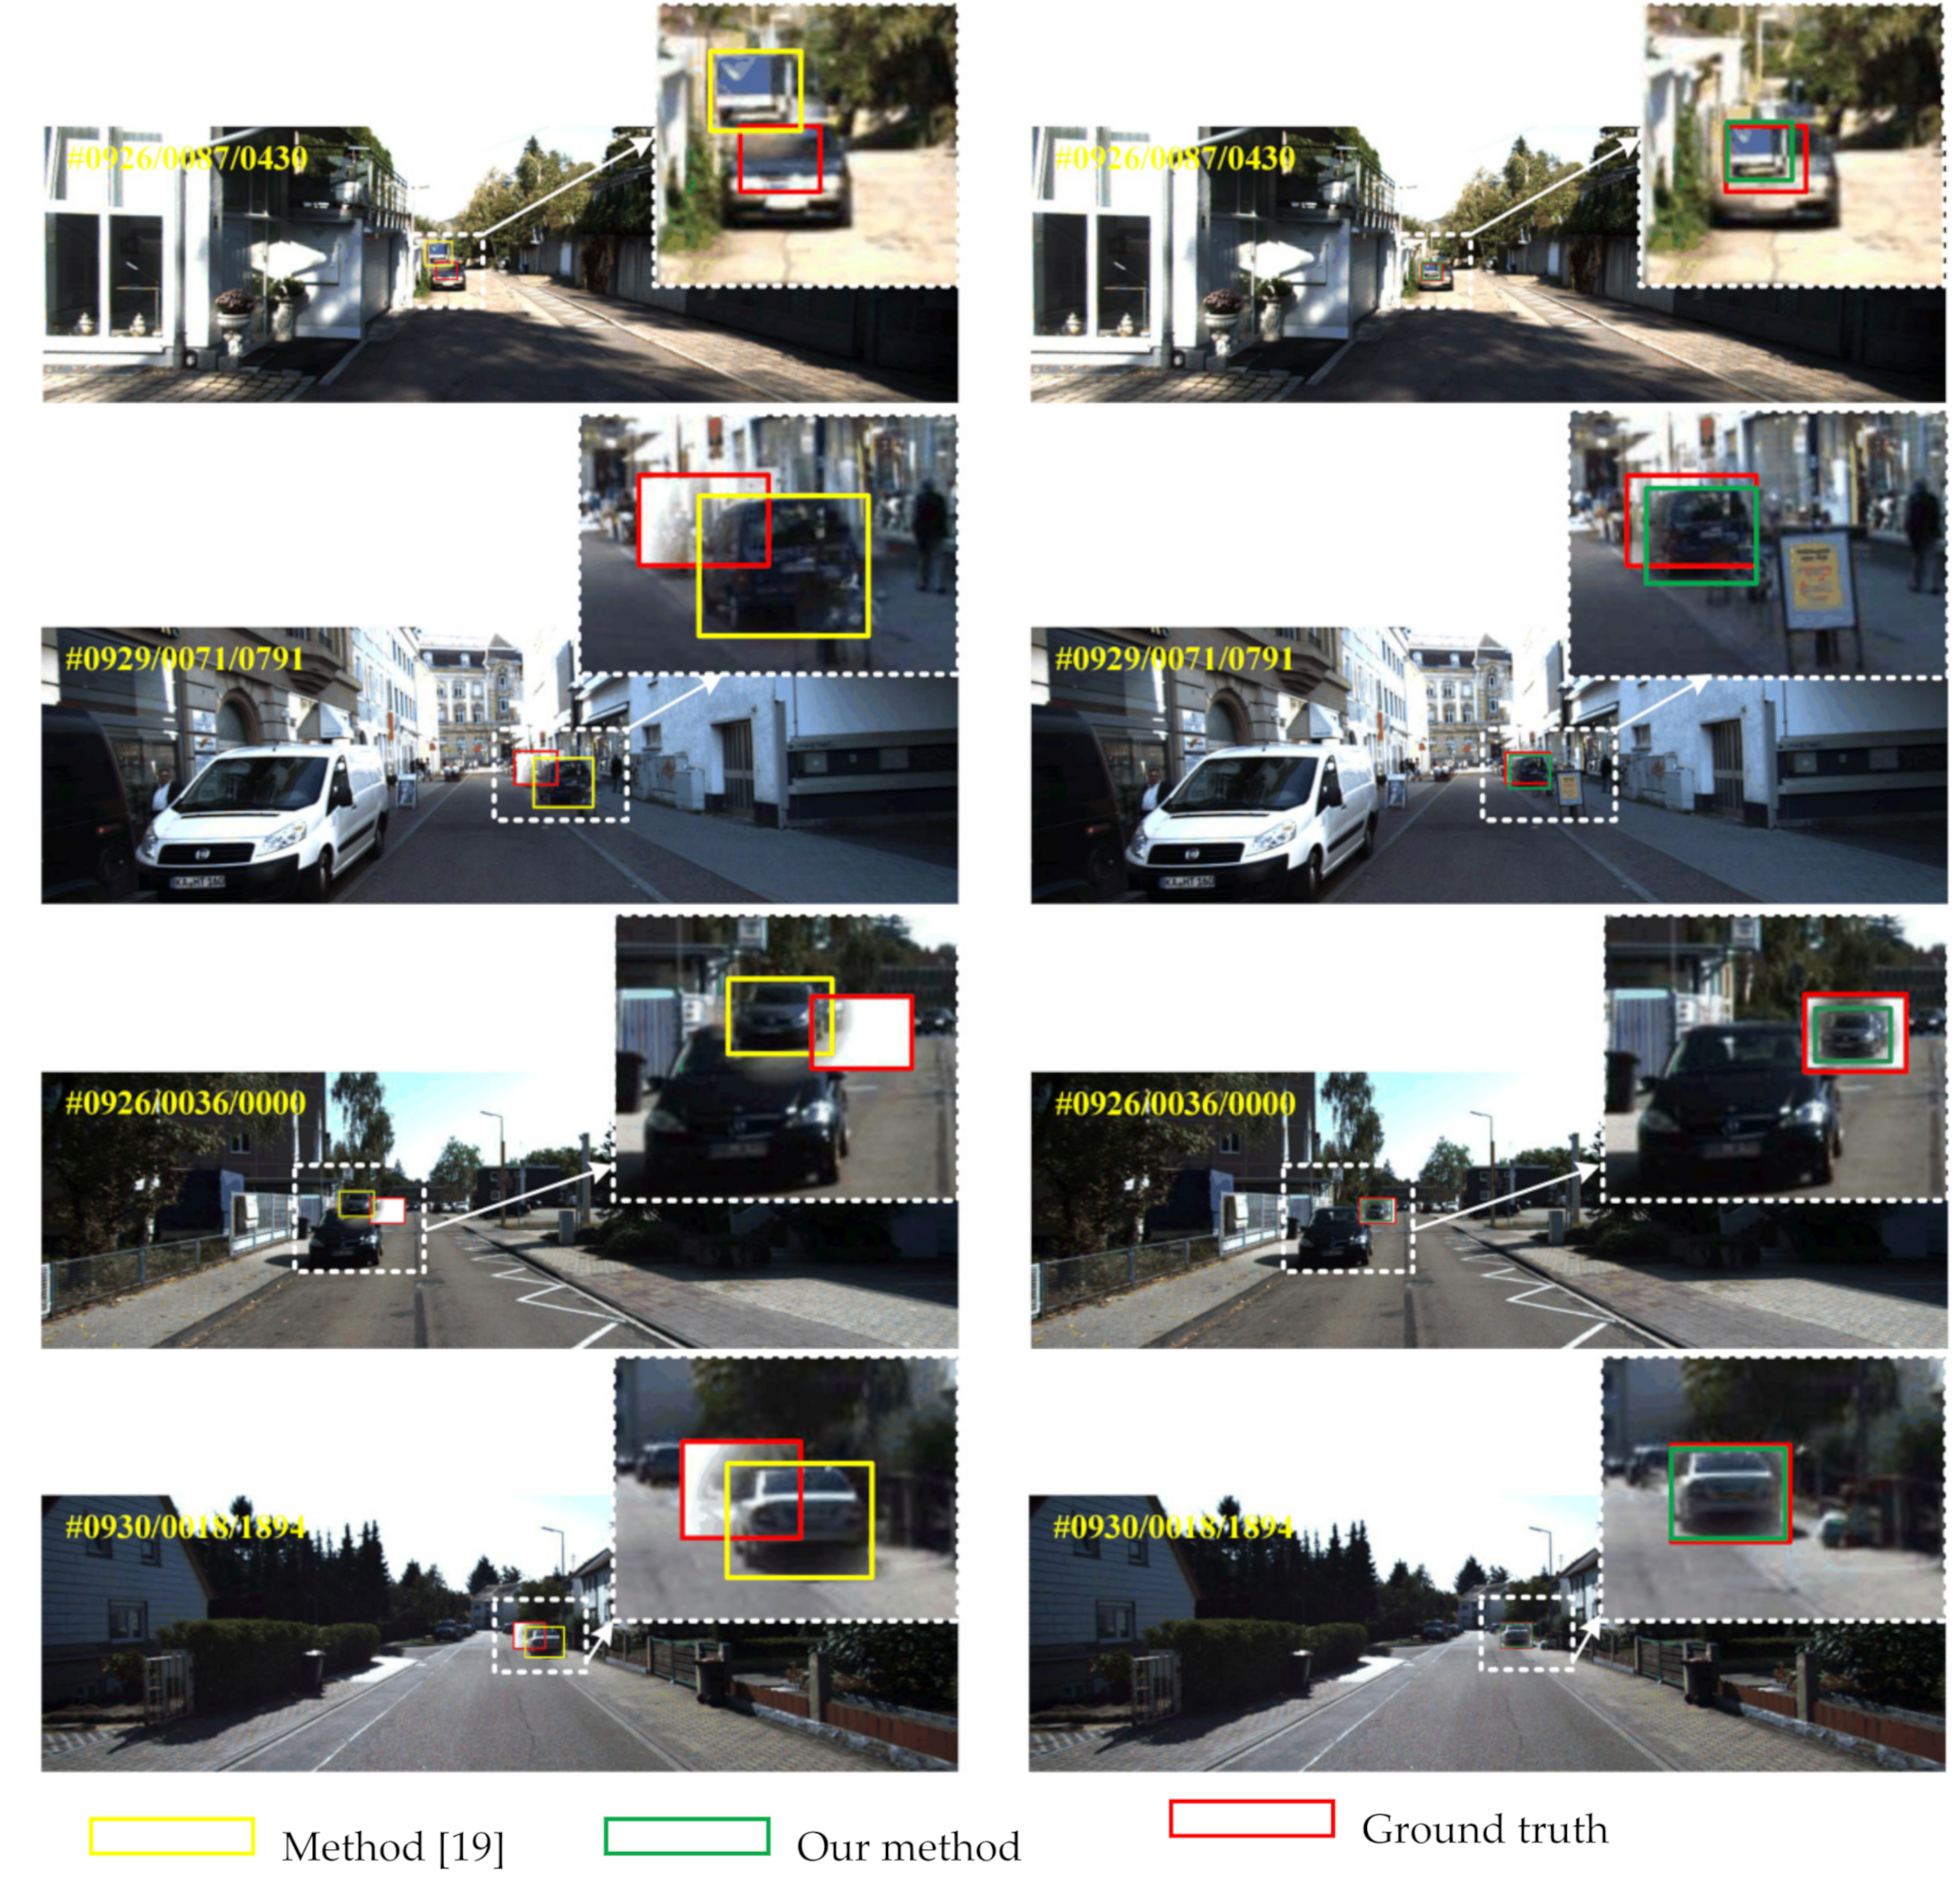
4.4. Deep-Affine Transformation Results
4.5. Cooperative Visual Augmentation Results Based on Fusion
5. Conclusions
Author Contributions
Funding
Institutional Review Board Statement
Informed Consent Statement
Data Availability Statement
Acknowledgments
Conflicts of Interest
References
- Global Status Report on Road Safety. Available online: https://www.who.int/publications/i/item/9789241565684 (accessed on 30 February 2021).
- Traffic Safety Facts. Available online: https://crashstats.nhtsa.dot.gov/#/ (accessed on 23 July 2018).
- 3GPP, TR 22.886: Technical Specification Group Services and System Aspects; Enhancement of 3GPP Support for 5G V2X Services (v16.2.0, Release 16). 2018, Volume 12. Available online: https://portal.3gpp.org/desktopmodules/Specifications/SpecificationDetails.aspx?specificationId=3108 (accessed on 1 November 2021).
- Cristina, O.; Gerd, C.; Florian, M.; Rene, L.; Matthias, P. Collaborative approach for a safe driving distance using stereoscopic image processing. Future Gener. Comput. Syst. 2019, 95, 880–889. [Google Scholar]
- Ito, T.; Sakagami, T.; Kawakatsu, S. A real time distance headway measurement method using stereo and optical flow. In Proceedings of the IEEE Intelligent Vehicles Symposium (IV), Detroit, MI, USA, 29 June–1 July 1992; pp. 230–235. [Google Scholar]
- Petrovai, A.; Danescu, R.; Nedevschi, S. A stereo vision based approach for detecting and tracking lane and forward obstacles on mobile devices. In Proceedings of the IEEE Intelligent Vehicles Symposium (IV), Seoul, Korea, 28 June–1 July 2015; pp. 634–641. [Google Scholar]
- Cabrera, A.; Gowal, S.; Martinoli, A. A new collision warning system for lead vehicles in rear-end collisions. In Proceedings of the IEEE Intelligent Vehicles Symposium (IV), Alcala de Henares, Spain, 3–7 June 2012; pp. 674–679. [Google Scholar]
- Shrestha, D.; Chang, G.L. A monitoring and alert system for tailgating behavior of drivers. In Proceedings of the IEEE Vehicular Technology Conference (VTC), Dallas, TX, USA, 28 September 2005; pp. 1308–1312. [Google Scholar]
- Cho, I.; Lee, Y.; Baek, S.J. Real-Time Inter-Vehicle Data Fusion Based on a New Metric for Evidence Distance in Autonomous Vehicle Systems. Appl. Sci. 2020, 10, 6834. [Google Scholar] [CrossRef]
- Xu, Q.; Mak, T.; Ko, J.; Sengupta, R. Vehicle-to-Vehicle Safety Messaging in DSRC. In Proceeding of the 1st ACM International Workshop on Vehicular Ad Hoc Networks, Philadelphia, PA, USA, 1 October 2004; pp. 19–28. [Google Scholar]
- Batt, T.E.; Goel, S.K.; Holland, G.; Krishnan, H.; Parikh, J. Cooperative Collision Warning Using Dedicated Short Range Wireless Communications. In Proceeding of the 3rd ACM International Workshop on Vehicular Ad Hoc Networks, Los Angeles, CA, USA, 29 September 2006; pp. 1–9. [Google Scholar]
- Mouhagir, H.; Cherfaoui, V.; Talj, R.; Aioun, F.; Guillemard, F. Trajectory planning for autonomous vehicle in uncertain environment using evidential grid. In Proceedings of the 20th International Federation of Automatic Control World Congress, Toulouse, France, 9–14 July 2017; pp. 12545–12550. [Google Scholar]
- Laghmara, H.; Boudali, M.T.; Laurain, T.; Ledy, J.; Orjuela, R.; Lauffenburger, J.P.; Basset, M. Obstacle Avoidance, Path Planning and Control for Autonomous Vehicles. In Proceedings of the 2019 IEEE Intelligent Vehicles Symposium (IV), Paris, France, 9–12 June 2019; pp. 529–534. [Google Scholar]
- Xu, F.; Liang, H.; Wang, Z.; Lin, L.; Chu, Z. A Real-Time Vehicle Detection Algorithm Based on Sparse Point Clouds and Dempster-Shafer Fusion Theory. In Proceedings of the 2018 IEEE International Conference on Information and Automation (ICIA), Fujian, China, 11–14 August 2018; pp. 597–602. [Google Scholar]
- Hafner, M.; Cunningham, D.; Caminiti, L.; Del Vecchio, D. Automated vehicle-to-vehicle collision avoidance at intersections. In Proceedings of the World Congress on Intelligent Transport Systems, Orlando, FL, USA, 16–20 October 2011. [Google Scholar]
- Deng, R.; Di, B.; Song, L. Cooperative Collision Avoidance for Overtaking Maneuvers in Cellular V2X-Based Autonomous Driving. IEEE Trans. Veh. Technol. 2019, 68, 4434–4446. [Google Scholar] [CrossRef]
- Gomes, P.; Olaverri-Monreal, C.; Ferreira, M. Making Vehicles Transparent Through V2V Video Streaming. IEEE Trans. Intell. Transp. Syst. 2012, 13, 930–938. [Google Scholar] [CrossRef]
- Lin, C.-T.; Lin, Y.-C.; Chen, L.-T.; Wang, Y.-F. Front vehicle blind spot translucentization based on augmented reality. In Proceedings of the 2013 IEEE 78th Vehicular Technology Conference (VTC Fall), Las Vegas, NV, USA, 2–5 September 2013; pp. 1–6. [Google Scholar]
- Liu, W.; Wei, L.S.; Li, Y.B. Occluded Street Objects Perception Algorithm of Intelligent Vehicles Based on 3D Projection Model. J. Adv. Transp. 2018, 2018, 1547276. [Google Scholar] [CrossRef] [Green Version]
- Azzaoui, N.; Korichi, A.; Brik, B.; Fekair, M.E.A.; Kerrache, C.A. Wireless communication in internet of vehicles networks: DSRC-based Vs cellular-based. In Proceedings of the 4th International Conference on Smart City Applications, Casablanca, Morocco, 2–4 October 2019; pp. 1–6. [Google Scholar]
- Mahmood, A.; Zhang, W.E.; Sheng, Q.Z. Software-defined heterogeneous vehicular networking: The architectural design and open challenges. Futur. Internet 2019, 11, 70. [Google Scholar] [CrossRef] [Green Version]
- Hartley, R.; Zisserman, A. Multiple View Geometry in Computer Vision, 2nd ed.; Cambridge University Press: Cambridge, UK, 2003. [Google Scholar]
- Lowe, D. Distinctive image feature from scale-invariant key points. Int. J. Comput. Vis. 1997, 60, 91–100. [Google Scholar] [CrossRef]
- Fischler, M.A.; Bolles, R.C. Random Sample Consensus: A Paradigm for Model Fitting with Applications to Image Analysis and Automated Cartography. Commun. ACM 1987, 24, 381–395. [Google Scholar] [CrossRef]
- Tosi, F.; Aleotti, F.; Poggi, M.; Mattoccia, S. Learning monocular depth estimation infusing traditional stereo knowledge. In Proceedings of the IEEE/CVF Conference on Computer Vision and Pattern Recognition, Long Beach, CA, USA, 15–20 June 2019; pp. 9791–9801. [Google Scholar]
- Geiger, A.; Lenz, P.; Stiller, C.; Urtasun, R. Vision meets robotics: The KITTI dataset. Int. J. Robot. Res. 2013, 32, 1231–1237. [Google Scholar] [CrossRef] [Green Version]


| Method | 1 | 2 | 3 | 4 | 5 | 6 | 7 | 8 | 9 | 10 |
|---|---|---|---|---|---|---|---|---|---|---|
| Affine in [19] | 0.232 | 0.329 | 0.556 | 0.420 | 0.447 | 0.618 | 0.329 | 0.428 | 0.278 | 0.461 |
| Deep-Affine | 0.687 | 0.818 | 0.601 | 0.462 | 0.845 | 0.676 | 0.512 | 0.575 | 0.425 | 0.738 |
Publisher’s Note: MDPI stays neutral with regard to jurisdictional claims in published maps and institutional affiliations. |
© 2021 by the authors. Licensee MDPI, Basel, Switzerland. This article is an open access article distributed under the terms and conditions of the Creative Commons Attribution (CC BY) license (https://creativecommons.org/licenses/by/4.0/).
Share and Cite
Liu, W.; Ma, Y.; Gao, M.; Duan, S.; Wei, L. Cooperative Visual Augmentation Algorithm of Intelligent Vehicle Based on Inter-Vehicle Image Fusion. Appl. Sci. 2021, 11, 11917. https://doi.org/10.3390/app112411917
Liu W, Ma Y, Gao M, Duan S, Wei L. Cooperative Visual Augmentation Algorithm of Intelligent Vehicle Based on Inter-Vehicle Image Fusion. Applied Sciences. 2021; 11(24):11917. https://doi.org/10.3390/app112411917
Chicago/Turabian StyleLiu, Wei, Yun Ma, Mingqiang Gao, Shuaidong Duan, and Longsheng Wei. 2021. "Cooperative Visual Augmentation Algorithm of Intelligent Vehicle Based on Inter-Vehicle Image Fusion" Applied Sciences 11, no. 24: 11917. https://doi.org/10.3390/app112411917