
Influence of Contamination of Gear Oils in Relation to Time of Operation on Their Lubricity

 ,
,  , , ,
, , ,  , and
, and
Abstract
:1. Introduction
2. Materials and Methods
3. Results and Discussion
4. Conclusions
- The used oils can be characterized by a significant number of large contaminant particles. According to normative requirements and operational experience, this indicates their inability to be used to their full potential. The results of the friction tests indicate that the exploitation use of oil 75W-140 occurred after 350,000 km of mileage. It also applies to oil 75W-90, which had a much lower mileage but worked in a gearbox. Moreover, the comparison of the results of the lubricity tests and the amount of particles due to the amount of contaminants does not indicate a correlation between the degree of oil contamination and lubricity. A higher share of particles that were several dozen micrometres in size was found in the used oils. It is possible that these large particles, which also present in other products of wear, are also suspended in oil.
- In the light of the conducted research, it seems reasonable to hypothesize that the use of fluids in the expected operational runs does not cause a critical deterioration of the lubricating and anti-wear properties. The deterioration in the properties is non-catastrophic.
- Unfortunately, the current research has not allowed us to check how long the liquid work time in a gearbox and axle must be in order to reach critical deterioration.
Author Contributions
Funding
Institutional Review Board Statement
Informed Consent Statement
Conflicts of Interest
References
- Lonkwic, P.; Przystupa, K.; Krakowski, T.; Ruta, H. Case Study of Support Frame Optimization Using a Distant Load. Sustainability 2020, 12, 974. [Google Scholar] [CrossRef] [Green Version]
- Pieniak, D.; Przystupa, K.; Walczak, A.; Niewczas, A.M.; Krzyzak, A.; Bartnik, G.; Gil, L.; Lonkwic, P. Hydro-Thermal Fatigue of Polymer Matrix Composite Biomaterials. Materials 2019, 12, 3650. [Google Scholar] [CrossRef] [Green Version]
- Ahmadi Moghaddam, H.; Mertiny, P. Stochastic finite element analysis framework for modelling thermal conductivity of particulate modified polymer composites. Results Phys. 2018, 11, 905–914. [Google Scholar] [CrossRef]
- Pytka, J.; Budzyński, P.; Józwik, J.; Michałowska, J.; Tofil, A.; Łyszczyk, T.; Błażejczak, D. Application of GNSS/INS and an Optical Sensor for Determining Airplane Takeoff and Landing Performance on a Grassy Airfield. Sensors 2019, 19, 5492. [Google Scholar] [CrossRef] [PubMed] [Green Version]
- Kozłowski, E.; Mazurkiewicz, D.; Żabiński, T.; Prucnal, S.; Sęp, J. Assessment model of cutting tool condition for real-time supervision system. Eksploat. Niezawodn. 2019, 21, 679–685. [Google Scholar] [CrossRef]
- Wang, J.; Kochan, O.; Przystupa, K.; Su, J. Information-measuring System to Study the Thermocouple with Controlled Temperature Field. Meas. Sci. Rev. 2019, 19, 161–169. [Google Scholar] [CrossRef] [Green Version]
- Mikhalieva, M.; Odosii, L.; Shabatura, Y.; Lunkova, H.; Hots, N.; Przystupa, K.; Atamaniuk, V. Electrical method for the cyberphysical control system of non-electrical objects. Przegląd Elektrotechniczny 2019, 12, 200–203. [Google Scholar] [CrossRef]
- Bansal, V.; Kim, K.H. Review of PAH contamination in food products and their health hazards. Environ. Int. 2015, 84, 26–38. [Google Scholar] [CrossRef] [PubMed]
- Krzeminski, A.; Wohlhüter, S.; Heyer, P.; Utz, J.; Hinrichs, J. Measurement of lubricating properties in a tribosystem with different surface roughness. Int. Dairy J. 2012, 26, 23–30. [Google Scholar] [CrossRef]
- Kandeva, M.; Panov, I.V.; Dochev, B. Effects of nanomodifiers on the wear resistance of aluminum-silicon alloy alsi18 in tribosystems in case of reversive friction and lubrication. J. Balk. Tribol. Assoc. 2020, 26, 637–652. [Google Scholar]
- Vojtov, V.A.; Kravtsov, A.G.; Tsymbal, B.M. Evaluation of Tribotechnical Characteristics for Tribosystems in the Presence of Fullerenes in the Lubricant. J. Frict. Wear. 2020, 41, 521–525. [Google Scholar] [CrossRef]
- Skoć, A.; Spałek, J.; Markusik, S. Podstawy Konstrukcji Maszyn Tom 2; WNT: Warsaw, Poland, 2008. [Google Scholar]
- Bapat, S.; Malshe, A.P. Understanding the fundamentals of the texture and tribofilm evolution. Procedia Manuf. 2020, 48, 223–229. [Google Scholar] [CrossRef]
- Deng, F.; Zhu, Y.; Li, K.; Feng, Q.; Yang, K.; Huang, F. Tetraphenylethylene/tea saponin derivative nanocomposites for tribofilm visualization and efficient lubrication. Comp. Part B Eng. 2021, 215, 108787. [Google Scholar] [CrossRef]
- Bair, S.; Thirteen, C. Application to Elastohydrodynamic Friction. In High Pressure Rheology for Quantitative Elastohydrodynamics, 2nd ed.; Bair, S., Ed.; Elsevier: Amsterdam, The Netherlands, 2019; pp. 327–353. [Google Scholar]
- Thangarasu, V.; Anand, R. Physicochemical fuel properties and tribological behavior of aegle marmelos correa biodiesel. In Advances in Eco-Fuels for a Sustainable Environment; Azad, K., Ed.; Woodhead Publishing Series in Energy; Woodhead Publishing: Sawston, UK, 2019; pp. 309–336. [Google Scholar]
- Hutchings, I.; Shipway, P. Lubricants and lubrication. In Tribology, 2nd ed.; Hutchings, I., Shipway, P., Eds.; Butterworth-Heinemann: Oxford, UK, 2017; pp. 79–105. [Google Scholar]
- Zajezierska, A. Lubricating of rolling bearings. Nafta-Gaz 2009, 65, 982–992. (In Polish) [Google Scholar]
- Oleksiak, S. Energy efficient gear oils. Nafta-Gaz 2016, 72, 1137–1143. (In Polish) [Google Scholar] [CrossRef]
- Przystupa, K.; Ambrożkiewicz, B.; Litak, G. Diagnostics of Transient States in Hydraulic Pump System with Short Time Fourier Transform. Adv. Sci. Technol. Res. J. 2020, 14, 178–183. [Google Scholar] [CrossRef]
- Spałek, J.; Kwaśny, M.; Bochenek, S. Analysis of power losses in the meshing of a cylindrical gear. Szybkobieżne Pojazdy Gąsienicowe 2010, 1, 63–70. (In Polish) [Google Scholar]
- ISO 4406:2021 Hydraulic Fluid Power—Fluids—Method for Coding the Level of Contamination by Solid Particles; ISO: Geneva, Switzerland, 2021.
- Gil, L.; Pieniak, D.; Walczak, M.; Ignaciuk, P.; Sawa, J. Impact of acid number of fuels on the wear process of apparatus for fuel injection in diesel engines. Adv. Sci. Technol. Res. J. 2014, 8, 54–57. [Google Scholar]
- Ignaciuk, P.; Gil, L. Damages to injectors in diesel engines. Adv. Sci. Technol. Res. J. 2014, 8, 58–61. [Google Scholar]
- Cameron, A.C.; Windmeijer, F.A. An R-squared measure of goodness of fit for some common nonlinear regression models. J. Econom. 1997, 77, 329–342. [Google Scholar] [CrossRef]
- Krawiec, S. Compositions of Plastic and Solid Lubricants in the Process of Friction of Steel Machine Nodes; PWR: Wrocław, Poland, 2011. (In Polish) [Google Scholar]
- Harperscheid, M. Engine Oils. In Encyclopedia of Lubricants and Lubrication; Mang, T., Ed.; Springer: Berlin/Heidelberg, Germany, 2014. [Google Scholar] [CrossRef]
- Mang, T. (Ed.) Lubricity. In Encyclopedia of Lubricants and Lubrication; Springer: Berlin/Heidelberg, Germany, 2014. [Google Scholar] [CrossRef]
- Bartels, T.; Bock, W. Gear Lubrication Oils. In Lubricants and Lubrication; Dresel, W., Mang, T., Eds.; Wiley: Hoboken, NJ, USA, 2017. [Google Scholar] [CrossRef]
- Naikan, V.N.A.; Kapur, S. Reliability modelling and analysis of automobile engine oil. Proc. Inst. Mech. Eng. Part D J. Automob. Eng. 2006, 220, 187–194. [Google Scholar] [CrossRef]
- Totten, G.E.; Tung, S.C. Automotive Lubricants and Testing R-428; SAE International and ASTM: West Conshohocken, PA, USA, 2012; p. 504. [Google Scholar]
- PKN. PN-EN 61014:2007 Programmers for Reliability Growth; PKN: Warsaw, Poland, 2007. [Google Scholar]
- Chmielewski, Z.; Stobiecki, J.; Górska, M. The concept of evaluation of reliability of modern engine oils in operation. Autobusy–Technika, Eksploatacja, Systemy Transportowe 2018, 19, 337–340. [Google Scholar] [CrossRef]
- Mang, T. (Ed.) Oil Analyses for Used Oils. In Encyclopedia of Lubricants and Lubrication; Springer: Berlin/Heidelberg, Germany, 2014. [Google Scholar] [CrossRef]
- Dziubak, T. Operating fluids contaminantions and their effect on the wear of elements of a motor vehicle’s combustion engine. Arch. Automot. Eng. 2016, 72, 43–72. [Google Scholar]
- Laber, A. Modyfikowanie warunków pracy węzła tarcia olejami z dodatkami eksploatacyjnymi na bazie środków smarnych stałych. Tribologia 2011, 5, 137–145. [Google Scholar]
- Bloch, H. (Ed.) Practical Lubrication for Industrial Facilities; The Fairmont Press, Inc.: Lilburn, GA, USA, 2009. [Google Scholar]
- Becker, E.P. Trends in tribological materials and engine technology. Trib. Int. 2004, 37, 569–575. [Google Scholar] [CrossRef]
- Syedhidayat, S.; Wang, Q.; Mohsen, A.H.M.; Wang, J. Choice and Exchange of Lubricating Oil for Injection Molding Machine. Recent Pat. Mech. Eng. 2019, 12, 378–382. [Google Scholar] [CrossRef]


| Oil | Mileage (km) | Gearbox | Min | Max | Mean | Std. Dev. |
|---|---|---|---|---|---|---|
| 75W-140 | fresh oil | axle | 0.0600 | 0.1374 | 0.0979 | 0.0142 |
| 75W-140 | 350,000 | axle | 0.0298 | 0.1193 | 0.1020 | 0.0086 |
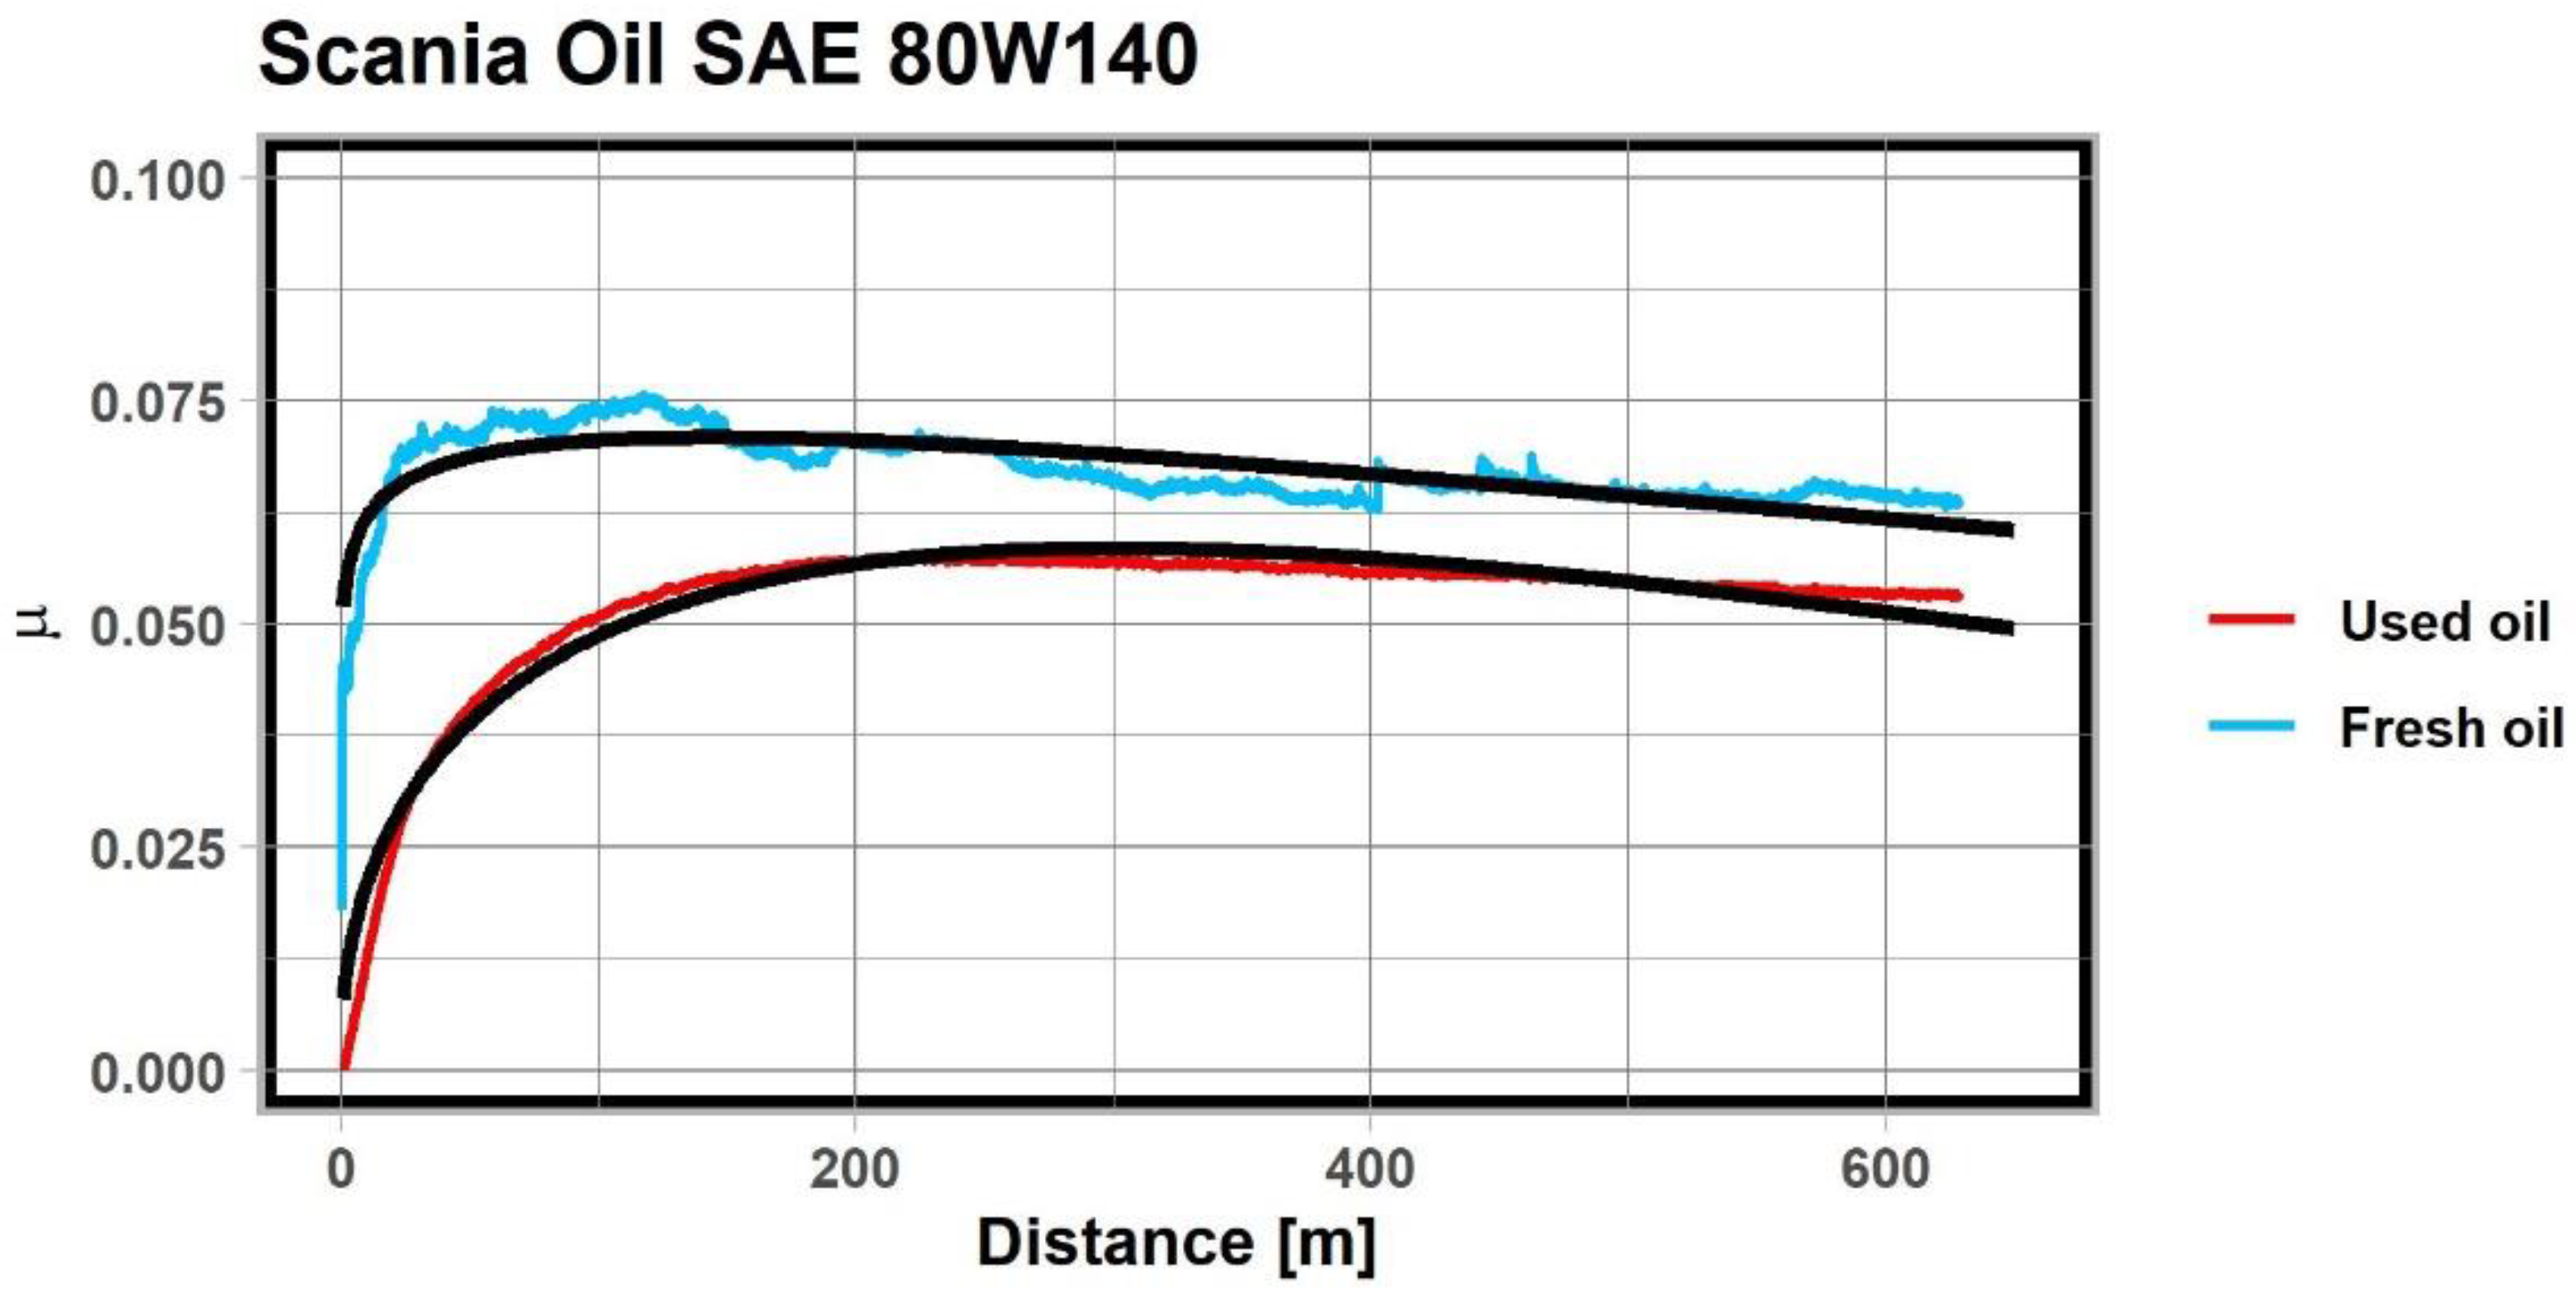
| 80W-140 | fresh oil | axle | 0.0177 | 0.0984 | 0.0671 | 0.0136 |
| 80W-140 | 220,000 | axle | 0.0032 | 0.0582 | 0.0523 | 0.0091 |
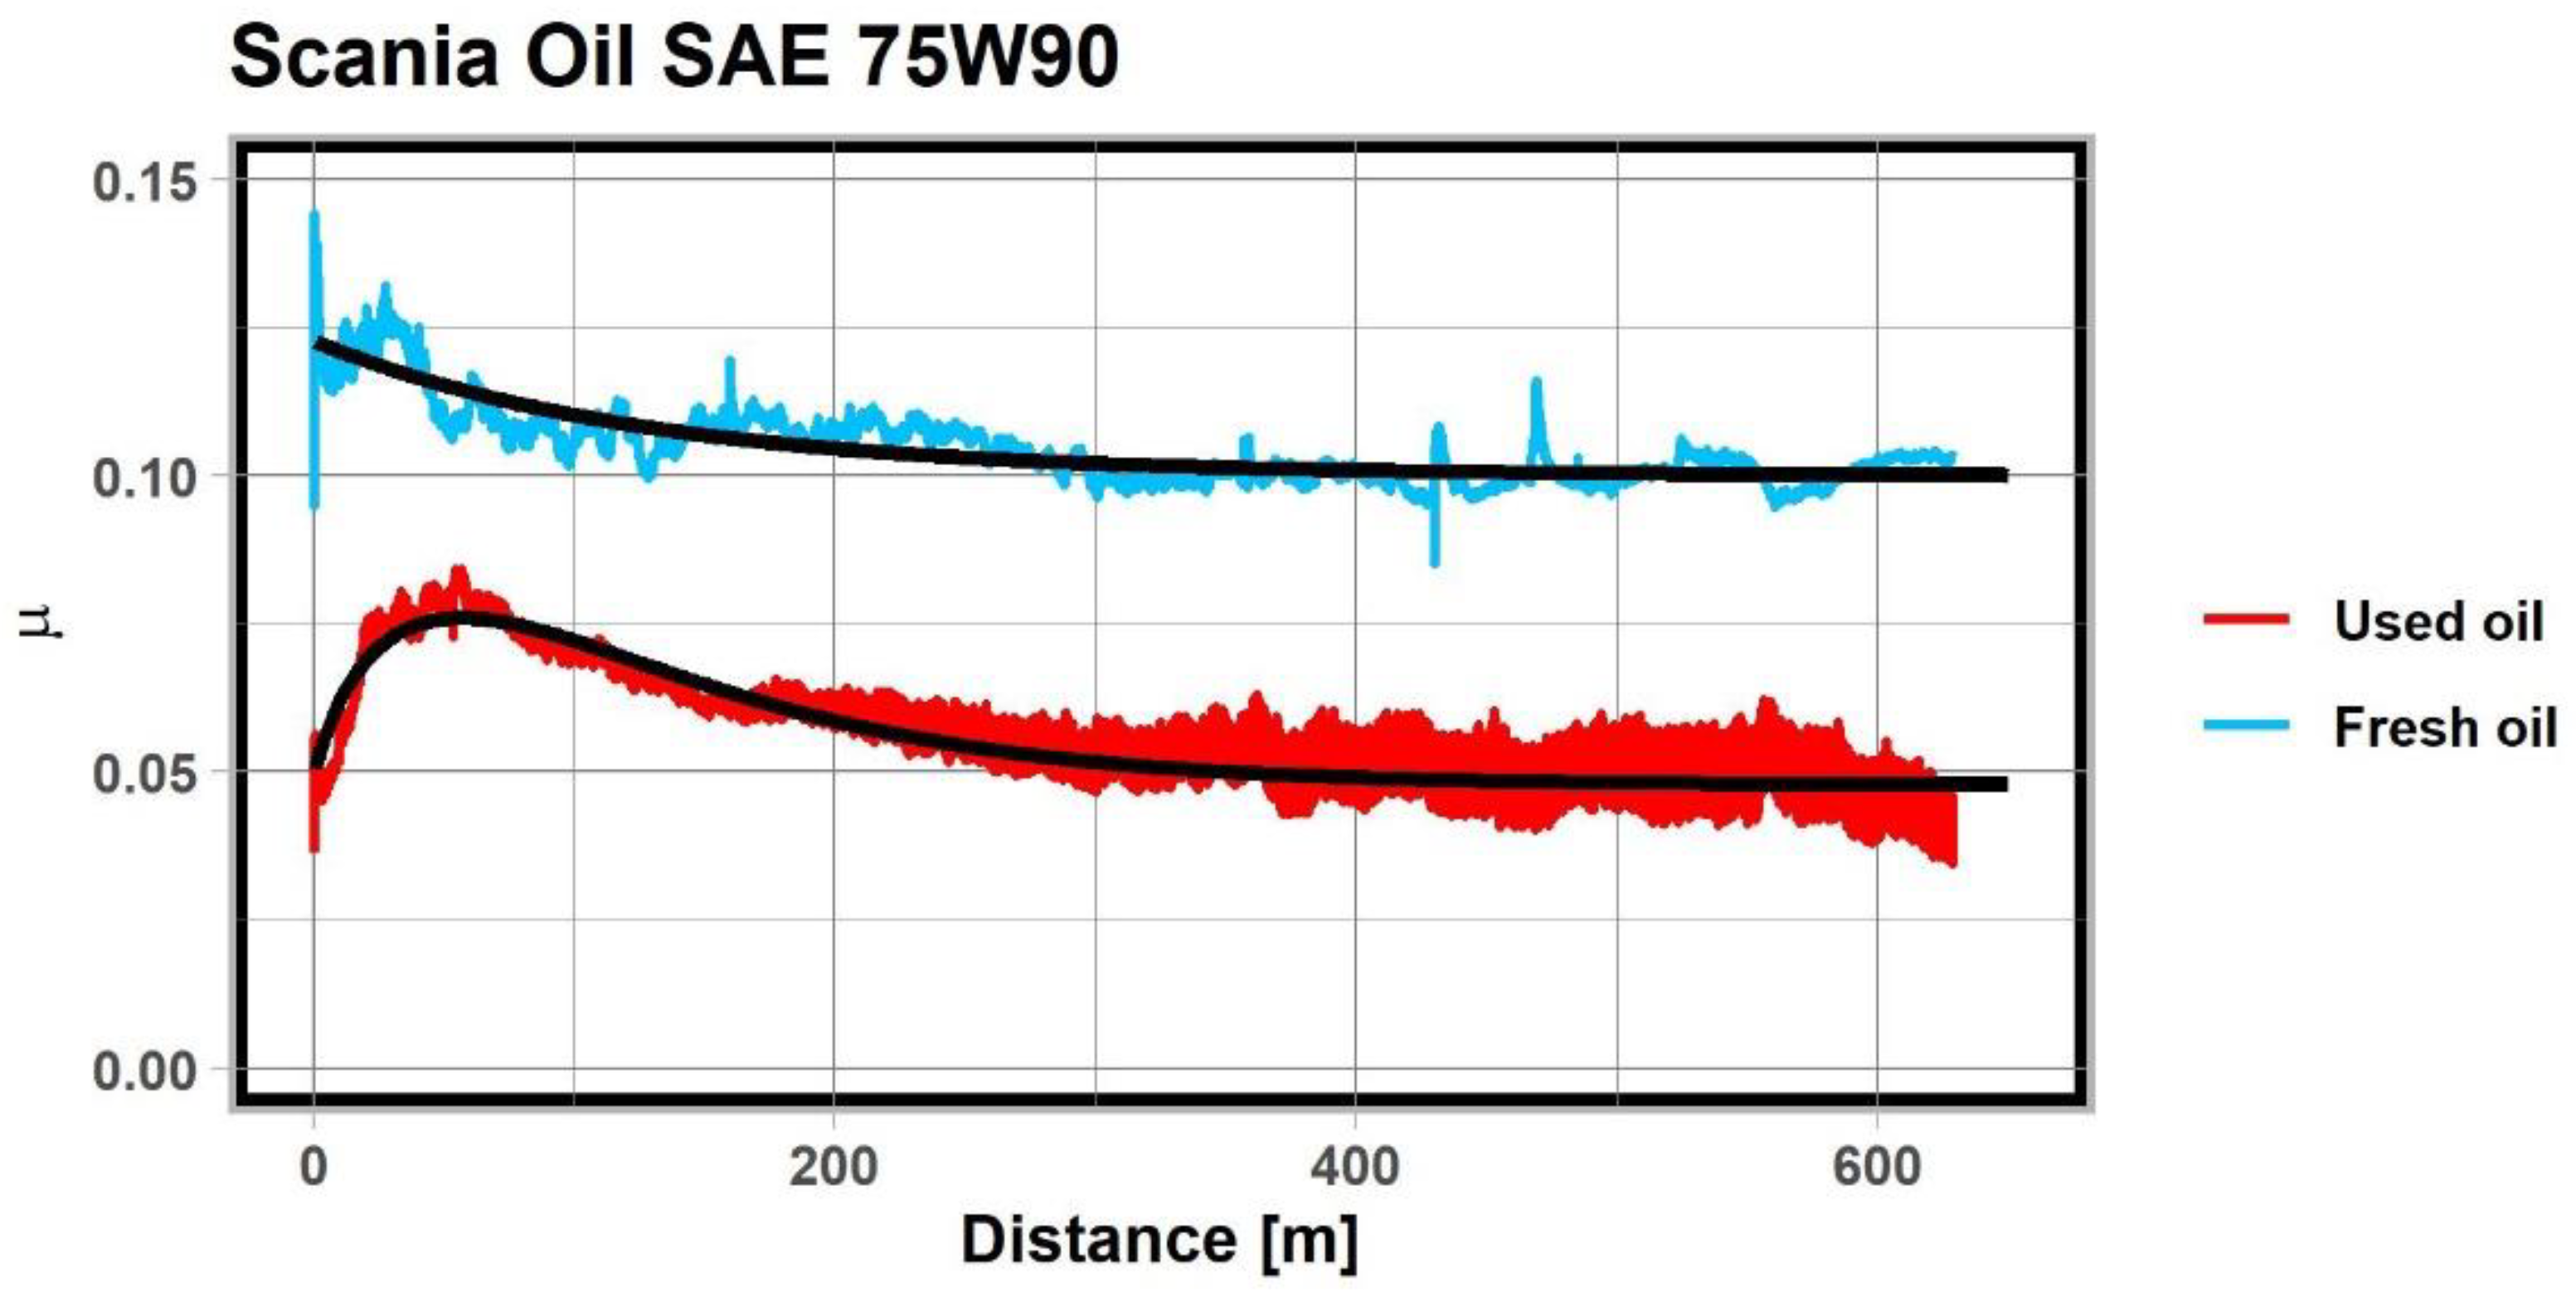
| 75W-90 | fresh oil | gearbox | 0.0753 | 0.1566 | 0.1046 | 0.0075 |
| 75W-90 | 210,000 | gearbox | 0.0345 | 0.0908 | 0.0655 | 0.0102 |
| Type | 75W90 | 75W90 | 80W140 | 80W140 | 75W140 | 75W140 |
|---|---|---|---|---|---|---|
| Category | Used oil | Fresh oil | Used oil | Fresh oil | Used oil | Fresh oil |
| 0.04784 | 0.09997 | 0.00000 | 0.00025 | 0.01341 | 0.08129 | |
| 0.00276 | 0.02276 | 0.00798 | 0.05168 | 0.07399 | 0.03602 | |
| 0.76353 | 0.00000 | 0.42336 | 0.07891 | 0.05117 | 0.03766 | |
| 0.01342 | 0.00801 | 0.00141 | 0.00055 | 0.00034 | 0.00386 | |
| SSE | 0.31497 | 0.32592 | 0.06434 | 0.13916 | 0.21841 | 0.33773 |
| SST | 2.07269 | 1.22027 | 1.38345 | 0.38203 | 0.35047 | 2.93344 |
| 0.84804 | 0.73291 | 0.95349 | 0.63573 | 0.37680 | 0.88487 |
| Fresh Oil | Oil after 350,000 km | |
|---|---|---|
| –0.00674 *** | –0.00227 *** | |
| (Std. Error) | (0.00024) | (0.00011) |
| 1.40932 *** | 1.40508 *** | |
| (Std. Error) | (0.00812) | (0.0037) |
| Observations | 89 | 90 |
| 0.89971 | 0.83432 | |
| Adjusted | 0.89856 | 0.83244 |
| Residual Std. Error | 0.05120 (df = 87) | 0.02341(df = 88) |
| F Statistic | 780.524 ***(df = 1; 87) | 443.1412 ***(df = 1; 88) |
| Fresh Gear Oil | Oil after 220,000 km | |
|---|---|---|
| –0.00578 *** | –0.00181 *** | |
| (Std. Error) | (0.00017) | (0.00007) |
| 1.43028 *** | 1.40962 *** | |
| (Std. Error) | (0.00599) | (0.00224) |
| Observations | 90 | 90 |
| 0.92529 | 0.89762 | |
| Adjusted | 0.92444 | 0.89645 |
| Residual Std. Error | 0.03792 (df = 88) | 0.01415 (df = 88) |
| F Statistic | 1.089.854 ***(df = 1; 88) | 771.511 ***(df = 1; 88) |
| Fresh Gear Oil | Oil after 210,000 km | |
|---|---|---|
| –0.00561 *** | –0.00260 *** | |
| (Std. Error) | (0.00013) | (0.00011) |
| 1.41607 *** | 1.41604 *** | |
| (Std. Error) | (0.00449) | (0.00369) |
| Observations | 90 | 90 |
| 0.95418 | 0.86863 | |
| Adjusted | 0.95366 | 0.867174 |
| Residual Std. Error | 0.02843 (df = 88) | 0.02339 (df = 88) |
| F Statistic | 1.932.421 *** (df = 1; 88) | 581.8797 *** (df = 1; 88) |
Publisher’s Note: MDPI stays neutral with regard to jurisdictional claims in published maps and institutional affiliations. |
© 2021 by the authors. Licensee MDPI, Basel, Switzerland. This article is an open access article distributed under the terms and conditions of the Creative Commons Attribution (CC BY) license (https://creativecommons.org/licenses/by/4.0/).
Share and Cite
Gil, L.; Przystupa, K.; Pieniak, D.; Kozłowski, E.; Antosz, K.; Gauda, K.; Izdebski, P. Influence of Contamination of Gear Oils in Relation to Time of Operation on Their Lubricity. Appl. Sci. 2021, 11, 11835. https://doi.org/10.3390/app112411835
Gil L, Przystupa K, Pieniak D, Kozłowski E, Antosz K, Gauda K, Izdebski P. Influence of Contamination of Gear Oils in Relation to Time of Operation on Their Lubricity. Applied Sciences. 2021; 11(24):11835. https://doi.org/10.3390/app112411835
Chicago/Turabian StyleGil, Leszek, Krzysztof Przystupa, Daniel Pieniak, Edward Kozłowski, Katarzyna Antosz, Konrad Gauda, and Paweł Izdebski. 2021. "Influence of Contamination of Gear Oils in Relation to Time of Operation on Their Lubricity" Applied Sciences 11, no. 24: 11835. https://doi.org/10.3390/app112411835