Figure 1.
Heavy-haul train and LVT scene in the tunnel. (a) Design diagram of LVT section in tunnel and (b) LVT construction scene in the tunnel.
Figure 1.
Heavy-haul train and LVT scene in the tunnel. (a) Design diagram of LVT section in tunnel and (b) LVT construction scene in the tunnel.
Figure 2.
Vehicle dynamics model of heavy haul train. (a) Bogie model and (b) Vehicle body model.
Figure 2.
Vehicle dynamics model of heavy haul train. (a) Bogie model and (b) Vehicle body model.
Figure 3.
A sample of random track irregularities in the U.S. five-level spectrum. (a) Random irregularity samples of the left rail: vertical, lateral (b) Random irregularity samples on the right rail: vertical, lateral.
Figure 3.
A sample of random track irregularities in the U.S. five-level spectrum. (a) Random irregularity samples of the left rail: vertical, lateral (b) Random irregularity samples on the right rail: vertical, lateral.
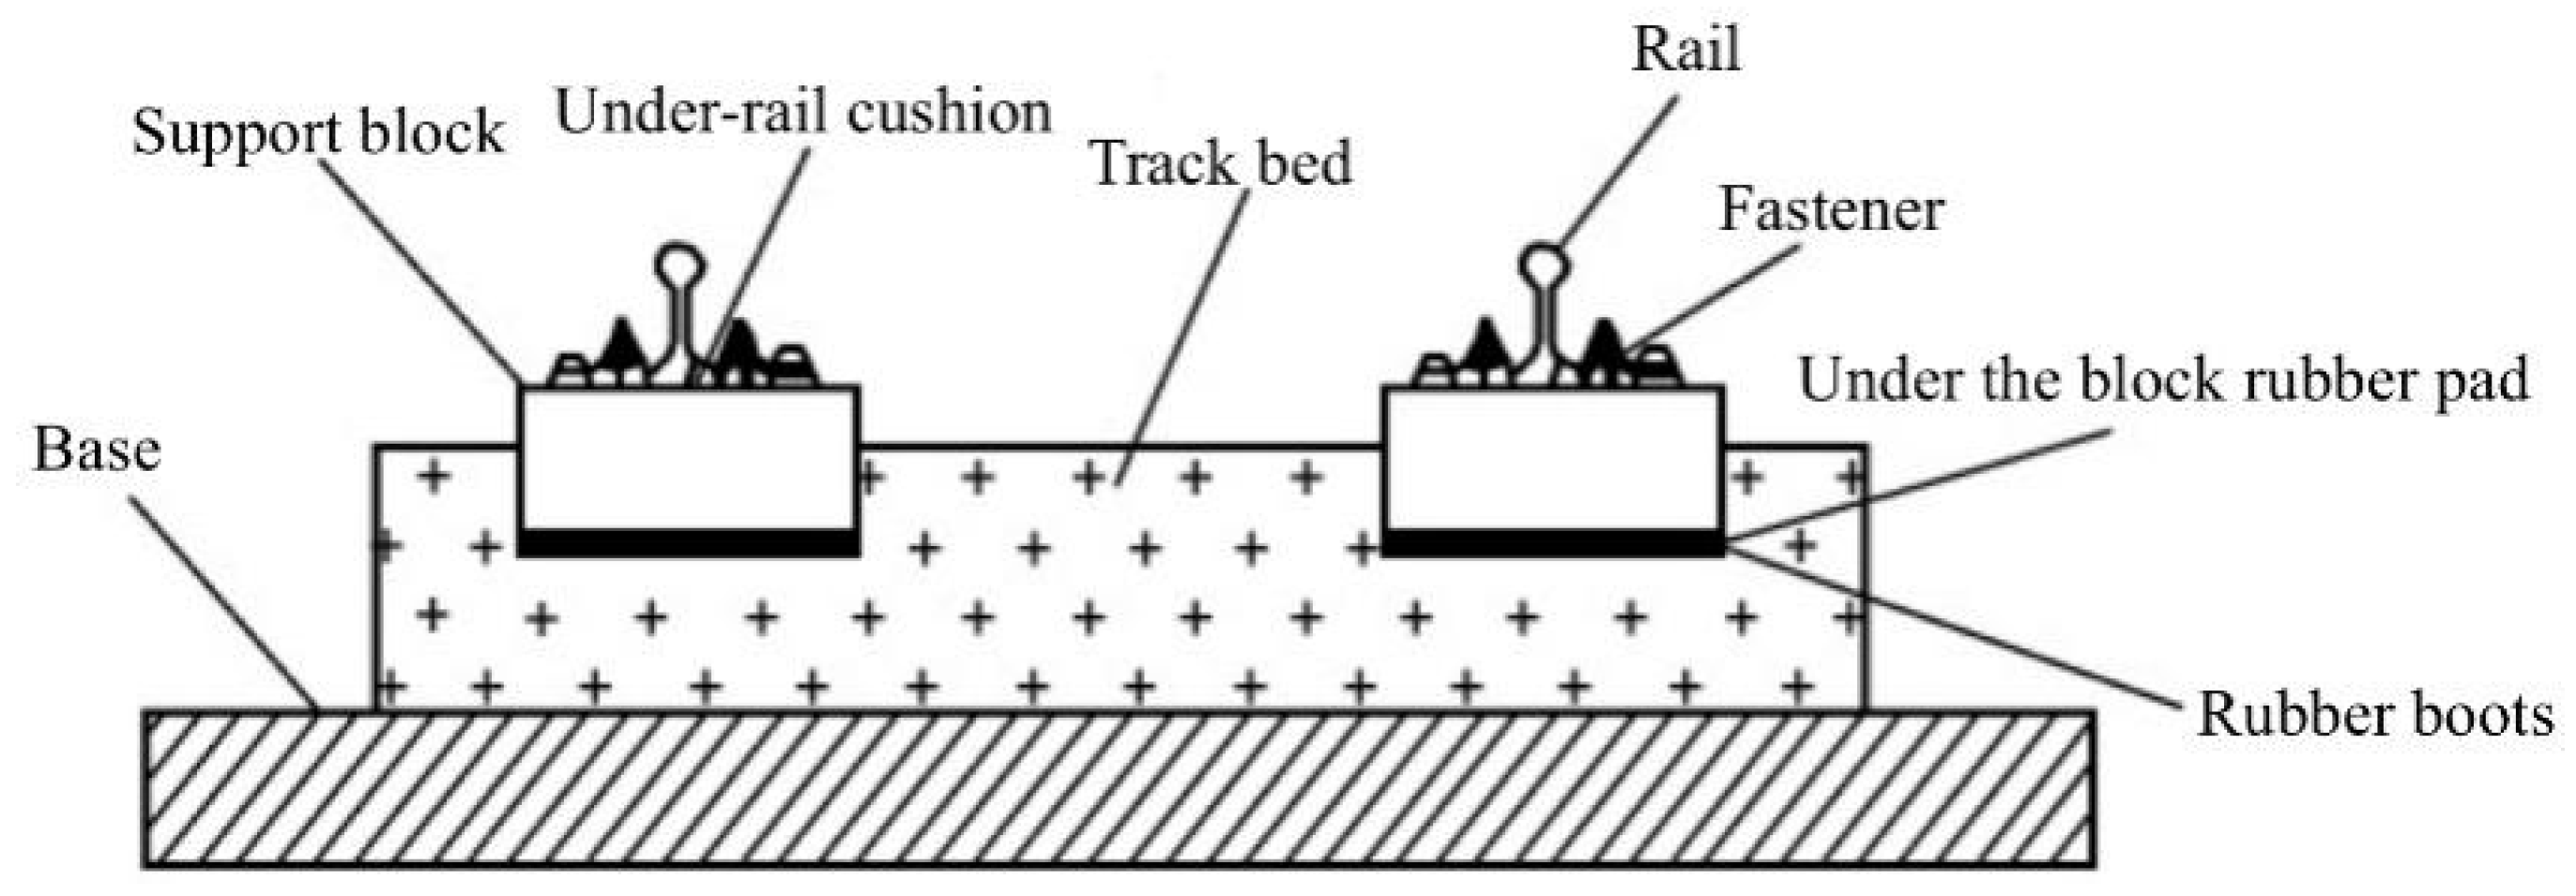
Figure 4.
The LVT structure.
Figure 4.
The LVT structure.
Figure 5.
Schematic diagram of wheel-rail contact model.
Figure 5.
Schematic diagram of wheel-rail contact model.
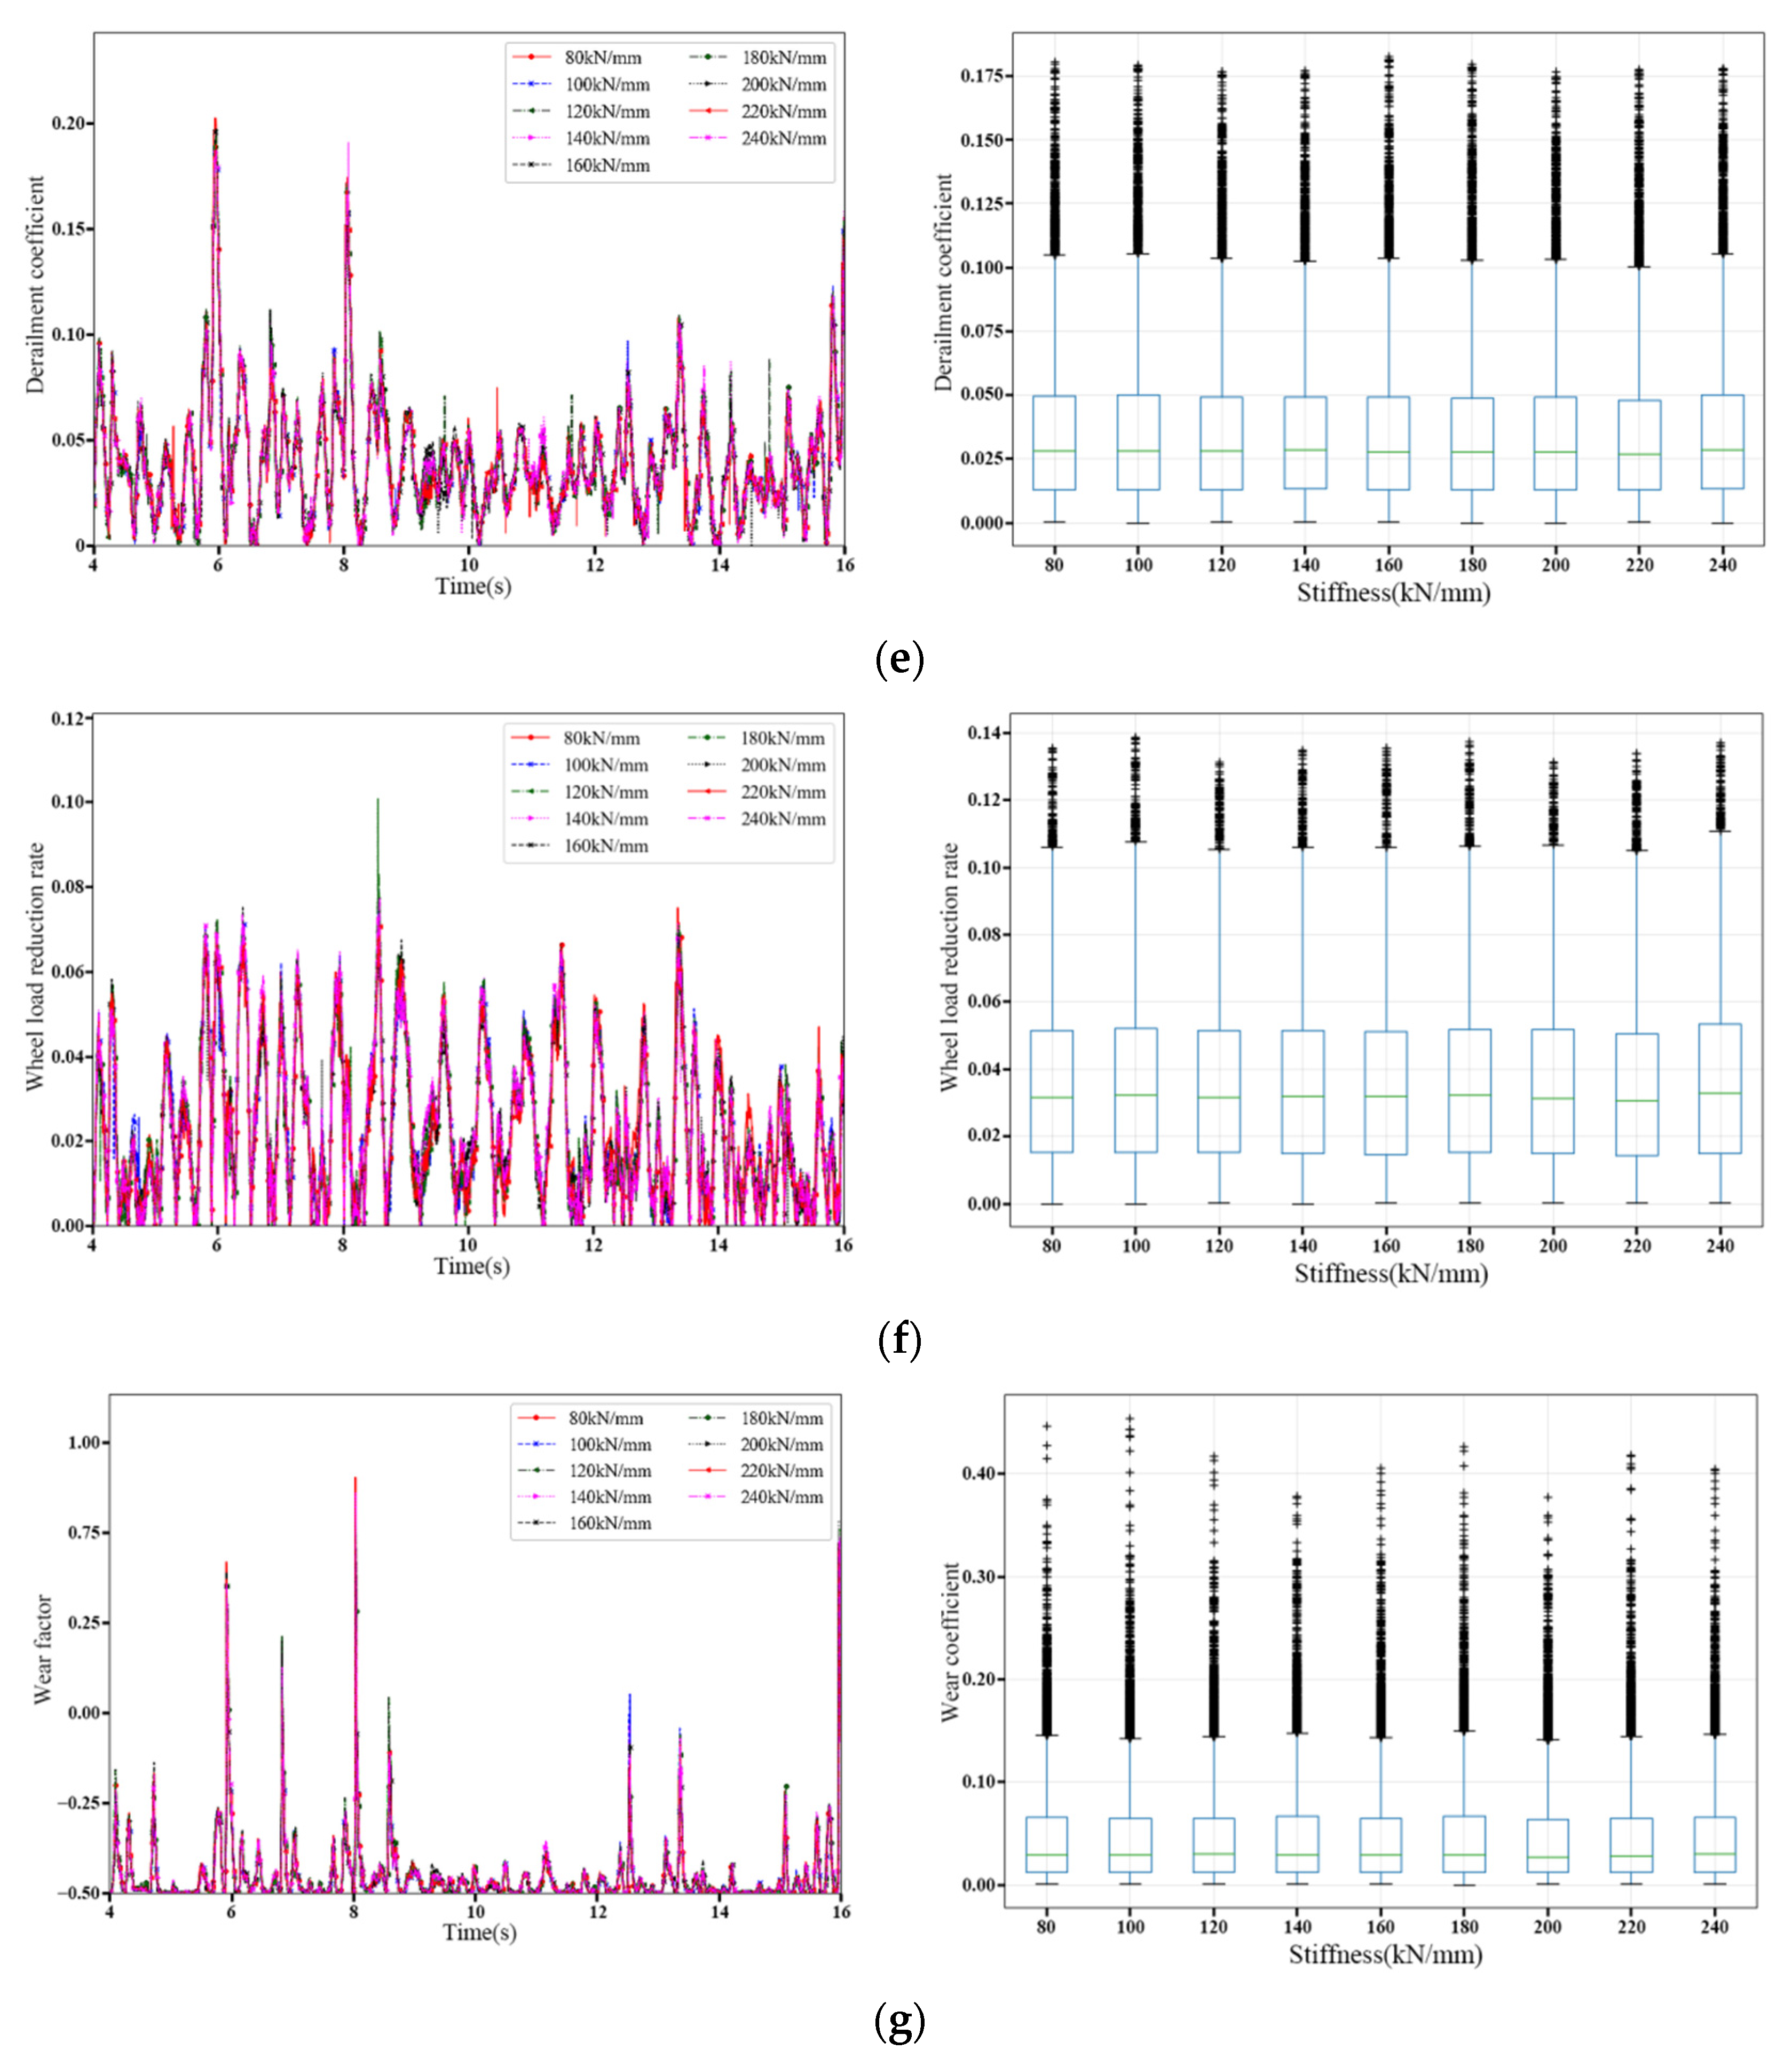
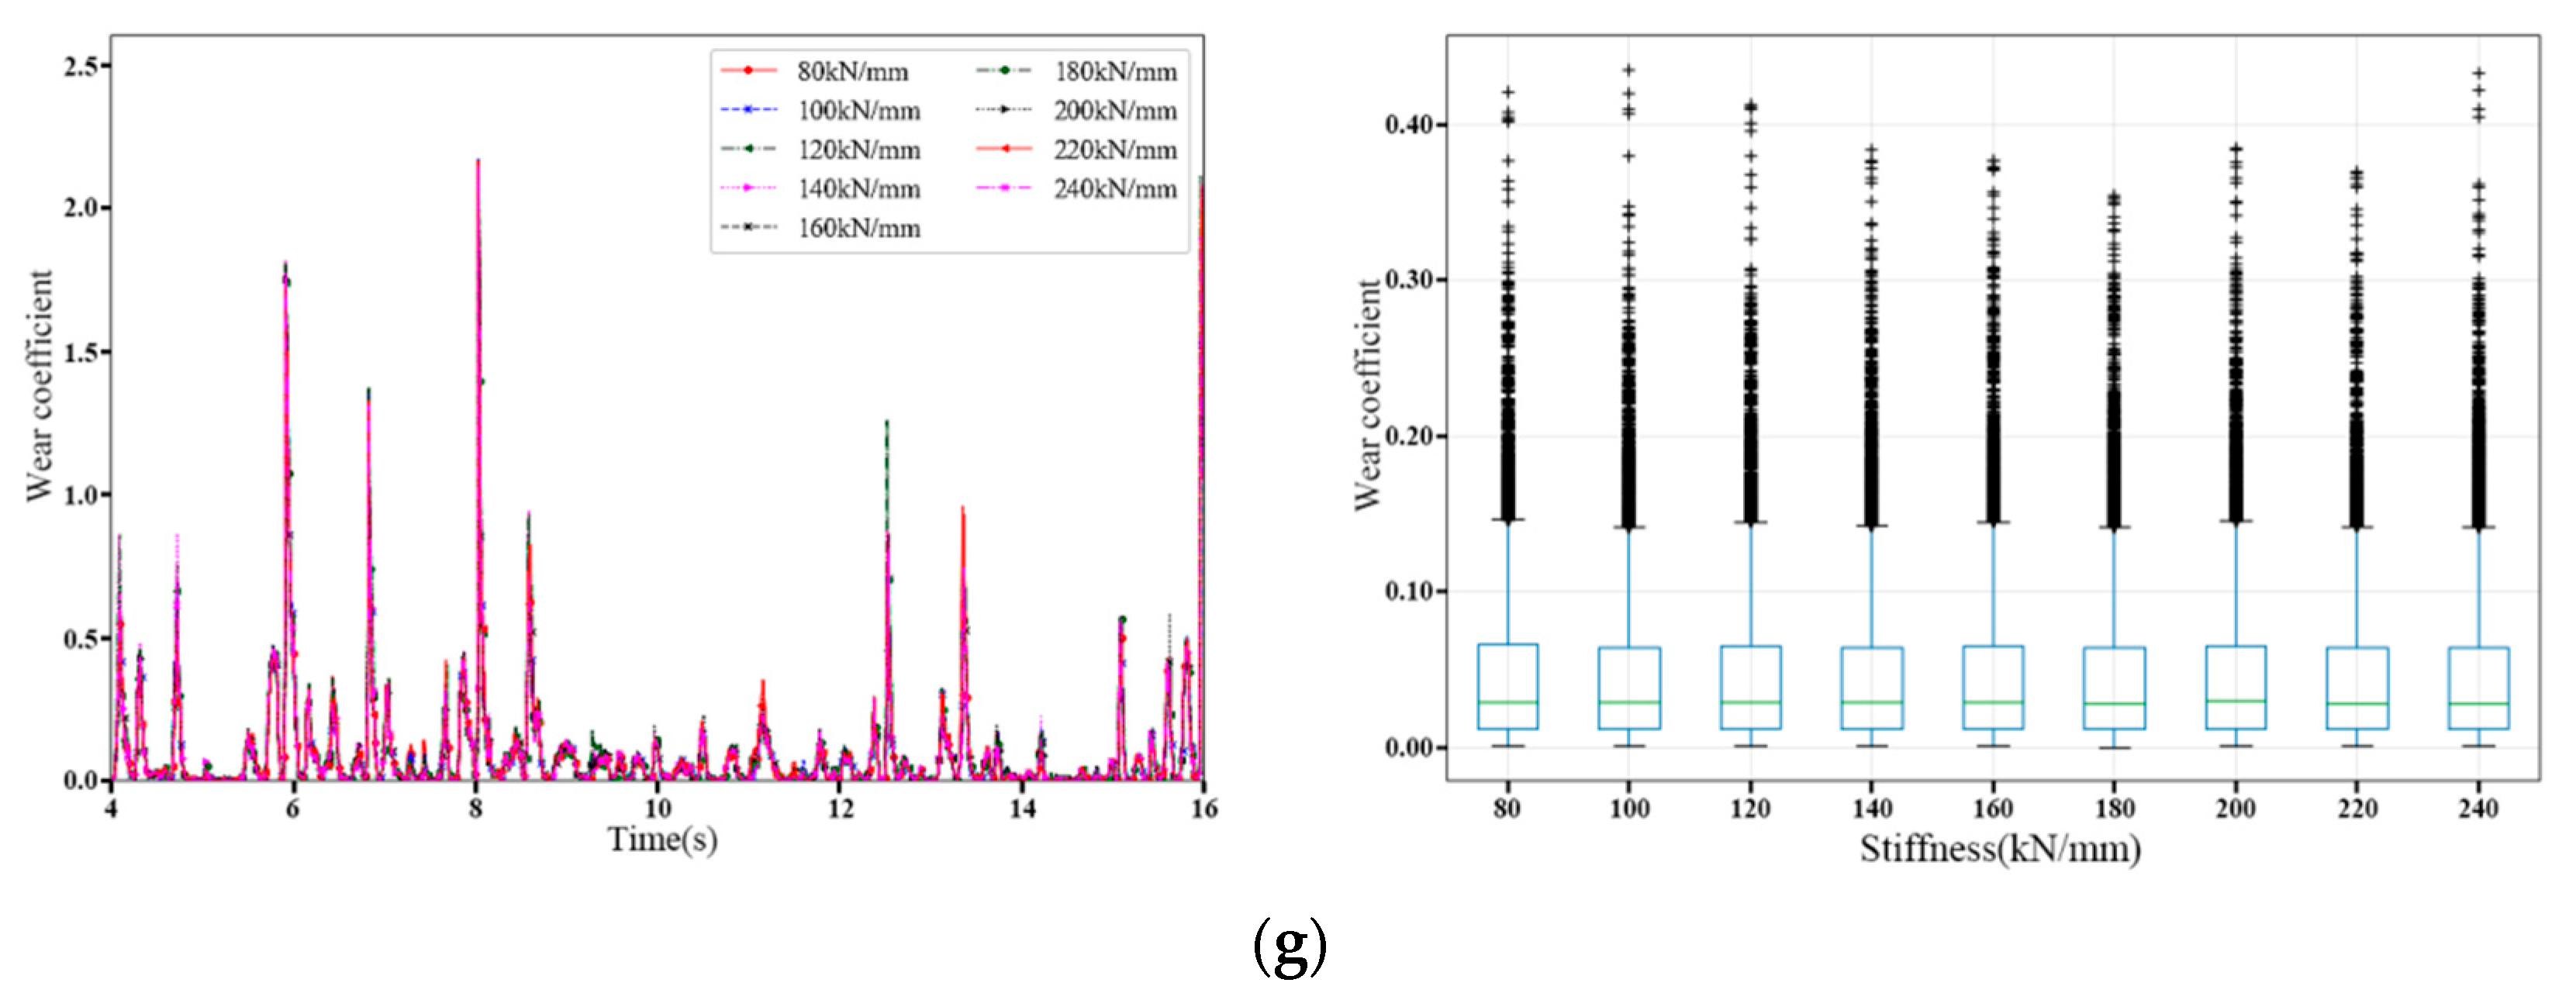
Figure 6.
Variations in the stability coefficient under different vertical stiffness under rail. (a) Vehicle body lateral acceleration change: left-time history waveform, right-maximum, (b) Vehicle body vertical acceleration change: left-time history waveform, right-maximum, (c) wheel-rail vertical force change: left-time history curve, right-statistical distribution, (d) wheel-rail lateral force change: left-time history curve, right-statistical distribution, (e) Derailment coefficient change: left-time history curve, right-statistical distribution, (f) Wheel load shedding rate change: left-time history curve, right-statistical distribution and (g) Wear coefficient change: left-time history curve, right-statistical distribution.
Figure 7.
Variations in the stability coefficient under different lateral stiffness under rail. (a) Vehicle body lateral acceleration change: left-time history waveform, right-maximum, (b) Vehicle body vertical acceleration change: left-time history waveform, right-maximum, (c) wheel-rail vertical force change: left-time history curve, right-statistical distribution, (d) wheel-rail lateral force change: left-time history curve, right-statistical distribution, (e) Derailment coefficient change: left-time history curve, right-statistical distribution, (f) Wheel load shedding rate change: left-time history curve, right-statistical distribution and (g) Wear coefficient change: left-time history curve, right-statistical distribution.
Figure 8.
Variations in the stability coefficients under different vertical stiffness under block. (a) Vehicle body lateral acceleration change: left-time history waveform, right-maximum, (b) Vehicle body vertical acceleration change: left-time history waveform, right-maximum, (c) wheel-rail vertical force change: left-time history curve, right-statistical distribution, (d) wheel-rail lateral force change: left-time history curve, right-statistical distribution, (e) Derailment coefficient change: left-time history curve, right-statistical distribution, (f) Wheel load shedding rate change: left-time history curve, right-statistical distribution and (g) Wear coefficient change: left-time history curve, right-statistical distribution.
Figure 9.
Variations in the stability coefficients under different lateral stiffness under block. (a) Vehicle body lateral acceleration change: left-time history waveform, right-maximum, (b) Vehicle body vertical acceleration change: left-time history waveform, right-maximum, (c) wheel-rail vertical force change: left-time history curve, right-statistical distribution, (d) wheel-rail lateral force change: left-time history curve, right-statistical distribution, (e) Derailment coefficient change: left-time history curve, right-statistical distribution, (f) Wheel load shedding rate change: left-time history curve, right-statistical distribution and (g) Wear coefficient change: left-time history curve, right-statistical distribution.
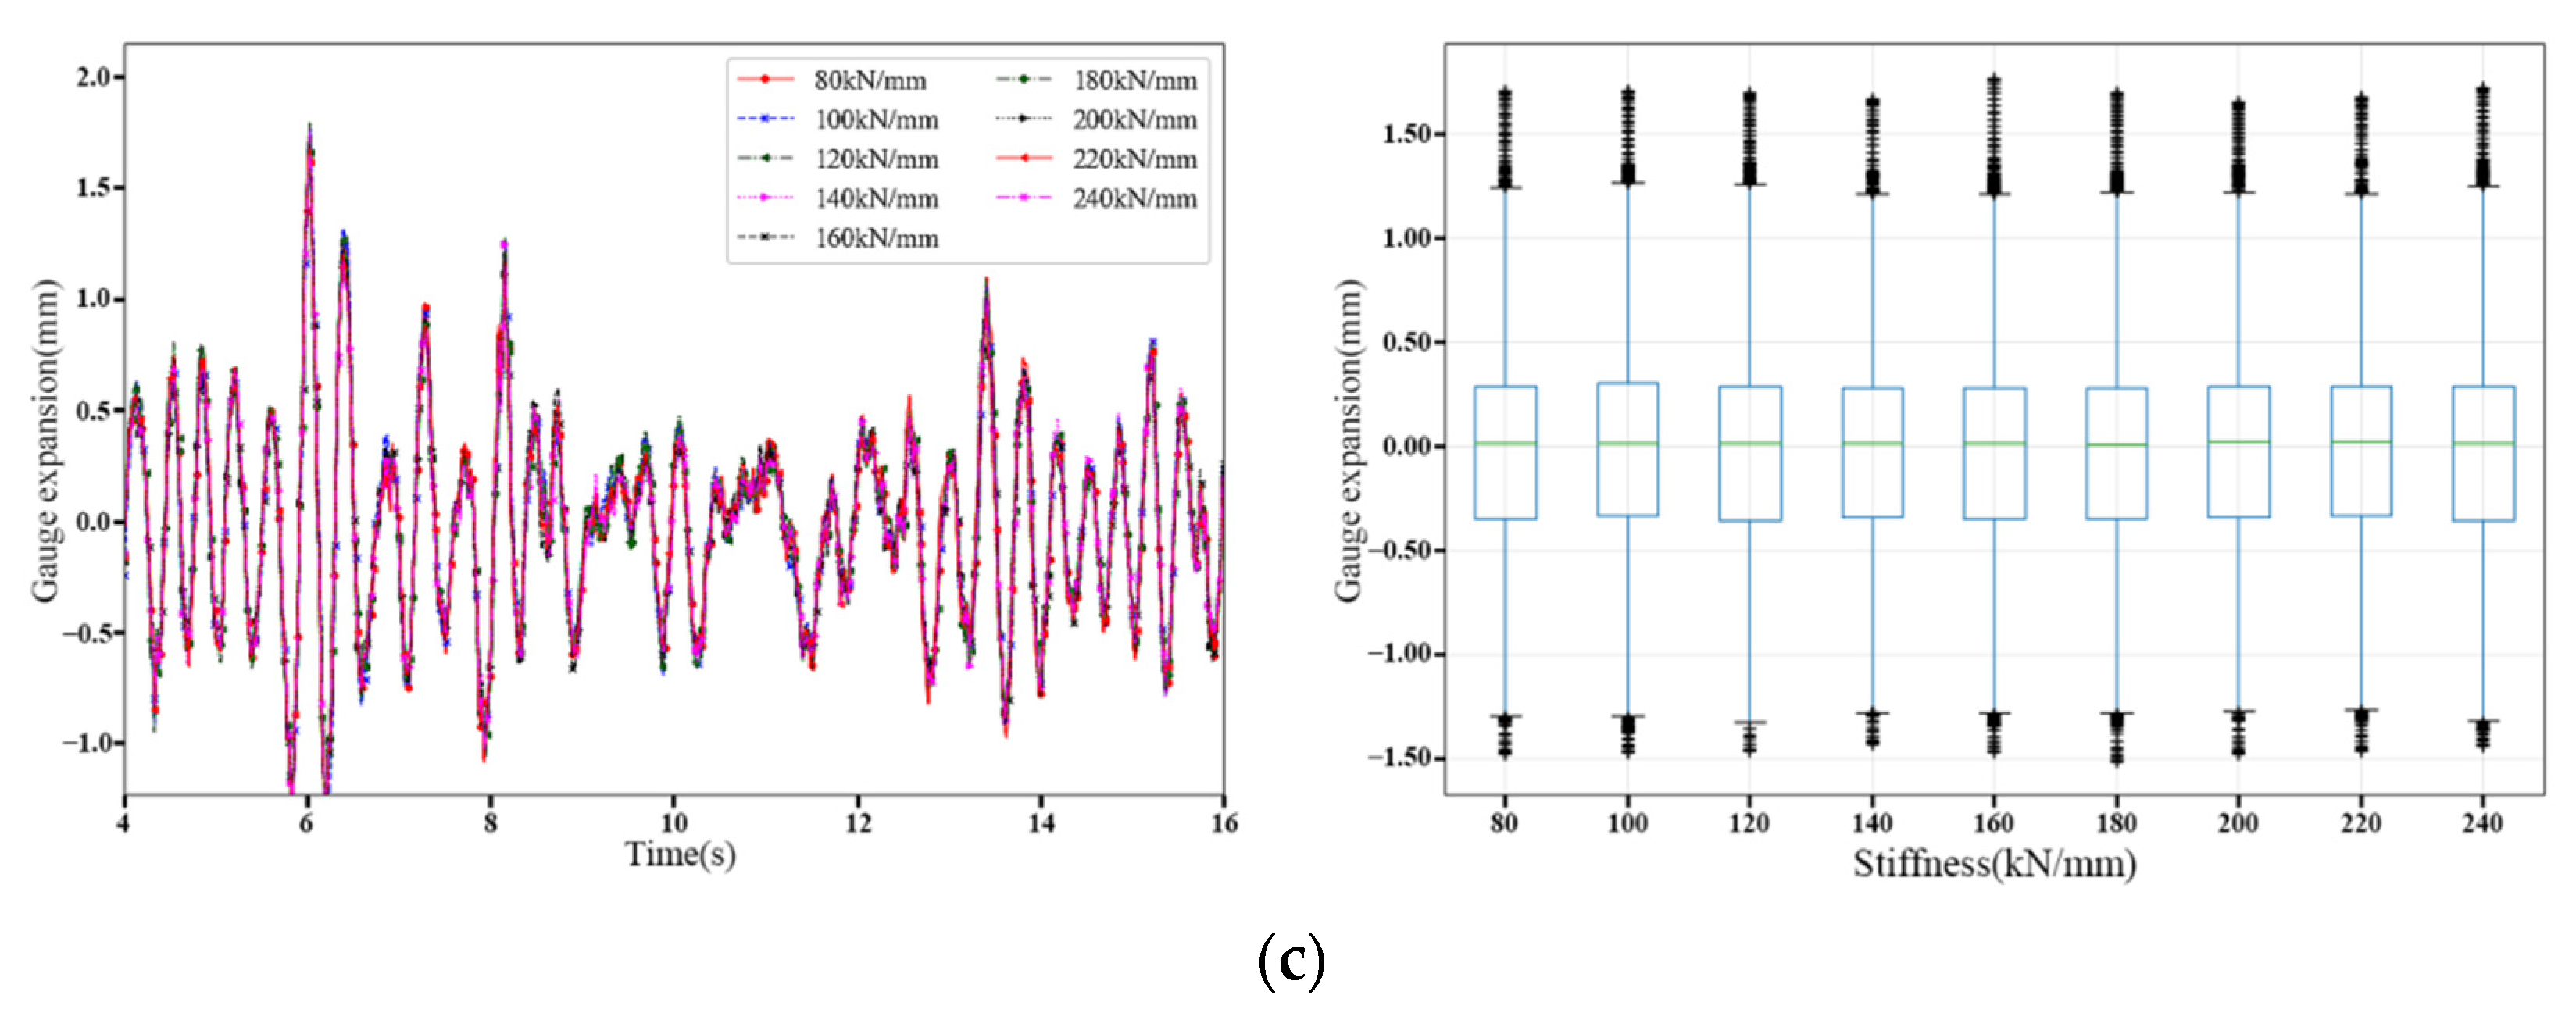
Figure 10.
Variations in the deformation coefficients under different vertical stiffness under rail. (a) Wheel-rail vertical displacement change: left-time history waveform, right-maximum, (b) Wheel-rail lateral displacement change: left-time history waveform, right-maximum and (c) Change in gauge expansion: left-time history curve, right-statistical distribution.
Figure 11.
Variations in the deformation coefficients under different lateral stiffness under rail. (a) Wheel-rail vertical displacement change: left-time history waveform, right-maximum, (b) Wheel-rail lateral displacement change: left-time history waveform, right-maximum and (c) Change in gauge expansion: left-time history curve, right-statistical distribution.
Figure 12.
Variations in the deformation coefficients under different vertical stiffness under block. (a) Wheel-rail vertical displacement change: left-time history waveform, right-maximum, (b) Wheel-rail lateral displacement change: left-time history waveform, right-maximum and (c) Change in gauge expansion: left-time history curve, right-statistical distribution.
Figure 13.
Variations in the deformation coefficients under different lateral stiffness under block. (a) Wheel-rail vertical displacement change: left-time history waveform, right-maximum, (b) Wheel-rail lateral displacement change: left-time history waveform, right-maximum and (c) Change in gauge expansion: left-time history curve, right-statistical distribution.
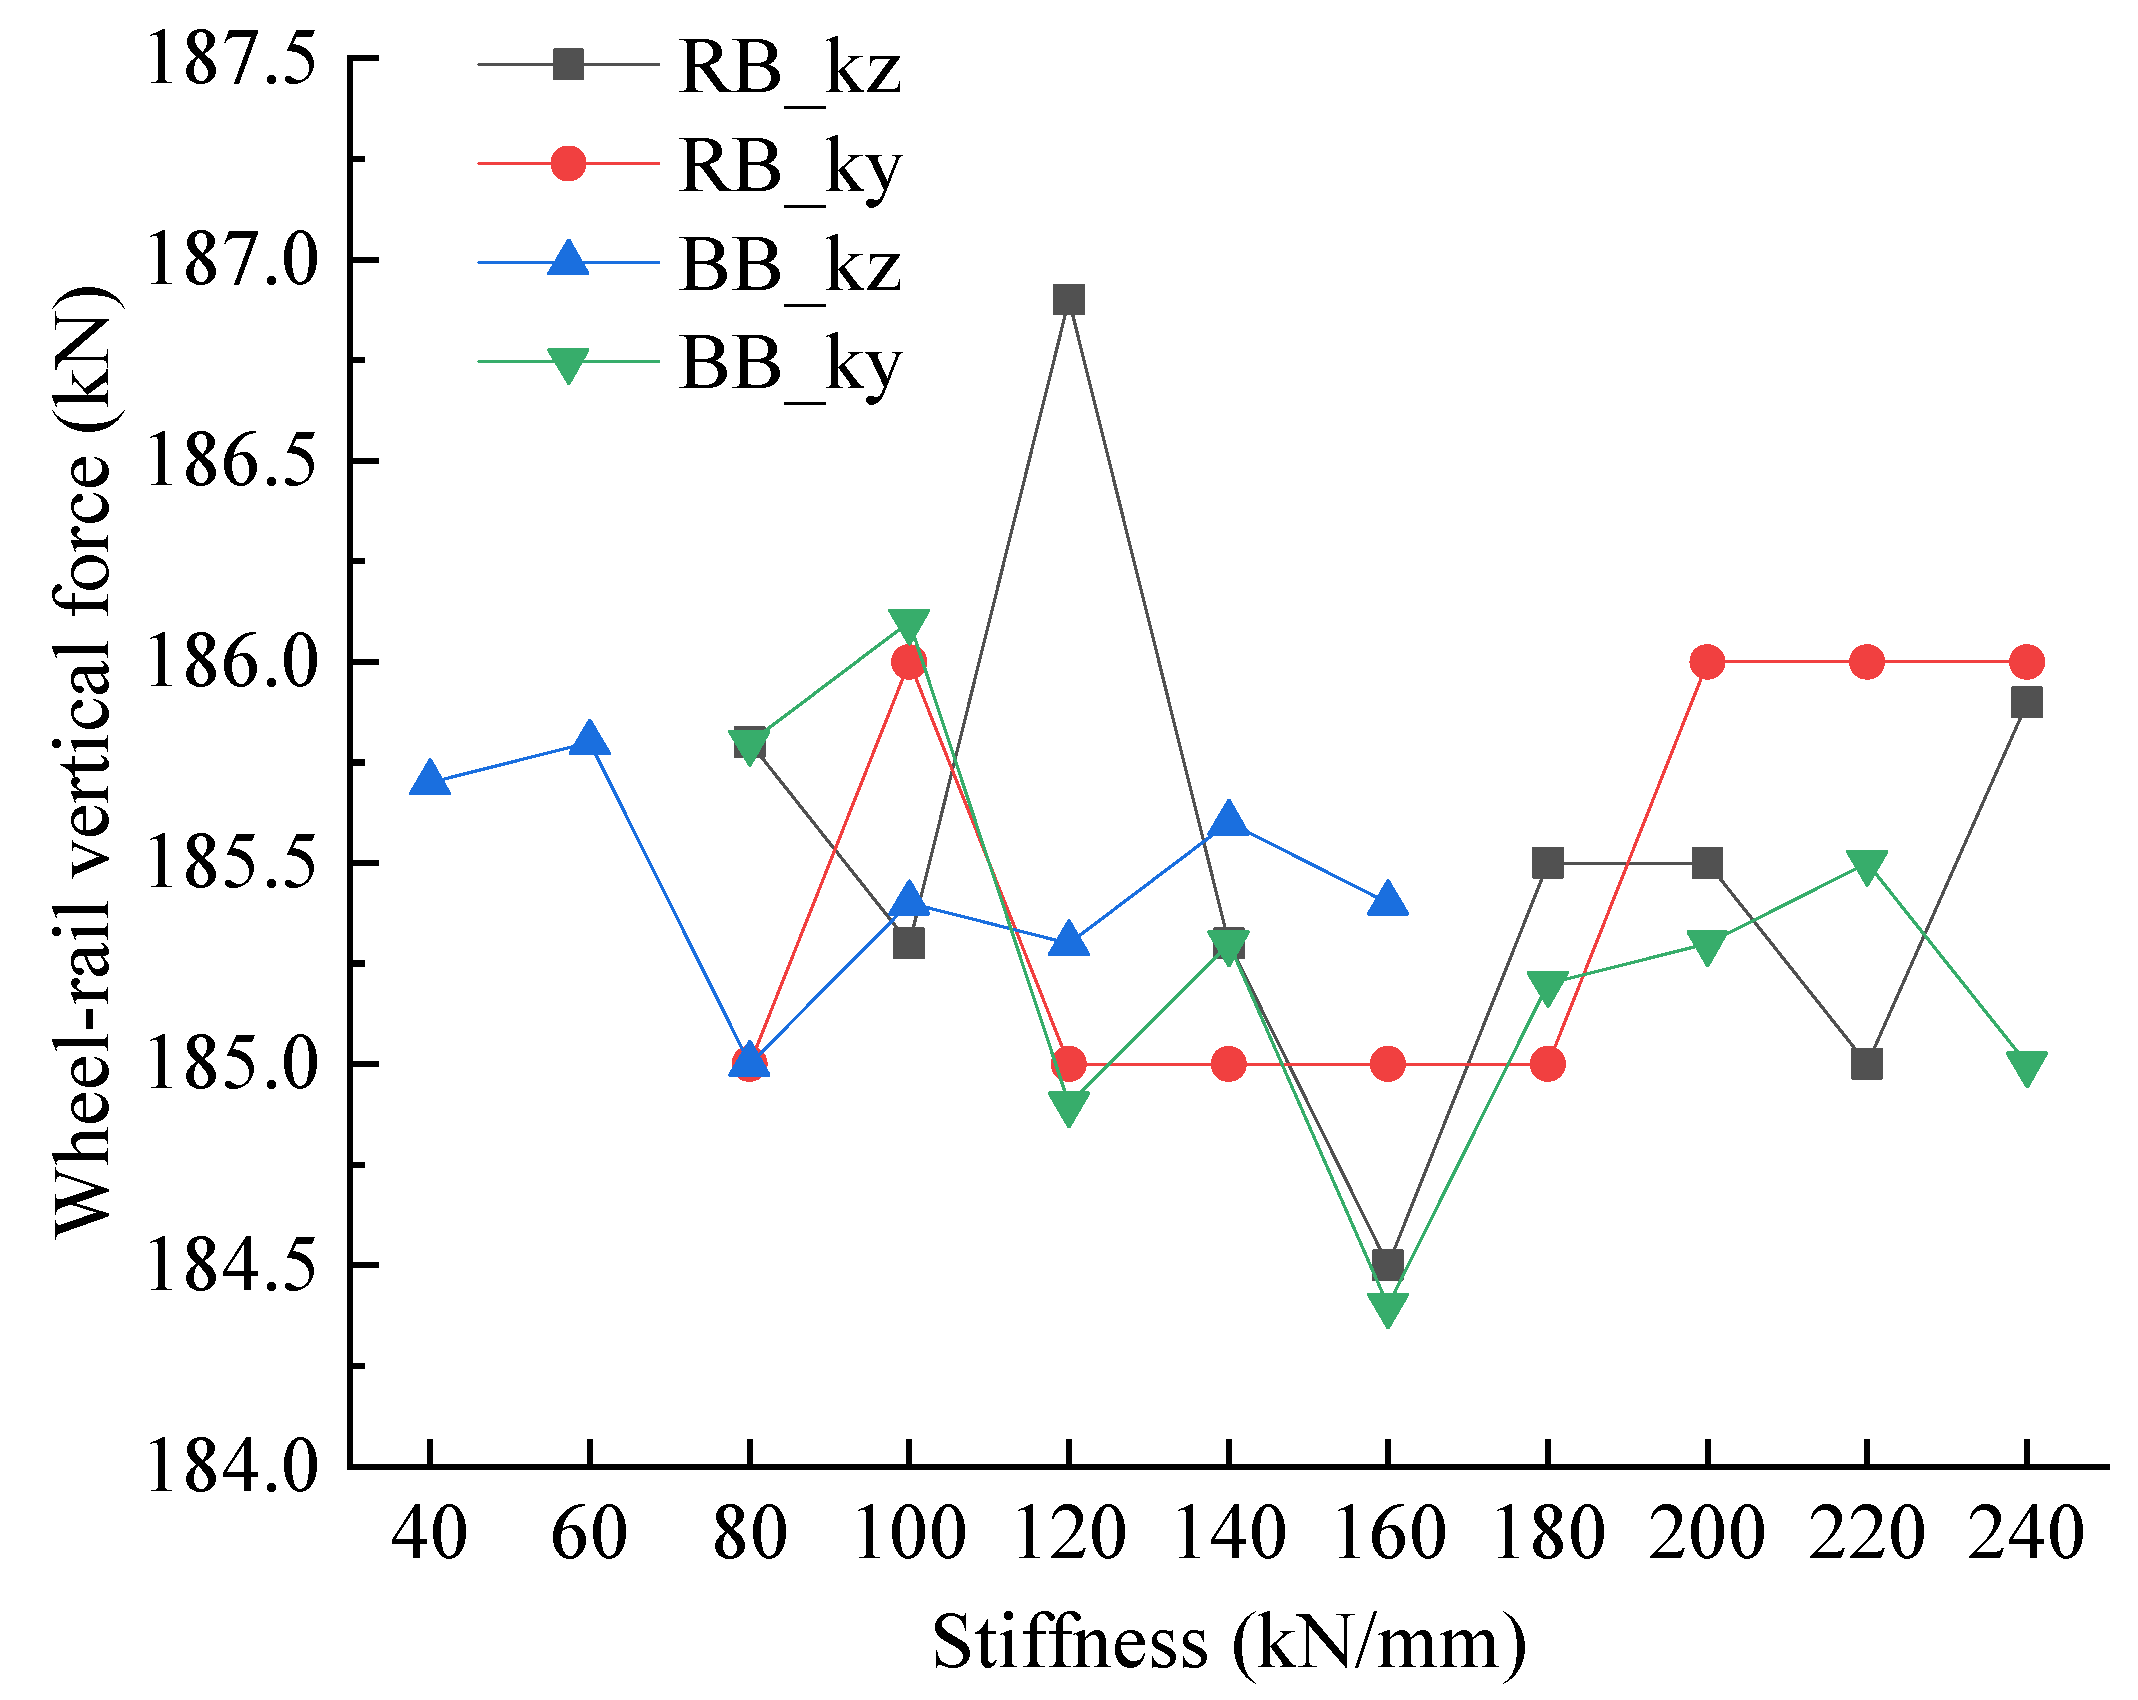
Figure 14.
Variation trend of wheel-rail vertical force under different stiffness conditions.
Figure 14.
Variation trend of wheel-rail vertical force under different stiffness conditions.
Figure 15.
Variation trend of wheel-rail lateral force under different stiffness conditions.
Figure 15.
Variation trend of wheel-rail lateral force under different stiffness conditions.
Figure 16.
Variation trend of derailment coefficient under different stiffness conditions.
Figure 16.
Variation trend of derailment coefficient under different stiffness conditions.
Figure 17.
Variation trend of wheel load reduction rate under different stiffness conditions.
Figure 17.
Variation trend of wheel load reduction rate under different stiffness conditions.
Figure 18.
Variation trend of wear coefficient under different stiffness conditions.
Figure 18.
Variation trend of wear coefficient under different stiffness conditions.
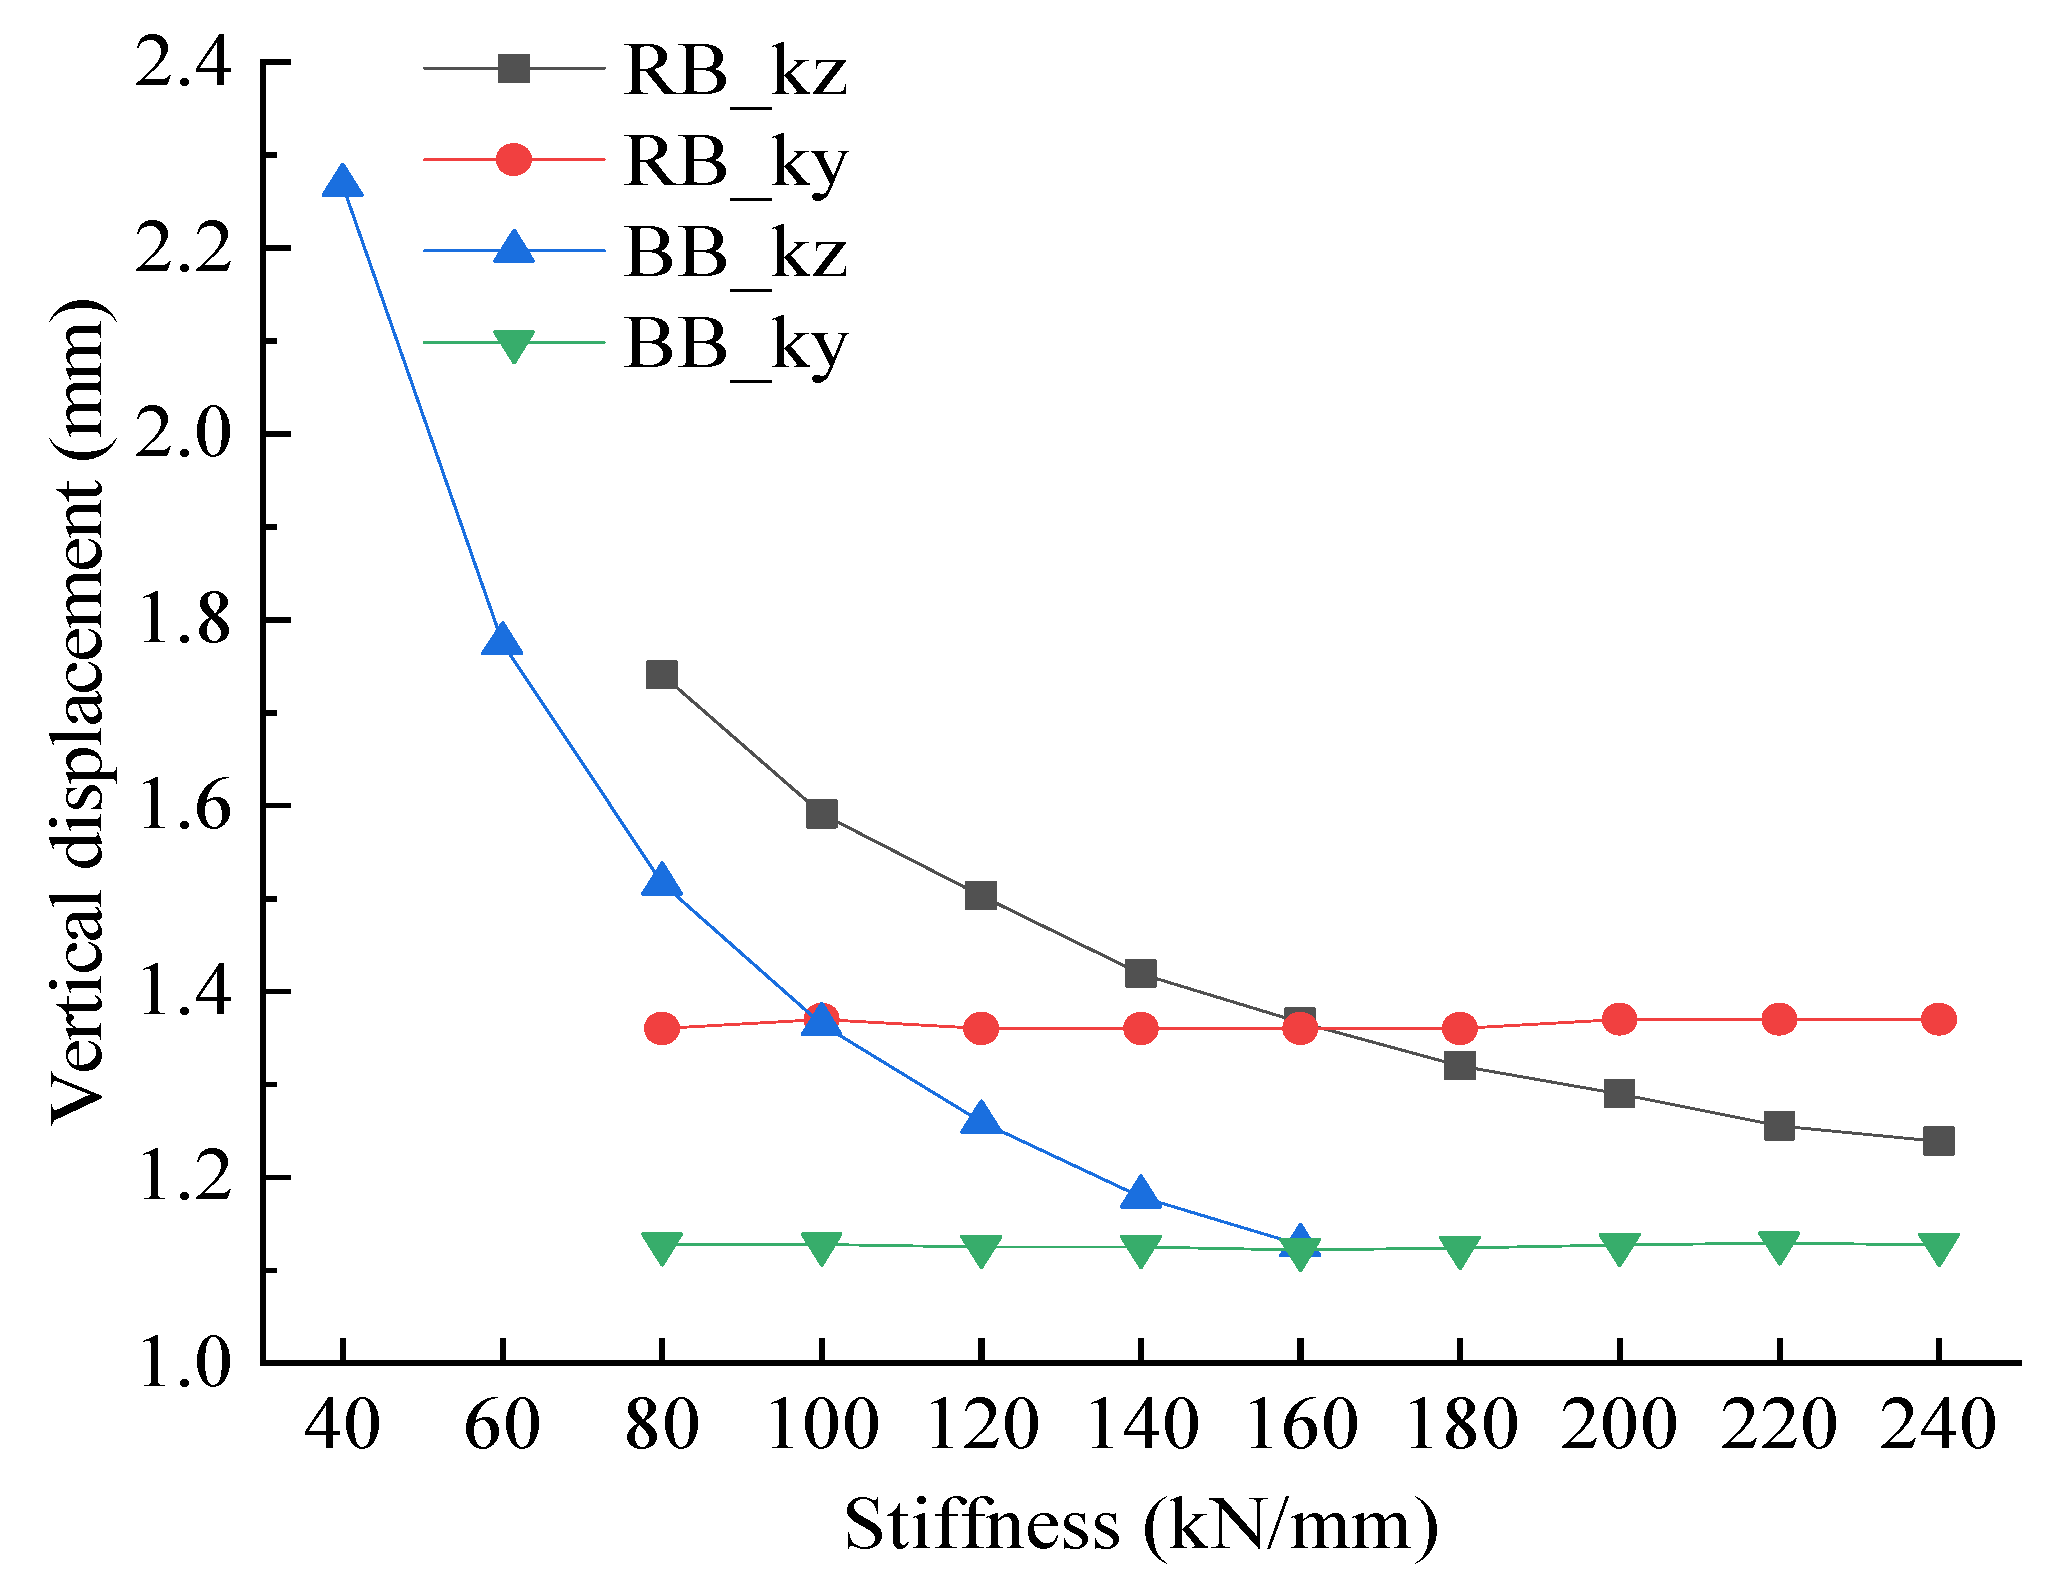
Figure 19.
Variation trend of rail vertical displacement under different stiffness conditions.
Figure 19.
Variation trend of rail vertical displacement under different stiffness conditions.
Figure 20.
Variation trend of gauge expansion under different stiffness conditions.
Figure 20.
Variation trend of gauge expansion under different stiffness conditions.
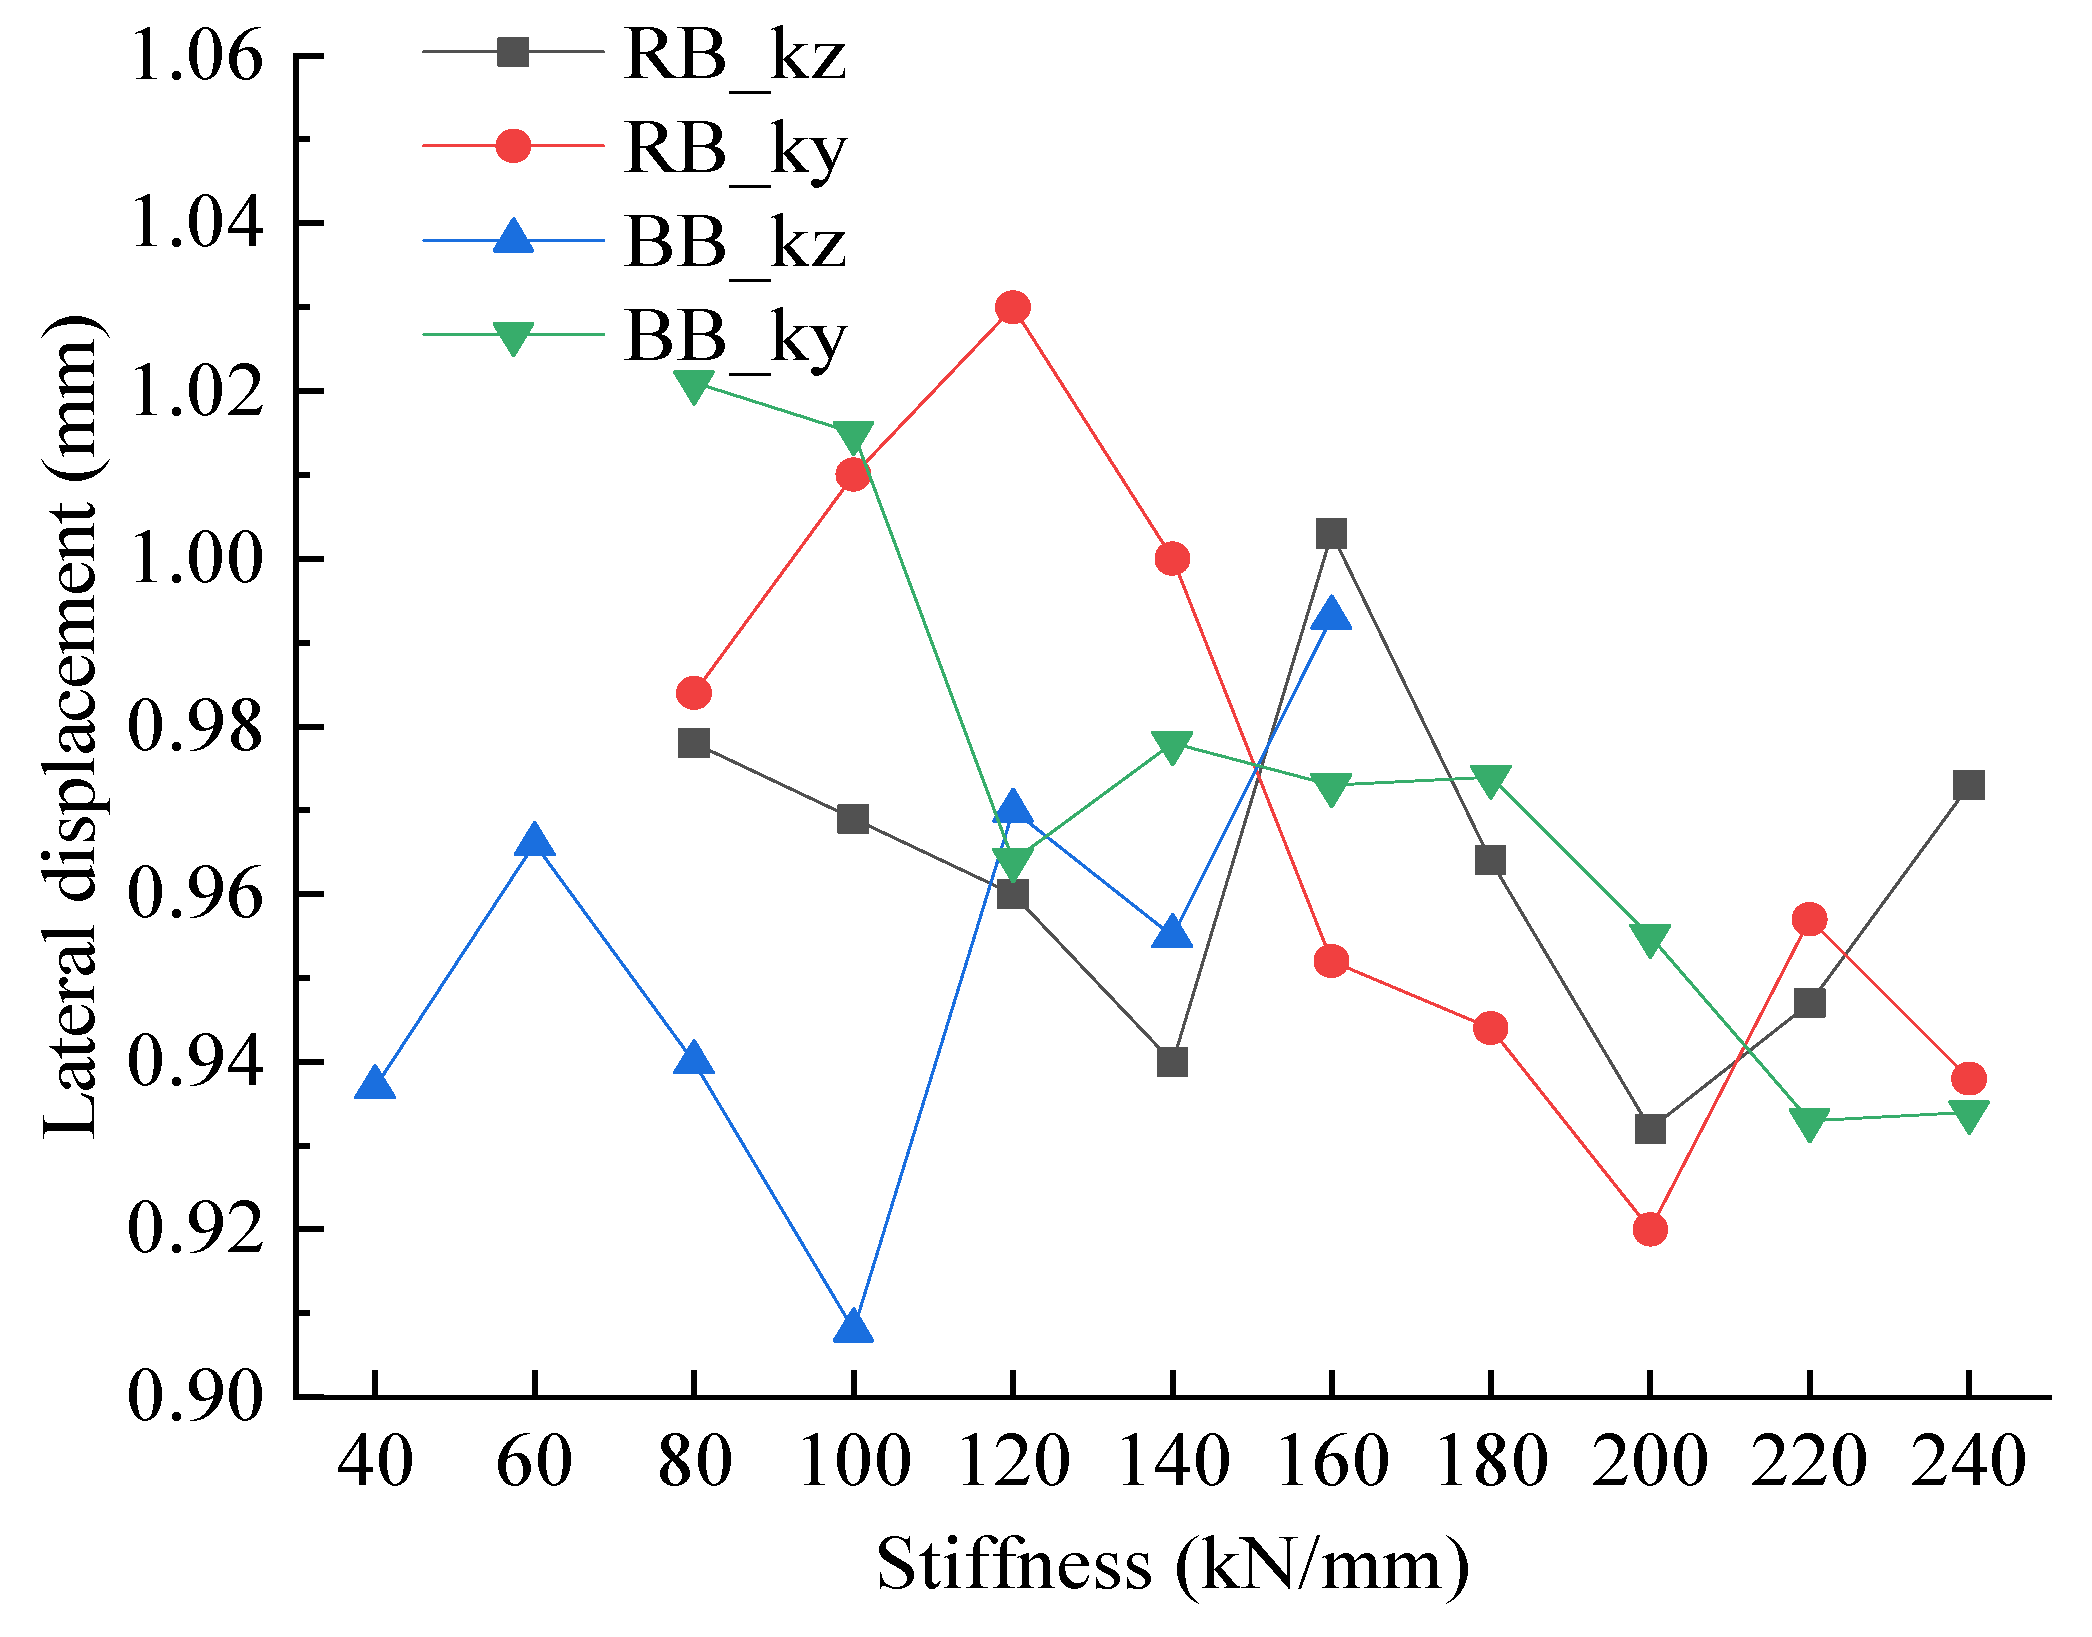
Figure 21.
Variation trend of rail lateral displacement under different stiffness conditions.
Figure 21.
Variation trend of rail lateral displacement under different stiffness conditions.
Figure 22.
Variation trend of lateral acceleration of vehicle body under different stiffness conditions.
Figure 22.
Variation trend of lateral acceleration of vehicle body under different stiffness conditions.
Figure 23.
Variation trend of vertical acceleration of vehicle body under different stiffness conditions.
Figure 23.
Variation trend of vertical acceleration of vehicle body under different stiffness conditions.
Figure 24.
Sensitivity indexes of wheel–rail contact force coefficient. (a) Wheel–rail vertical force and (b) Wheel–rail lateral force.
Figure 24.
Sensitivity indexes of wheel–rail contact force coefficient. (a) Wheel–rail vertical force and (b) Wheel–rail lateral force.
Figure 25.
Vertical ride comfort coefficient sensitivity indexes. (a) Wear coefficient and (b) Vertical displacement of rail.
Figure 25.
Vertical ride comfort coefficient sensitivity indexes. (a) Wear coefficient and (b) Vertical displacement of rail.
Figure 26.
Lateral ride comfort coefficient sensitivity indexes. (a) Lateral displacement of rail and (b) Gauge expansion.
Figure 26.
Lateral ride comfort coefficient sensitivity indexes. (a) Lateral displacement of rail and (b) Gauge expansion.
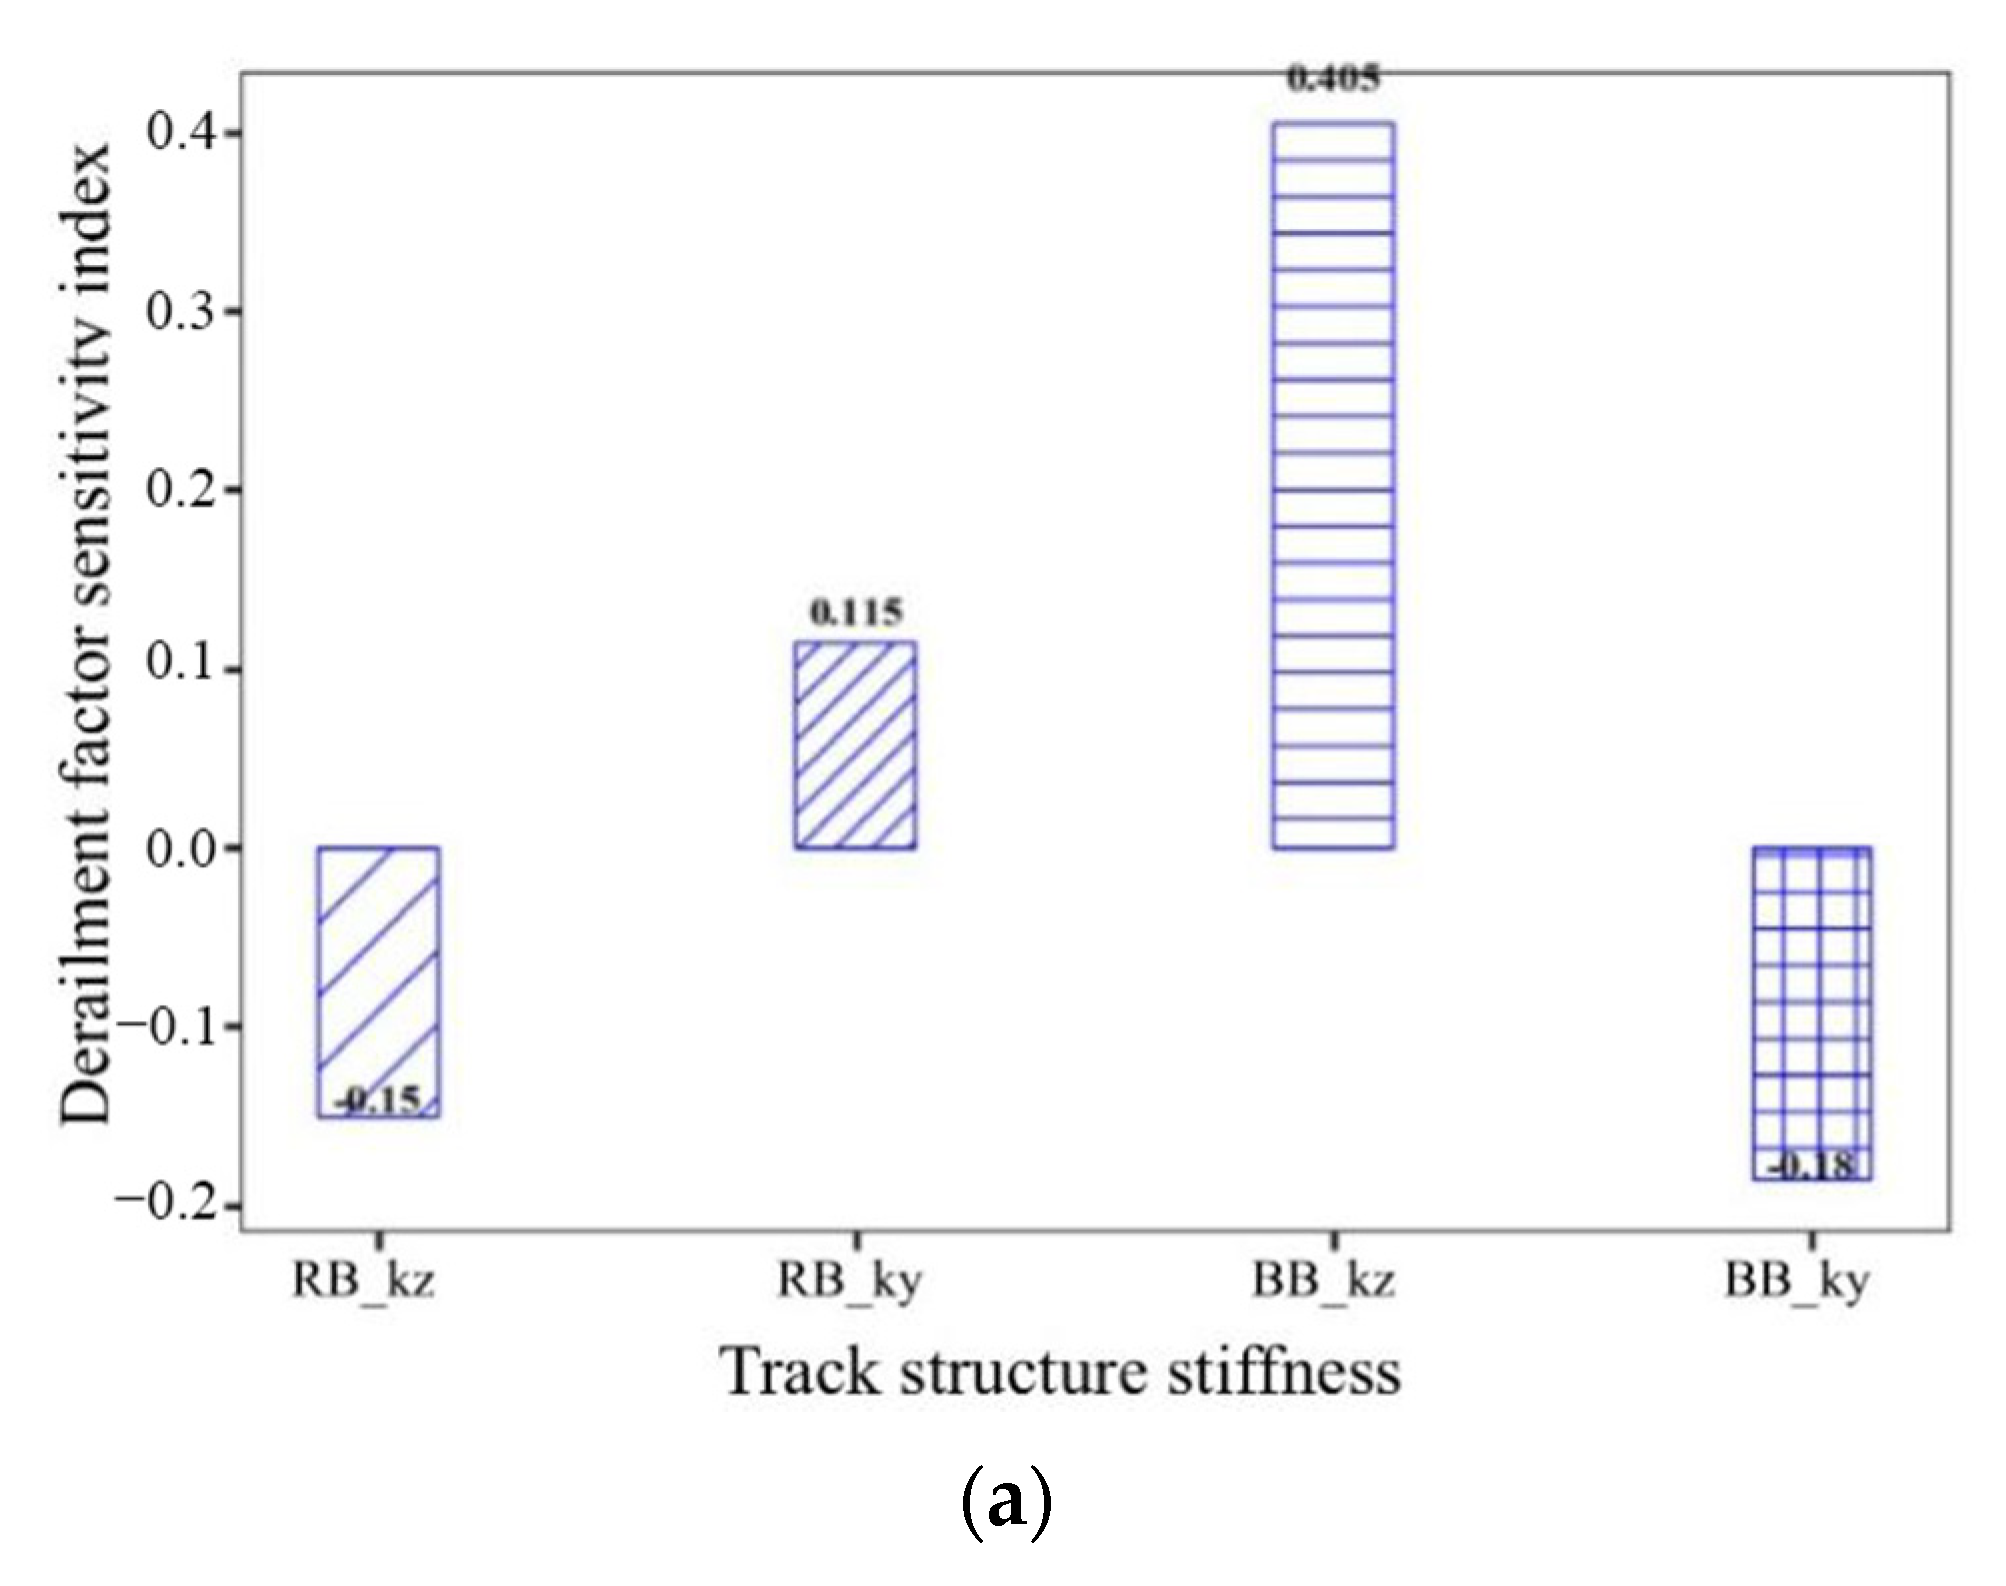
Figure 27.
Sensitivity indexes of running safety coefficient. (a) Derailment coefficient and (b) Wheel load reduction rate.
Figure 27.
Sensitivity indexes of running safety coefficient. (a) Derailment coefficient and (b) Wheel load reduction rate.
Figure 28.
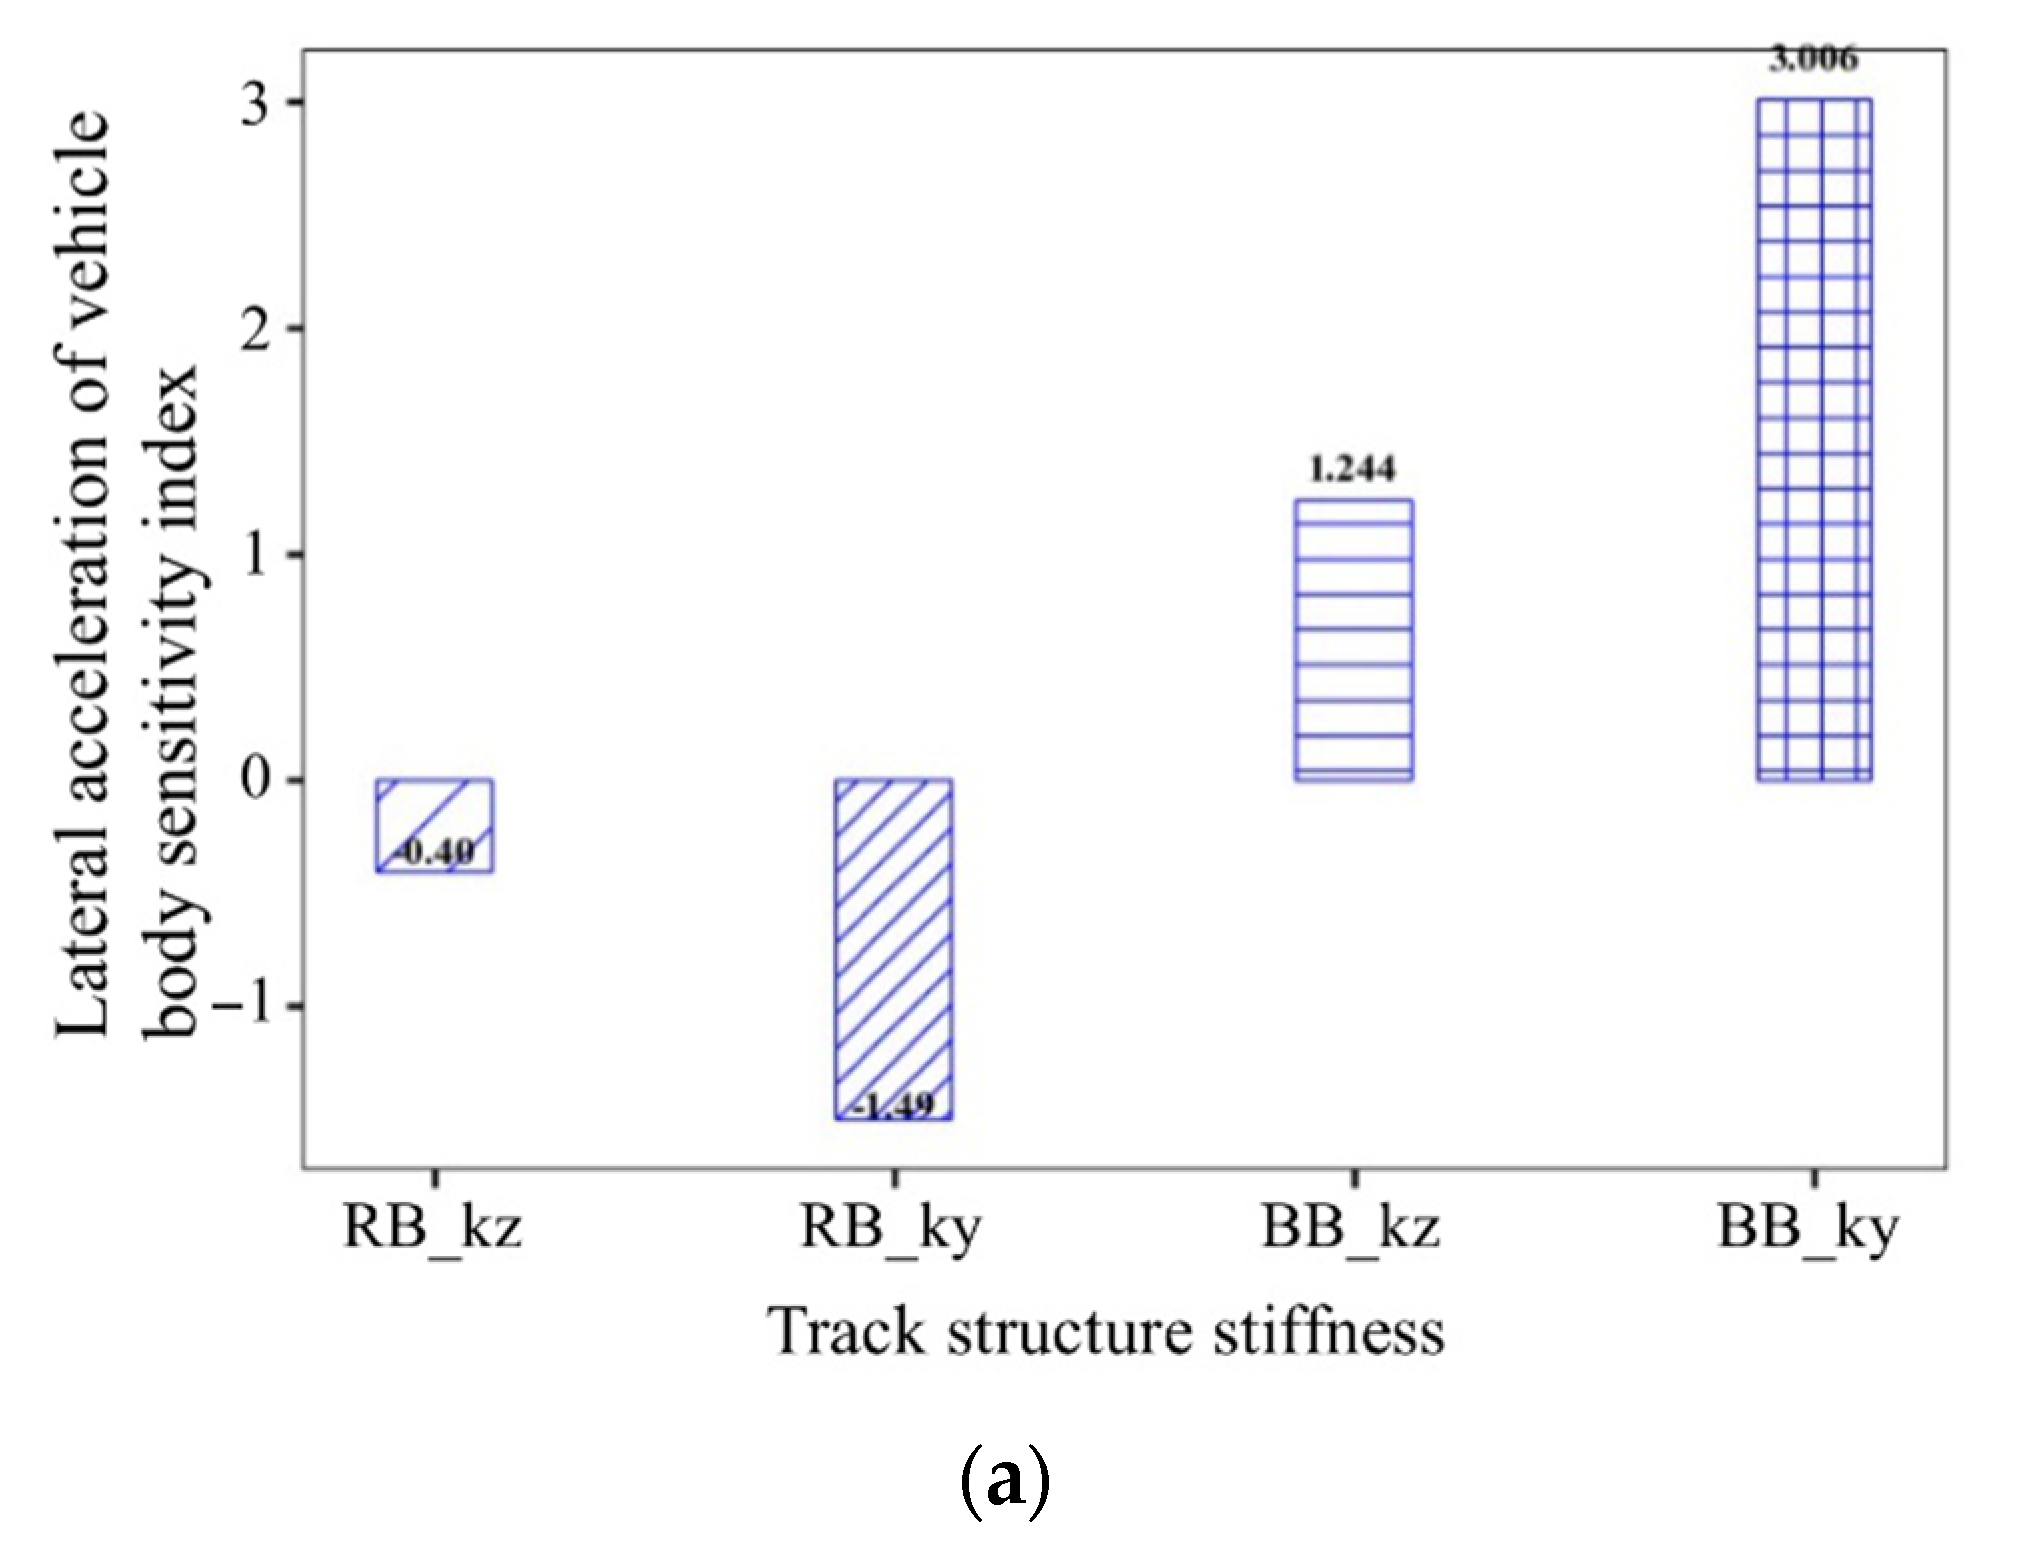
Sensitivity indexes of vehicle stability coefficient. (a) Lateral acceleration of vehicle body and (b) Vertical acceleration of vehicle body.
Figure 28.
Sensitivity indexes of vehicle stability coefficient. (a) Lateral acceleration of vehicle body and (b) Vertical acceleration of vehicle body.
Table 1.
Key dynamic model parameters of 30 t axle heavy-haul train.
Table 1.
Key dynamic model parameters of 30 t axle heavy-haul train.
| Name | Unit | Parameter Value |
|---|
| Vehicle body mass | kg | 109,200 (Heavy)/13,200 (Light) |
| Side frame mass | kg | 580 |
| The position of the car’s center of gravity (from the rail surface) | z/m | 2.155 (Heavy)/1.596 (Light) |
| The position of the center of gravity of the side frame (from the rail surface) | z/m | 0.5135 |
| Bolt mass | kg | 680 |
| Wheel set mass | kg | 1420 |
| The position of the center of gravity of the bolster (from the rail surface) | z/m | 0.515 (Heavy)/0.5625 (Light) |
Table 2.
Optimal values of track structure stiffness (unit: kN/mm).
Table 2.
Optimal values of track structure stiffness (unit: kN/mm).
| Influencing Coefficients | Ranges | Value for Non-Variable Coefficients | Increment |
|---|
| Vertical stiffness under rail | 80~240 | 160 | 20 |
| Lateral stiffness under rail | 80~240 | 160 | 20 |
| Vertical stiffness under block | 40~160 | 100 | 20 |
| Lateral stiffness under block | 80~240 | 160 | 20 |
Table 3.
Comparison and verification of wheel-rail force (unit: kN).
Table 3.
Comparison and verification of wheel-rail force (unit: kN).
| Comparison Coefficient | References [28,29] | Calculated Value in This Article | Relative Difference (%) |
|---|
| Wheel-rail vertical force | 201.1 | 193.2 | 4.19 |
| Wheel-rail lateral force | 52.1 | 48.3 | 7.87 |
Table 4.
Summary table of maximum values of stability control coefficient for train and vehicle.
Table 4.
Summary table of maximum values of stability control coefficient for train and vehicle.
| Vertical stiffness under rail (kN/mm) | 80 | 100 | 120 | 140 | 160 | 180 | 200 | 220 | 240 |
| Lateral acceleration (m/s2) | 1.537 | 1.702 | 1.399 | 1.397 | 1.408 | 1.425 | 1.573 | 1.439 | 1.453 |
| Vertical acceleration (m/s2) | 1.243 | 1.223 | 1.240 | 1.209 | 1.215 | 1.201 | 1.207 | 1.187 | 1.175 |
| wheel-rail vertical force (kN) | 185.8 | 185.3 | 186.9 | 185.3 | 184.5 | 185.5 | 185.5 | 185.0 | 185.9 |
| wheel-rail lateral force (kN) | 32.0 | 32.1 | 31.9 | 31.6 | 32.1 | 32.3 | 31.5 | 31.9 | 32.3 |
| Derailment coefficient | 0.202 | 0.194 | 0.189 | 0.190 | 0.198 | 0.194 | 0.189 | 0.190 | 0.191 |
| Wheel load reduction rate | 0.135 | 0.139 | 0.131 | 0.135 | 0.132 | 0.137 | 0.131 | 0.134 | 0.137 |
| Wear coefficient | 2.193 | 2.183 | 2.089 | 2.040 | 2.392 | 2.191 | 2.068 | 2.306 | 2.219 |
Table 5.
Summary table of maximum value of train vehicle stability control coefficients.
Table 5.
Summary table of maximum value of train vehicle stability control coefficients.
| Lateral stiffness under rail (kN/mm) | 80 | 100 | 120 | 140 | 160 | 180 | 200 | 220 | 240 |
| Lateral acceleration (m/s2) | 1.370 | 1.440 | 1.700 | 1.550 | 1.740 | 1.400 | 1.390 | 1.520 | 1.640 |
| Vertical acceleration (m/s2) | 1.190 | 1.210 | 1.230 | 1.230 | 1.190 | 1.200 | 1.220 | 1.270 | 1.200 |
| wheel-rail vertical force (kN) | 185.0 | 186.0 | 185.0 | 185.0 | 185.0 | 185.0 | 186.0 | 186.0 | 186.0 |
| wheel-rail lateral force (kN) | 31.0 | 32.3 | 32.9 | 32.4 | 31.8 | 31.8 | 31.8 | 32.6 | 32.2 |
| Derailment coefficient | 0.182 | 0.197 | 0.206 | 0.194 | 0.189 | 0.191 | 0.193 | 0.200 | 0.196 |
| Wheel load reduction rate | 0.133 | 0.132 | 0.135 | 0.137 | 0.138 | 0.137 | 0.129 | 0.138 | 0.135 |
| Wear coefficient | 2.180 | 2.280 | 2.160 | 2.130 | 2.080 | 2.180 | 2.080 | 2.190 | 2.150 |
Table 6.
Summary table of maximum value of train vehicle stability control coefficients.
Table 6.
Summary table of maximum value of train vehicle stability control coefficients.
| Vertical stiffness under block (kN/mm) | 40 | 60 | 80 | 100 | 120 | 140 | 160 |
| Lateral acceleration (m/s2) | 1.534 | 1.451 | 1.404 | 1.42 | 1.381 | 1.437 | 1.528 |
| Vertical acceleration (m/s2) | 1.236 | 1.238 | 1.206 | 1.235 | 1.210 | 1.20 | 1.215 |
| wheel-rail vertical force (kN) | 185.7 | 185.8 | 185.0 | 185.4 | 185.3 | 185.6 | 185.4 |
| wheel-rail lateral force (kN) | 31.5 | 32.0 | 31.7 | 31.0 | 32.1 | 31.9 | 32.6 |
| Derailment coefficient | 0.200 | 0.194 | 0.192 | 0.192 | 0.189 | 0.199 | 0.192 |
| Wheel load reduction rate | 0.132 | 0.136 | 0.128 | 0.128 | 0.136 | 0.136 | 0.135 |
| Wear coefficient | 2.142 | 2.139 | 2.073 | 2.115 | 2.092 | 2.129 | 2.288 |
Table 7.
Summary table of maximum value of train vehicle stability control coefficients.
Table 7.
Summary table of maximum value of train vehicle stability control coefficients.
| Lateral stiffness under block (kN/mm) | 80 | 100 | 120 | 140 | 160 | 180 | 200 | 220 | 240 |
| Lateral acceleration (m/s2) | 1.534 | 1.451 | 1.404 | 1.42 | 1.381 | 1.437 | 1.528 | 1.534 | 1.451 |
| Vertical acceleration (m/s2) | 1.236 | 1.238 | 1.206 | 1.235 | 1.210 | 1.20 | 1.215 | 1.236 | 1.238 |
| wheel-rail vertical force (kN) | 185.8 | 186.1 | 184.9 | 185.3 | 184.4 | 185.2 | 185.3 | 185.5 | 185.0 |
| wheel-rail lateral force (kN) | 31.9 | 32.1 | 31.7 | 32.1 | 32.2 | 32.5 | 32.2 | 31.9 | 31.8 |
| Derailment coefficient | 0.188 | 0.183 | 0.193 | 0.198 | 0.193 | 0.200 | 0.192 | 0.187 | 0.192 |
| Wheel load reduction rate | 0.135 | 0.136 | 0.131 | 0.132 | 0.135 | 0.132 | 0.133 | 0.132 | 0.134 |
| Wear coefficient | 2.132 | 2.166 | 2.139 | 2.159 | 2.072 | 2.034 | 2.102 | 2.161 | 2.143 |
Table 8.
Summary table of maximum values of track structure deformation control coefficients.
Table 8.
Summary table of maximum values of track structure deformation control coefficients.
| Vertical stiffness under rail (kN/mm) | 80 | 100 | 120 | 140 | 160 | 180 | 200 | 220 | 240 |
| Vertical displacement (mm) | 1.741 | 1.591 | 1.503 | 1.419 | 1.367 | 1.320 | 1.29 | 1.255 | 1.239 |
| Lateral displacement (mm) | 0.978 | 0.969 | 0.960 | 0.940 | 1.003 | 0.964 | 0.932 | 0.947 | 0.973 |
| Gauge expansion (mm) | 0.135 | 0.139 | 0.131 | 0.135 | 0.136 | 0.137 | 0.131 | 0.134 | 0.137 |
Table 9.
Summary table of maximum values of track structure deformation control coefficients.
Table 9.
Summary table of maximum values of track structure deformation control coefficients.
| Vertical stiffness under rail (kN/mm) | 80 | 100 | 120 | 140 | 160 | 180 | 200 | 220 | 240 |
| Vertical displacement (mm) | 1.360 | 1.370 | 1.360 | 1.360 | 1.360 | 1.360 | 1.370 | 1.370 | 1.370 |
| Lateral displacement (mm) | 0.984 | 1.010 | 1.030 | 1.000 | 0.952 | 0.944 | 0.920 | 0.957 | 0.938 |
| Gauge expansion (mm) | 1.740 | 1.770 | 1.790 | 1.760 | 1.690 | 1.670 | 1.620 | 1.670 | 1.650 |
Table 10.
Summary table of maximum values of track structure deformation control coefficients.
Table 10.
Summary table of maximum values of track structure deformation control coefficients.
| Vertical stiffness under rail (kN/mm) | 40 | 60 | 80 | 100 | 120 | 140 | 160 |
| Vertical displacement (mm) | 2.268 | 1.775 | 1.516 | 1.365 | 1.26 | 1.179 | 1.127 |
| Lateral displacement (mm) | 0.937 | 0.966 | 0.94 | 0.908 | 0.97 | 0.955 | 0.993 |
| Gauge expansion (mm) | 1.655 | 1.708 | 1.656 | 1.603 | 1.714 | 1.676 | 1.745 |
Table 11.
Summary table of maximum values of track structure deformation control coefficients.
Table 11.
Summary table of maximum values of track structure deformation control coefficients.
| Vertical stiffness under rail (kN/mm) | 80 | 100 | 120 | 140 | 160 | 180 | 200 | 220 | 240 |
| Vertical displacement (mm) | 1.128 | 1.128 | 1.125 | 1.125 | 1.122 | 1.124 | 1.127 | 1.129 | 1.127 |
| Lateral displacement (mm) | 1.021 | 1.015 | 0.964 | 0.978 | 0.973 | 0.974 | 0.955 | 0.933 | 0.934 |
| Gauge expansion (mm) | 1.763 | 1.773 | 1.683 | 1.707 | 1.708 | 1.710 | 1.689 | 1.661 | 1.659 |
Table 12.
Sensitivity indexes of vehicle-track system dynamic response under different track structure parameters.
Table 12.
Sensitivity indexes of vehicle-track system dynamic response under different track structure parameters.
| Dynamic Response Coefficient of Vehicle-Track System | Track Structure Parameter Sensitivity Index |
|---|
| | | |
|---|
| Wheel-rail vertical force | −0.018 | 0.044 | −0.016 | −0.020 |
| Wheel-rail lateral force | −0.218 | 0.152 | 0.112 | 0.058 |
| Derailment coefficient | −0.150 | 0.115 | 0.405 | −0.185 |
| Wheel load reduction rate | −0.337 | 0.047 | −0.560 | 0.020 |
| Wear coefficient | −0.332 | −0.229 | 0.192 | −0.097 |
| Rail vertical displacement | −0.276 | 0.465 | 2.244 | −0.357 |
| Rail lateral displacement | −0.293 | −0.191 | 0.184 | −0.081 |
| Gauge expansion | −0.083 | −0.314 | 0.153 | −0.211 |
| Lateral acceleration of vehicle body | −0.404 | −1.494 | 1.244 | 3.006 |
| Vertical acceleration of vehicle body | 0.031 | −0.636 | 0.090 | 0.077 |


 ,
, 


