Article

Online Monitoring of Power Converter Degradation Using Deep Neural Network

1
Graduate School of Nano IT Design Fusion, Seoul National University of Science and Technology, Seoul 01811, Korea
2
School of Computing Science, Simon Fraser University, Burnaby, BC V5A 1S6, Canada
3
Medical Accelerator Research Team, Department of RI Application, Korea Institute of Radiological & Medical Sciences (KIRAMS), Seoul 01812, Korea
*
Authors to whom correspondence should be addressed.
All authors contributed equally to this work.
Appl. Sci. 2021, 11(24), 11796; https://doi.org/10.3390/app112411796
Submission received: 28 October 2021 / Revised: 7 December 2021 / Accepted: 10 December 2021 / Published: 12 December 2021
(This article belongs to the Topic Machine and Deep Learning)

Abstract

:
Power semiconductor devices in the power converters used for motor drives are susceptible to wear-out and failure, especially when operated in harsh environments. Therefore, detection of degradation of power devices is crucial for ensuring the reliable performance of power converters. In this paper, a deep learning approach for online classification of the health states of the snubber resistors in the Insulated Gate Bipolar Transistors (IGBTs) in a three-phase Brushless DC (BLDC) motor drive is proposed. The method can locate one out of the six IGBTs experiencing a snubber resistor degradation problem by measuring the voltage waveforms of the three shunt resistors using voltage sensors. The range of the degradation of the snubber resistors for successful classification is also investigated. The off-the-shelf deep Convolutional Neural Network (CNN) architecture ResNet50 is used for transfer learning to determine which snubber resistor has degraded. The dataset for evaluating the above classification scheme of IGBT degradation is obtained by measuring the shunt voltage waveforms with varying snubber resistance and reference current. Then, the three-phase voltage waveforms are converted into greyscale images and RGB spectrogram images, which are later fed into the deep CNN. Experiments are carried out on the greyscale image dataset and the spectrogram image dataset using four-fold cross-validation. The results show that the proposed scheme can classify seven classes (one class for normal condition and six classes for abnormal condition in one of the six IGBTs in a three-phase BLDC drive) with over 95% average accuracy within a specific range of snubber resistance. Using grayscale images and using spectrogram-based RGB images yields similar accuracy.

1. Introduction

Brushless DC (BLDC) motors have been widely used in a large spectrum of consumer electric applications for their merits such as high efficiency and low maintenance cost [1,2,3,4]. The electronic commutation helps to eliminate the physical brush contact, and the only contact is the ball bearing, which makes the BLDC motor more reliable and quieter than a conventional DC motor. The back EMF can be excited by either the sinusoidal driving method or the trapezoidal driving method.
In the BLDC drive system, the power converter plays a vital role in transporting energy between the power source and the motor. However, the reliability of the power converter is of particular concern, since the power devices in the converter are considered vulnerable parts and prone to failures [5,6,7,8,9].
Monitoring the health states online helps raise awareness of the degradation of the power devices, which may eventually lead to the failure of the power converter, and even damage the whole drive system. This is of importance for devising a maintenance plan and preventing the failure of the system. Generally, the fault detection and diagnosis can be classified into model-based, signal-based, and knowledge-based categories [10]. The model-based method checks the presence and the type of the fault by comparing the measured data and the model’s prediction. The signal-based method examines the signal patterns caused by the faults without the need for an input-output model. The knowledge-based method is aided by artificial intelligence, and it is used in situation where model is too complex to obtain. Thanks to the direct influences of the faults on output signal patterns, signal-based converter monitoring methods have been proposed [11,12]. A signal-based condition monitoring for power electronics is proposed for hybrid electric vehicles [11]; the system faults are detected by the time domain analysis of current and voltage signals obtained at the input and output terminals of the converter; statistical methods such as skewness and kurtosis are applied to monitor the buck and boost conditions. A comprehensive signal-based real-time condition monitoring algorithm for high-power converters is proposed [12], which can provide open circuit fault detection, short circuit fault detection, overheating detection, and remaining lifetime estimation simply by measuring the voltage between the collector and emitter of the power semiconductor devices. A variety of model-based converter monitoring has also been proposed [13,14,15,16]. Sub-module capacitance condition in the modular multilevel converter is monitored online using four instantaneous capacitor voltage values with specified phase information [13]. Degradation of the transistor in boost converters is monitored using the saturation region resistance instead of the on-resistance, in order to solve the problem that it is difficult to identify the on-resistance due to its small value, even though it is the most significant aging factors in power MOSFETS [14].
With the vast development of artificial intelligence, deep learning algorithms have been used in numerous applications [17,18,19], and have also been introduced in monitoring power converters [20,21,22,23]. Even though these knowledge-based methods usually require a huge amount of data, they are receiving more and more attention when the explicit models or the signal patterns of a system are not available straightforward. A real-time reliability modeling and prediction algorithm for high-frequency MOSFET power electronic converters is proposed using long short-term memory and the change of device resistance, which achieves much higher accuracy than traditional approaches such as Kalman filter and particle filter [20]. The proposed approach in [21] monitors the semiconductor on-resistor change as a precursor for diagnostic/prognostic in GaN power converters. A hybrid generalization network called IEDGNet which addresses the diagnosis problem under unseen working conditions is proposed [22]; the method tackles the challenging problem, i.e., the discrepancy between the training data and the test data, by regularizing the discriminant structure of the network with intrinsic and extrinsic generalization objectives. A review of the recent developments of induction motor drives fault diagnosis using expert systems, artificial neural networks, and fuzzy logic systems has been presented [23], the authors utilize the instantaneous voltages and currents as input signals for the discussed methodologies.
In this paper, a deep learning-based online classification scheme to identify which Insulated Gate Bipolar Transistors (IGBT) has degraded snubber resistor in the power converter for a three-phase BLDC motor drive is proposed. It is crucial to monitor the health states of the power devices to prevent the possible damage to the system caused by the failure of the power devices. By monitoring the voltage waveform of the shunt resistor in each phase, the degradation of the snubber resistor in IGBTs can be detected. The off-the-shelf deep network ResNet50 is used to perform the classification task for normal and abnormal conditions of the snubber resistors. For generating the dataset, two approaches are used. The first is to encode the voltage waveforms of the shunt resistors into grayscale images. The other is to perform a Short-Time Fourier Transform (STFT) that obtains the spectrogram of the voltage waveform for each phase and then encodes the spectrograms into RGB images. Three different ranges of the snubber resistors are compared. Experiments are carried out to evaluate the classification performance of the proposed scheme. The results using greyscale images and RGB images are compared, and the range of the resistance of the snubber resistor in which the proposed scheme can take effect is also discussed.

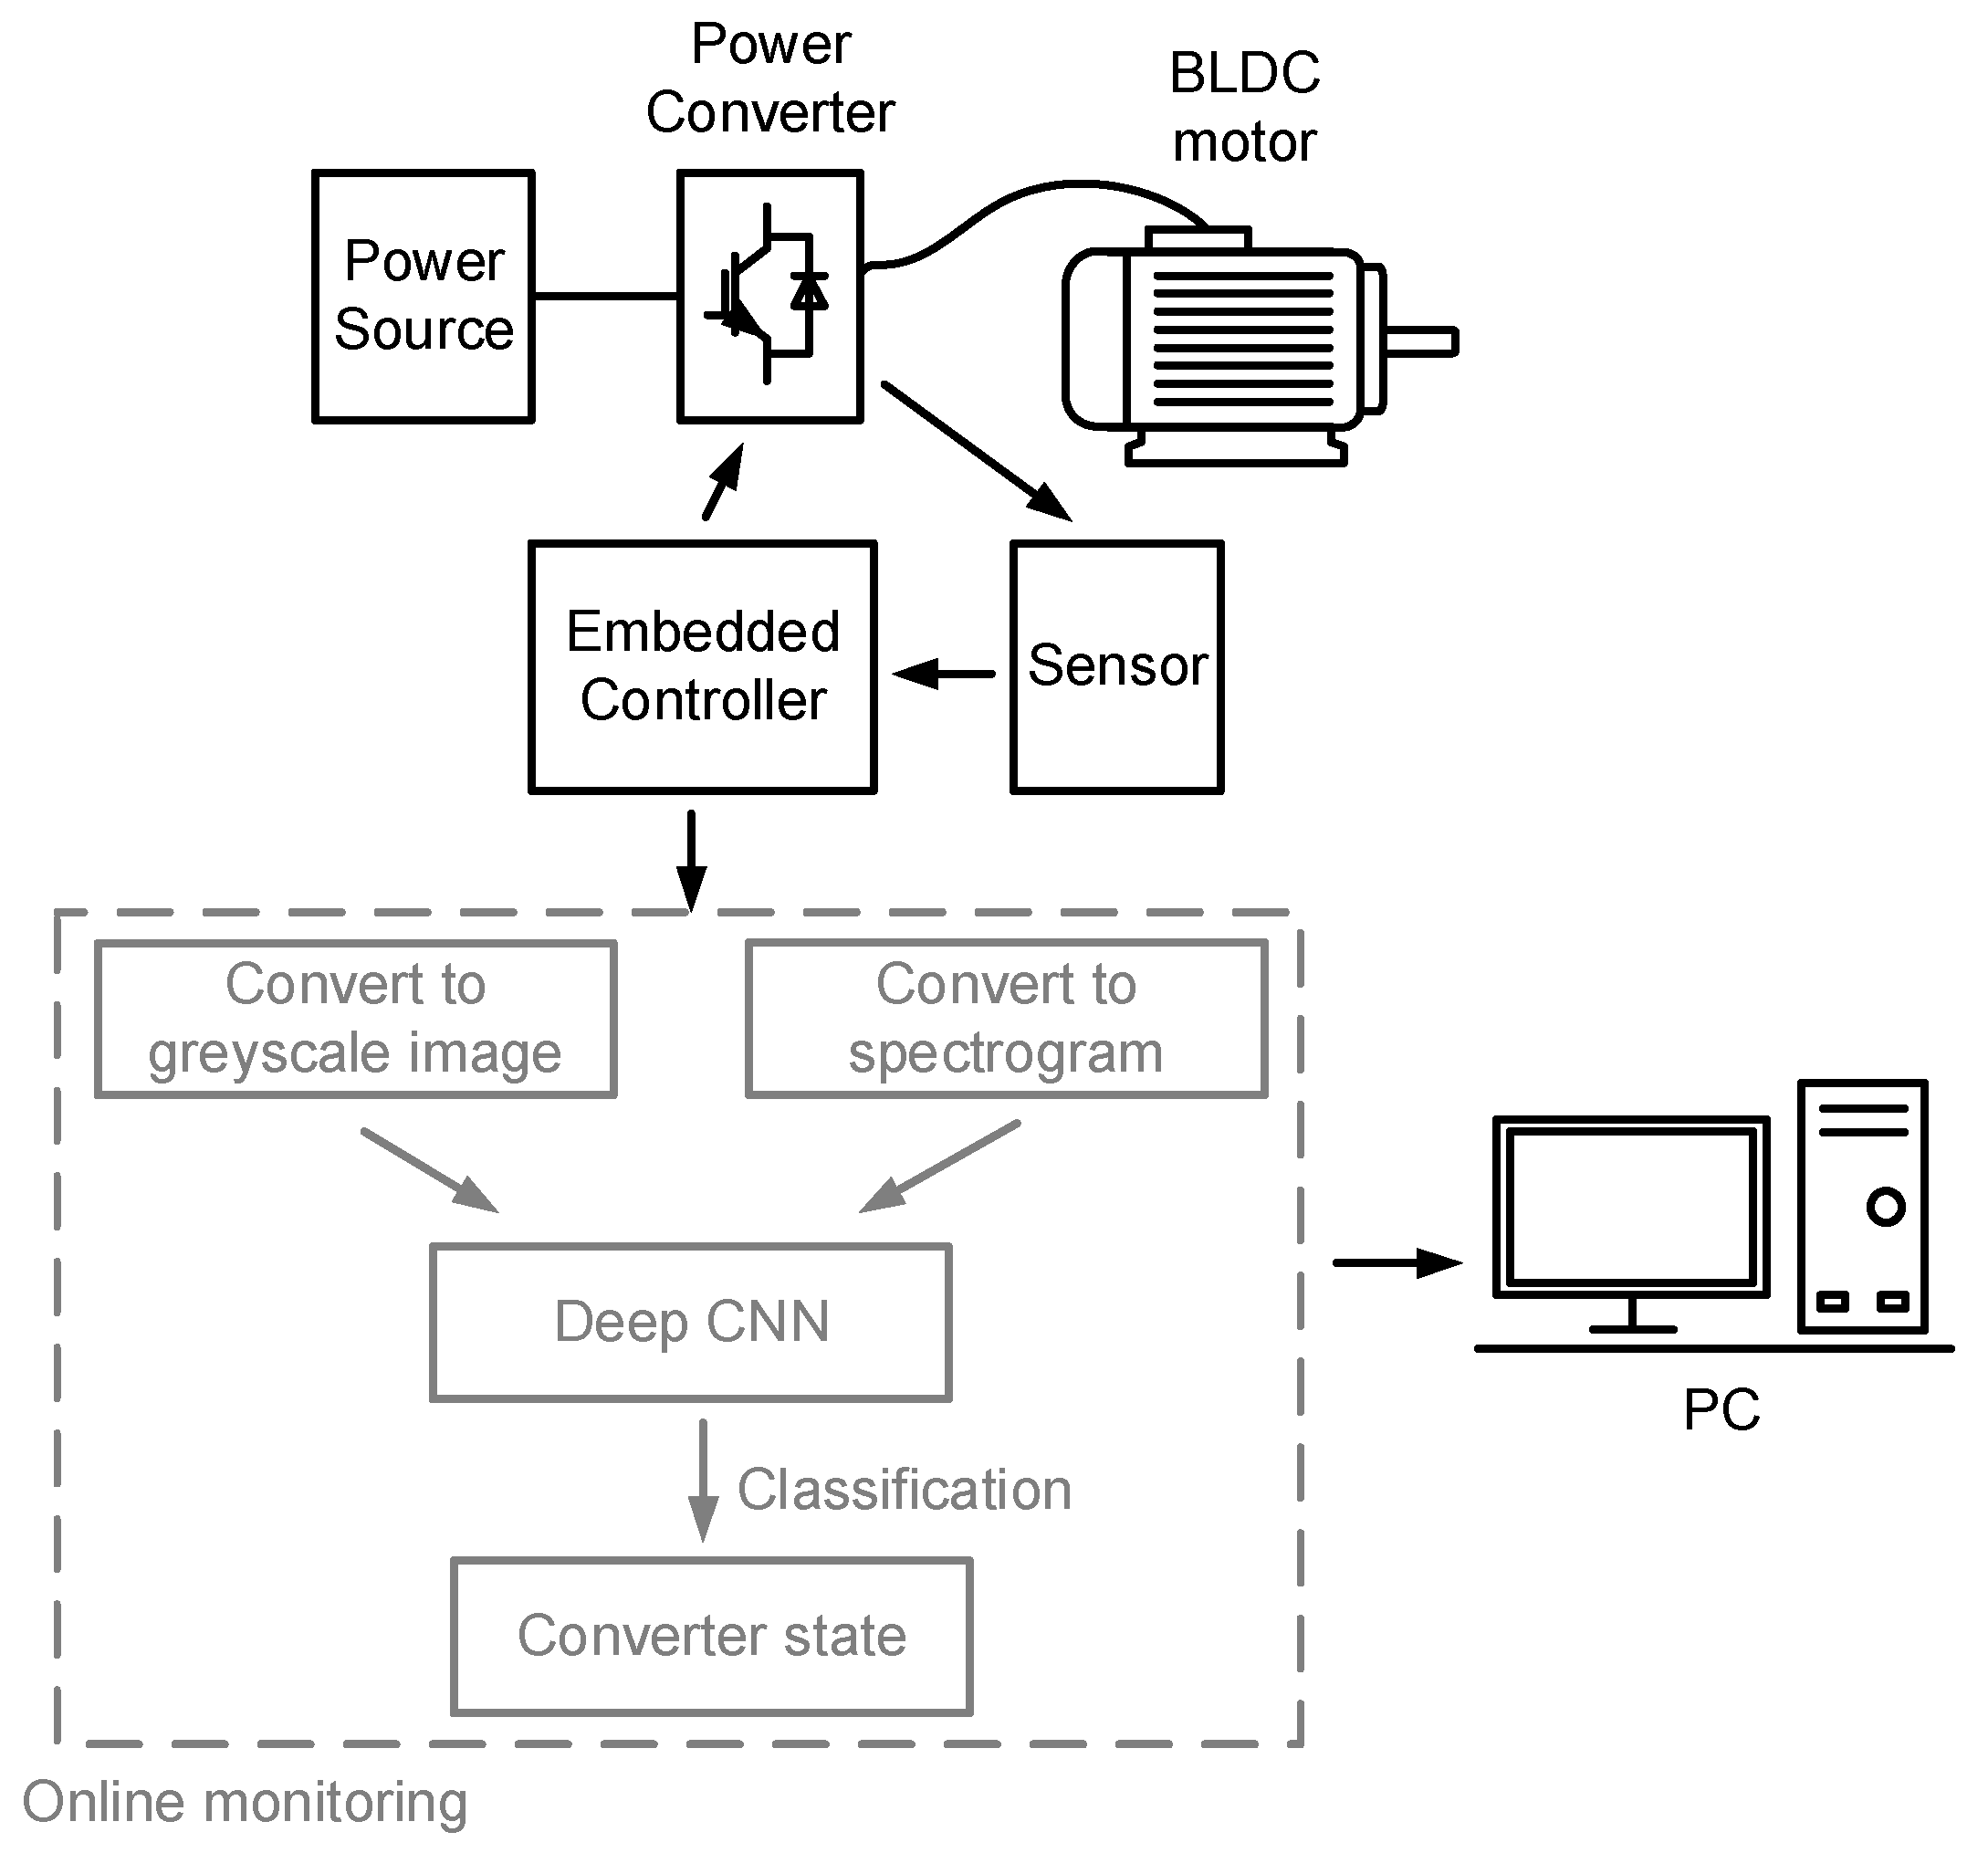
2. Classification of Health States of Power Converter

In this section, an online monitoring scheme for detecting the degradation of the snubber resistor is proposed, based on the classification of normal and abnormal conditions using deep learning approach. First, a brief introduction of the motor drive system to monitor is provided. Further, the collection of the dataset for training and evaluating the deep network for classification is discussed. Finally, the network architecture is described.

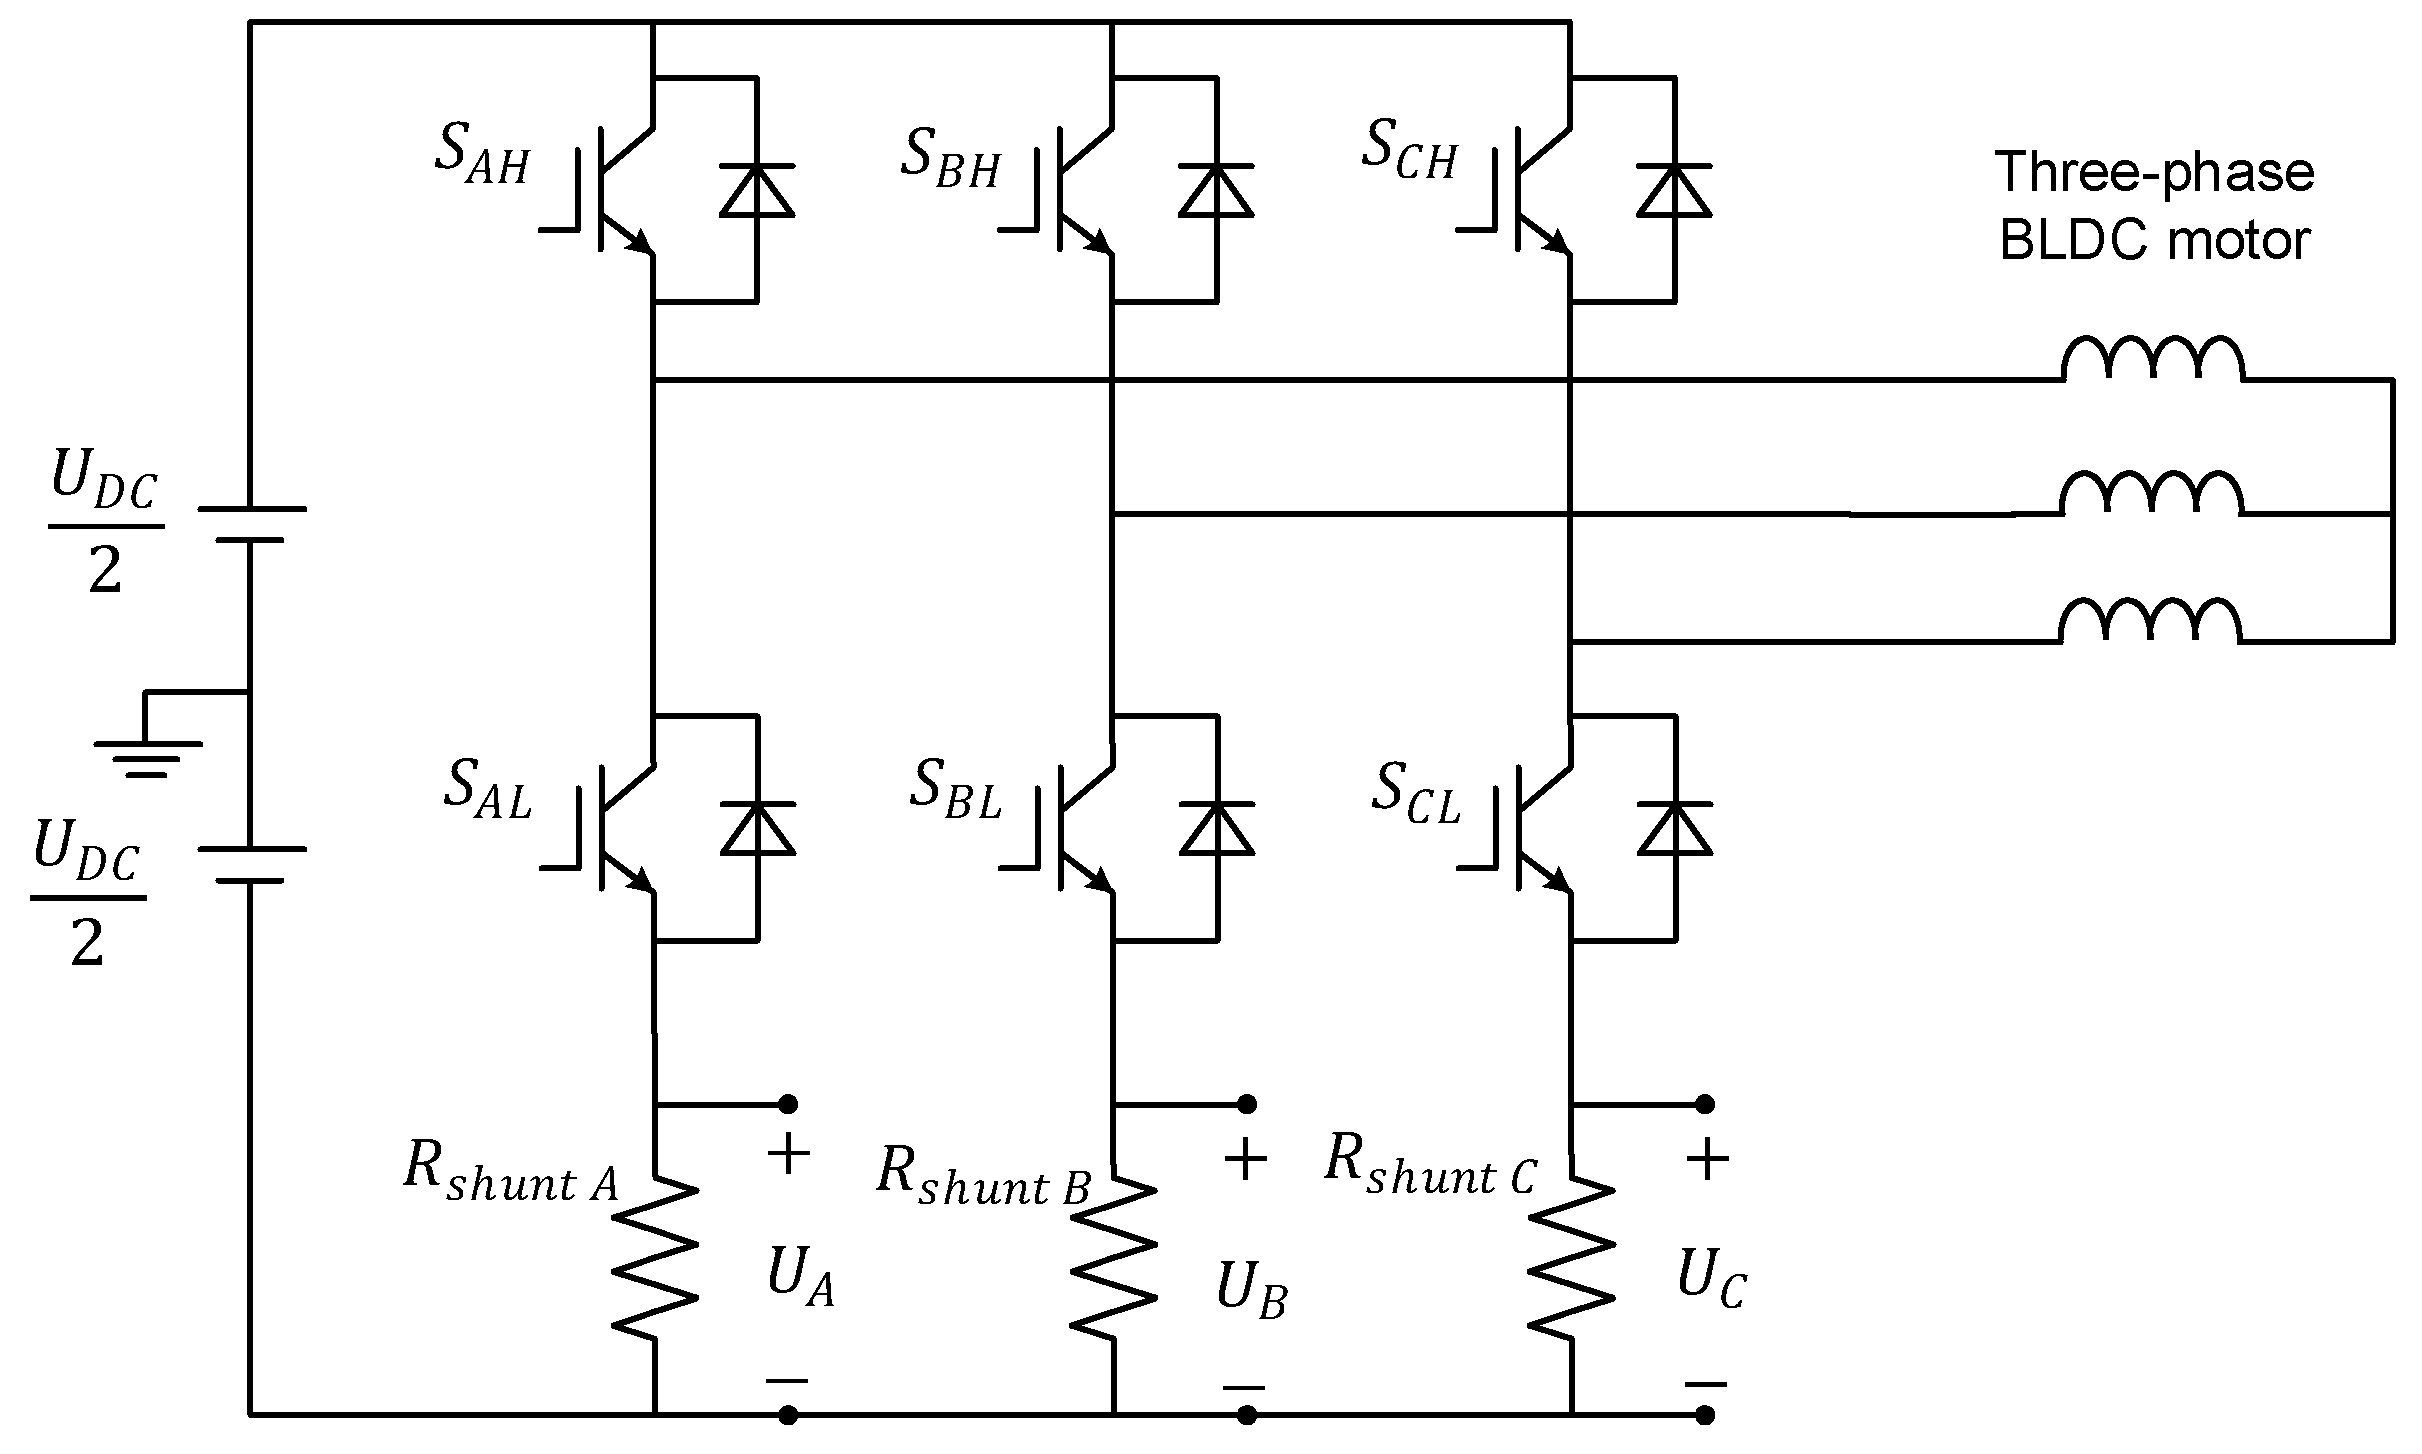
2.1. BLDC Motor Drive

The BLDC motor drive system is operated by the feedback from the rotor position sensor, which is obtained every 60 electrical degrees where commutation of the phase currents occurs. The circuit diagram of the three-phase BLDC motor drive system is shown in Figure 1. The commutation timing is determined by hall sensor signals H A , H B , and H C , as shown in Table 1. The + and − sign indicate the direction of the current flow, while OFF means no current flow in the phase. Based on the position of the rotor, there are six switching intervals. At each interval, the six switches are controlled in such a way that the current only flows in two phases in opposite direction. A shunt resistor is placed in a series connection with the lower switch of each phase. As shown in Figure 1, a voltage sensor is used to measure the voltage of each shunt resistor for current control scheme.

2.2. Dataset

The proposed method detects the degradation of the snubber resistors inside the power device modules by monitoring the voltage waveforms of the three shunt resistors. Currently, seven conditions are considered: one of the six snubber resistors experiencing degradation, and one normal condition. The task is to differentiate one of the conditions from the rest. Under normal conditions, the typical value of the snubber resistance is 100 kΩ. In abnormal conditions, the degraded snubber resistance is below 100 kΩ. The change of the shunt voltage reflects the degradation of the snubber resistance. The voltage waveforms are plotted in Figure 2a when there is no degradation in the snubber resistors. When the snubber resistor of the switch S A H has degraded, the waveforms are slightly deviated from the normal condition, as shown in Figure 2b, the negative voltage in U A is reduced compared with that of the normal condition, while a clear step can be observed in the middle of the positive voltage in U B and U C . When the snubber resistor in S A L , S B H , S B L , S C H , S C L is under an abnormal condition, the measured waveforms are shown in Figure 2c–g, respectively, the difference when compared with the normal condition can also be observed in these figures.
In order to differentiate the voltage signals in a deep Convolutional Neural Network (CNN), the three-phase voltage waveforms are first converted into greyscale images. First, each sampling point of the shunt voltage within one electrical cycle in phase A is normalized and encoded into a 16-bit greyscale value. Then, the encoded points of phase A are put in the first row of pixels of the image repeated for second to fourth rows. Similarly, the shunt voltage of phase B is represented by the 6th to 10th row of pixels and the 11th to 15th rows for phase C. The resulting greyscale images are sized as 15 × 15,005 pixels, where the number of columns represents the number of sampling points.
Another approach is to use spectrogram-based images. For each phase, STFT is performed on the shunt voltage waveform. The number of discrete Fourier transform sampling points is 400, the window is 150 samples, and the number of overlapped samples is 75. After obtaining the power spectral density, the decibel of power spectral density over normalized frequency is calculated. For phase A, the shunt voltage is encoded into the R channel in an RGB image by adding an offset to the decibel. Similarly, the shunt voltages of phase B and phase C are encoded into the G channel and B channel, respectively. The resulting images are sized as 199 × 201 pixels, as shown in Figure 3. By comparing the color patterns in Figure 3, the difference between each spectrogram can be identified easily.
In order to compare the greyscale approach and the spectrogram approach, images representing normal and abnormal conditions are collected. Under abnormal conditions, the reference current varies from 20 A to 50 A, and the snubber resistance of one of the six switches varies from 1 Ω to 1 kΩ, while the other five switches use the normal value of snubber resistance. For each abnormal condition, 480 images are obtained. Under normal conditions, the snubber resistance is kept at 100 kΩ, and only the reference current varies from 20 A to 50 A. The number of obtained images for the normal condition is 500. The datasets for the greyscale image and spectrogram image are named dataset A and dataset B1, respectively. The seven classes in the datasets consist of one class for normal conditions and six classes for abnormal conditions.
To understand what range of abnormal snubber resistance can be best classified, spectrogram datasets B2 and B3 are collected. For dataset B2, the range of the abnormal snubber resistance is 1 kΩ to 10 kΩ. For dataset B3, the range is 10 kΩ to 100 kΩ.

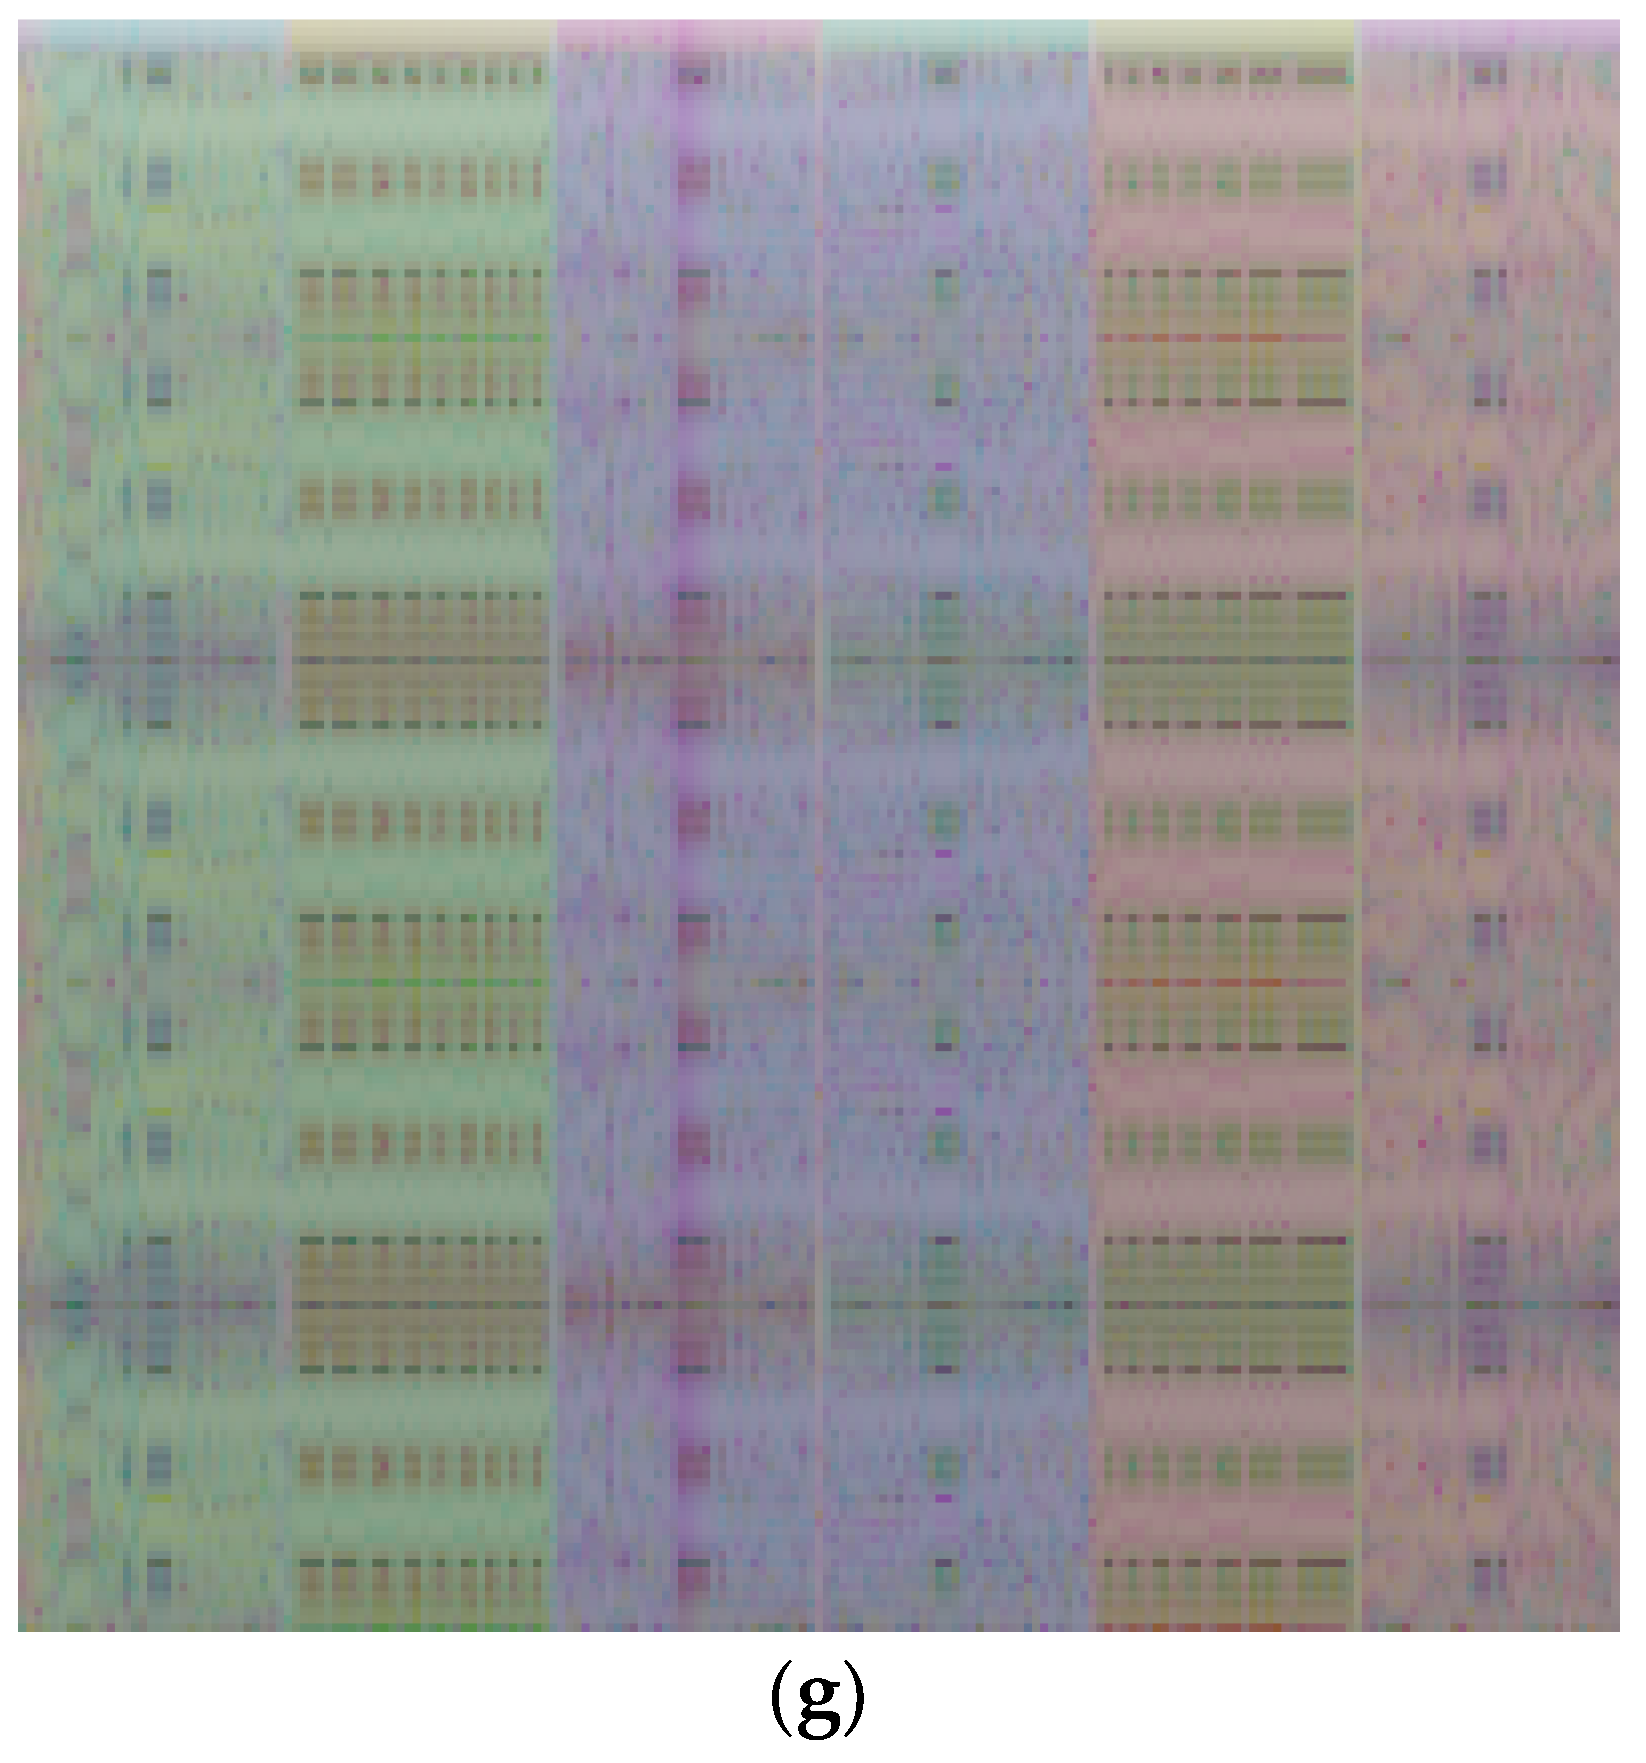
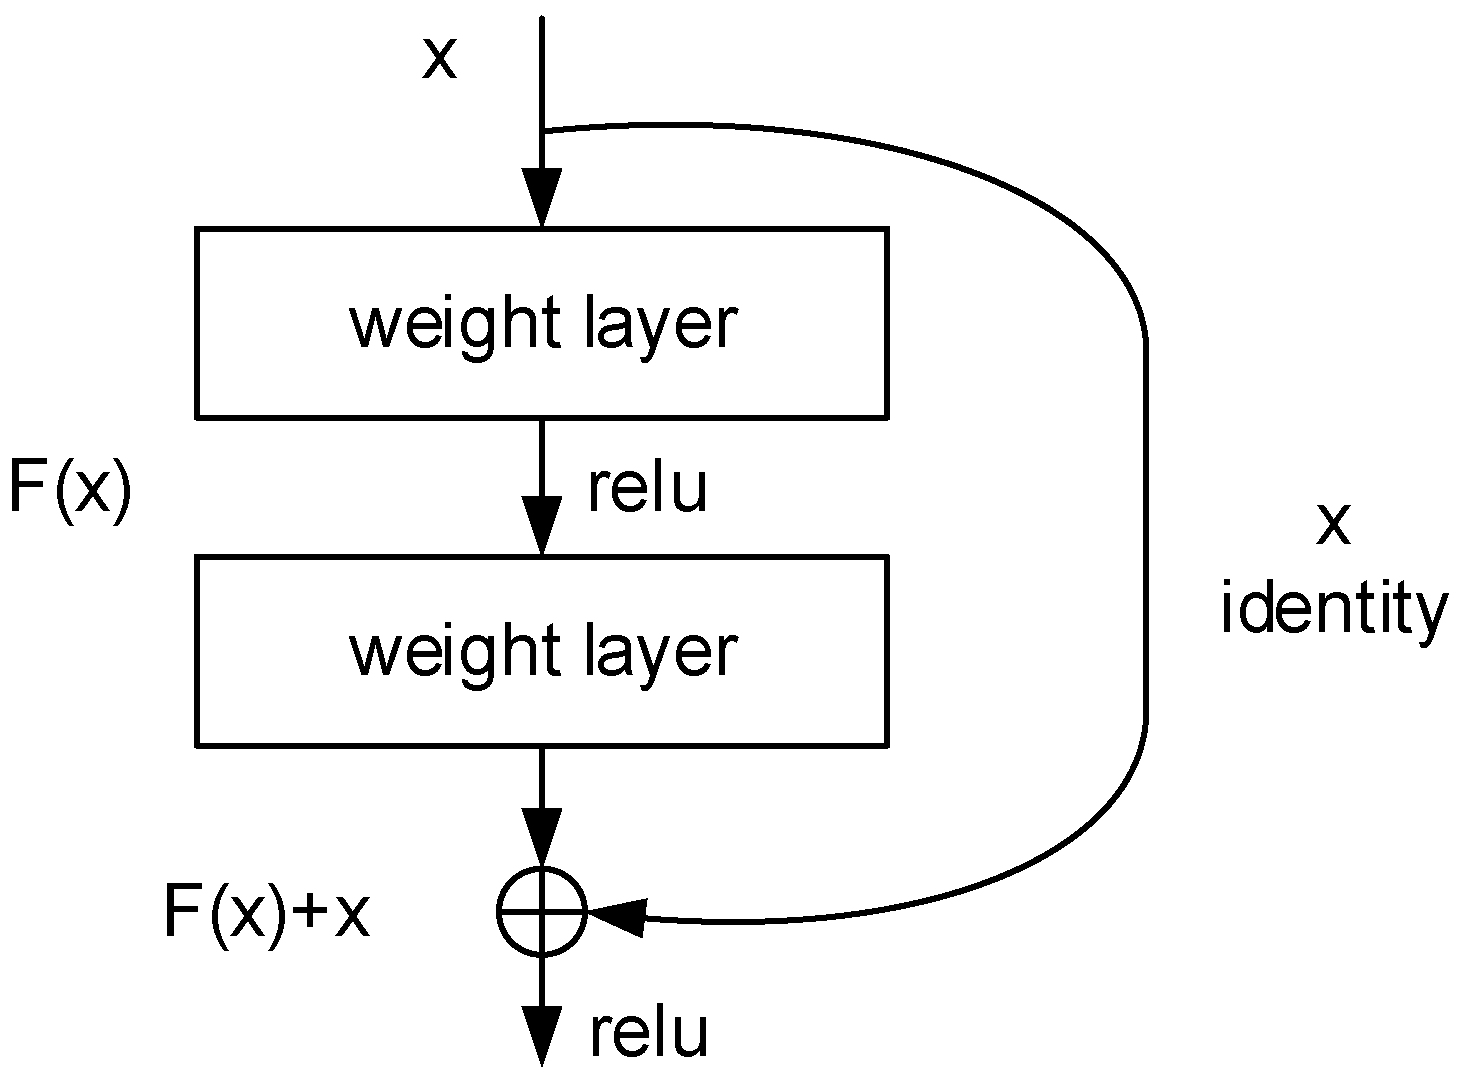
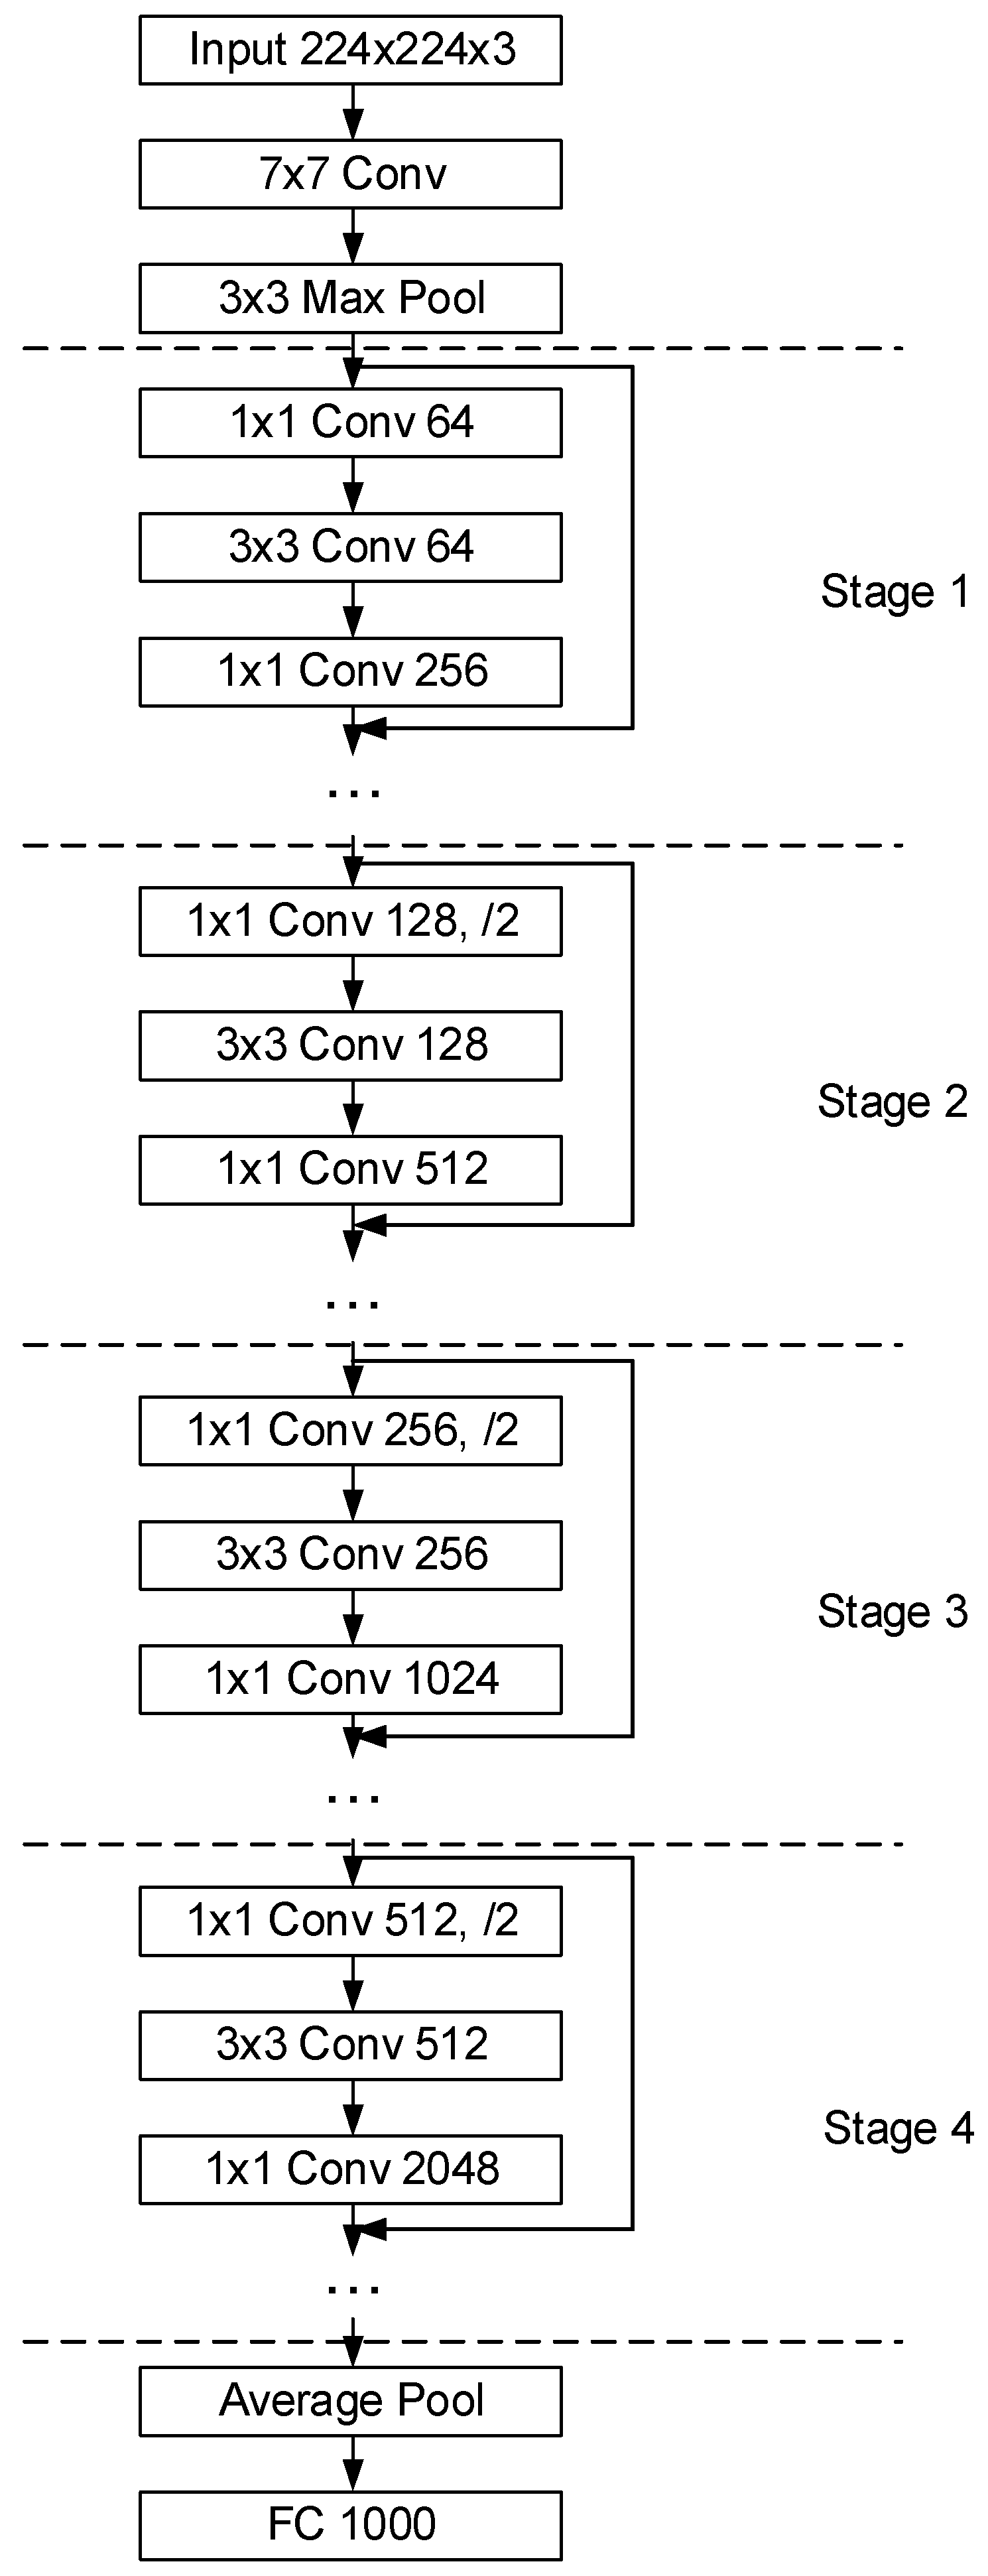
2.3. Deep CNN Architecture

The off-the-shelf deep CNN architecture ResNet [24] is used in this paper to build the transfer learning model for the purpose of classifying the snubber resistors’ conditions in the power electronic devices used in the power converter for a three-phase BLDC motor drive.
The ResNet architecture features more substantial depth compared to the previous state-off-the-art deep CNNs, e.g., VGG nets. It is known that the depths of the network plays a crucial role in the model performance. However, with the increase of the network depth further, the problem of vanishing/exploding gradients starts to saturate and even degrade the accuracy, and simply adding more layers leads to higher training errors and more difficulties to train and optimize.
In order to solve the aforementioned problem in deep networks, the ResNet introduces a deep residual learning framework using shortcut connections. The shortcut connections can skip one or more layers, as shown in Figure 4. The shortcut connections perform identity mapping, and their outputs are added to the outputs of the stacked layers. Compared with the plain networks, the introduced shortcut connections neither bring about extra parameter nor computation complexity. The experiments in [24] revealed that, unlike the very deep plain networks, their proposed ResNets are able to gain accuracy and lower training error from increased depth. The 50/101/152-layer ResNets are much more accurate than the 34-layer ones, thanks to the largely increased network depth. Besides, despite the ResNet being substantially deeper than the previous VGG nets, the complexity of the former one is still lower, and the FLOPs of the 34-layer ResNet is only 18% of that of VGG-19.
In this paper, the 50-layer ResNet is used, as shown in Figure 5. The last fully connected (FC) layer of ResNet50 is replaced with a new FC layer with a size of 7 to suit the requirement to classify seven snubber resistor conditions. The deep network is trained offline in a personal computer using the collected dataset. During the operation of the BLDC drive system, the voltages of the three shunt resistors are measured and used in the current control scheme. These voltage waveforms are also used in the online monitoring of the degradation of the snubber resistors. The embedded motor controller converts the three-phase waveforms into either greyscale or spectrogram image, loads the trained network into the memory, and performs the classification task online. An overview of the monitoring system is shown in Figure 6. Our purpose here is to give a clear guidance for when to start a system maintenance (typically once over several months), and the monitoring does not need to be in real time.

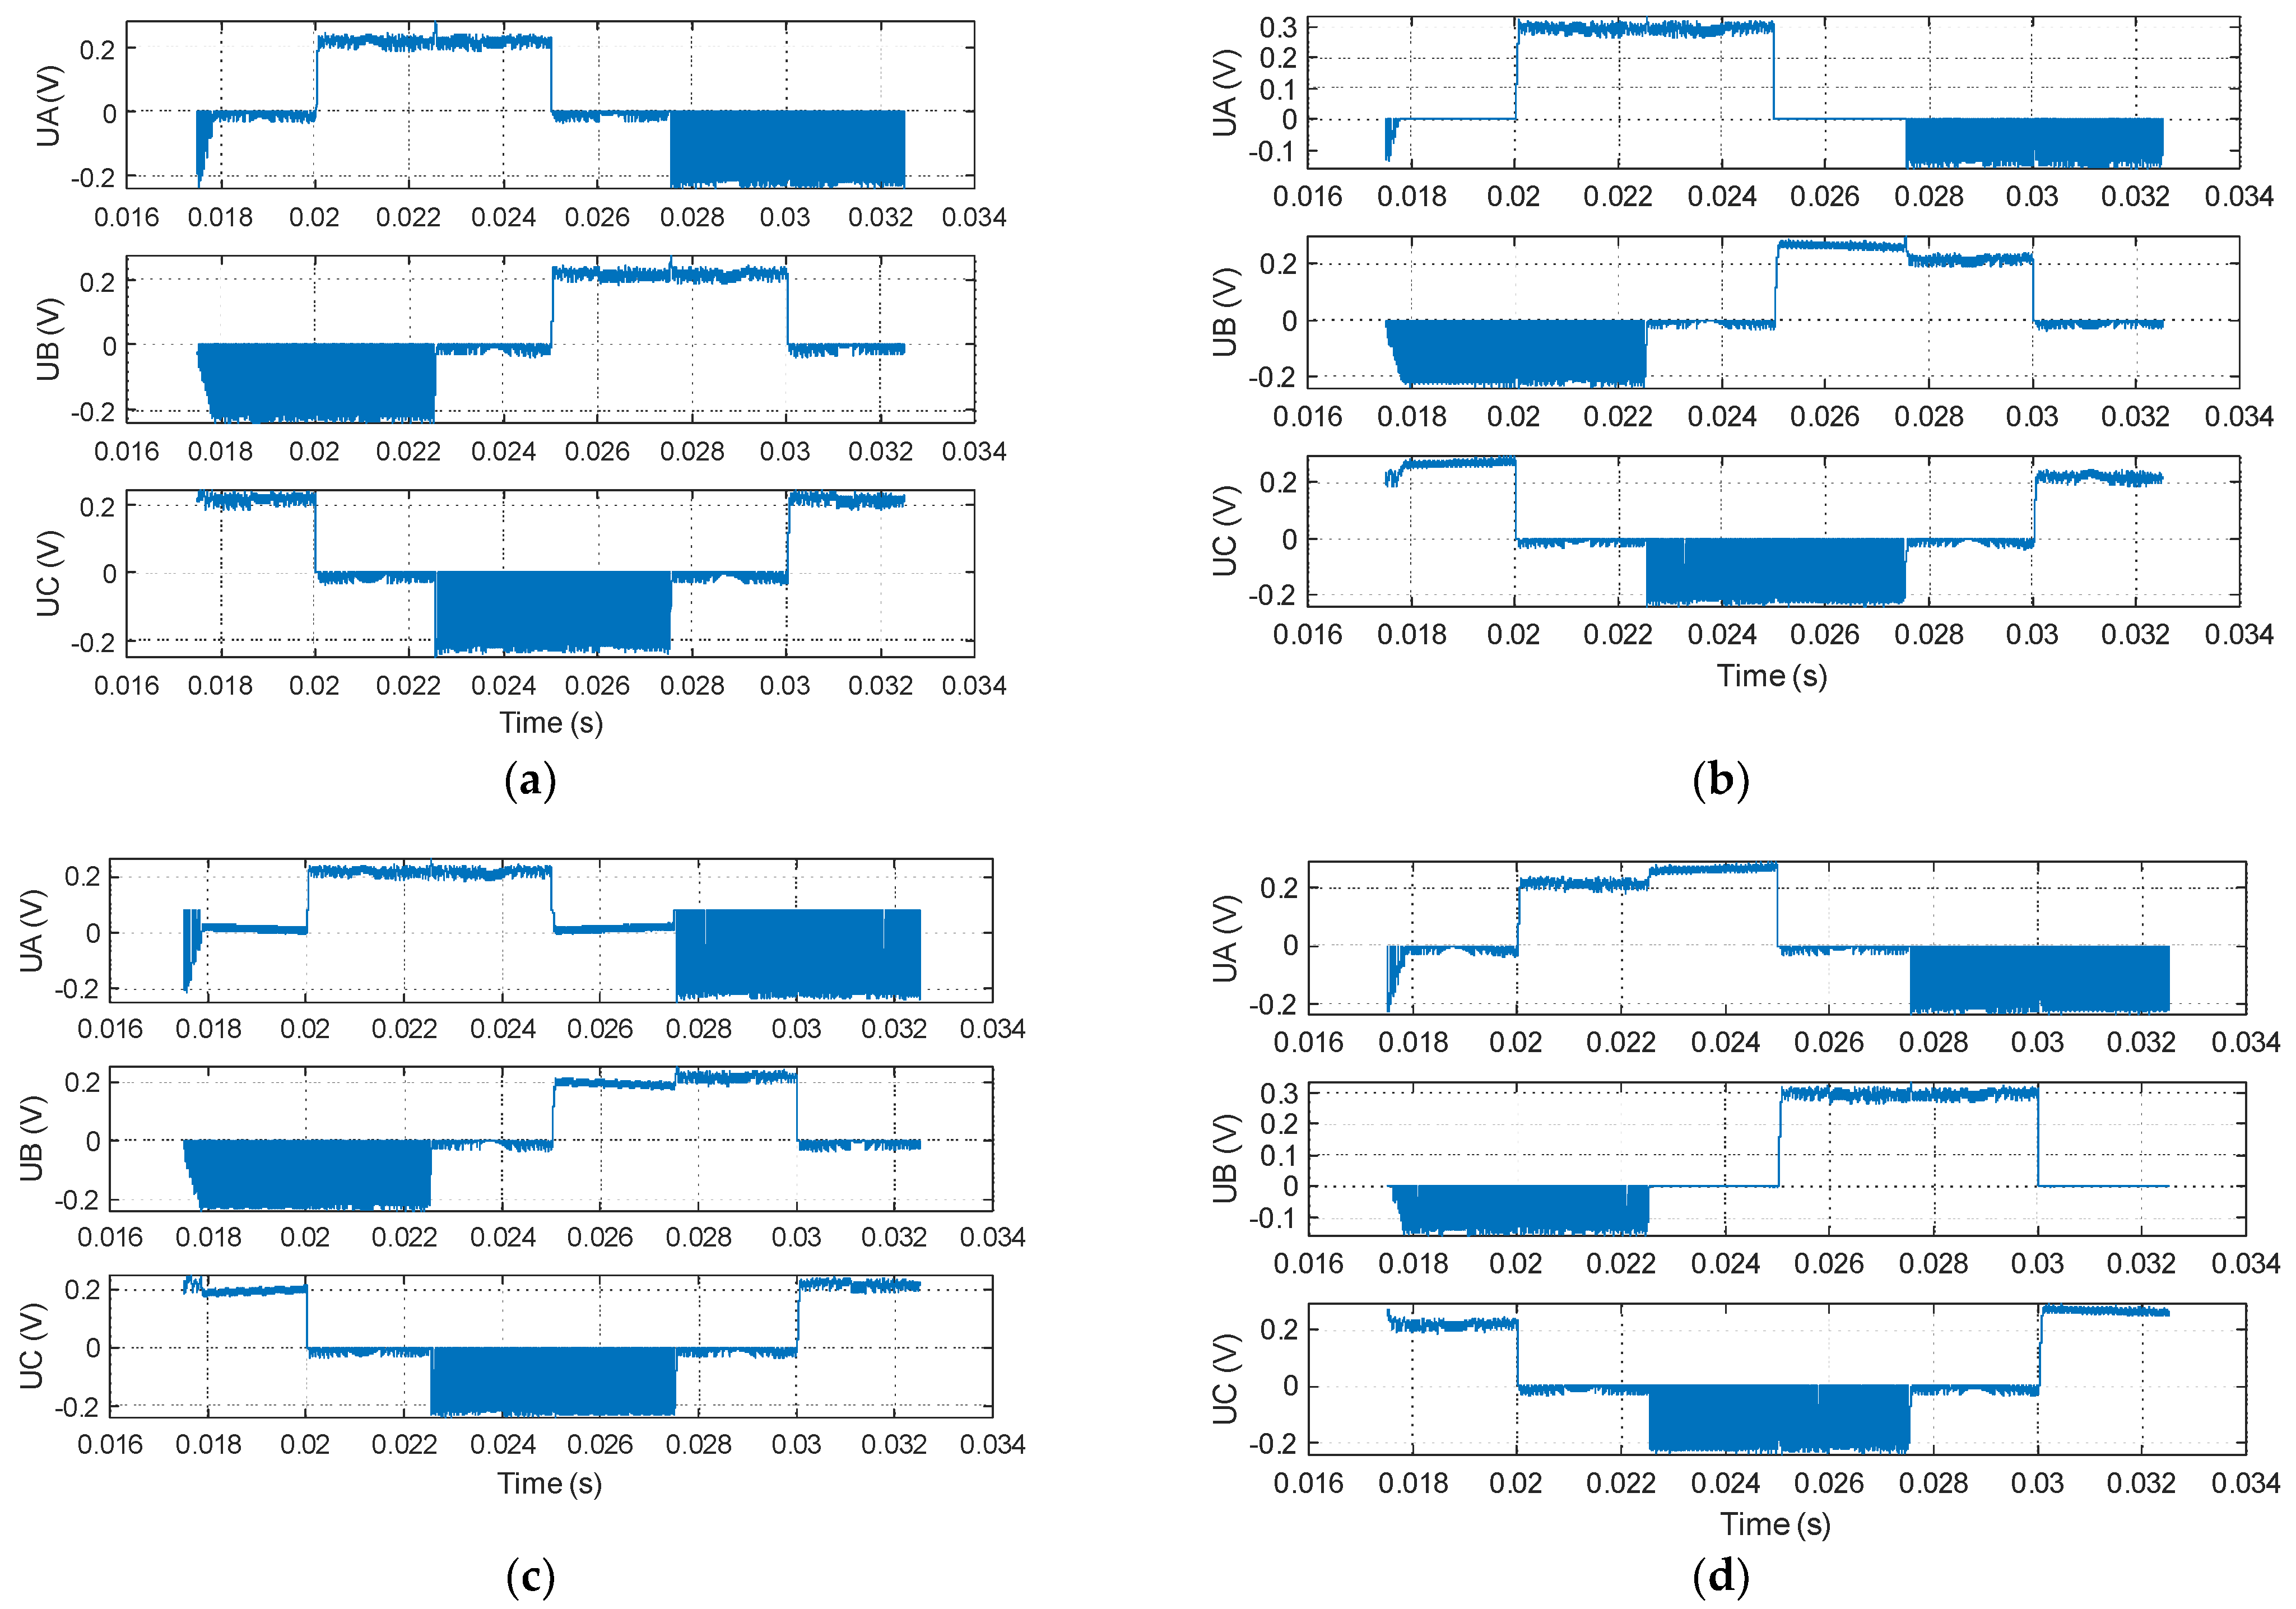
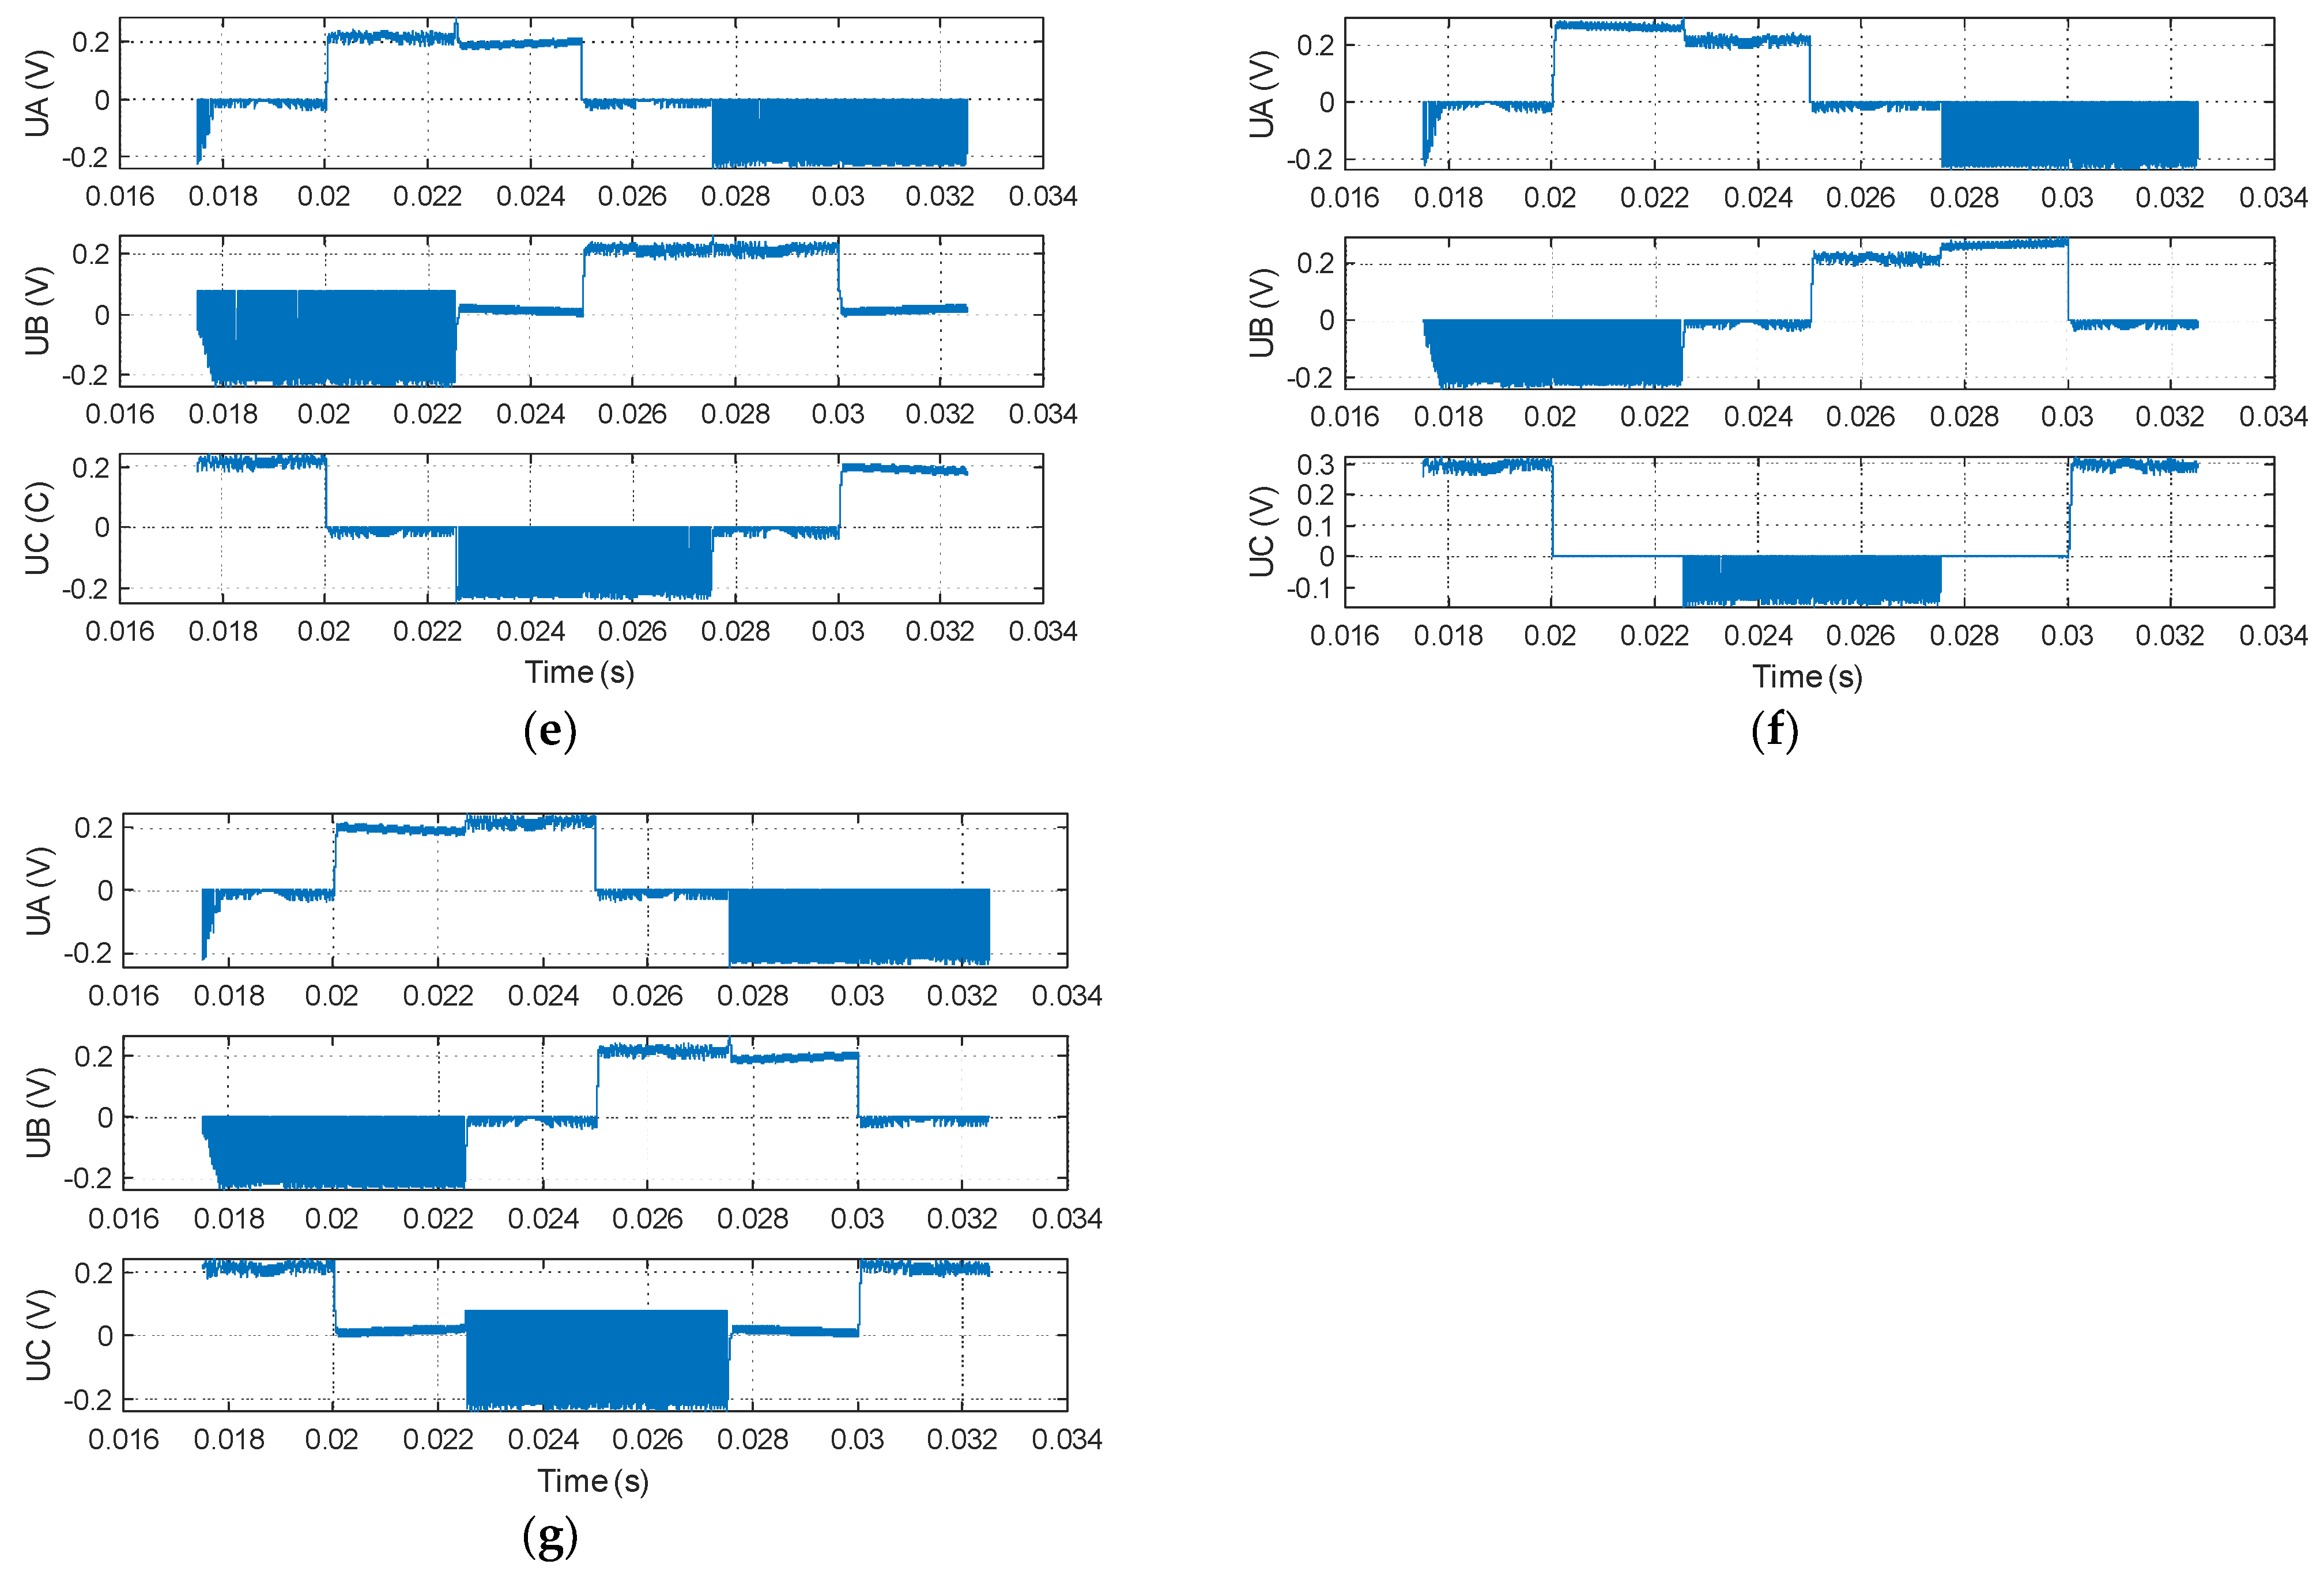
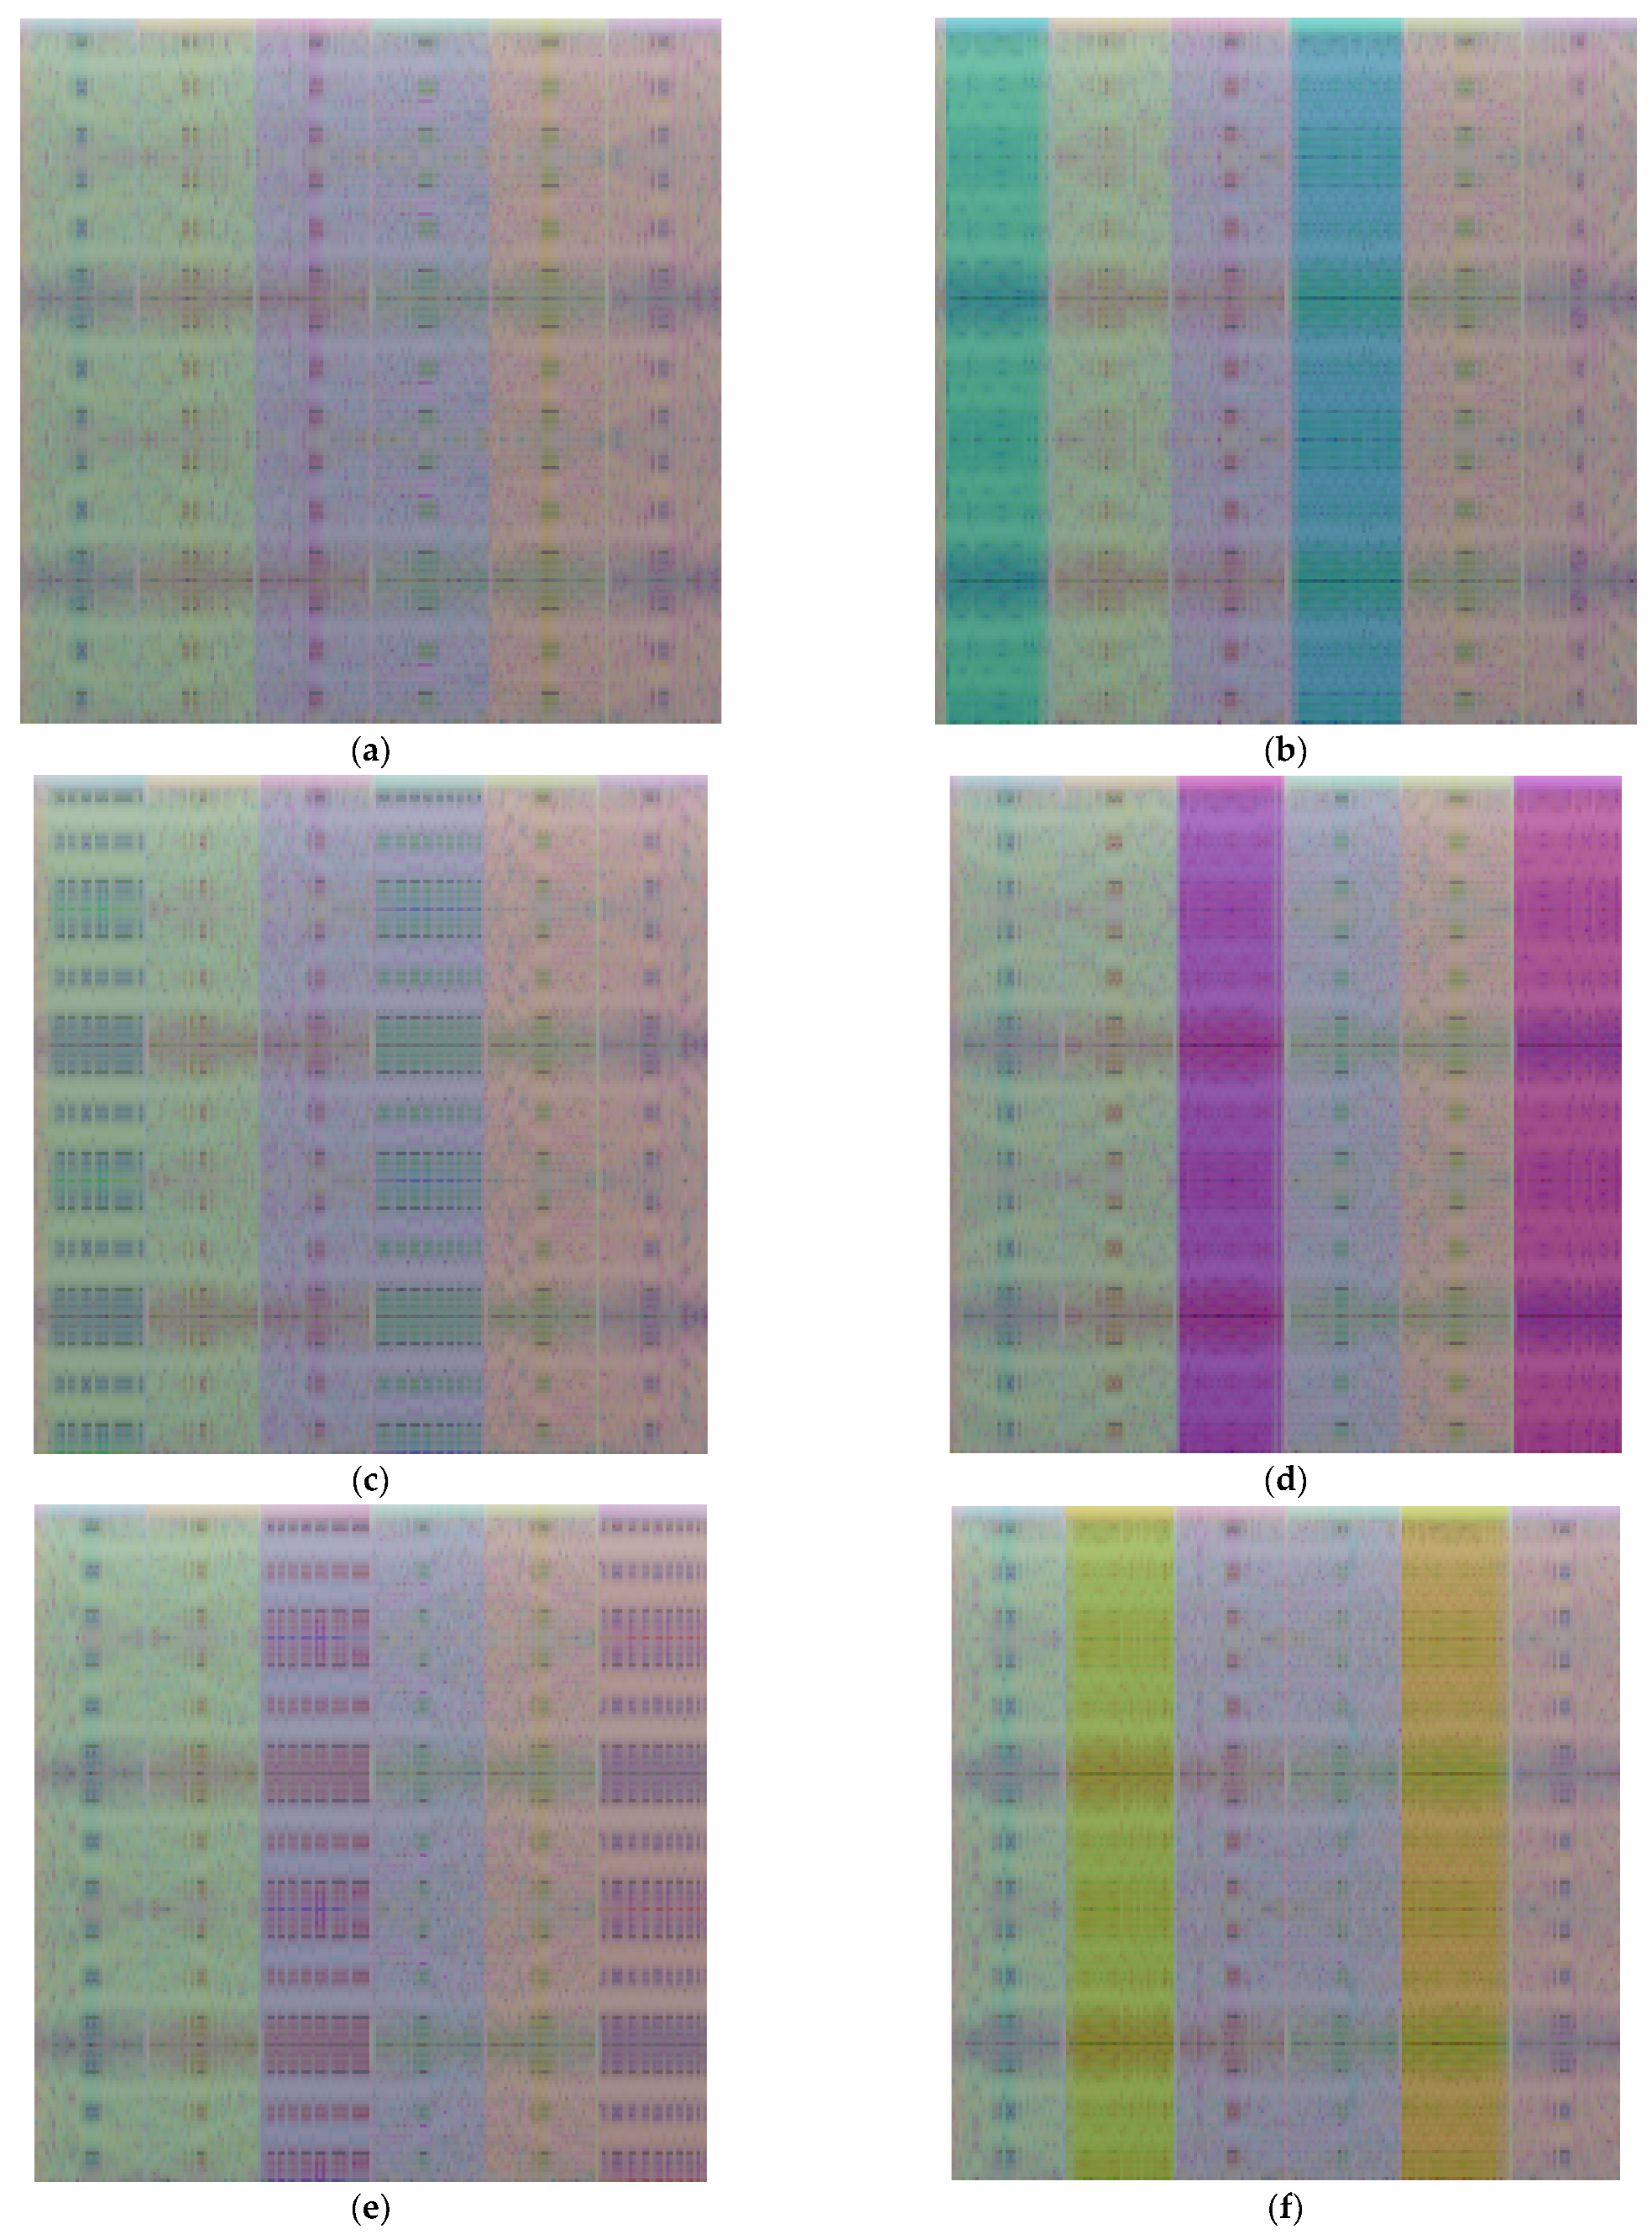
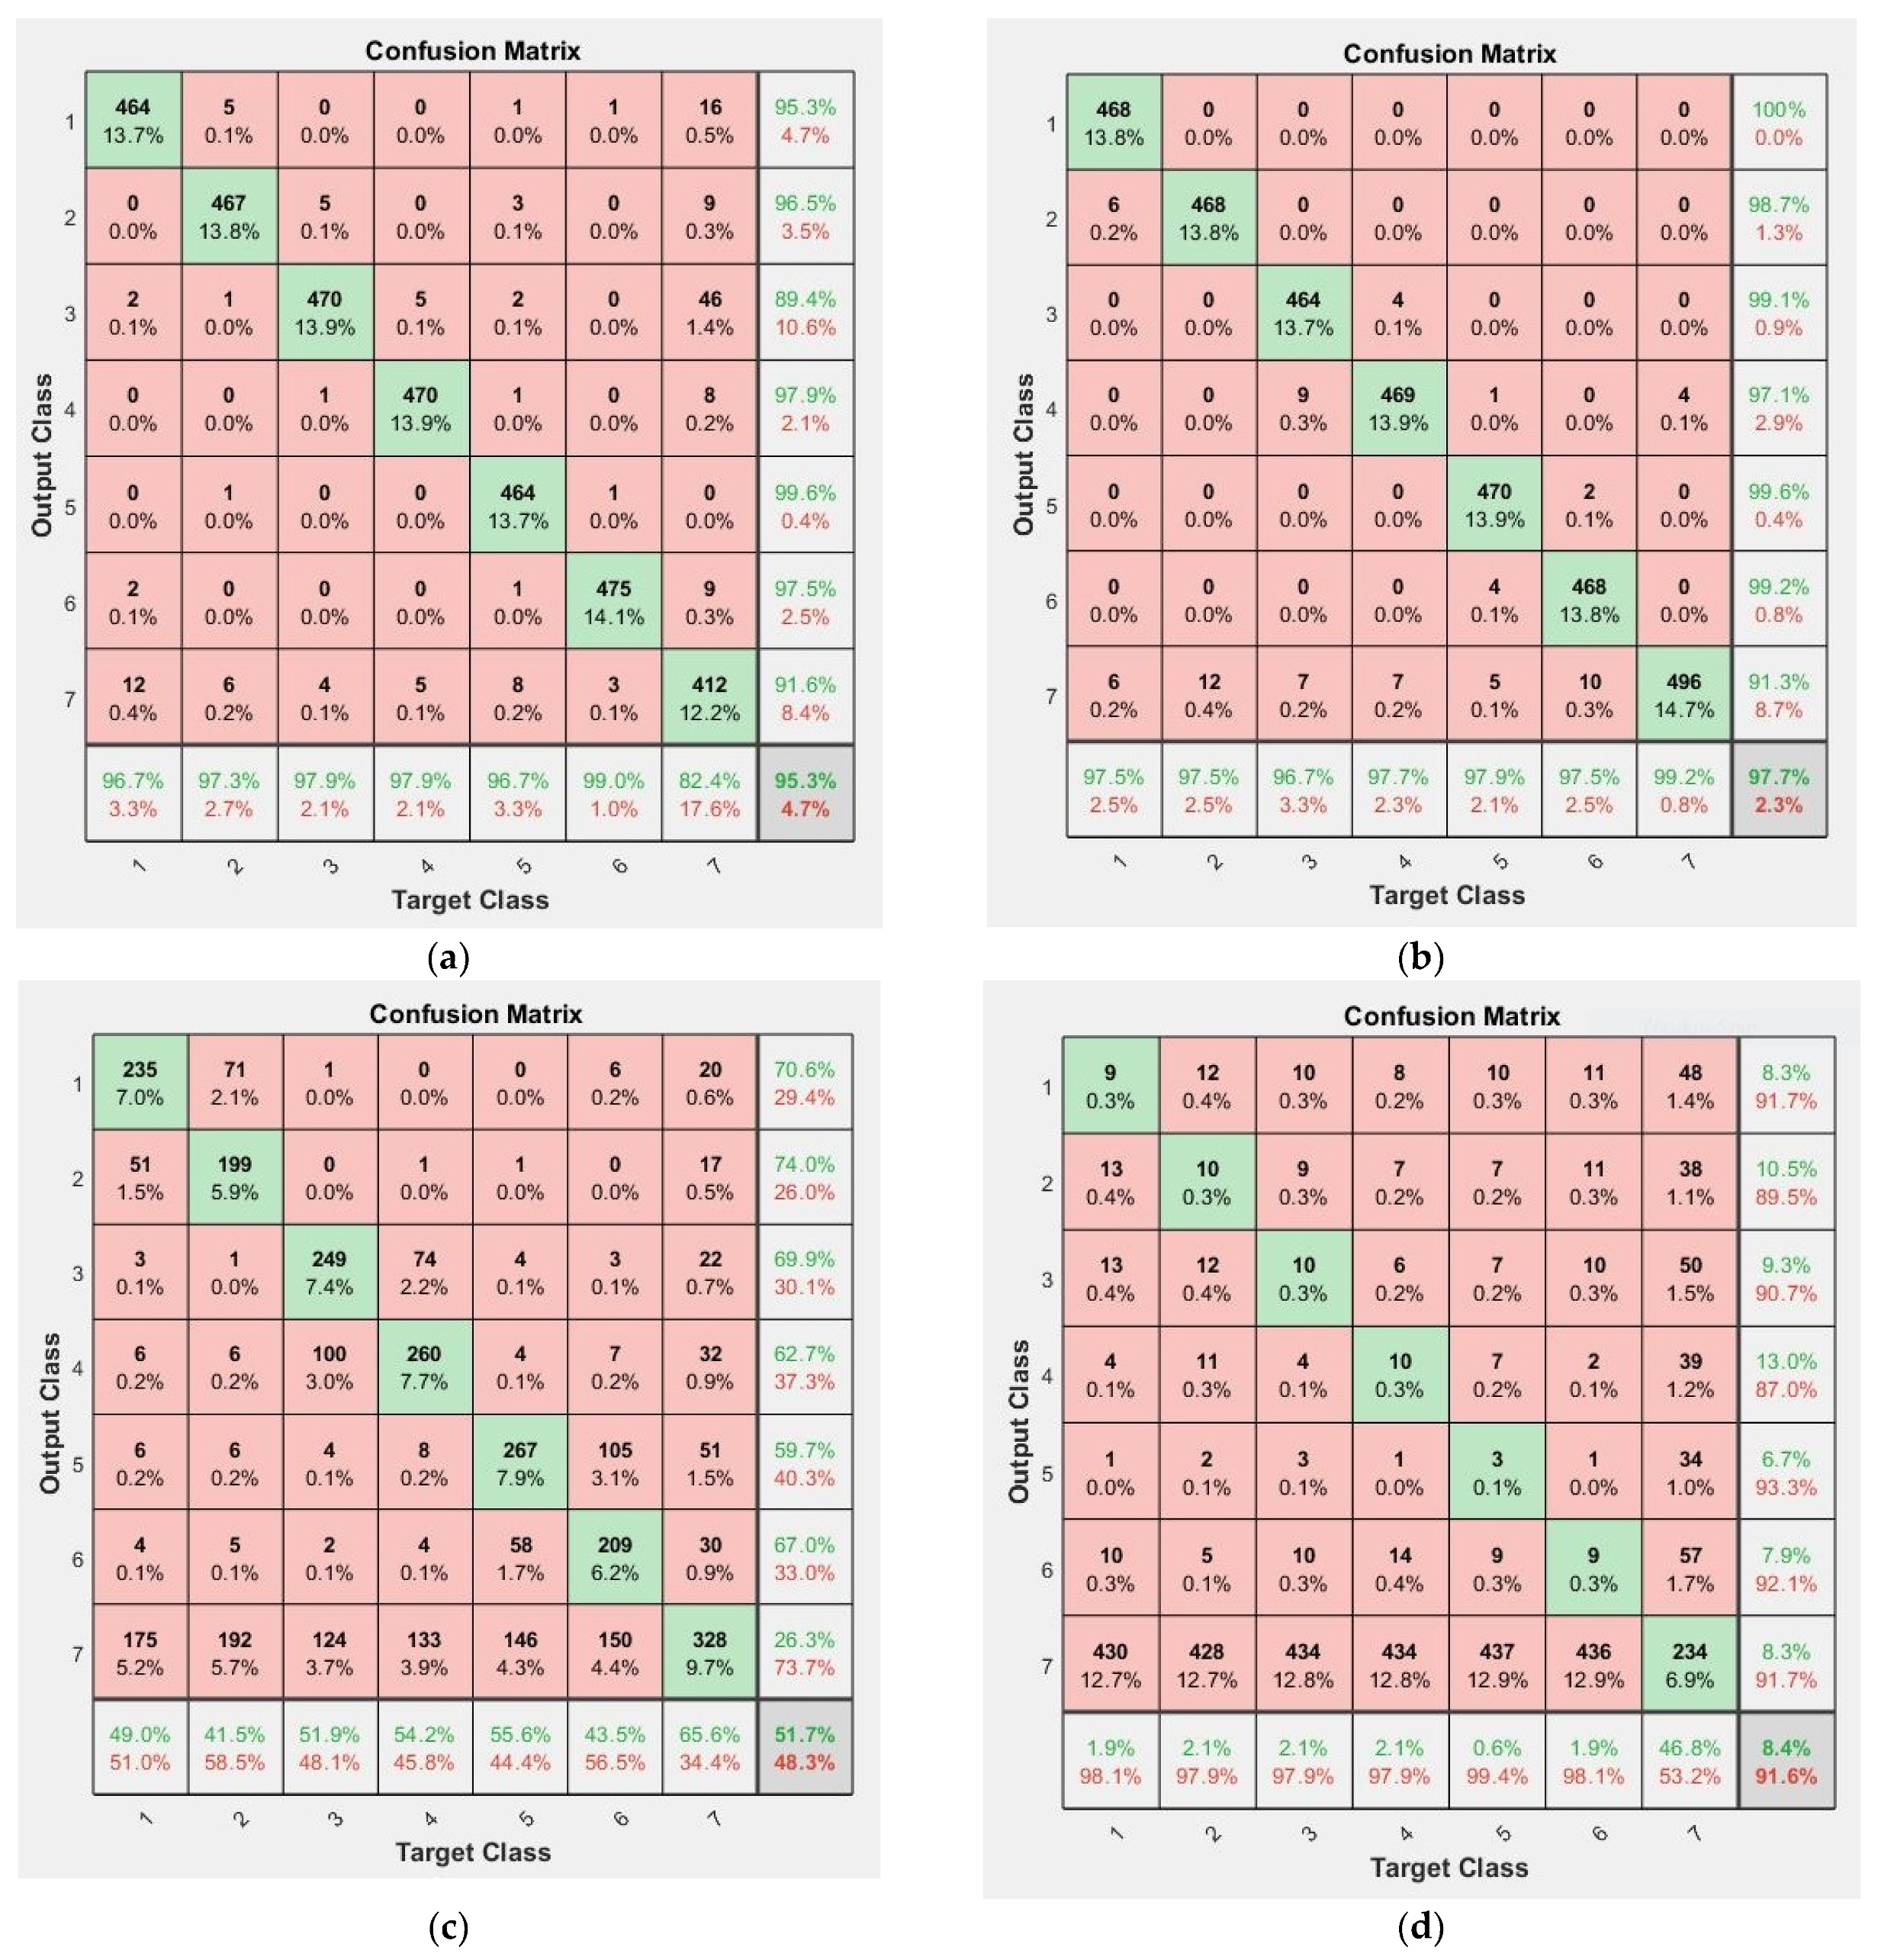
3. Experimental Results and Discussion

In order to evaluate how the proposed greyscale-based approach and the spectrogram-based approach can determine which power switch is experiencing abnormal snubber resistance in the power converter for BLDC motor drive, experiments are conducted on dataset A and dataset B1. For dataset A with greyscale images, the images are first resized to 224 × 224 pixels and converted to RGB images to fit the input layer of the transferred ResNet50. Then, the dataset is split into four folds for cross-validation; each time, three folds will be used as the training set, and the remaining fold will be used as the test set. Finally, the Adam optimizer trains the transferred deep CNN for ten epochs, with a mini-batch size of 10. The obtained average cross-validation accuracy by using the proposed method is 0.9533. For dataset B1, with the same experimental setup, the average classification accuracy is 0.9772. The confusion matrices on datasets A and B1 are shown in Figure 7a,b, respectively. The number 7 corresponds to normal condition, and the number from 1 to 6 correspond to abnormal conditions in S A H , S A L , S B H , S B L , S C H , and S C L , respectively. Comparing the two approaches featuring greyscale image and spectrogram image, the latter has a mild improvement (3%) in the classification accuracy, but STFT is needed, which increases the burden of calculation, while the former one is simpler. Thus, it is proposed to use the greyscale approach for faster detection and use the spectrogram approach if higher classification accuracy is desired.
Then, to gain insight into the range of abnormal snubber resistance, the proposed approach can best distinguish the abnormal power switch from the normal one; experiments are carried out on datasets B2 and B3. With the same setup as before, the proposed approach acquires an average accuracy of 0.5169 on dataset B2 and merely 0.0843 on dataset B3. Since it is known that dataset B2 has a range of abnormal snubber resistance closer to the normal condition than B1, and the snubber voltage waveforms are also closer to those under normal conditions, the classification is, therefore, more difficult, and the accuracy is almost half of that on dataset B1. As for dataset B3, since the range is even closer to normal conditions, the proposed approach can no longer classify the seven classes with acceptable accuracy. The confusion matrices on dataset B2 and dataset B3 are shown in Figure 7c,d, respectively. Using the proposed approach carefully is suggested, since it only takes effect when the degradation reaches a certain level.

4. Conclusions

This paper proposes a deep learning scheme for detecting the snubber resistors’ abnormal conditions of the snubber resistors in the IGBTs in the power converter for a three-phase BLDC drive. Since the degradation of the power devices sheds light on the potential failure of the power converter, it is of vital importance to monitor the health states of the power devices. The proposed scheme is based on a deep CNN architecture; it uses either greyscale images or spectrogram-based RGB images converted from the shunt voltage waveforms in three phases to determine if the power converter is under normal conditions or if the snubber resistor in one of the IGBTs has degraded. Experimental results reveal that the proposed scheme can classify one normal condition and six abnormal conditions with an accuracy above 95%. Moreover, using greyscale images and using spectrogram-based RGB images yield similar accuracy. Moreover, to classify the conditions of the power converter successfully, the value of the snubber resistance must be within a specific range.

Author Contributions

Conceptualization, Y.L.; methodology, J.F. and Y.L.; investigation, J.F.; writing—original draft preparation, J.F.; writing—review and editing, J.L.; supervision, I.J. and Y.L. All authors have read and agreed to the published version of the manuscript.

Funding

This study was supported by the Seoul National University of Science and Technology and supported by a grant from the Korea Institute of Radiological and Medical Sciences (KIRAMS), funded by Ministry of Science and ICT (MSIT), Republic of Korea. (No. 50538-2021).

Institutional Review Board Statement

Not applicable.

Informed Consent Statement

Not applicable.

Data Availability Statement

Data sharing not applicable.

Acknowledgments

This study was supported by the Seoul National University of Science and Technology and supported by a grant from the Korea Institute of Radiological and Medical Sciences (KIRAMS).

Conflicts of Interest

The authors declare no conflict of interest.

References

  1. Stepien, M.; Grzesik, B. BLDC-control of forces in passive magnetic bearings in blood pump. In Proceedings of the 2012 15th International Power Electronics and Motion Control Conference (EPE/PEMC), Novi Sad, Serbia, 4–6 September 2012; pp. LS8a.3-1–LS8a.3-3. [Google Scholar]
  2. Choi, J.; Park, J.S.; Kim, J.; Jung, I. Control scheme for efficiency improvement of slim type BLDC Motor. In Proceedings of the 2014 International Symposium on Power Electronics, Electrical Drives, Automation and Motion, Ischia, Italy, 18–20 June 2014; pp. 820–824. [Google Scholar]
  3. Yoo, J.-H.; Jung, T.-U. A Study on Output Torque Analysis and High Efficiency Driving Method of BLDC Motor. In Proceedings of the 2020 IEEE 19th Biennial Conference on Electromagnetic Field Computation (CEFC), Pisa, Italy, 16–18 November 2020; pp. 1–4. [Google Scholar]
  4. Nama, T.; Gogoi, A.K.; Tripathy, P. Application of a smart hall effect sensor system for 3-phase BLDC drives. In Proceedings of the 2017 IEEE International Symposium on Robotics and Intelligent Sensors (IRIS), Ottawa, ON, Canada, 5–7 October 2017; pp. 208–212. [Google Scholar]
  5. Yao, B.; Chen, H.; He, X.; Xiao, Q.; Kuang, X. Reliability and failure analysis of DC/DC converter and case studies. In Proceedings of the 2013 International Conference on Quality, Reliability, Risk, Maintenance, and Safety Engineering (QR2MSE), Chengdu, China, 15–18 July 2013; pp. 1133–1135. [Google Scholar]
  6. Galarce, R.V.; Lupena, F.N.; Jimenez, B.; Teo, S.M. Failure analysis defect localization of a metal stringer defect on a monolithic step-up DC-DC converter. In Proceedings of the 2016 IEEE 23rd International Symposium on the Physical and Failure Analysis of Integrated Circuits (IPFA), Singapore, 18–21 July 2016; pp. 152–156. [Google Scholar]
  7. Kwak, Y.-G.; Heo, D.-H.; Lee, B.-H.; Kang, F.-S. Failure-rate Comparison of Single-ended and Double-ended Forward Converter by means of Fault-tree Analysis. In Proceedings of the 2020 IEEE 29th International Symposium on Industrial Electronics (ISIE), Delft, The Netherlands, 17–19 June 2020; pp. 707–711. [Google Scholar]
  8. Kwak, S.; Toliyat, H.A. Fault-Tolerant Topologies and Switching Function Algorithms for Three-Phase Matrix Converter based AC Motor Drives Against Open and Short Phase Failures. In Proceedings of the 2007 IEEE International Electric Machines & Drives Conference, Antalya, Turkey, 3–5 May 2007; pp. 886–891. [Google Scholar]
  9. Yang, Q.; Qin, J.; Saeedifard, M. Analysis, Detection, and Location of Open-Switch Submodule Failures in a Modular Multilevel Converter. IEEE Trans. Power Deliv. 2016, 31, 155–164. [Google Scholar] [CrossRef]
  10. Dai, X.; Gao, Z. From Model, Signal to Knowledge: A Data-Driven Perspective of Fault Detection and Diagnosis. IEEE Trans. Ind. Inform. 2013, 9, 2226–2238. [Google Scholar] [CrossRef] [Green Version]
  11. Al-Sheikh, H.; Bennouna, O.; Hoblos, G.; Moubayed, N. Condition monitoring of bidirectional DC-DC converter for hybrid electric vehicles. In Proceedings of the 22nd Mediterranean Conference on Control and Automation, Palermo, Italy, 16–19 June 2014; pp. 97–102. [Google Scholar]
  12. Aly, M.; Ahmed, E.M.; Shoyama, M. A new real-time perfect condition monitoring for high-power converters. In Proceedings of the 2017 IEEE 3rd International Future Energy Electronics Conference and ECCE Asia (IFEEC 2017-ECCE Asia), Kaohsiung, Taiwan, 3–7 June 2017; pp. 1473–1477. [Google Scholar]
  13. Xin, X.; Yang, Y.; Ma, K.; He, B. Online Monitoring for Sub-module Capacitance in Modular Multilevel Converter with Four Sampling Points of Capacitor Voltage. In Proceedings of the 2020 IEEE 9th International Power Electronics and Motion Control Conference (IPEMC2020-ECCE Asia), Nanjing, China, 31 May–3 June 2020; pp. 935–939. [Google Scholar]
  14. Ren, L.; Gong, C.; Chen, X. Monitoring transistor degradation in power electronic converters using saturation-region resistance. In Proceedings of the 2017 IEEE Energy Conversion Congress and Exposition (ECCE), Cincinnati, OH, USA, 1–5 October 2017; pp. 1148–1153. [Google Scholar]
  15. Yao, K.; Tang, W.; Bi, X.; Lyu, J. An Online Monitoring Scheme of DC-Link Capacitor’s ESR and C for a Boost PFC Converter. IEEE Trans. Power Electron. 2016, 31, 5944–5951. [Google Scholar] [CrossRef]
  16. Buiatti, G.M.; Martín-Ramos, J.A.; Garcia, C.H.R.; Amaral, A.M.R.; Cardoso, A.J.M. An Online and Noninvasive Technique for the Condition Monitoring of Capacitors in Boost Converters. IEEE Trans. Instrum. Meas. 2010, 59, 2134–2143. [Google Scholar] [CrossRef]
  17. Karatekin, T.; Sancak, S.; Celik, G.; Topcuoglu, S.; Karatekin, G.; Kirci, P.; Okatan, A. Interpretable Machine Learning in Healthcare through Generalized Additive Model with Pairwise Interactions (GA2M): Predicting Severe Retinopathy of Prematurity. In Proceedings of the 2019 International Conference on Deep Learning and Machine Learning in Emerging Applications (Deep-ML), Istanbul, Turkey, 26–28 August 2019; pp. 61–66. [Google Scholar]
  18. Kaskavalci, H.C.; Gören, S. A Deep Learning Based Distributed Smart Surveillance Architecture using Edge and Cloud Computing. In Proceedings of the 2019 International Conference on Deep Learning and Machine Learning in Emerging Applications (Deep-ML), Istanbul, Turkey, 26–28 August 2019; pp. 1–6. [Google Scholar]
  19. Akbar, J.; Shahzad, M.; Malik, M.I.; Ul-Hasan, A.; Shafait, F. Runway Detection and Localization in Aerial Images using Deep Learning. In Proceedings of the 2019 Digital Image Computing: Techniques and Applications (DICTA), Perth, Australia, 2–4 December 2019; pp. 1–8. [Google Scholar]
  20. Baharani, M.; Biglarbegian, M.; Parkhideh, B.; Tabkhi, H. Real-Time Deep Learning at the Edge for Scalable Reliability Modeling of Si-MOSFET Power Electronics Converters. IEEE Internet Things J. 2019, 6, 7375–7385. [Google Scholar] [CrossRef]
  21. Biglarbegian, M.; Baharani, M.; Kim, N.; Tabkhi, H.; Parkhideh, B. Scalable Reliability Monitoring of GaN Power Converter Through Recurrent Neural Networks. In Proceedings of the 2018 IEEE Energy Conversion Congress and Exposition (ECCE), Portland, OR, USA, 23–27 September 2018; pp. 7271–7277. [Google Scholar]
  22. Han, T.; Li, Y.-F.; Qian, M. A Hybrid Generalization Network for Intelligent Fault Diagnosis of Rotating Machinery Under Unseen Working Conditions. IEEE Trans. Instrum. Meas. 2021, 70, 3520011. [Google Scholar] [CrossRef]
  23. Filippetti, F.; Franceschini, G.; Tassoni, C.; Vas, P. Recent developments of induction motor drives fault diagnosis using AI techniques. IEEE Trans. Ind. Electron. 2000, 47, 994–1004. [Google Scholar] [CrossRef]
  24. He, K.; Zhang, X.; Ren, S.; Sun, J. Deep residual learning for image recognition. In Proceedings of the IEEE Conference on Computer Vision and Pattern Recognition, Las Vegas, NV, USA, 27–30 June 2016; pp. 770–778. [Google Scholar]
Figure 1. BLDC motor drive.
Applsci 11 11796 g001
Figure 2. Voltage waveforms of shunt resistors. (a) Normal condition; (b) abnormal condition in S A H ; (c) abnormal condition in S A L ; (d) abnormal condition in S B H ; (e) abnormal condition in S B L ; (f) abnormal condition in S C H ; (g) abnormal condition in S C L .
Applsci 11 11796 g002aApplsci 11 11796 g002b
Figure 3. Spectrogram-based image obtained from one electrical cycle of the three-phase shunt voltage waveforms. (a) Normal condition; (b) when snubber resistance has degraded in S A H ; (c) when snubber resistance has degraded in S A L ; (d) when snubber resistance has degraded in S B H ; (e) when snubber resistance has degraded in S B L ; (f) when snubber resistance has degraded in S C H ; (g) when snubber resistance has degraded in S C L .
Applsci 11 11796 g003aApplsci 11 11796 g003b
Figure 4. Shortcut connection.
Applsci 11 11796 g004
Figure 5. Architecture of ResNet50.
Applsci 11 11796 g005
Figure 6. Overview of the monitoring system.
Applsci 11 11796 g006
Figure 7. (a) Confusion matrix on dataset A using greyscale images; (b) confusion matrix on dataset B1 using spectrogram images; (c) confusion matrix on dataset B2; (d) confusion matrix on dataset B3.
Applsci 11 11796 g007
Table 1. Switching patterns of the BLDC motor drive.
Switching Interval0°–60°60°–120°120°–180°180°–240°240°–300°300°–360°
Sequence Number012345
Hall Sensors H A 111000
H B 001110
H C 100011
Phase CurrentAOFF++OFF
BOFF++OFF
C+OFFOFF+
Publisher’s Note: MDPI stays neutral with regard to jurisdictional claims in published maps and institutional affiliations.

