Article

Analysis of Clinical Profiles, Deformities, and Plantar Pressure Patterns in Diabetic Foot Syndrome

1
Department of Cardiovascular, Endocrine-Metabolic Diseases and Aging, Italian National Institute of Health, 00161 Rome, Italy
2
UOC Medicina Riabilitativa e Neuroriabilitazione, IRCCS Istituto Scienze Neurologiche, 40139 Bologna, Italy
3
Movement Analysis Laboratory, IRCCS Istituto Ortopedico Rizzoli, 40136 Bologna, Italy
4
IRCCS-Azienda Ospedaliera di Bologna Policlinico Sant’Orsola-Malpighi, 40138 Bologna, Italy
5
Department of Biomedical and Neuromotor Sciences, University of Bologna, 40126 Bologna, Italy
*
Author to whom correspondence should be addressed.
Appl. Sci. 2021, 11(23), 11464; https://doi.org/10.3390/app112311464
Submission received: 15 September 2021 / Revised: 13 November 2021 / Accepted: 25 November 2021 / Published: 3 December 2021
(This article belongs to the Special Issue Diabetic Foot)

Abstract

:
Diabetic foot syndrome refers to heterogeneous clinical and biomechanical profiles, which render predictive models unsatisfactory. A valuable contribution may derive from identification and descriptive analysis of well-defined subgroups of patients. Clinics, biology, function, gait analysis, and plantar pressure variables were assessed in 78 patients with diabetes. In 15 of them, the 3D architecture of the foot bones was characterized by using weight-bearing CT. Patients were grouped by diabetes type (T1, T2), presence (DN) or absence (DNN) of neuropathy, and obesity. Glycated hemoglobin (HbA1c) and plantar lesions were monitored during a 48-month follow-up. Statistical analysis showed significant differences between the groups for at least one clinical (combined neuropathy score, disease duration, HbA1c), biological (age, BMI), functional (joint mobility, foot alignment), or biomechanical (regional peak pressure, pressure-time integral, cadence, velocity) variable. Twelve patients ulcerated during follow-up (22 lesions in total), distributed in all groups but not in the DNN T2 non-obese group. These showed biomechanical alterations, not always occurring at the site of lesion, and HbA1c and neuropathy scores higher than the expected range. Three of them, who also had weight-bearing CT analysis, showed >40% of architecture parameters outside the 95%CI. Appropriate grouping and profiling of patients based on multi-instrumental clinical and biomechanical analysis may help improve prediction modelling and management of diabetic foot syndrome.

1. Introduction

Altered plantar pressure patterns are largely debated when investigating diabetic foot syndrome. In particular, the possible role of abnormal plantar loading in the onset of the foot ulceration process is frequently examined. The most recent guidelines of the International Working Group on Diabetic Foot (IWGDF) [1] stated that “high plantar pressures are a significant independent risk factor for foot ulceration and should therefore be avoided” [2,3]. Despite this evidence, predictive models of risky plantar pressure patterns still have to reach general validity and agreement. Several interesting models do, however, exist. In 2006, Giacomozzi and Martelli [4] used a cluster analysis approach to correlate the peak pressure curve pattern with ankle joint mobility, lower leg muscle isometric torque, and gait analysis. The model showed moderate-to-good sensitivity and specificity to predict foot ulceration, but it was only validated for type 2 diabetes. Hazari et al. [5] proposed a diabetic foot prediction model based on regression analysis, with more than 150 variables. The model, which fitted a type 2 population well, mainly relied on diabetes-related clinical variables, a specific grading of neuropathy, anthropometrics but not body mass, foot structure and alignment, and foot and leg kinematics. Barn et al. [6] reported gender, body mass, diabetes duration, glycated hemoglobin (HbA1c), vibration perception threshold (VPT), rotation axis of ankle joint motion, foot deformity, ankle range of motion, and callus as significant predictors of peak pressure among their population. Fawzy et al. [7] reported a multivariate logistical regression analysis, performed over a pooled sample of 100 patients with type 1 (37%) and type 2 (63%) diabetes, where risk of ulceration was found to be associated with duration of diabetes, smoking, severity of neuropathy, glycemic control, and high peak pressure values and gradients. The study did not account for foot motion. Al-Rubeaan et al. [8] modelled risk factors for diabetic foot complications on the wide cohort (62,681 patients with diabetes) of the Saudi National Register and showed significant odds ratio for Charcot joints, peripheral vascular disease, neuropathy, diabetes duration >10 years, insulin use, retinopathy, nephropathy, age >45 years, cerebral vascular disease, poor glycemic control, coronary artery disease, male gender, smoking, and hypertension. This study analyzed clinical and biological variables, demographics, and lifestyle, while no data were available with respect to foot structure and biomechanics.
With respect to ulcer recurrence, Aan de Stegge et al. [9] recently developed a multi-variable prediction model addressing all types of recurrent plantar foot ulcers and including the following risk factors: the presence of a minor lesion, living alone, increased barefoot peak plantar pressure, longer duration of having a previous foot ulcer, and less variation in daily stride count. The study included 171 patients with type 1 (~30%) and type 2 (~70%) diabetes and history of recurrent ulcers, and the model area under the receiver operator curve was 68%.
With special attention to model diabetic foot plantar pressures by exploiting radiological assessment, Guldemond et al. [10] implemented a linear regression model based on variables extracted from barefoot plantar pressure measurements, radiographic evaluation, and peripheral neurological, orthopedic, and vascular assessment. The latter consisted of weight-bearing anterior-posterior and lateral radiographs, which delivered 18 (5 angular and 13 linear) and 15 (9 angular and 6 linear) measurements, respectively. The model could only explain about 34% of the variance in the local peak pressure. However, the inclusion of foot architecture in the model may be of interest, especially now that innovative foot architecture measurements can be extracted from the weight-bearing CT (WBCT) [11].
The complexity of modeling diabetic foot loading alterations was addressed in Giacomozzi et al. [12]. The authors highlighted the extremely high variability of the dynamic plantar loading pattern, also due to the heterogeneity of the patients’ clinical and bio-mechanical profiles, and suggested a more refined patient stratification, either for modelling or ulcer risk classification.
The main hypothesis of the present study was that the stratification of patients with diabetes in subgroups according to type, presence or absence of neuropathy, and presence or absence of obesity may help reduce the variability of their most relevant characteristics. As a consequence, profiles peculiar to each group might be better identified for the main clinical, biological, orthopedic, functional, and biomechanical variables. This study was then articulated to address three main objectives: (1) to describe patient profiles within each group and to highlight possible differences; (2) to analyze and interpret the profiles of those patients who developed lesions during a 48-month follow-up period; and (3) to explore the possible relevance of the analysis of the 3D foot architecture—delivered by the weight-bearing CT (WBCT)—conducted on a small subset of type 1 patients.

2. Materials and Methods

2.1. Participants

From January to December 2016, patients with diabetes referring to the Diabetic Foot Clinical Center of the S. Orsola-Malpighi Hospital (Bologna, Italy) were invited to participate in the study. Those who gave informed consent were first screened at the Diabetic Foot Clinical Center and then examined at the Movement Analysis Laboratory of the Istituto Ortopedico Rizzoli (Bologna, Italy) within one week. The following information were collected via the clinical and podiatric screening: biological data (age, gender, body mass index (BMI), and obesity grade [13]), clinical data (type of diabetes, years of disease (YOD), glycated hemoglobin (HbA1c) level, peripheral neuropathy grade based on the Michigan Neuropathy Screening Instrument [14] and the Vibration Perception Threshold (VPT) measurement, the presence of peripheral artery disease or of other relevant co-morbidities), and functional and orthopedic data (passive ankle joint mobility [15], hindfoot alignment, hallux mobility and alignment [15], pain via the visual analogue scale (VAS) and the Manchester Oxford Foot Questionnaire (MoX) [16]). On the same day of the examination at the Movement Analysis Laboratory, patients were functionally assessed via gait analysis according to the experimental protocol detailed in the following as experimental protocol 1 (Section 2.2). Those patients who also gave consent to the WBCT acquisitions were examined three-to-six months after the overall assessment according to the experimental protocol 2 detailed in the following (Section 2.3).
Seventy-nine patients were enrolled in total, all without peripheral artery disease (Ankle-Brachial Index (ABI) > 0.9). Only one type 1 patient was in the obesity range and was examined but excluded from the analysis by group. The remaining 78 patients were grouped as follows: type 1 patients with neuropathy (DNT1, 12 patients); type 1 patients without neuropathy (DNNT1, 15 patients); type 2 patients, not obese and with neuropathy (DNT2-no ob, 11 patients); type 2 patients, with obesity and neuropathy (DNT2-ob, 20 patients); type 2 patients, without obesity or neuropathy (DNNT2-no ob, 7 patients); and type 2 patients, with obesity and without neuropathy (DNNT2-ob, 13 patients) (Table 1).
The design of the statistical analysis was based on the identified number of groups (6), probability of type I error α = 0.05, power = 0.80, and effect size = 0.5. The estimated total sample size was 60 (G*Power version 3.1.9.7, Heinrich Heine Universität, Dusseldorf, Germany). Each patient executed an established gait analysis experimental protocol (experimental protocol 1, see below). Fifteen of the 27 type 1 patients (7 DNNT1 and 8 DNNT1) also agreed to participate in weight-bearing CT scans and were examined (experimental protocol 2 below). All patients were followed up for the following 48 months at the Diabetic Foot Clinical Center, where the ulcer prevention program was implemented on the basis of the IWGDF Guidelines [1]. HbA1c was also measured every six months from the overall assessment. Patients who developed lesions (PWL) were analyzed both as an additional group and individually.
Approval was obtained by the metropolitan ethical committee for experimental protocol 1 and by the local Ethical Committee (Prot. IOR 7685 28 July 2017) for experimental protocol 2. Relevant informed consents were signed by participants in the study.

2.2. Experimental Protocol 1: Data Collection and Analysis

Multi-instrumental gait analysis was performed by exploiting an established pressure-force-kinematics technique [17] so as to obtain highly reliable plantar regions of interest (ROIs). While ROI identification is often based on the geometry of the acquired pressure footprint, whenever proper stereophotogrammetry for foot kinematics and a suitable multi-segmental foot model are reliably used, ROIs can be better identified by exploiting the position of foot and ankle anatomical markers. This reliable anatomical masking allows the best matching between plantar loaded areas and anatomical structures of the foot to be achieved, even in the presence of abnormal or incomplete footprints [18,19]. In the present study, the Rizzoli Foot Model [20] and the anatomical masking were used to separate the hindfoot from the midfoot on the basis of the midtarsal joint (Chopart’s joint), the midfoot from the forefoot on the basis of the Lisfranc joint, the metatarsal area of the forefoot from the toes based on the arch of the metatarsal heads and the positions of the first metatarsal head and the base of the hallux phalanx, and the hallux from the other toes on the basis of the alignment of the first metatarsal. The experimental protocol of this study relied on pressure patterns and kinematic data acquired during barefoot level walking at a self-selected speed. A capacitive sensor platform (EMED® q-100, novelGmbH, Munich, Germany; 4 sensors/cm2; range 0–1270 kPa; 100 Hz) was synchronized with an eight-camera 3D motion tracking system (Vicon®, Oxford, UK) by off-line aligning the signal from the pressure platform to the signal from a force plate rigidly fixed underneath and acquired simultaneously with the tracking system. The established marker-set of the Rizzoli Foot Model [20] was used to track the multi-segment foot kinematics. Five consistent full footprints were collected for each patient and foot. The anatomical masking procedure was automatically applied to each foot (EMED-associated software packages by novelGmbH, Munich, Germany) to identify the five ROIs, namely the hindfoot, the midfoot, the forefoot, the big toe, and the other toes [17]. Main pressure-related parameters were extracted for each ROI by means of the same dedicated software packages and averaged over repetitions within each foot. Regional Peak Pressure (PP, kPa) and Pressure-Time Integral (PTI, kPa·s) were included in the analysis for a total of 10 parameters for each foot. The dominant (D) and non-dominant (ND) limbs were analyzed separately.

2.3. Experimental Protocol 2: Data Collection and Analysis

Both feet of each of the 15 type 1 patients were CT scanned (OnSight 3D Extremity System, Carestream, Rochester, NY, USA) in single-leg upright posture. Patients were instructed to put full weight on the analyzed foot and to use the other contacts just for equilibrium. For the preliminary study [11], only one randomly selected foot was analyzed for each patient. For this foot scan, virtual slicing set at a 0.26 mm distance was performed and the resulting DICOM file was then processed in Amira™ (Thermo Fisher™ Scientific, Waltham, MA, USA) to define a corresponding 3D model for each of the relevant bones. These files in STL format were imported in Matlab® (Mathworks Inc., Natick, MA, USA), where dedicated algorithms made it possible to define an appropriate foot anatomical reference frame and to realign bone segments to this frame. Absolute and relative metatarsals and phalanxes inclinations were calculated in the three anatomical planes and in 3D, i.e., with respect to the floor. Absolute and relative heights of metatarsals, phalanxes, and cuboid and navicular bones were also included in the analysis, for a total of 84 variables for each foot.

2.4. Data Analysis and Statistics

Descriptive statistics were done on the following variables, grouped as follows:
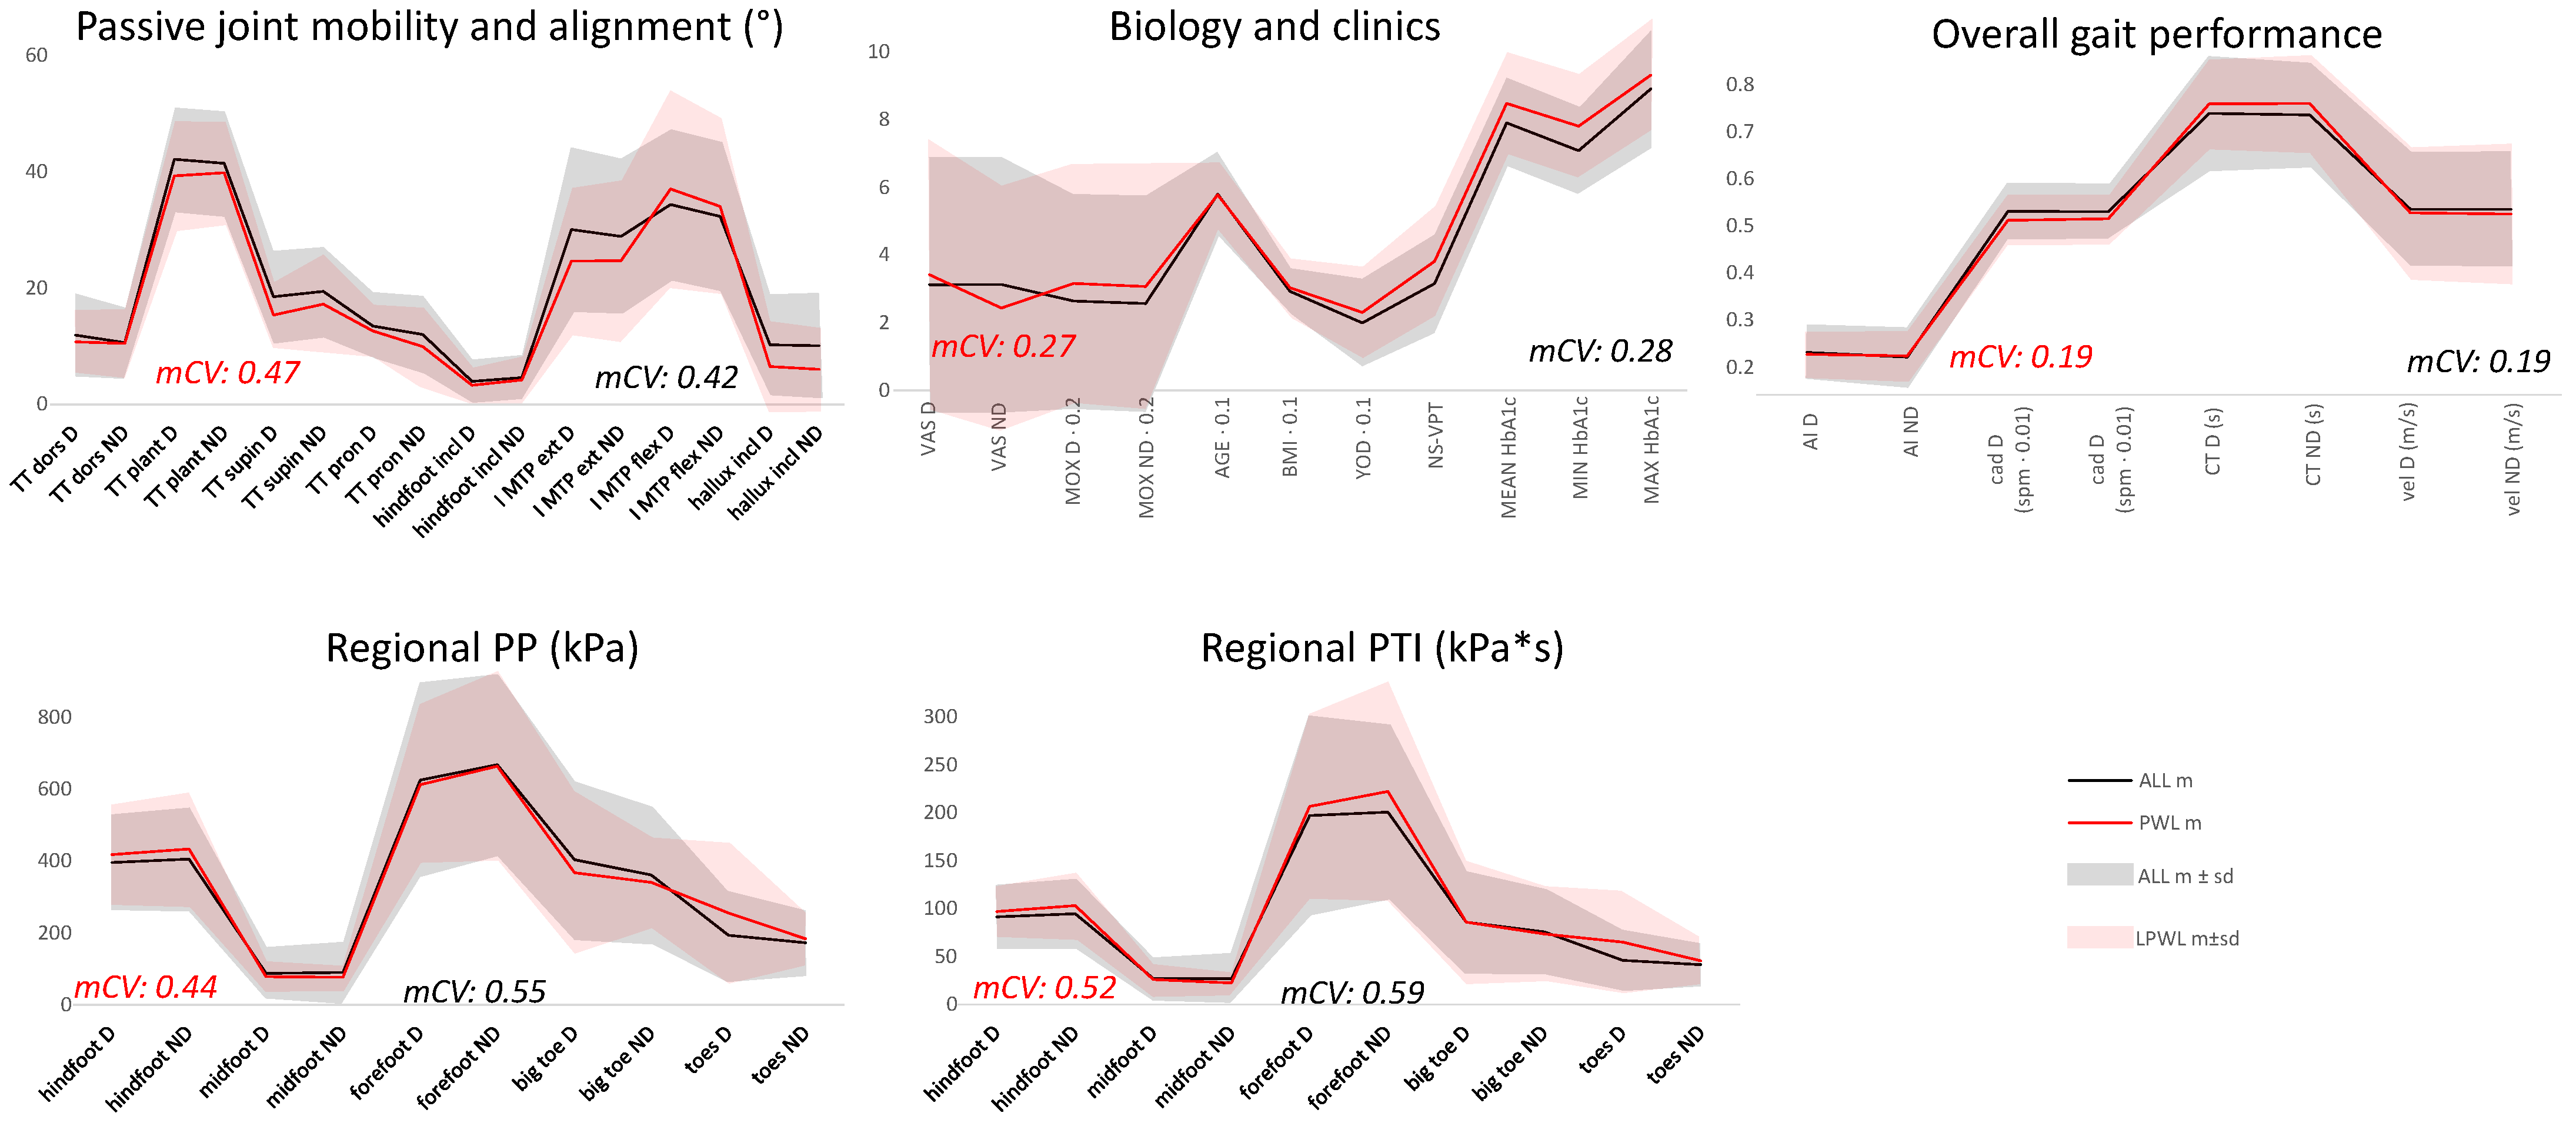
  • Passive joint mobility and alignment (all measured in degrees) [15]: maximum passive ankle dorsiflexion (TT dors); maximum passive ankle plantar flexion (TT plant); maximum passive ankle inversion (TT supin); maximum passive ankle eversion (TT pron); maximum passive first metatarsophalangeal joint extension (I MTP ext); maximum passive first metatarsophalangeal joint flexion (I MTP flex); hindfoot inclination in the frontal plane (hindfoot incl); hallux inclination in the transverse plane (hallux incl);
  • Biology and clinics: age (years); body mass index (BMI, kg/m2); years of disease (YOD, years); combined neuropathy score (NS-VPT, relative unit), which combines scores from the MNSI with the vibration perception threshold (VPT, volts) at both limbs [11]; mean glycated hemoglobin (Mean HbA1c, %) averaged over the 48-month follow-up; minimum HbA1c (MIN HbA1c, %) and maximum HbA1c (MAX HbA1c, %) recorded over the 48-month follow-up; pain visual analogue scale questionnaire (VAS, 10-points score) for each limb; Manchester Oxford Foot Questionnaire (MoX, 16 items, max score 64) [16];
  • Overall gait performance: dynamic arch index (AI, relative unit), cadence (cad, steps/min), foot contact time (CT, ms), velocity (vel, m/s);
  • Plantar peak pressure distribution: peak pressure during gait (PP, kPa) at the hindfoot, midfoot, forefoot, big toe, and toes; dominant (D) and not-dominant (ND) limbs were analyzed separately; and
  • Plantar pressure-time integral distribution: pressure-time integral during gait (PTI, kPa·s) at the hindfoot, midfoot, forefoot, big toe, and toes; dominant (D) and not-dominant (ND) limbs were analyzed separately.
The whole group of patients (ALL), the six clinical subgroups, and the patients with lesions’ (PWL) group were examined. One-way ANOVA was implemented to highlight differences among these groups (p < 0.05, adjusted for Tukey post-hoc comparisons). The coefficient of variation (CV) was calculated for each variable and group, and averaged (mCV) within each group of variables. The profile of each patient with lesions was finally compared with those of the corresponding group.
Confidence intervals (95% CIs) were calculated for each weight-bearing CT-related variable for the two subgroups of type 1 patients (with (DNT1) and without (DNNT1) neuropathy. Those intervals allowed the exploration of changes in the small subset of patients with lesions who also underwent the WBCT examination. The R Foundation environment was used for the statistical analysis.

3. Results

Twelve patients (8M/4F; age 58.2 ± 10.3; BMI 27.9 ± 6.3; YOD 24.4 ± 13.8; NS-VPT: 3.8 ± 1.7; mean HbA1c: 8.3 ± 1.6; MIN HbA1c: 7.7 ± 1.5; MAX HbA1c 9.1 ± 1.7) developed a total of 22 plantar lesions during the follow-up (Table 2).
High variability and, consequently, no statistically significant differences were found between the entire group of patients and the group of patients with lesions (Figure 1).
Statistically significant differences were found among the six groups of patients namely type 1 with (DNT1) and without (DNNT1) neuropathy, non-obese type 2 with (DNT2-no ob) and without (DNNT2-no ob) neuropathy, and obese type 2 with (DNT2-ob) and without (DNNT2-ob) neuropathy; these differences were found for one or more groups of variables as summarized in Table 3. The profiles and patterns of investigated variables for each group of patients are plotted in Figure 2, Figure 3, Figure 4, Figure 5 and Figure 6 as follows: Figure 2 shows the profiles of the passive joint mobility and the alignment parameters, Figure 3 shows the profiles of the biological and clinical parameters, Figure 4 illustrates the overall gait performance parameters, and Figure 5 and Figure 6 report the patterns of the regional plantar Peak Pressure (PP, kPa) and Pressure-Time Integral (PTI, kPa·s) parameters, respectively. Variability within each group remained high for some variables and groups, as is for the overall gait performance in neuropathic groups (Figure 4), and for pressure-related regional parameters in the DNT2 groups (Figure 5 and Figure 6). Conversely, variability significantly decreased for passive mobility and alignment in DNT1 and non-obese DNNT2 (Figure 2), biological and clinical parameters in all groups (Figure 3), and pressure-related regional parameters in DNT1 and all non-neuropathic groups (Figure 5 and Figure 6).
Figure 2, Figure 3, Figure 4, Figure 5 and Figure 6 show data for single patients with lesions—and not as a group—with each one superimposed to the corresponding average group data. Despite the high heterogeneity of the variable values, it is worth noticing that, when compared with their group the following was observed: (a) all patients with lesions showed at least one altered profile or pattern (Figure 2, Figure 3, Figure 4, Figure 5 and Figure 6); (b) type 1 patients with lesions, either with or without neuropathy, showed higher HbA1c levels during the follow-up period (Figure 3); (c) contact time was longer in several patients with lesions (Figure 4); and (d) in some cases, pressure-related regional parameters were out of the expected range either in correspondence with lesions or in different ROIs (Figure 5 and Figure 6).
Three type 1 patients with lesions also underwent the weight-bearing CT examination, 2 with (DNT1) and 1 without (DNNT1) neuropathy. This measure of foot architecture showed high variability within the two subsets of examined patients (7 DNT1 and 8 DNNT1) [11]. However, a high percentage of variables were found out of the 95% confidence intervals in each anatomical plane and in 3D (Figure 7). In particular, one patient with lesions in DNT1 had 60% of variables in the transverse plane over the confidence interval, and the patient with lesion in DNNT1 had ≈50% of variables in 3D below the confidence interval.

4. Discussion

Diabetic foot syndrome has long been investigated, since it represents a major complication of diabetes mellitus [21,22]. The disease is associated with very high clinical and economic burden [23], a strong negative impact on quality of life [24], and high rates of hospitalization in type 2 diabetes [25]. The International Working Group on Diabetic Foot (IWGDF) defined this syndrome as “infection, ulceration, or destruction of tissues of the foot of a person with currently or previously diagnosed diabetes mellitus, usually accompanied by neuropathy and/or peripheral arterial disease in the lower extremity” [26]. Besides neuropathy [25,27] and different manifestations of vascular diseases [28,29], many complex alterations occur at the clinical, biological, or behavioral level, which contribute to the development of these foot complications [30,31,32]. Up to 79 risk factors have been retrieved and reported by Rossboth et al. [27].
Despite the huge progresses in clinical and biomechanical research and relevant technology [21,33,34,35,36,37], deeper knowledge, more evidence and general validity, and a larger consensus are needed to effectively model as many risk factors as possible, and to predict the many alterations observed in patients, both in the foot structure and function [4,5,6,7,8,9,10,12].
The present study focused on a small part of this complex process of correlation and modeling. Namely, the core of the study was the hypothesis that an appropriate stratification of patients with diabetes prior to implementing a predictive model might help reduce the variability of the most relevant parameters and improve intra-group correlations. In particular, it was hypothesized that subgroups defined according to type of diabetes, presence or absence of neuropathy, and presence or absence of obesity may support a better identification of relevant clinical, biological, structural, functional, and biomechanical profiles and patterns.
The study was observational, with a thorough clinical, functional, and biomechanical assessment conducted in 2016. However, a 48-month follow-up made it possible to address two additional relevant questions, namely whether baseline profiles and patterns could at least partially explain the onset of plantar lesions, whether two important clinical aspects—peripheral neuropathy level at baseline and the trend of glycated hemoglobin during follow-up—might have a concurrent role in the ulceration process.
The study showed that patients with diabetes should be stratified for both presence of neuropathy and diabetes type. Six groups of patients were analyzed, and their profiles and patterns were remarkably different (Table 3, Figure 2, Figure 3, Figure 4, Figure 5 and Figure 6). Differences occurred not only with respect to a number of largely expected variables, for example age and gait performance between T1 and T2, but also with respect to clinical variables among the neuropathic groups, or biomechanical variables in corresponding (i.e., non-obese) groups. It is worth mentioning that type 2 subgroups showed peculiarities related to the presence of neuropathy and/or obesity, but they still showed high intra-group variability of the parameters, greater than in type 1 groups. The only exception was for the non-obese and non-neuropathic type 2 patients. This group, however, consisted of seven patients only, thus requiring confirmation in wider studies. While these specific profiles allow for modeling of foot alterations within each group, the high variability definitely calls for more studies and a more inclusive set of variables.
Some interesting results were observed for the profiles and patterns of patients who developed lesions (PWL) during follow-up. They were quite homogeneously distributed among the groups, showing that ulceration not only occurs in neuropathic patients. The highest percentage (20%) of PWL was found in DNNT1, while the highest rate of lesions (45%) was found in both DNT2 patients, obese and non-obese. The highest rate of lesions (45%) occurred at the toes and at the dominant limb (15 dominant vs. 7 non-dominant). PWL had very heterogeneous variations in all groups of variables. However, all of them had an altered profile or pattern in at least one group of variables, including the passive mobility and alignment group. In addition, HbA1c was generally out of one standard deviation in DNT1. According to the literature, glycemic control might play a relevant role in the prevention of diabetic foot syndrome [38,39]; thus, the present findings seem worthy of deeper investigation. Finally, plantar pressure-related parameters (PP and PTI) were often altered in PWL, not only at the site of lesion, and differently changed in the dominant and non-dominant limb. All this suggests that not only plantar pressure-related variables deserve special attention in prevention programs, but also that a thorough plantar regional analysis should be conducted, and that feet have to be investigated separately, grouped as dominant and non-dominant.
An exploratory additional contribution of this study came from the examination of the 3D weight-bearing foot architecture, which provides measures of alignment obtained by means of an innovative exploitation of the weight-bearing CT technique [11]. Three patients with lesions (2 DNT1, 1 DNNT1) could in fact be retrieved among the subset of DNT1 (7 patients) and DNNT1 (8 patients) who underwent analysis of the orientation and height of the main foot segments in each anatomical plane and in 3D (84 variables in total). The three patients showed different profiles and alterations; however, it is worth noting that all of them showed a high percentage of variables out of the corresponding 95% confidence interval—up to 60% of the frontal plane variables for one neuropathic patient (Figure 7) and 47% of the 3D variables for the non-neuropathic patient. While these findings cannot be generalized, they suggest the need for further investigation and the inclusion of 3D architecture variables in the diabetic foot predictive models.
This study has several limitations, the most important of which are hereby briefly commented on. The findings are not exhaustive and potentially not directly applicable to all patients with diabetes who may develop/may have developed diabetic foot syndrome. Patients with amputations, Charcot neuroarthropathy, severe nephropathy, retinopathy, or vasculopathy were excluded a priori from the study due to the study timeline and resources. Patients with type 1 and obesity, either with neuropathy or without, were not retrieved among the Clinic Foot Center eligible patients. The contribution of gender could not be investigated, and groups were quite heterogeneous with respect to the ratio between women and men. In particular, the type 1 neuropathic group was mostly formed by men while the type 1 non-neuropathic group by women. The sample size within each subgroup may be too small to properly account for the intra-group variability of some parameters. Special attention was paid to managing them as homogeneously as possible with respect to foot care and prevention, also including therapeutic programs as indicated by the IWGDF guidelines. However, it is reasonable to hypothesize that a relevant role in the onset of plantar lesions was played by other uncontrolled factors, including patient adherence to treatment, previous lesions or diseases, co-morbidities, and lifestyle.
Nevertheless, to our knowledge, the present work is the first to combine such a large number of heterogeneous variables, also from a very large spectrum of instruments and techniques.

5. Conclusions

Type of diabetes, peripheral neuropathy, and obesity contribute differently to the development of diabetic foot syndrome. Thus, predictive modeling should consider proper stratification of patients before modeling alterations in foot structure and function. Within each of the identified groups, several profiles or patterns of variables—passive joint mobility and alignment, biology and clinics, gait performance, regional peak pressure, and pressure-time integral profiles—reveal possible roles in the development of plantar lesions, as shown by the subset of 12 patients who developed lesions during the 48-month follow-up period. Residual variability within each group might be further reduced by modeling additional variables, such as those characterizing the weight-bearing foot architecture.

Author Contributions

Conceptualization, C.G., G.L., A.L., P.C., G.M. and L.B. (Lisa Berti); Formal analysis, C.G.; Investigation, C.G., G.L., P.C., M.O., L.B. (Luca Baccolini) and L.B. (Lisa Berti); Methodology, C.G., G.L., A.L., P.C. and L.B. (Lisa Berti); Project administration, C.G., A.L. and L.B. (Lisa Berti); Resources, C.G., A.L., G.M. and L.B. (Lisa Berti); Software, C.G. and M.O.; Supervision, C.G., A.L. and L.B. (Lisa Berti); Validation, C.G. and M.O.; Writing—original draft, C.G., A.L. and L.B. (Lisa Berti); Writing—review and editing, C.G., G.L., A.L., P.C., M.O., G.M., L.B. (Luca Baccolini) and L.B. (Lisa Berti). All authors have read and agreed to the published version of the manuscript.

Funding

This research was funded by the Italian Ministry of Health 5 × 1000 grant program.

Institutional Review Board Statement

Approval was obtained by the metropolitan ethical committee for experimental protocol 1 and by the local Ethical Committee (Prot. IOR 7685 28 July 2017) for experimental protocol 2, and relevant informed consents were signed by participants in the study. The study was conducted according to the guidelines of the Declaration of Helsinki.

Informed Consent Statement

Informed consent was obtained from all individuals involved in the study.

Data Availability Statement

Data are owned by the IRCCS Istituto Ortopedico Rizzoli, the Italian National Institute of Health, and the IRCCS-Azienda Ospedaliera di Bologna Policlinico Sant’Orsola-Malpighi. Request to use, share or disseminate such data must be sent to alberto.leardini@ior.it.

Acknowledgments

Authors are grateful to all patients and assistants who volunteered in the study.

Conflicts of Interest

The authors declare no conflict of interest.

References

  1. Bus, S.A.; Lavery, L.A.; Monteiro-Soares, M.; Rasmussen, A.; Raspovic, A.; Sacco, I.C.N.; van Netten, J.J.; International Working Group on the Diabetic Foot. IWGDF Guideline on the Prevention of Foot Ulcers in Persons with Diabetes. 2019. Available online: www.iwgdfguidelines.org (accessed on 29 November 2021).
  2. Armstrong, D.G.; Boulton, A.J.; Bus, S.A. Diabetic foot ulcers and their recurrence. N. Engl. J. Med. 2017, 376, 2367–2375. [Google Scholar] [CrossRef]
  3. Fernando, M.E.; Crowther, R.G.; Lazzarini, P.A.; Sangla, K.S.; Wearing, S.; Buttner, P.; Golledge, J. Plantar pressures are higher in cases with diabetic foot ulcers compared to controls despite a longer stance phase duration. BMC Endocr. Disord. 2016, 16, 51. [Google Scholar] [CrossRef] [PubMed] [Green Version]
  4. Giacomozzi, C.; Martelli, F. Peak pressure curve: An effective parameter for early detection of foot functional impairments in diabetic patients. Gait Posture 2006, 23, 464–470. [Google Scholar] [CrossRef] [PubMed]
  5. Hazari, A.; Maiya, A.; Agouris, I.; Monteiro, A. Shivashankar Prediction of peak plantar pressure for diabetic foot: The regressional model. Foot 2019, 40, 87–91. [Google Scholar] [CrossRef]
  6. Barn, R.; Waaijman, R.; Nollet, F.; Woodburn, J.; Bus, S.A. Predictors of barefoot plantar pressure during walking in patients with diabetes, peripheral neuropathy and a history of ulceration. PLoS ONE 2015, 10, e0117443. [Google Scholar] [CrossRef] [PubMed]
  7. Fawzy, O.A.; Arafa, A.I.; Wakeel, M.A.; Kareem, S.H. Plantar pressure as a risk assessment tool for diabetic foot ulceration in Egyptian patients with diabetes. Clin. Med. Insights Endocrinol. Diabetes 2014, 7, CMED.S17088. [Google Scholar] [CrossRef] [Green Version]
  8. Al-Rubeaan, K.; Al Derwish, M.; Ouizi, S.; Youssef, A.M.; Subhani, S.N.; Ibrahim, H.M.; Alamri, B.N. Diabetic foot complications and their risk factors from a large retrospective cohort study. PLoS ONE 2015, 10, e0124446. [Google Scholar] [CrossRef]
  9. Wouter, B.; Abu-Hanna, A.; Bus, S.A. Development of a multivariable prediction model for plantar foot ulcer recurrence in high- risk people with diabetes. BMJ Open Diabetes Res. Care 2020, 8, e001207. [Google Scholar]
  10. Guldemond, N.A.; Leffers, P.; Walenkamp, G.H.; Schaper, N.; Sanders, A.P.; Nieman, F.H.; Van Rhijn, L.W. Prediction of peak pressure from clinical and radiological measurements in patients with diabetes. BMC Endocr. Disord. 2008, 8, 16. [Google Scholar] [CrossRef] [PubMed] [Green Version]
  11. Belvedere, C.; Giacomozzi, C.; Carrara, C.; Lullini, G.; Caravaggi, P.; Berti, L.; Marchesini, G.; Baccolini, L.; Durante, S.; Leardini, A. Correlations between weight-bearing 3D bone architecture and dynamic plantar pressure measurements in the diabetic foot. J. Foot Ankle Res. 2020, 13, 64. [Google Scholar] [CrossRef]
  12. Giacomozzi, C.; Sartor, C.D.; Telles, R.; Uccioli, L.; Sacco, I.C.N. Ulcer-risk classification and plantar pressure distribution in patients with diabetic polyneuropathy: Exploring the factors that can lead to foot ulceration. Ann. Ist. Super Sanita 2018, 54, 284–293. [Google Scholar]
  13. World Health Organization. Obesity: Preventing and Managing the Global Epidemic; Report of a WHO Consultation; WHO Technical Report Series 894; WHO: Geneva, Switzerland, 2000. [Google Scholar]
  14. Feldman, E.L.; Stevens, M.; Thomas, P.; Brown, M.; Canal, N.; Greene, D. A practical two-step quantitative clinical and electrophysiological assessment for the diagnosis and staging of diabetic neuropathy. Diabetes Care 1994, 17, 1281–1289. [Google Scholar] [CrossRef] [PubMed]
  15. Hazel, M. Clarkson Musculoskeletal Assessment: Joint Motion and Muscle Testing; Lippincott Williams & Wilkins: Philadelphia, PA, USA, 2012. [Google Scholar]
  16. Marinozzi, A.; Martinelli, N.; Panascì, M.; Cancilleri, F.; Franceschetti, E.; Vincenzi, B.; Di Martino, A.; Denaro, V. Italian translation of the Manchester-Oxford Foot Questionnaire, with re-assessment of reliability and validity. Qual. Life Res. 2009, 18, 923–927. [Google Scholar] [CrossRef] [PubMed]
  17. Giacomozzi, C.; Leardini, A.; Caravaggi, P. Correlates between kinematics and baropodometric measurements for an integrated in-vivo assessment of the segmental foot function in gait. J. Biomech. 2014, 47, 2654–2659. [Google Scholar] [CrossRef]
  18. Giacomozzi, C.; Macellari, V.; Leardini, A.; Benedetti, M.G. Integrated pressure-force-kinematics measuring system for the characterisation of plantar foot loading during locomotion. Med. Biol. Eng. Comput. 2000, 38, 156–163. [Google Scholar] [CrossRef]
  19. Giacomozzi, C.; Stebbins, J.A. Anatomical masking of pressure footprints based on the Oxford Foot Model: Validation and clinical relevance. Gait Posture 2017, 53, 131–138. [Google Scholar] [CrossRef] [PubMed]
  20. Leardini, A.; Benedetti, M.G.; Berti, L.; Bettinelli, D.; Nativo, R.; Giannini, S. Rear-foot, mid-foot and fore-foot motion during the stance phase of gait. Gait Posture 2007, 25, 453–462. [Google Scholar] [CrossRef]
  21. Lavery, L.A.; Oz, O.K.; Bhavan, K.; Wukich, D.K. Diabetic Foot Syndrome in the Twenty-First Century. Clin. Podiatr. Med. Surg. 2019, 36, 355–359. [Google Scholar] [CrossRef]
  22. Lukin, P.; Kuchumov, A.G.; Zarivchatskiy, M.F.; Kravtsova, T. Clinical Classification of the Diabetic Foot Syndrome Adapted to ICD-10 as a Solution to the Problem of Diagnostics, Statistics and Standardisation. Medicina 2021, 57, 817. [Google Scholar] [CrossRef]
  23. Edmonds, M.; Manu, C.; Vas, P. The current burden of diabetic foot disease. J. Clin. Orthop. Trauma 2021, 17, 88–93. [Google Scholar] [CrossRef]
  24. Krzemińska, S.; Kostka, A. Influence of Pain on the Quality of Life and Disease Acceptance in Patients with Complicated Diabetic Foot Syndrome. Diabetes Metab. Syndr. Obes. 2021, 14, 1295–1303. [Google Scholar] [CrossRef]
  25. Volmer-Thole, M.; Lobmann, R. Neuropathy and Diabetic Foot Syndrome. Int. J. Mol. Sci. 2016, 17, 917. [Google Scholar] [CrossRef] [Green Version]
  26. Van Netten, J.J.; Bus, S.A.; Apelqvist, J.; Lipsky, B.A.; Hinchliffe, R.J.; Game, F.; Rayman, G.; Lazzarini, P.A.; Forsythe, R.O.; Peters, E.J.G.; et al. Definitions and criteria for diabetic foot disease. Diabetes Metab. Res. Rev. 2019, 36, e3268. [Google Scholar] [CrossRef] [Green Version]
  27. Rossboth, S.; Lechleitner, M.; Oberaigner, W. Risk factors for diabetic foot complications in type 2 diabetes-A systematic review. Endocrinol. Diabetes Metab. 2020, 17, e00175. [Google Scholar] [CrossRef] [PubMed]
  28. Azhar, A.; Basheer, M.; Abdelgawad, M.S.; Roshdi, H.; Kamel, M.F. Prevalence of Peripheral Arterial Disease in Diabetic Foot Ulcer Patients and its Impact in Limb Salvage. Int. J. Low. Extrem. Wounds 2021, 15347346211027063. [Google Scholar] [CrossRef] [PubMed]
  29. Edmonds, M. Vascular disease in the lower limb in type 1 diabetes. Cardiovasc. Endocrinol. Metab. 2019, 8, 39–46. [Google Scholar] [CrossRef]
  30. Wolf, G.; Müller, N.; Busch, M.; Eidner, G.; Kloos, C.; Hunger-Battefeld, W.; Müller, U.A. Diabetic foot syndrome and renal function in type 1 and 2 diabetes mellitus show close association. Nephrol. Dial. Transplant. 2009, 24, 1896–1901. [Google Scholar] [CrossRef]
  31. Kulwas, A.; Lisewska, B.; Jundziłł, W.; Ruszkowska, B.; Drewniak, W.; Ruprecht, Z.; Gadomska, G.; Rość, D. Tissue plasminogen activator (t-PA) and plasminogen activator inhibitor type 1 (PAI-1) in diabetic foot syndrome. Adv. Med. Sci. 2017, 62, 87–91. [Google Scholar] [CrossRef] [PubMed]
  32. Humpert, P.M.; Battista, M.J.; Lammert, A.; Reismann, P.; Djuric, Z.; Rudofsky, G., Jr.; Zorn, M.; Morcos, M.; Hammes, H.P.; Nawroth, P.P.; et al. Association of stromal cell-derived factor 1 genotype with diabetic foot syndrome and macrovascular disease in patients with type 2 diabetes. Clin. Chem. 2006, 52, 1206–1208. [Google Scholar] [CrossRef]
  33. Najafi, B.; Mishra, R. Harnessing Digital Health Technologies to Remotely Manage Diabetic Foot Syndrome: A Narrative Review. Medicina 2021, 57, 377. [Google Scholar] [CrossRef]
  34. Asghar, A.; Naaz, S. The transverse arch in the human feet: A narrative review of its evolution, anatomy, biomechanics and clinical implications. Morphologie 2021, S1286-0115(21)00191-0. [Google Scholar] [CrossRef] [PubMed]
  35. Reeves, N.D.; Orlando, G.; Brown, S.J. Sensory-Motor Mechanisms Increasing Falls Risk in Diabetic Peripheral Neuropathy. Medicina 2021, 57, 457. [Google Scholar] [CrossRef] [PubMed]
  36. Primadhi, R.A.; Herman, H. Diabetic foot: Which one comes first, the ulcer or the contracture? World J. Orthop. 2021, 12, 61–68. [Google Scholar] [CrossRef] [PubMed]
  37. Hulshof, C.M.; van Netten, J.J.; Pijnappels, M.; Bus, S.A. The Role of Foot-Loading Factors and Their Associations with Ulcer Development and Ulcer Healing in People with Diabetes: A Systematic Review. J. Clin. Med. 2020, 9, 3591. [Google Scholar] [CrossRef] [PubMed]
  38. Hasan, R.; Firwana, B.; Elraiyah, T.; Domecq, J.P.; Prutsky, G.; Nabhan, M.; Prokop, L.J.; Henke, P.; Tsapas, A.; Montori, V.M.; et al. A systematic review and meta-analysis of glycemic control for the prevention of diabetic foot syndrome. J. Vasc. Surg. 2016, 63 (Suppl. 2), 22S–28S.e2. [Google Scholar] [CrossRef] [Green Version]
  39. Song, K.; Chambers, A.R. Diabetic Foot Care. In StatPearls; StatPearls Publishing: Treasure Island, FL, USA, 2020. Available online: https://www.ncbi.nlm.nih.gov/books/NBK553110/ (accessed on 29 November 2021).
Figure 1. Profiles and patterns of the investigated parameters within each group of variables. Mean values ± SD are plotted for the entire group of patients (ALL) and for the subgroup of patients with lesions (PWL), for the dominant (D) and the non-dominant (ND) limb. Few parameters in the ‘biology and clinics’ and in the ‘overall gait performance’ group have been scaled according to the reported factor for better readability of the plot. The mean coefficient of variation (mCV) is reported for each group and plot.
Applsci 11 11464 g001
Figure 2. Profiles of the passive joint mobility and alignment parameters (°) within each group of patients. Mean values ± SD are plotted for each group, with the profiles of patients with lesions added to the plot of the group each of them belongs to.
Applsci 11 11464 g002
Figure 3. Profiles of the biological and clinical parameters within each group of patients. Measurement units for each variable are reported on the horizontal axis close to each parameter label (arch index (AI) is reported in relative unit). For Manchester Oxford Foot Questionnaire (MOX), AGE, BMI, and years of disease (YOD), a scale factor was necessary in order to enhance the readability of the plot. Mean values ± SD are plotted for each group, with the profiles of patients with lesions added to the plot of the group each of them belongs to.
Applsci 11 11464 g003
Figure 4. Overall gait performance parameters within each group of patients. Measurement units for each variable are reported on the horizontal axis close to each parameter label. For cadence (cad, measured in step per minute (spm)), a scale factor was necessary in order to enhance the readability of the plot. Mean values ± SD are plotted for each group, with the profiles of patients with lesions added to the plot of the group each of them belongs to.
Applsci 11 11464 g004
Figure 5. Patterns of the regional plantar Peak Pressure (PP, kPa) parameters within each group of patients. Mean values ± SD are plotted for each group, with the patterns of patients with lesions (PWL) added to the plot of the group each of them belongs to. For each PWL pattern, a full circle has been added in correspondence with the site of lesion. An empty circle has also been reported in case of lesions that occurred before the clinical and functional assessment.
Applsci 11 11464 g005
Figure 6. Patterns of the regional Pressure-Time Integral (PTI, kPa·s) parameters within each group of patients. Mean values ± SD are plotted for each group, with the patterns of patients with lesions (PWL) added to the plot of the group each of them belongs to. For each PWL pattern, a full circle has been added in correspondence with the site of lesion. An empty circle has also been reported in case of lesions that occurred before the clinical and functional assessment.
Applsci 11 11464 g006
Figure 7. Weight-bearing CT parameters in three patients with lesions: % of parameters outside the 95% confidence interval of each parameter, for the DNT1 (7 patients) and the DNNT1 (8 patients) subgroups. For each parameter and patient with lesion, the number of values above and below the interval have been counted separately. The count is reported for each anatomical plane and for the 3D parameters.
Applsci 11 11464 g007
Table 1. Clinical and biological description of patients.
ALLDNT1DNT2-No obDNT2-obDNNT1DNNT2-No obDNNT2-ob
n (M/F)79 (39M/40F)12 (9M/3F)11 (6M/5F)20 (11M/9F)15 (1M/14F)7 (3M/4F)13 (8M/5F)
AGE (years)58.1 ± 12.053.1 ± 14.167.1 ± 8.861.6 ± 6.848.3 ± 14.665.4 ± 3.958.3 ± 8.2
BMI (kg/m2)29.4 ± 6.824.8 ± 2.525.1 ± 3.135.7 ± 5.423.6 ± 3.225.6 ± 3.336.3 ± 3.8
YOD (years)20.0 ± 12.834.2 ± 12.618.4 ± 8.613.9 ± 7.823.6 ± 3.212.4 ± 9.012.1 ± 6.7
NS-VPT3.2 ± 1.43.8 ± 0.94.3 ± 1.04.2 ± 1.21.7 ± 0.72.5 ± 1.32.3 ± 0.9
Mean HbA1c (%) *7.9 ± 1.38.4 ± 1.67.0 ± 0.88.0 ± 1.48.3 ± 1.07.1 ± 0.38.2 ± 1.5
MIN HbA1c (%) *7.1 ± 1.27.7 ± 1.36.4 ± 0.57.1 ± 1.67.8 ± 1.16.2 ± 0.36.9 ± 1.1
MAX HbA1c (%) *8.9 ± 1.79.4 ± 1.88.0 ± 1.79.0 ± 1.68.8 ± 1.08.2 ± 1.09.8 ± 2.3
patients with lesions *12 (8M/4F)
%: 15 (21/10)
2 (2M)
%: 17 (22)
2 (2M)
%: 18 (33)
3 (3M)
%: 15 (27)
3 (3F)
%: 20 (21)
-2 (1M/1F)
%: 15 (20)
number of lesions *22 (1 midfoot; 5 forefoot; 6 big toe; 10 toes)
r: 0.28
3 (1 forefoot; 2 10 toes)
r: 0.25
5 (2 big toe; 3 toes)
r: 0.45
9 (3 forefoot; 3 big toe; 3 toes)
r: 0.45
3 (1 forefoot; 1 big toe; 1 toes)
r: 0.20
2 (1 midfoot; 1 toes)
r: 0.15
Legend: * in the 48-month follow-up; %—percentage with respect to the corresponding cases; r—ratio of the number of lesions divided by the number of cases in the group.
Table 2. Description of lesions that occurred 1–48 months (m) after the assessment.
GroupCasesPatients with LesionsDescription of Lesions
DNT112 (9M/3F)2 (2M/0F) Applsci 11 11464 i001 L1 (M): D (toes, m24) and ND (forefoot, m36)
Applsci 11 11464 i002 L2 (M): D (toes, m36)
DNT2 no ob11 (6M/5F)2 (2M/0F) Applsci 11 11464 i003 L1 (M): D (big toe, m48; toes, m48)
Applsci 11 11464 i004 L2 (M): D (big toe, m36; toes, m9 and m36)
DNT2 ob20 (11M/9F)3 (3M/0F) Applsci 11 11464 i005 L1 (M): D (toes, m9 and m48)
Applsci 11 11464 i006 L2 (M): ND (forefoot, m9 and m24 and m48)
Applsci 11 11464 i007 L3 (M): D (big toe, m6 and m24 and m48) and ND (toes, m24)
DNNT115 (1M/14F)3 (0M/3F) Applsci 11 11464 i008 L1 (F): D (toes, m24)
Applsci 11 11464 i009 L2 (F): D (big toe, m36)
Applsci 11 11464 i010 L3 (F): ND (forefoot, m36)
DNNT2 no ob7 (3M/4F)-
DNNT2 ob13 (8M/5F)2 (1M/1F) Applsci 11 11464 i011 L1 (M): ND (toes, m48)
Applsci 11 11464 i012 L2 (F): D (midfoot, m24)
Total 12 (8M/4F)22 (1 midfoot; 5 forefoot; 6 big toe; 10 toes)
Legend: D: dominant limb; ND: non-dominant limb; DN: diabetes and neuropathy; DNN: diabetes without neuropathy; T1: type 1 diabetes; T2: type 2 diabetes; ob: obese; no ob: non-obese. Colors are associated with the profiles and patterns in Figure 2, Figure 3, Figure 4, Figure 5 and Figure 6.
Table 3. Statistically significant differences between groups of patients (one-way ANOVA, p < 0.05 adjusted for Tukey multiple comparisons).
DNT1DNT2-no obDNT2-obDNNT1DNNT2-no obDNNT2-ob
DNT1 AGE;
YOD
TT dors ND;
hindfoot incl ND;
BMI;
YOD;
CT ND;
vel ND;
PTI midfoot D and ND
NS-VPTYODYOD;
NS-VPT;
PTI midfoot D and ND
DNT2-no ob BMI;
PTI hindfoot D;
PTI midfoot D
AGE;
NS-VPT;
PTI forefoot D
NS-VPT;
PTI forefoot D
NS-VPT;
PTI forefoot D
DNT2-ob MOX D and ND;
AGE;
YOD;
NS-VPT;
cad D and ND;
CT D and ND;
vel D and ND;
PP midfoot D;
PP forefoot D;
PTI hindfoot D and ND;
PTI midfoot D and ND;
PTI forefoot D and ND
NS-VPT;
PTI midfoot D
NS-VPT
DNNT1 AGE;
YOD;
MIN HbA1c
BMI;
YOD;
vel D;
PTI midfoot D and ND
DNNT2-no ob BMI;
PTI midfoot D and ND
DNNT2-ob
Legend: D: dominant limb; ND: non-dominant limb; DN: diabetes and neuropathy; DNN: diabetes without neuropathy; T1: type 1 diabetes; T2: type 2 diabetes; ob: obese; no ob: non-obese.
Publisher’s Note: MDPI stays neutral with regard to jurisdictional claims in published maps and institutional affiliations.

