Article

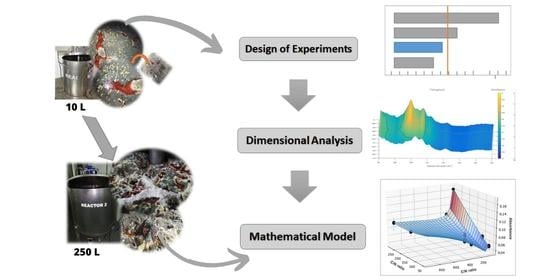
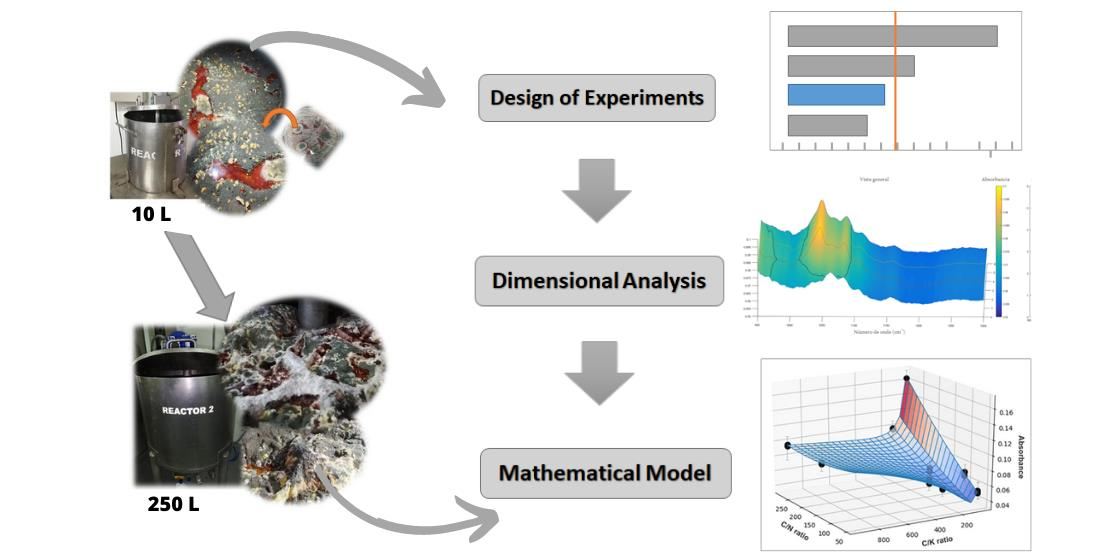
Mathematical Model for Scaling up Bioprocesses Using Experiment Design Combined with Buckingham Pi Theorem

by
Leidy Rendón-Castrillón
1,
Margarita Ramírez-Carmona
1,
Carlos Ocampo-López
1,* and
Luis Gómez-Arroyave
2
1
Centro de Estudios y de Investigación en Biotecnología (CIBIOT), Facultad de Ingeniería Química, Universidad Pontificia Bolivariana, Circular 1ª No. 70-01, Medellín 050031, Colombia
2
Bioexplora S.A.S., Medellín 050031, Colombia
*
Author to whom correspondence should be addressed.
Appl. Sci. 2021, 11(23), 11338; https://doi.org/10.3390/app112311338
Submission received: 19 October 2021 / Revised: 20 November 2021 / Accepted: 22 November 2021 / Published: 30 November 2021
(This article belongs to the Topic Bioreactors: Control, Optimization and Applications)

Abstract

:

Featured Application

Bioprocess scaling up models from experimental research, with special focus on fungal fermentation and bioleaching processes.

Abstract

Scaling up bioprocesses from the experimental to the pilot or industrial scale involves heuristics and scale relationships that are far from the specific phenomena and are usually not connected to the experimental data. In complex systems, the scaling-up methodology must connect the experimental data with the tools of engineering design. In this work, a two-stage gold bioleaching process was used as a case study to develop a mathematical model of bioprocess scaling that combines the design of experiments with dimensional analysis using the Buckingham Pi theorem to formulate a predictive model that allows scaling up bioprocesses. It was found that the C/N, C/K, and T/C ratios are dimensionless factors that can explain the behavior of a system. Using the Pearson Product–Moment bivariate analysis, it was found that the dimensionless factors C/N and C/K were correlated with the leaching potential of the fermented broth at 1060 cm−1. With these results, a non-linear logarithmic model based on dimensionless parameters was proposed to explain the behavior of the system with a correlation coefficient of R2 = 0.9889, showing that the optimal conditions to produce fermented broth comprised a C/N ratio close to 50 and a C/K ratio close to 800, which allows predicting the scaling of the bioprocess.

Graphical Abstract

1. Introduction

The global bioprocess market surpassed USD 180 million in 2019 and is forecast to be valued at USD 360 million by 2024, with an annual growth of 14.6% [1]. The number of industrial bioprocesses is growing due to the increased market demand for the bulk production of products developed through fermentation to produce various relevant compounds that have applications in the chemical industry, biofuels, materials, nutritional ingredients, health products, food, and pharmaceutical products [2]. This demand has led to a shift from a fossil-based economy to a bioeconomic model [3].
Growing markets come with a progressive need for industrial-scale bioprocesses, along with a demand for large and efficient bioreactors [3]. The companies in the industrial bioprocessing market actively participate in R&D to develop high-quality products through biotechnology, hoping that market competitiveness will be boosted [4].
One of the bioprocesses of interest is bioleaching. The global market was valued at USD 15 million in 2020 and is projected to reach USD 23 million in 2027 with an annual increase of 4.9% [5].
Bioleaching is a form of extraction of metals through biogenically produced metabolites, representing a green technology for the recovery of metals. The predictions in bioleaching are difficult due to several factors and interactions that affect the process. The bioleaching behavior varies depending on the operational conditions, such as the origin of the microorganism, the composition of the minerals, and the temperature [6].
Bioprocesses are difficult to standardize and often lack the required efficacy when scaled up [7]. Further, the efforts made to verify the viability of these bioprocesses are limited by the scale of the process, the sterilization of the substrates, or the use of pure reagents as precursors, which in turn restrict their use in large-scale applications [8].
During the development and scale-up of the bioprocess, a commercial reduction between 10% and 30% occurs in performance, mainly associated with mass and heat transfer issues, in addition to mixing difficulties in industrial-scale bioreactors, in which a subpopulation of microorganisms occurs with reduced efficiency and production capacity, a phenomenon often called “population heterogeneity”. This makes bioprocess scaling a critical step in the development of processes due to performance losses [3] and the involvement of microorganisms that are dynamic in nature with diverse internal control mechanisms. Most media optimization studies treat them as a black box or are used only for empirical data [2].
Scaling-up fermentation processes remains a difficult problem for the biotech industry due to the complex interactions between operating conditions such as agitation and aeration, the physicochemical state of the broth such as viscosity and dissolved oxygen concentration, and the biology of microorganisms such as growth, production, and morphology [9,10]. Other contributing factors are the non-linear nature of the interactions of the biochemical network and, in some cases, incomplete knowledge about the kinetics involved in such systems [2].
In general, for scaling, indirect criteria are used for the effect of dynamic fluid stresses on scaling up such as peak velocity, power consumption, power dissipation/circulation function [9], or design of experiments to study the interactions of more than five variables and large variations in the factors [2].
In fermentation processes, the optimization of the medium involves many experiments regardless of the selected medium, which increases the cost of labor. On rare occasions, the data generated from the shake flask medium exactly match the fermenter studies. All shake flask studies suffer from four main weaknesses: uncontrolled pH, reduced oxygen transfer capabilities, improper mixing, and considerable evaporation during the process. It is wrong to assume that the best medium obtained in the shake flask culture will be the best medium in the bioreactor. Unfortunately, few rigorous studies have been carried out on comparing the yields of culture media at different scales. Also, the industrial-scale medium often suffers from problems such as batch variability, year-round availability, price fluctuations, stability during transport time, problems associated with bulk storage, and time [2].
For the scaling of the bioreactors, modeling and simulation are used, such as the modified Damköhler number that considers the production and removal of relative heat at the time of the maximum rate of heat production [11].
In bioprocesses, studies on modeling, simulation, and optimization are still limited, despite being relevant for the evaluation of the viability and understanding of these systems [12,13]. Recent scaling studies assisted by computational fluid dynamics and powerful stimulus–response metabolic models have been developed [14]. These allow for better prediction and evaluation of processes and faster scaling-up with minimal losses [3].
Computational prediction and evaluation of the performance for a biochemical process towards process optimization require a mathematical model that represents the consumption and production of species. There is a lack of understanding of many of the chemical phenomena that take place, which makes it extremely difficult to explicitly predict the effect of process alterations on the required processing time and product composition [15].
The development of a biological system involves numerous variables and requires a large amount of data collection and calculations. The optimization of a system requires the identification of the relevant factors and their influence on the desired results. However, repeating the experiment is costly, time-consuming, and labor-intensive, with misleading results. Therefore, it is necessary to have a general government equation to understand the magnitude of the effectiveness of each parameter in a biological system, such as Buckingham’s Pi theorem [16].
Buckingham’s Pi theorem allows the performance of a known dimensional analysis that helps to focus on the variables of interest and, at the same time, group them to form a set of dimensionless variables with variables of interest from different fields. This theorem helps to predict the results theoretically using only the dimensionless variables [16].
The model developed following Buckingham’s theory is achieved primarily through a data-driven approach, which links measured data and physical models to shape the non-dimensional parameters necessary for the description and generalization of the problem [17]. Buckingham’s Pi theorem is applied to biological systems in fuel cells [18].
In this work, a mathematical model for the scaling of bioprocesses using the design of experiments combined with Buckingham’s Pi theorem is developed.

2. Materials and Methods

2.1. Bioprocess

The bioprocess for this study was gold bioleaching operated in two stages: in the first stage, submerged fermentation was carried out to produce the acidic fermented broth (bio-leaching substance) from A. niger, where the variables evaluated were controlled; in the second stage, the gold bioleaching process was undergone using the broth fermented from the first stage, to evaluate the response variable, as shown in Figure 1.
For the fermentation stage, the operational conditions were evaluated using a 25−2 fractional factorial design. The independent variables were carbon source (C), nitrogen (N), potassium (K), the addition trace elements (T), and agitation (A), in terms of mechanical or aeration mixing, as shown in Table 1. The response variables in this stage were: pH (Mettler–Toledo pH meter), presence of protein by Biuret methodology [19], and organic acids quantification (citric, oxalic, malic, and acetic acids) by high-performance liquid chromatography in an HPLC (Shimadzu Corporation, USA) equipped with a UV/VIS diode array detector—DAD at 210 nm.
The fermentation experiments were carried out in duplicate in 300 mL Erlenmeyer flasks, inoculated with 10% of a fungal spore solution of A. niger, and aerated with lab scale compressors. The fermentation time was 10 days. Subsequently, samples were filtered to obtain the fermented broth.
After obtaining the fermented broth, the bioleaching process was carried out using a gold mineral from the mine “La Victoria” in Girardota (Antioquia). The particle diameter was 75 µm, and samples were put in contact with each of the fermented broths resulting from the design of experiments using a ratio of 80g of mineral per 170mL of filtered fermented broth, for 6 h, with constant stirring at 150 rpm.
The response variable to determine the action of the fermented broth on the mineral was estimated with the infrared spectroscopy technique (FTIR, Shimadzu), obtaining the value of the absorbance of the infrared spectrum at wavenumbers between 400 to 4000 cm−1.

2.2. Mathematical Model

For the synthesis of a mathematical model that facilitates the scaling of gold extraction using fermented broths, the incidence of each of the dimensionless parameters obtained from the Buckingham Pi theorem on gold bioleaching was initially evaluated using the infrared spectrum at a wavenumber of 1060 cm−1. The dimensionless parameters were calculated with the data previously obtained in the experimental design. A multivariate analysis was performed to estimate Pearson’s Product–Moment correlations using Centurion XVIII Statgraphics.
Finally, the relevant parameters of the multivariate analysis were correlated with data obtained from bioleaching of gold, using the infrared spectrum at a wavelength of 1060 cm−1, using a regression routine of 3D scalar functions in Python, and using, as the objective function, the sum of the squares of the absolute errors.
The dimensional analysis was carried out using Buckingham’s Pi theorem to obtain the dimensionless groups of this study and correlate the composition of the fermented broth in terms of the source of Carbon (C), Nitrogen (N), Potassium (K), and Traces (T); the agitation speed and the airflow rate were independent variables, using the results of the response variable for the bioleaching of gold using the infrared spectrum at wavelength λ 1 .
With dimensional analysis, the target model can be expressed according to Equation (1)
λ 1 = f   ( C ,   N ,   K ,   T ,   A ,   Q ) ,
where:
  • C: Carbon Source Concentration (kg/m3);
  • N: Nitrogen Source Concentration (kg/m3);
  • K: Potassium Source Concentration (kg/m3);
  • T: Trace Source Concentration (kg/m3);
  • A: Agitation speed (rad/s);
  • Q: Air flow for aeration (m/s);
  • λ1: Wavenumber (nm).
These seven parameters (n) were represented with three dimensions (m) to obtain n-m = 7 − 3 = 4 mutually independent dimensionless parameters. The Gaussian elimination method was used to solve or find said dimensionless parameters from the dimensional matrix, following the methodology proposed by Pritchard et al. [16].
The Algorithm 1 used for Gaussian elimination method was as follows:
Algorithm 1. Gaussian Elimination method
1 Start
2 Declare the matrix. Where q is the number of unknown variables
3 Take the coefficients of the linear equation as:
Do for k = 1 to n
Do for j = 1 to n + 1
Read a[k][j]
End for j
End for k
4 Do for k = 1 to q − 1
Do for i = k + 1 to n
Do for j = k + 1 to q + 1
a[i][j] = a[i][j] − a[i][k]/a[k][k] * a[k][j]
End for j
End for i
End for k
5 Compute x[q] = a[q][q + 1]/a[q][q]
6 Do for k = q − 1 to 1
sum = 0
Do for j = k + 1 to q
sum = sum + a[k][j] * x[j]
End for j
x[k] = 1/a[k][k] * (a[k][q + 1] − sum)
End for k
7 Display the result x[k]
8 Stop

3. Results and Discussion

3.1. Bioprocess

In this work, 25−2 fractional factorial design of experiments were applied to evaluate the relevant factors in the fermentation stage. The use of design of experiments as statistical methods for the optimization of culture media in the fermentation process can overcome the limitations of the classical methodology, which evaluates one factor at a time and can be a valuable tool for the optimization of the production of metabolites. Fisher proposed a basic theory of experimental design that shows how changing more than one component in the medium at a time can be more efficient than changing only one factor at a time [2].
Although there are different types of design of experiments, in this study the fractional factorial is applied, and not the full factorial. The first design was composed of five factors, equivalent to eight trials plus the replicates. In contrast, in the second design, 25 trials plus the replicates were evaluated. Statistical analysis for both cases was similar.
The response surface design was preferably not used in this study since more than three variables and qualitative factors were used in the experiments [20]. The factorial experiment design method is an appropriate technique to study the influence of the main bioprocess parameters on the response factors by significantly reducing the number of experiments and, henceforth, saving time, energy, and money [21].
The response variables that were monitored as a control in the fermented broths due to their relevance in the bioleaching processes were pH, the presence/absence of proteins, and organic acids.
Organic acids are released to reduce the environmental pH, which promotes the growth of fungi and inhibits the growth of some bacteria [22]. Similarly, the catalytic properties of the enzyme molecule are determined by its amino acid sequence, presenting a bioleaching effect on minerals [23].
Table 2 presents the design matrix, with the results, the control variables, and the response variables. This table shows the eight trials without the replicas because they were reproducible; therefore their behavior over time was similar in each of the tests and their corresponding replication.
In fermentation, the bio acid in the leach solution is formed in situ in the presence of the metal-laden solid. The nutrients added to the mixture can be any suitable carbon source, such as sucrose or molasses. In the in situ process, the metabolism of nutrients leads to the growth of the organism and the production of the organic bio acid metabolite in parallel with the chemical dissolution of the metal, that is, leaching [24].
Another type of fermentation occurs when the bio acid is generated ex situ in the absence of the metal-loaded solid in a microbial or synthetic way. The bio acid produced in this ex situ process is then contacted with the solid [24]. The nature and amount of organic acids excreted by fungi are influenced by the pH of the medium.
Maintaining a low pH is essential for maximum citric acid production. The initial pH required depends on the carbon source used. Generally, a pH below 2.0 is required for optimal production. A low initial pH has the advantage of controlling contamination and inhibiting the formation of oxalic acid [25]. At a pH of four or higher, the formation of oxalic acid accelerates due to the high buffering capacity of the medium [26]. A pH of 2.2 was optimal for fungus growth, as well as citric acid production, while a higher pH, around 5.4 to 6.5, is optimal for the production of citric acid in molasses medium [27]. In a study of citric acid production from beet molasses in continuous culture, Roukas and Harvey found that, at a pH value of 2.5, gluconic acid is the main product and citric acid is the main product product at low pH [28].

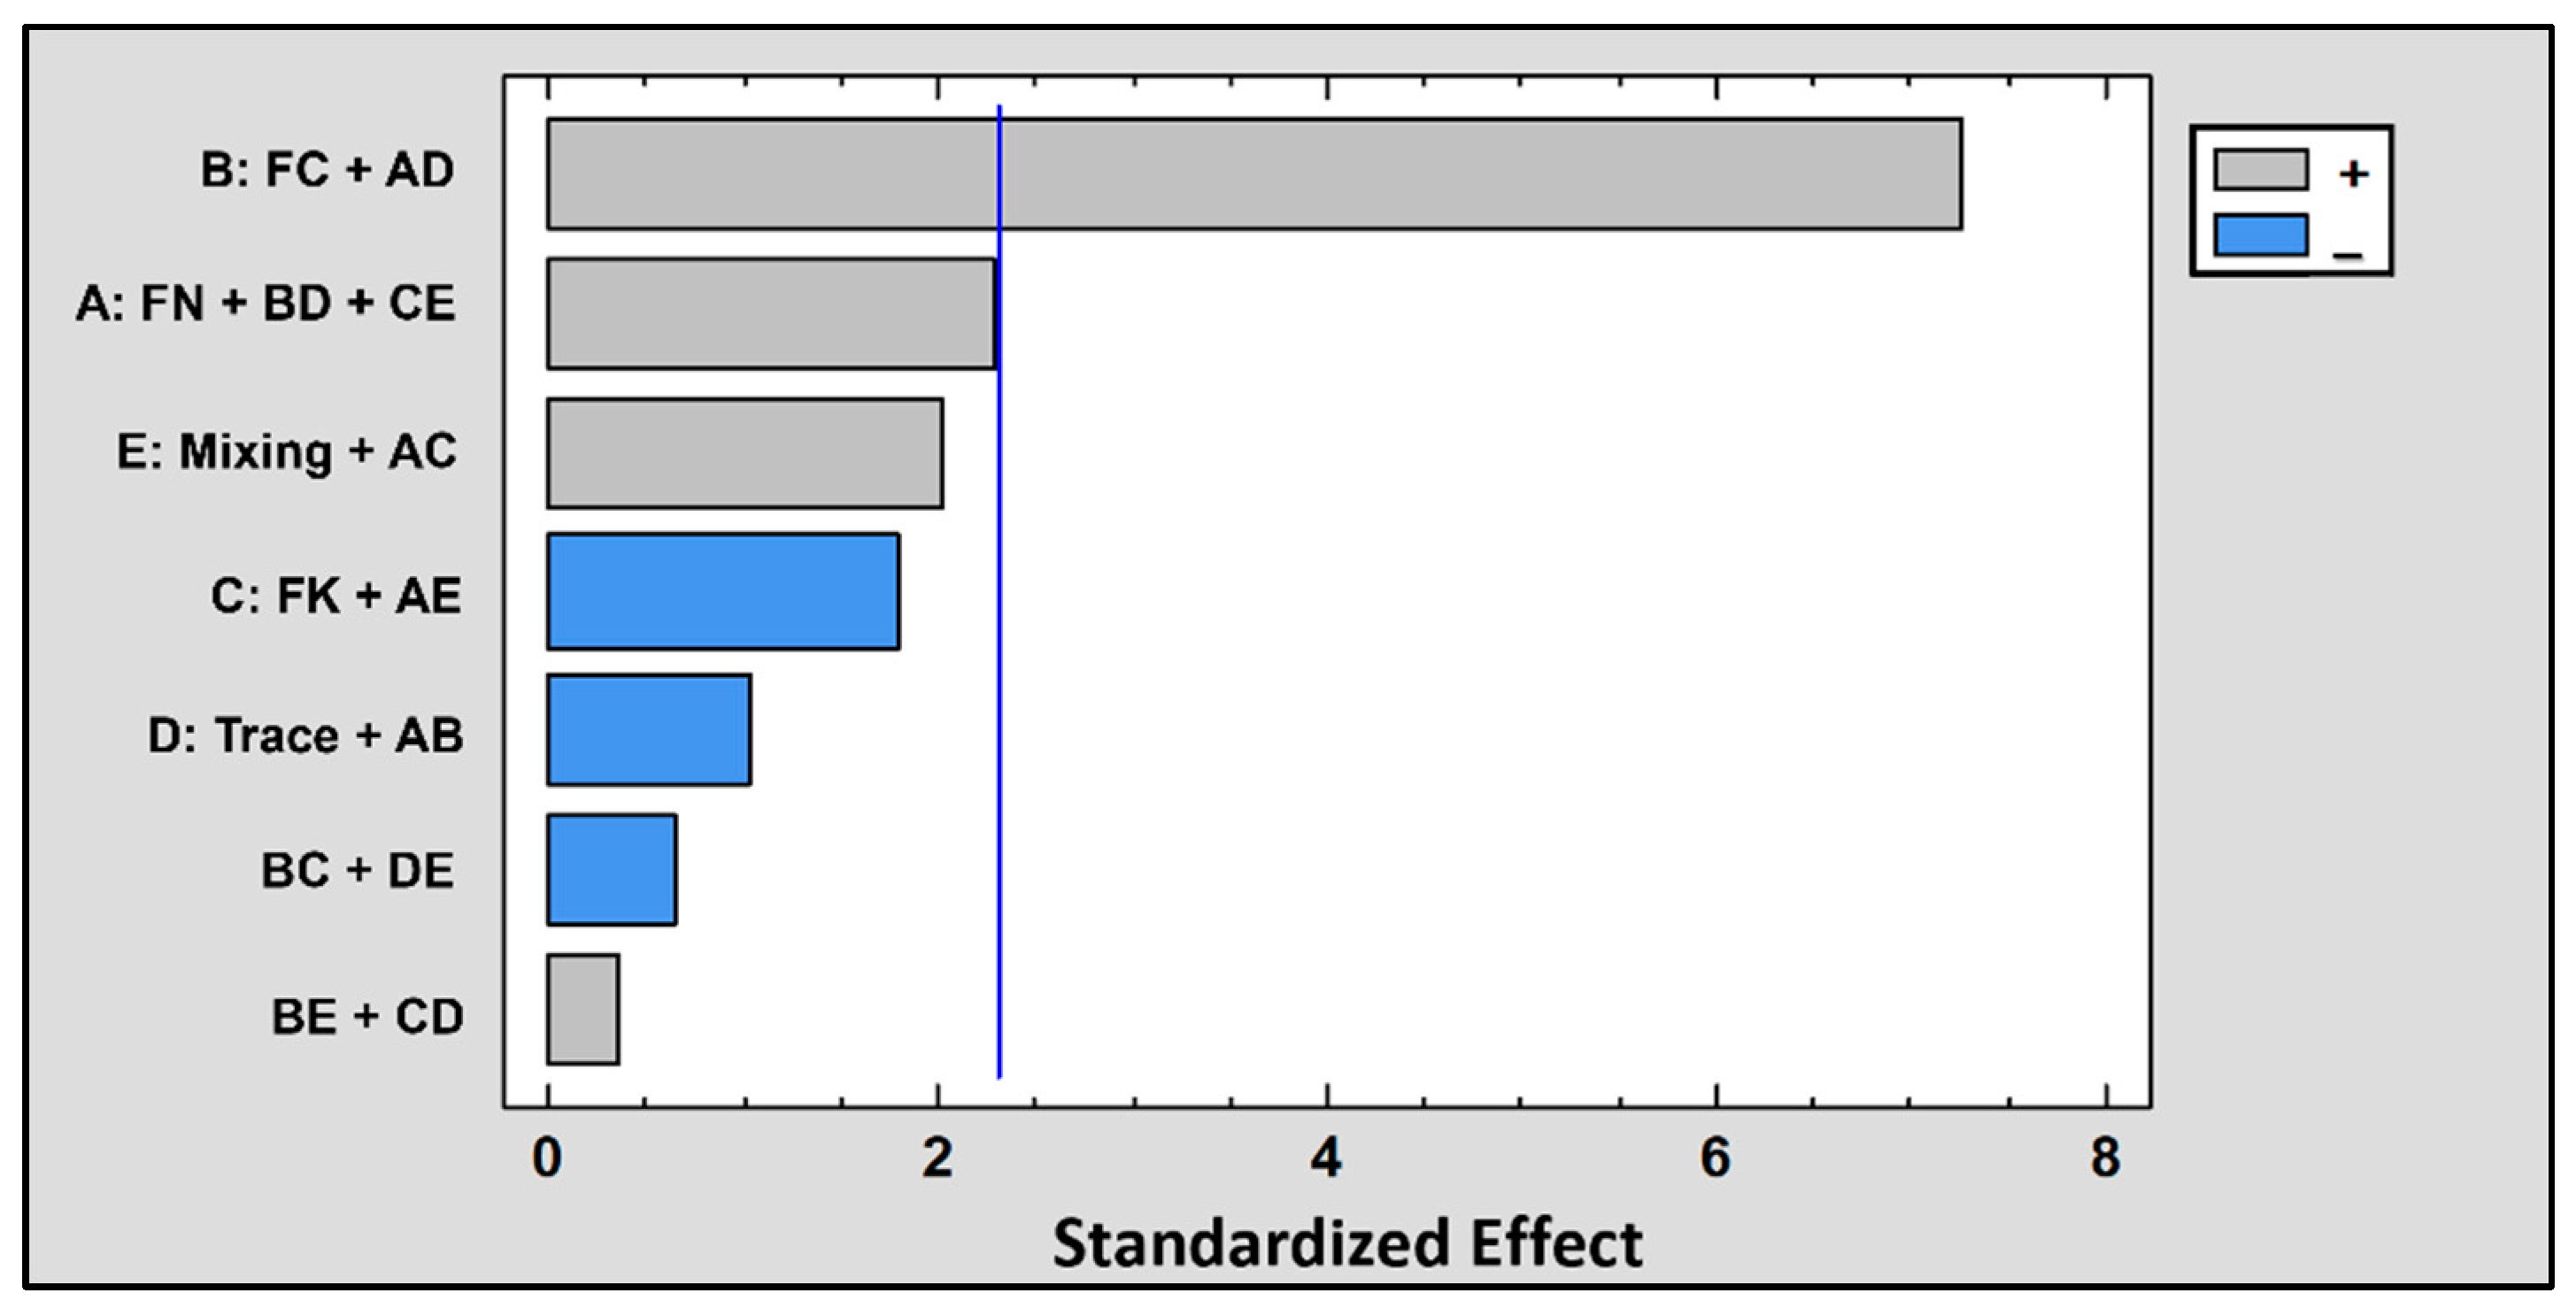
3.1.1. Estimated Effects

All statistical calculations were generated using the STATGRAPHICS Centurion XVIII software to analyze the estimated effects, the t-test (Pareto chart), the regression coefficient, and the optimal values of the factors.
To analyze data in the STATGRAPHICS software it is necessary to provide quantitative factors (parameters or variables). When there is at least one qualitative factor, it is required to be encoded by a number: +1.0 or −1.0. These values correspond to the levels, that is, the range in which the factor is evaluated (upper and lower); thus +1.0: upper level and −1.0: lower level. In the case of this study, the qualitative variables were N source, K source, traces, and agitation.
The effect of a factor is defined as the change in response produced by a change in its level. This also refers to the main effect because it refers to the primary factors of interest in the experiment.
Table 3 shows the values of the estimated effects of each factor and some interactions, according to a linear statistical model for a wavelength of 1060 and 1456 cm−1 [20], as well as the associated standard errors, which measure the sampling error. These are based on the total error with eight degrees of freedom.
The effects of each of the factors are shown, as well as of certain contrasts (linear combinations) of their interactions. Because the design was fractionated, the effects of the variable interactions are confused in pairwise sums.
In this case, all the estimated effects of the factors interacted. They represent the deviations from the mean between the upper and lower levels for each of them.
For example, A is the mixed interaction between the Factor FN plus BD and CE, whereas B is the mixed interaction between the Factor FC plus the interaction between A and D. According to these results, this system has complex levels of interaction between the factors.
Phenomenologically speaking, these results show the interactions between the primary factors and the combinations between them, which means that the variables interact in the bioprocess. From a physical point of view, they have interaction nodes, which is common in bioprocesses, since metabolic, physicochemical, and thermodynamic aspects converge. Consequently, the traditional polynomial mathematical models provided in statistical software do not fit the actual behavior of the system.
The signs of the estimated effects indicate the level of the control variable. These also apply to interactions because the analysis of these is not direct. It is about contrasts instead of separate interactions.

3.1.2. t-test and Analysis

After estimating the effects of the factors, the significant factors affecting the efficiency of the bioleaching process were determined by Student’s t-test, which allows assessing whether the calculated effects are significantly different from zero. If the absolute value of the standardized effect is greater than the value of t, with a probability of 1 − α/2 and with the same degrees of freedom of the error, then this effect is statistically significant. The Pareto charts are shown in Figure 2 and Figure 3, where the factors and their interactions are ordered according to the absolute values of their standardized effects.
For the bioleaching of gold using the infrared spectrum at a wavenumber of 1060 cm−1, all the contrasts are statistically significant, while, for the bioleaching of gold using the infrared spectrum at a wavenumber 1456 cm−1, they were not significant. The contrasts B: FC + AD are statistically representative. First-order factors are not presented, demonstrating the nonlinearity behavior and the influence of strong interactions between the bioprocess variables.
The value of the regression coefficient R2 for the bioleaching of gold using the infrared spectrum at a wavenumber of 1060 cm−1 was 98.95%, and for the bioleaching of gold using the infrared spectrum at a wavenumber of 1456, it was 89.31%; the above shows that there is reproducibility in the experimental data.

3.1.3. Optimal Values of the Factors

Table 4 shows the optimal values of the studied factors for bioleaching, according to the 25−2 fractional factorial design of experiments.
From Table 4, for the bioleaching of gold using the infrared spectrum absorbances at a wavenumber 1060, the regression shows an increase of 9.64% above the 1456 wavenumber. Therefore, to carry out a bioleaching process, the following parameters should be used: nitrogen source: urea; carbon source: sucrose in a concentration of 120 g/L; source of potassium phosphate: K2HPO4, with trace elements and mechanical stirring.
Because the biological process is a complex multivariate system, the results of the analysis of the experiment design yielded values for the second and third level contrasts and their combination, in no case for the first level factors, which do not allow for generating, in a simple, fast, and reliable way, a mathematical model for the prediction of the bioprocess, which makes its scaling difficult. Therefore, similarity models are required, such as Buckingham’s Pi theorem, to scale it.
Microbial processes, being biological in nature, contain a relatively large number of natural variations. The networks associated with microbial reactions are complex, and various factors affect different parts of the networks. The rational experimental design and the statistical evaluation of the results increase the knowledge about the reliability of the information obtained during the experiments. By using an experimental design, the number of experiments required to obtain a reliable optimization of the process is reduced [2,20]. Likewise, multivariate analysis of bioprocess data has the potential to reveal hidden characteristics of the process and provide new insights into factors that affect process performance [29].
In biological processes, media optimization remains one of the most critically investigated phenomena performed before any large-scale metabolite production, and it also presents several challenges. Before the 1970s, culture media optimization was done using classical methods, which were expensive, time-consuming, and involved many experiments with compromised precision. With the advent of modern mathematical/statistical techniques, media optimization has become more vibrant, effective, efficient, economical, and robust in delivering results. To design a production medium, the most suitable fermentation conditions, for example, pH, temperature, and stirring speed, among others, and the appropriate medium components such as carbon and nitrogen, must be identified and optimized [2].
The response surface methodology (RSM), although widely used with great success, has some limitations in the prediction of responses based on second-order polynomial equations. The models are often limited to low levels and result in a poor estimation of optimal formulations and complex variable interactions such as the metabolic complexity of the microorganisms. When it comes to many variables, developing rigorous models for a given biological reaction system on a physical and chemical basis remains a critical challenge, probably due to the non-linear nature of the biochemical network interactions and, in some cases, incomplete knowledge about the kinetics involved in such systems. Furthermore, it is a challenge to study the interactions of more than five variables, and large variations in the factors can give misleading results, possibly due to errors, biases, or lack of reproducibility [2,20].
Therefore, similarity models are required, which can be obtained with mathematical analysis tools, such as Buckingham’s Pi theorem, to scale-up. This theorem is applied when there is little knowledge of the system’s behavior, but the variables that are related to it are known. The grouping in dimensionless packages simplifies the experimental runs.

3.2. Dimensional Analysis Using the Buckingham Pi Theorem

In this work, Buckingham’s Pi theorem was applied because it allows defining correlations between variables of a specific physical problem through its dimensional analysis. In this way, a physical law can be reformulated that interconnects some physical quantities as a function of dimensionless numbers. The objective of the Pi theorem is to define significant non-dimensional parameters, which can be representative of the problem considered and can be used to scale the variables involved on specific physical assumptions [30,31].
Chong et al. [16] applied Buckingham’s Pi theorem in a biological system concerning a microbial fuel cell (MFC) because they are complex and involve numerous variables. They also require countless data collection and calculations. Repeating the experiment is expensive, time-consuming, and labor intensive, with misleading results.
In this study, the composition of the fermented broth was correlated in terms of carbon source (C), nitrogen (N), potassium (K), traces (T), the stirring speed, and the airflow rate. The oxygen was included in the correlation according to the findings of the design of experiments. The models based on the KLa coefficient show that the airflow and agitation speed have a statistically representative influence on biotechnological processes, for example, to produce fermented broths to be used in bioleaching stages [32,33].
From the point of view of dimensional analysis, this engineering problem refers to a system of three-dimensional parameters: [M, L, T], as presented in Table 5.
The seven parameters (n), shown in Table 5, were represented with three dimensions (m) to obtain n − m = 7 − 3 = 4 mutually independent dimensionless parameters.
For the formulation of these parameters, the following variables were selected as repeated variables: C, Q, and A, since these represent together all the fundamental dimensions present in the study. The obtaining of each dimensionless parameter is shown in Equations (2)–(11)
Π 1 = C a 1 Q b 1 A c 1 λ 1
M 0 L 0 T 0 = ( M L 3 ) a 1 ( L 3 T ) b 1 ( 1 T ) c 1 L 1
0 = a 1                       a 1 = 0  
0 = 3 a 1 + 3 b 1 + 1                             b 1 = 1 3    
0 = b 1 c 1                         c 1 = 1 3  
Π 1 = A 1 3     λ 1 Q 1 3 = A Q 3   λ 1
Π 2 = C a 2 Q b 2 A c 2 N
M 0 L 0 T 0 = ( M L 3 ) a 2 ( L 3 T ) b 2 ( 1 T ) c 2 M L 3
0 = a 2 + 1 a 2 = 1 0 = 3 a 2 + 3 b 2 3         b 2 = 0 0 = b 2 c 2 c 2 = 0
Π 2 = N C
Analogous to the parameter Π 2 , the dimensionless parameters Π 3 and Π 4 are obtained, as shown in Equations (12) and (13).
Π 3 = C K
Π 4 = T C
In many biotechnological processes, the relationship between the amount of carbon and other nutrients such as nitrogen has been reported as a relevant variable to characterize the nutritional balance for microorganisms, especially in fermentation processes; previous studies show how the C/N ratio must be close to 42 to optimize the production of organic acids or for bioremediation processes [34,35]. With the results obtained from the dimensional analysis, the functional relationship [36] is presented in the form of Equation (14).
A Q 3   λ 1 = f   ( C N ,   C K ,   T C )

3.3. Experimental Results Obtained from the Correlation of the Mathematical Model

Using the results of the experimental design that were presented in Table 2 and Figure 1, in which it was found that the source of carbon, nitrogen, potassium, and the presence of trace elements are relevant variables for the bioleaching of gold at a wavelength of 1060 cm−1 after obtaining π dimensionless parameters, the effect of the C/N, C/K, and T/C ratios was analyzed using multivariate statistical analysis. The data are presented in Table 6.
The Pearson Product–Moment correlation matrix was estimated to find dependency relationships between the dimensionless parameters C/N, C/K, T/C, and the absorbance at 1060 cm−1. Of the parameters evaluated, only C/N and C/K have a correlation coefficient greater than 0.60, which reflects a representative functional relationship between these relationships and absorbance. Since the dimensionless parameter T/C presented a comparatively lower Pearson coefficient, it was not considered for the subsequent fit of a mathematical model.
The analysis of the Pearson Product–Moment correlations is a bivariate statistical technique that aims to determine the degree of relationship or joint variation existing between two continuous variables, and the correlation index is expressed in the interval between −1 to +1. As the relationship approaches one, the relationship between the variables will be strong. The Pearson Product–Moment correlations are shown in Figure 4. Independent variables: C/N ratio, C/K ratio; dependent variable: absorbance at 1060 cm−1.
Although the design of experiments allows establishing a functional relationship between the studied factors, these relationships, also known as combined effects, are second and third-order polynomial models whose topology limits the mathematical representation of complex or highly non-linear relationships between the independent variables and the response variable. Additionally, Buckingham’s Pi theorem reduces the number of model parameters by formulating dimensionless parameters Π , as indicated in Equation (12), which allows a mathematical model to be reconstructed with greater precision between said parameters.

3.4. Results of the Mathematical Model

To establish the mathematical model for the functional relationship between the dimensionless parameter C/N and C/K at a wavelength of 1060 cm−1, a calculation routine to fit models using multilinear regression in Python was used. The sum of the squares of the absolute errors was the objective function. The model is shown in Equation (15), which has a total absolute error of 5.03 × 10⁻⁵ and a correlation coefficient R2 of 0.9889.
A b s o r b a n c e = a + b ( C / N ) + c L n ( C / K ) + d ( C / N ) 2 + f [ L n ( C / K ) ] 2 + g ( C / N ) L n ( C / K )
This model shows the non-linearity existing between the absorbance and the operational conditions that were used to produce the fermented broth acting on the mineral. The C/N and C/K ratios present in the culture medium affect the composition of the fermented broth and, therefore, the potential to leach metallic species present in the minerals.
The adjustment coefficients obtained for the model are summarized in Table 7.
The method of regression analysis estimated the relationship between each dimensionless variable or variables, referring to the value of the regression coefficient (R2). Commonly, the data with R2 values above 0.90 can be accepted as accurate predictions, and the effectiveness of the mathematical model can be assumed [16].
Figure 5 and Figure 6 show the fit of the data, represented as black dots, to the response surface generated by the mathematical model. The proximity between these points and the surface makes it possible to accurately predict the effect that the C/N ratio and the C/K ratio will have on the absorbance of the fermented broth after treatment with the mineral.
Figure 7 shows, in detail, the contour lines of the response surface in a two-dimensional plane, with lines of constant absorbance in the form of envelopes that validate the results of the dimensional analysis and the bivariate Pearson correlations, where the C/N and C/K ratios, as dimensionless parameters, have a significant effect on the bioleaching of gold using fermented broths. The highest absorbance of the evaluated region was 0.096, which is achieved by producing a fermented broth with a C/N ratio close to 50 and in the vicinity of a C/K ratio close to 800.
A similar result was obtained by [35], in which the C/N ratio presented a statistically significant effect in the optimization of a medium for the production of organic acids in submerged fermentation of A. niger.

3.5. Bioprocess Scale-Up

In scaling bioprocesses, dimensionless parameters serve as the basis for formulating scale factors. Similarity models can be developed based on equality of the π parameters found or combined with other parameters used in the hydrodynamic study of systems such as the Reynolds number, Froude number, and Weber number, among others [16].
Given that, in this biotechnological process, it was decided to operate the bioreactor at a low Reynolds number to avoid significant damage to the fungal biomass and considering the solubility of oxygen in the culture medium used in the experimental designs, the mass transfer of oxygen into the fluid was used as the controlling phenomenon for scaling, as shown in Equations (16)–(18) [37].
K L a E x p e r i m e n t a l = K L a P i l o t
K L a = 0.99 ( Q 2.56 D 5 ) 0.778
Q 2 = Q 1 ( D 2 D 1 ) 2.56
where:
  • D: Bioreator diameter (m);
  • Q: Bioreactor Airflow (m3/s).
One refers to the experimental bioreactor, and two refers to the pilot bioreactor
Equation (16) shows the criteria for bioreactor scale-up. The equality of the mass transfer of oxygen. Equation (17) represents the common correlation for mass transfer of oxygen in cylindrical bioreactors, which derives in Equation (18), as a guide to estimate the bioreactor airflow during the process scale-up.
A similar conclusion was developed by [30] in the scaling of photobioreactors for the cultivation of microalgae, in which, using Buckingham’s π theorem, the authors managed to develop a mathematical model of similarity between the laboratory and pilot scales. In this study, the dimensionless parameters were related directly to the agitation speed and the aeration flow through Equation (5), previously presented.

4. Conclusions

In this study, a methodology was proposed that combines statistical analysis by the design of experiments with Buckingham’s Pi theorem to formulate a predictive model for bioprocess scale-up. This bioprocess, as a system, was found to be complex due to its multivariate nature, and, through a 25−2 fractional factorial design, the ANOVA analysis of variance showed that the interactions between the factors are highly relevant as opposed to the individual factors.
Using Buckingham’s Pi theorem, it was found that the C/N, C/K, and T/C ratios are dimensionless factors that explain the potential of the fermented broth for the bioleaching process and allow an analytical basis for scaling-up. Using the Pearson Product–Moment bivariate technique, the dimensionless factors C/N and C/K correlate with the leaching potential of the fermented broth at 1060 cm−1.
A non-linear logarithmic model was formulated based on dimensionless parameters explaining the behavior of the system. The obtained correlation coefficient R2 was 0.9889, and a total absolute error of 5.03 × 10⁻⁵ was found, allowing the prediction of the scaling of the bioprocess.
The contour lines of the response surface were developed in a two-dimensional plane, with lines of constant absorbance in enveloping shape that validate the results of the dimensional analysis and the bivariate Pearson correlations. The highest absorbance was 0.096 to produce fermented broth, with a C/N ratio close to 50 and a C/K ratio close to 800. Finally, this combined methodology between the design of experiments and Buckingham’s Pi Theorem can be developed for strategies for multivariate and non-linear bioprocesses scale-up, with high dependence between their factors.

5. Patents

A patent resulting from the work reported in this manuscript was issued from the Colombian patent office (Superintendencia de Industria y Comercio). Title: “Composition for the separation and recovery of metals in solid matrices through leaching that includes carboxyl acid, monosaccharides, disaccharides, amino acids, fatty acids, alcohols and phenolic compounds and processes” (2019). Code: NC2019/0013648.

Author Contributions

Conceptualization, M.R.-C. and L.R.-C.; Methodology, M.R.-C. and L.R.-C.; validation, M.R.-C., L.R.-C., C.O.-L. and L.G.-A.; formal analysis, M.R.-C., L.R.-C., L.G.-A. and C.O.-L.; investigation, L.R.-C.; resources, M.R.-C.; data curation, C.O.-L.; writing—original draft preparation, M.R.-C., L.R.-C. and C.O.-L.; writing—review and editing, M.R.-C., L.R.-C. and C.O.-L.; visualization C.O.-L.; funding acquisition, M.R.-C. All authors have read and agreed to the published version of the manuscript.

Funding

This research received no external funding.

Institutional Review Board Statement

Not applicable.

Informed Consent Statement

Not applicable.

Acknowledgments

The authors appreciate the technical support received from the engineer Rubén Darío Giraldo-Aristizabal during the execution of this research.

Conflicts of Interest

The authors declare no conflict of interest.

References

  1. Markets and Markets. Bioprocess Validation Market by Test Type (Extractables and Leachables, Integrity Testing, Microbiology Testing), Process Component (Filter Element, Bioreactors), End-User (CDMO, Biotechnology & Pharmaceutical Companies)—Global Forecast to 2024; Markets and Markets: San Francisco, CA, USA, 2019. [Google Scholar]
  2. Singh, V.; Haque, S.; Niwas, R.; Srivastava, A.; Pasupuleti, M.; Tripathi, C. Strategies for Fermentation Medium Optimization: An In-Depth Review. Front. Microbiol. 2017, 7, 2087. [Google Scholar] [CrossRef] [PubMed]
  3. Wang, G.; Haringa, C.; Noorman, H.; Chu, J.; Zhuang, Y. Developing a Computational Framework To Advance Bioprocess Scale-Up. Trends Biotechnol. 2020, 38, 846–856. [Google Scholar] [CrossRef]
  4. Grand View Research. Industrial Bioprocessing Market Size, Share & Trends Analysis Report by Application, Regional Outlook, Competitive Strategies, and Segment Forecasts, 2019 to 2025; Grand View Research: San Francisco, CA, USA, 2020. [Google Scholar]
  5. Credence Research. Bioleaching Market by Type (Copper, Biomining, Iron) by Application (Mining, Others): Growth, Future Prospects, and Competitive Analysis, 2015–2027; Credence Research: San José, CA, USA, 2021. [Google Scholar]
  6. Kang, J.-K.; Cho, K.-H.; Kim, S.-B.; Choi, N.-C. Artificial Neural Network Modeling for Prediction of Dynamic Changes in Solution from Bioleaching by Indigenous Acidophilic Bacteria. Appl. Sci. 2020, 10, 7569. [Google Scholar] [CrossRef]
  7. Lalou, S.; Ferentidou, M.; Mantzouridou, F.T.; Tsimidou, M.Z. Balsamic type varietal vinegar from cv. Xinomavro (Northen Greece). Optimization and scale-up of the alcoholic fermentation step using indigenous multistarters. Food Chem. 2018, 244, 266–274. [Google Scholar] [CrossRef] [PubMed]
  8. Martínez, O.; Sánchez, A.; Font, X.; Barrena, R. Enhancing the bioproduction of value-added aroma compounds via solid-state fermentation of sugarcane bagasse and sugar beet molasses: Operational strategies and scaling-up of the process. Bioresour. Technol. 2018, 263, 136–144. [Google Scholar] [CrossRef] [Green Version]
  9. Hardy, N.; Augier, F.; Nienow, A.W.; Béal, C.; Ben Chaabane, F. Scale-up agitation criteria for Trichoderma reesei fermentation. Chem. Eng. Sci. 2017, 172, 158–168. [Google Scholar] [CrossRef]
  10. Sarkizi Shams Hajian, C.; Haringa, C.; Noorman, H.; Takors, R. Predicting By-Product Gradients of Baker’s Yeast Production at Industrial Scale: A Practical Simulation Approach. Processes 2020, 8, 1554. [Google Scholar] [CrossRef]
  11. Perez, C.L.; Casciatori, F.P.; Thoméo, J.C. Strategies for scaling-up packed-bed bioreactors for solid-state fermentation: The case of cellulolytic enzymes production by a thermophilic fungus. Chem. Eng. J. 2019, 361, 1142–1151. [Google Scholar] [CrossRef]
  12. de Medeiros, E.M.; Noorman, H.; Maciel Filho, R.; Posada, J.A. Production of ethanol fuel via syngas fermentation: Optimization of economic performance and energy efficiency. Chem. Eng. Sci. X 2020, 5, 100056. [Google Scholar] [CrossRef]
  13. Moreno-Zambrano, M.; Grimbs, S.; Ullrich, M.S.; Hütt, M.-T. A mathematical model of cocoa bean fermentation. R. Soc. Open Sci. 2018, 5, 180964. [Google Scholar] [CrossRef] [PubMed] [Green Version]
  14. Kordas, M.; Konopacki, M.; Grygorcewicz, B.; Augustyniak, A.; Musik, D.; Wójcik, K.; Jędrzejczak-Silicka, M.; Rakoczy, R. Hydrodynamics and Mass Transfer Analysis in BioFlow® Bioreactor Systems. Processes 2020, 8, 1311. [Google Scholar] [CrossRef]
  15. Rodman, A.D.; Gerogiorgis, D.I. Computer Aided Chemical Engineering; Elsevier B.V.: Amsterdam, The Netherlands, 2016; Volume 38, pp. 1033–1038. [Google Scholar]
  16. Tang, R.C.O.; Jang, J.H.; Lan, T.H.; Wu, J.C.; Yan, W.M.; Sangeetha, T.; Wang, C.T.; Ong, H.C.; Ong, Z.C. Review on design factors of microbial fuel cells using Buckingham’s Pi Theorem. Renew. Sustain. Energy Rev. 2020, 130, 109878. [Google Scholar] [CrossRef]
  17. Russo, L.; Sorrentino, M.; Polverino, P.; Pianese, C. Application of Buckingham Π theorem for scaling-up oriented fast modelling of Proton Exchange Membrane Fuel Cell impedance. J. Power Sources 2017, 353, 277–286. [Google Scholar] [CrossRef]
  18. Polverino, P.; Bove, G.; Sorrentino, M.; Pianese, C.; Beretta, D. Advancements on scaling-up simulation of Proton Exchange Membrane Fuel Cells impedance through Buckingham Pi theorem. Appl. Energy 2019, 249, 245–252. [Google Scholar] [CrossRef]
  19. Ramirez-Carmona, M.; Cardona, M.; Torres-Taborda, M. Introducción a la ingeniería Bioquímica; Universidad Pontificia Bolivariana: Medellin, Colombia, 2009. [Google Scholar]
  20. Montgomery, D.; Runger, G. Applied Statistics and Probability for Engineers; John Wyley & Sons Inc.: Danvers, MA, USA, 2010. [Google Scholar]
  21. Carmona, M.E.R.; da Silva, M.A.P.; Ferreira Leite, S.G. Biosorption of chromium using factorial experimental design. Process Biochem. 2005, 40, 779–788. [Google Scholar] [CrossRef]
  22. Wösten, H.A.B. Filamentous fungi for the production of enzymes, chemicals and materials. Curr. Opin. Biotechnol. 2019, 59, 65–70. [Google Scholar] [CrossRef]
  23. Hofmann, T.; Shaw, R. Proteolytic enzymes of Penicillium janthinellum. I. Purification and properties of a trypsinogen-activating enzyme (peptidase A). BBA-Enzymol. Subj. 1964, 92, 543–557. [Google Scholar]
  24. Valix, M. Method for Removing Boron in Water Treatment. US20110259829A1, 2009. Available online: https://patentimages.storage.googleapis.com/a5/ab/60/e8c229258db8b3/US20110259829A1.pdf (accessed on 20 November 2021).
  25. Shadafza, D.; Ogawa, T.; Fazeli, A. Comparison of citric acid production from beet molasses and date syrup withAspergillus niger. Hakko Kogaku Zasshi 1976, 54, 65–75. [Google Scholar]
  26. Kumar, D.; Jain, V.K.; Shanker, G.; Srivastava, A. Citric acid production by solid state fermentation using sugarcane bagasse. Process Biochem. 2003, 38, 1731–1738. [Google Scholar] [CrossRef]
  27. Rokosu, A.A.; Anenih, C.A. Effects of various conditions on the production of citric acid during fermentation of molasses by Aspergillus niger. Enzyme Microb. Technol. 1980, 2, 61–62. [Google Scholar] [CrossRef]
  28. Roukas, T.; Harvey, L. The effect of pH on production of citric and gluconic acid from beet molasses using continuous culture. Biotechnol. Lett. 1988, 10, 289–294. [Google Scholar] [CrossRef]
  29. Le, H.; Kabbur, S.; Pollastrini, L.; Sun, Z.; Mills, K.; Johnson, K.; Karypis, G.; Hu, W.S. Multivariate analysis of cell culture bioprocess data—Lactate consumption as process indicator. J. Biotechnol. 2012, 162, 210–223. [Google Scholar] [CrossRef]
  30. Paladino, O.; Neviani, M. Scale-up of photo-bioreactors for microalgae cultivation by π-theorem. Biochem. Eng. J. 2020, 153, 107398. [Google Scholar] [CrossRef]
  31. Harun, N.H.; Abdul-Aziz, A.; Rahman, R.A.; Yaakub, H.; Aziz, R.; Ware, I. Dimensional-analysis and similitude for scale-up of solid-liquid extraction of Eurycoma longifolia roots. Chem. Eng. Sci. 2020, 217, 115490. [Google Scholar] [CrossRef]
  32. Acevedo, F. The use of reactors in biomining processes. Electron. J. Biotechnol. 1997, 3, 10–11. [Google Scholar] [CrossRef]
  33. Klöckner, W.; Tissot, S.; Wurm, F.; Büchs, J. Power input correlation to characterize the hydrodynamics of cylindrical orbitally shaken bioreactors. Biochem. Eng. J. 2012, 65, 63–69. [Google Scholar] [CrossRef]
  34. Pandey, P.; Putatunda, S.; Dewanga, L.; Pawar, V.; Belorkar, S. Studies on citric acid production by Aspergillus niger in batch fermentation. Recent Res. Sci. Technol. 2013, 5, 66–67. [Google Scholar]
  35. Aboyeji, O.O.; Oloke, J.K.; Arinkoola, A.O.; Oke, M.A.; Ishola, M.M. Optimization of media components and fermentation conditions for citric acid production from sweet potato peel starch hydrolysate by Aspergillus niger. Sci. Afr. 2020, 10, e00554. [Google Scholar] [CrossRef]
  36. Pritchard, P. Fox and McDonald’s Introduction to Fluid Mechanics; John Wiley & Sons, Inc.: New York, NY, USA, 2010. [Google Scholar]
  37. Platon, R.R. Oxygen Mass Transfer Coefficient (K L a) as Scale-Up Criterion in Brine Shrimp Culture. IFAC Proc. Vol. 1987, 20, 109–117. [Google Scholar] [CrossRef]
Figure 1. Bioprocess system.
Applsci 11 11338 g001
Figure 2. Pareto diagram for bioleaching of gold using infrared spectrum absorbance at 1060 cm−1.
Applsci 11 11338 g002
Figure 3. Pareto diagram for bioleaching of gold using infrared spectrum absorbance at 1456 cm−1.
Applsci 11 11338 g003
Figure 4. Pearson Product–Moment Correlations. Independent variables: C/N ratio, C/K ratio; dependent variable: absorbance at 1060 cm−1.
Applsci 11 11338 g004
Figure 5. Response surface of the mathematical model of absorbance as a function of the C/N and C/K ratio, frontal view.
Applsci 11 11338 g005
Figure 6. Response surface of the mathematical model of absorbance as a function of the C/N and C/K ratio, back view.
Applsci 11 11338 g006
Figure 7. Contour lines of the response surface of the mathematical model of absorbance as a function of the C/N and C/K ratios.
Applsci 11 11338 g007
Table 1. Laboratory scale 25−2 fractional factorial design matrix.
Experiment NumberN SourceC SourceK SourceTrace ElementsAgitation
1Urea (0.75 g/L)Sucrose (120 g/L)K2HPO4 (0.128 g/L)NoMechanical
2(NH4)2SO4 (0.428 g/L)Sucrose (40 g/L)KH2PO4 (0.8 g/L)NoMechanical
3(NH4)2SO4 (0.428 g/L)Sucrose (120 g/L)KH2PO4 (0.8 g/L)YesMechanical
4Urea (0.75 g/L)Sucrose (40 g/L)KH2PO4 (0.8 g/L)YesAeration mixing
5(NH4)2SO4 (0.428 g/L)Sucrose (120 g/L)K2HPO4 (0.128 g/L)YesAeration mixing
6Urea (0.75 g/L)Sucrose (40 g/L)K2HPO4 (0.128 g/L)YesMechanical
7Urea (0.75 g/L)Sucrose (120 g/L)KH2PO4 (0.8 g/L)NoAeration mixing
8(NH4)2SO4 (0.428 g/L)Sucrose (40 g/L)K2HPO4 (0.128 g/L)NoAeration mixing
Table 2. Laboratory scale 25−2 fractional factorial design matrix with results. A1 (Oxalic acid), A2 (Citric acid), A3 (Malic acid), A4 (Acetic acid).
ExperimentFactors Response Variables
N Source
(FN)
C Source
(FC)
K Source
(FK)
Trace ElementsAgitationpHA1 (g/L)A2 (g/L)A3 (g/L)A4 (g/L)λ1
1060 cm−1
λ2
1456 cm−1
1Urea (0.75 g/L)Sucrose (120 g/L)K2HPO4 (0.128 g/L)NoMechanical3.1920.2220.2526.5030.0340.0950.0720
2(NH4)2SO4 (0.428 g/L)Sucrose (40 g/L)KH2PO4 (0.8 g/L)NoMechanical2.8200.0090.2910.9640.0110.0660.0630
3(NH4)2SO4 (0.428 g/L)Sucrose (120 g/L)KH2PO4 (0.8 g/L)YesMechanical2.9420.0020.1015.6270.0240.0980.0686
4Urea (0.75 g/L)Sucrose (40 g/L)KH2PO4 (0.8 g/L)YesAeration mixing3.1190.0020.0193.4700.1020.0530.0599
5(NH4)2SO4 (0.428 g/L)Sucrose (120 g/L)K2HPO4 (0.128 g/L)YesAeration mixing2.5520.0060.1076.0910.1310.0960.0683
6Urea (0.75 g/L)Sucrose (40 g/L)K2HPO4 (0.128 g/L)YesMechanical3.1520.0070.7840.9720.0300.0630.0614
7Urea (0.75 g/L)Sucrose (120 g/L)KH2PO4 (0.8 g/L)NoAeration mixing2.7710.0150.4283.4460.0360.0660.0672
8(NH4)2SO4 (0.428 g/L)Sucrose (40 g/L)K2HPO4 (0.128 g/L)NoAeration mixing2.4720.0070.1401.1770.1170.0680.0638
Note: in all the tests, the presence of proteins was evidenced. FN: N Source; FC: C Source; FK: K Source.
Table 3. Estimated Effects for the 25−2 Fractional Factorial.
FactorFactor Bioleaching of Gold Using the Infrared Spectrum at 1060 cm−1Factor Bioleaching of Gold Using the Infrared Spectrum at 1456 cm−1
Estimated ± standard errorEstimated ± standard error
Average0.0749 ± 0.000610.0647 ± 0.000441
A: FN + BD + CE0.0133 ± 0.001220.0020 ± 0.000883
B: FC + AD0.0255 ± 0.001220.0064 ± 0.000883
C: FK + AE−0.0093 ± 0.00122−0.0016 ± 0.000883
D: Trace + AB0.0043 ± 0.00122−0.0009 ± 0.000883
E: Mixing + AC0.0118 ± 0.001220.0018 ± 0.000883
BC + DE−0.0046 ± 0.00122−0.0006 ± 0.000883
BE + CD0.0047 ± 0.001220.0003 ± 0.000883
The first order factors were: FN: N Source; FC: C Source; FK: K Source; Trace; Mixing and other combinations.
Table 4. Optimal values of the studied factors, according to the 25−2 fractional factorial design of experiments.
FactorFactor Bioleaching of Gold Using the Infrared Spectrum at 1060 cm−1
(R2 = 0.9895)
Factor Bioleaching of Gold Using the Infrared Spectrum at 1456 cm−1
(R2 = 0.8931)
CodedLevelCodedLevel
FN (g/L)0.96Urea1.0Urea
FC (g/L)0.971200.97120
FK (g/L)−1.0K2HPO4−1.0K2HPO4
Traces1.0Yes−0.99No
Agitation0.92Mechanical0.98Mechanical
Table 5. Variables and dimensions used in the application of Buckingham’s Pi theorem.
Experiment NumberN SourceC SourceK Source
Carbon Source ConcentrationCkg m−3ML−3
Nitrogen source concentrationNkg m−3ML−3
Potassium source concentrationKkg m−3ML−3
Trace concentrationTkg m−3ML−3
AgitationArad s−1T−1
Air flow for aerationQm3 s−1L3T−1
Wavelengthλ1mL
Table 6. Fermentation data. Independent variables: C/N and C/K ratios; dependent variable: absorbance at 1060 cm−1.
ExperimentC/N RatioC/K RatioT/C RatioAbsorbance (1060 cm−1)
1160.00937.500.000.0952
293.4650.000.000.0656
3280.37150.00208.330.0981
453.3350.00625.000.0532
5280.37937.50208.330.0961
653.33312.50625.000.0630
7160.00150.000.000.0662
893.46312.500.000.0681
Table 7. Model coefficients obtained for the mathematical model representing the functional relationship between the absorbance at 1060 cm−1 with the dimensionless parameter C/N and C/K.
Model CoefficientMean ValueMin ValueMax Value
a 6.307 × 10−15.32997 × 10−17.28467 × 10⁻¹
b −8.941 × 10⁻⁴−1.12021 × 10⁻³−6.68058 × 10⁻⁴
c −5.181 −6.06245−4.29899
d 4.233 × 10−71.64967 × 10−76.81627 × 10⁻⁷
f 11.079.1489513.0008
g 4.950 × 10−33.98539 × 10−35.91491 × 10⁻³
Publisher’s Note: MDPI stays neutral with regard to jurisdictional claims in published maps and institutional affiliations.

