Article

Application of Various YOLO Models for Computer Vision-Based Real-Time Pothole Detection

1
Department of Civil Engineering, Kyungpook National University, Daegu 41566, Korea
2
Department of Architectural Engineering, Kyungpook National University, Daegu 41566, Korea
*
Author to whom correspondence should be addressed.
Appl. Sci. 2021, 11(23), 11229; https://doi.org/10.3390/app112311229
Submission received: 24 October 2021 / Revised: 16 November 2021 / Accepted: 22 November 2021 / Published: 26 November 2021

Abstract

:
Pothole repair is one of the paramount tasks in road maintenance. Effective road surface monitoring is an ongoing challenge to the management agency. The current pothole detection, which is conducted image processing with a manual operation, is labour-intensive and time-consuming. Computer vision offers a mean to automate its visual inspection process using digital imaging, hence, identifying potholes from a series of images. The goal of this study is to apply different YOLO models for pothole detection. Three state-of-the-art object detection frameworks (i.e., YOLOv4, YOLOv4-tiny, and YOLOv5s) are experimented to measure their performance involved in real-time responsiveness and detection accuracy using the image set. The image set is identified by running the deep convolutional neural network (CNN) on several deep learning pothole detectors. After collecting a set of 665 images in 720 × 720 pixels resolution that captures various types of potholes on different road surface conditions, the set is divided into training, testing, and validation subsets. A mean average precision at 50% Intersection-over-Union threshold (mAP_0.5) is used to measure the performance of models. The study result shows that the mAP_0.5 of YOLOv4, YOLOv4-tiny, and YOLOv5s are 77.7%, 78.7%, and 74.8%, respectively. It confirms that the YOLOv4-tiny is the best fit model for pothole detection.

1. Introduction

Road maintenance conditions are an important factor contributing to decrease the probability of accidents on road. 94% of road accidents are attributed to poor maintenance conditions in USA [1]. It is well accepted that the methods which may improve road maintenance performance is important to reduce the occurrence of accidents. However, the economic devastation all over the world downgrades the priority associated with maintaining road quality in many nations unfortunately. The surface quality of road, which is a dominant factor of road conditions, is performed manual base, hence, being costly and time-consuming. Existing methods need involvement by expert(s) to determine the surface condition associated with roads. Decision-making by an individual human expert may lead to arbitrariness and/or misjudgement. The state of art in visual detection along with electronic devices provide a measure to get images associated with the surface quality of road with affordable cost automatically. Existing studies detect all kinds of nonconformity on traffic roads by obtaining clear images of wear, tear and damage being in various severity.
Existing methods which detect damage on the surface road make use of various techniques such as lasers [2], vibration sensors [3], and imaging [4], etc. Especially, the image processing-based methods encourage hybridizing the machine learning to augment the detection of various pavement deterioration types. Object detection, which is a major function in computer vision, is deployed in practical civil and infrastructure engineering applications such as surface nonconformity or defect (i.e., crack) detection [5,6,7,8,9] and intelligent traffic assistance [10]. The performance of deep neural networks has been rapidly improved for benchmark object classification and detection. For sure, the AlexNet architecture for deep learning [11], which ranks the current best for object classification and detection, outperforms over other methods that integrate feature extraction algorithms and traditional machine learning algorithms such as the support vector machine. The You Only Look Once (YOLO) algorithm [12], which complements conventional machine learning solutions achieving object detection by using pattern recognition techniques, is built on the AlexNet. YOLO may response in real-time even running on computationally limited devices because it determines a prediction by executing only one forward propagation through the neural network. The algorithm has been upgraded into its versions of YOLOv3 [13], YOLOv4 [14], and YOLOv5 [15]. For sure, it would be beneficial to the road maintenance community if the best fit model for pothole detection is provided into the road maintenance arsenals.
A new pothole detection and visualization method, which acquires precise dimensional information of pothole having heterogeneity and visualizes them intuitive on handheld device, would be beneficial for a road maintenance inspector to determine and repair the nonconformity responsively. The synergy accrued by integrating computer vision and CNN may contribute to maximize the accuracy and effectiveness of pothole inspection. The main contribution of this paper is to find out the best fit model that allows efficiently heterogenous damage (i.e., pothole) detection on the surface of road. The mean average precision at 50% Intersection-over-Union threshold (mAP_0.5) for each YOLOv4 [14], YOLOv4-tiny [16], and YOLOv5s [15] models is set as a measure of performance. The research was conducted in six steps. First, the overview of existing methods for object detection was investigated as elaborated in Section 2. Second, the dataset was described in Section 3. Third, the approach for evaluating the performance of pothole detectors using data attributes of computer vision and those of CNN is given in Section 4. In addition, the validation experiment outputs are presented in Section 5. Final, the discussion on the experiments, research contributions and limitations, and future research recommendation are discussed in Section 6. The material in this paper is organized in the same order.

2. Current State of Object Detection and Classification

2.1. Object Detection

Object detection methods that use deep convolutional neural networks (CNNs), which has a multi-stage or multi-layer architecture proposed by LeCun [17], do not require specific schemas to extract objects from images. The CNN, which includes sequential convolutional, rectification, and pooling layers, may generate automatically features from input images. The parameters of each layer are automatically trained to detect an object (i.e., potholes, etc.). Given that the intermediate and the final outputs of the convolution in the network layer cannot be controlled or explained in physical terms, CNN methods are accepted as black-box methods. The rapider the advancement of the computational performance of computer, the deeper the CNNs in sequential layers, hence, classifying object excellently. CNN-based deep learning is well accepted as an effective approach for classification [18,19], prediction [20,21,22], and object identification [23,24]. Indeed, the CNN is the predominant machine learning method for object recognition, given the robustness of it.
An object detector, which locates and classifies predefined objects in an image, consists of two parts, a backbone, which is pre-trained on ImageNet, and a head, which is used to predict classes and bounding boxes of objects. The deep CNNs, which have proven their effectiveness in many machine learning tasks, are extensively applied for object detection. They implement either two-stage or one-stage object detectors. The former manifest very good performance but suffers from slow computational speed, hence delaying response. They are the RCNN family, which includes RCNN [25], fast-RCNN [26], faster-RCNN [27], mask-RCNN [28], and Cascade-RCNN [29]. On the other hand, the latter are under study to complement the computation and responsiveness issues. Their networks include SSD [30] and YOLO [12,13,14,15,16].

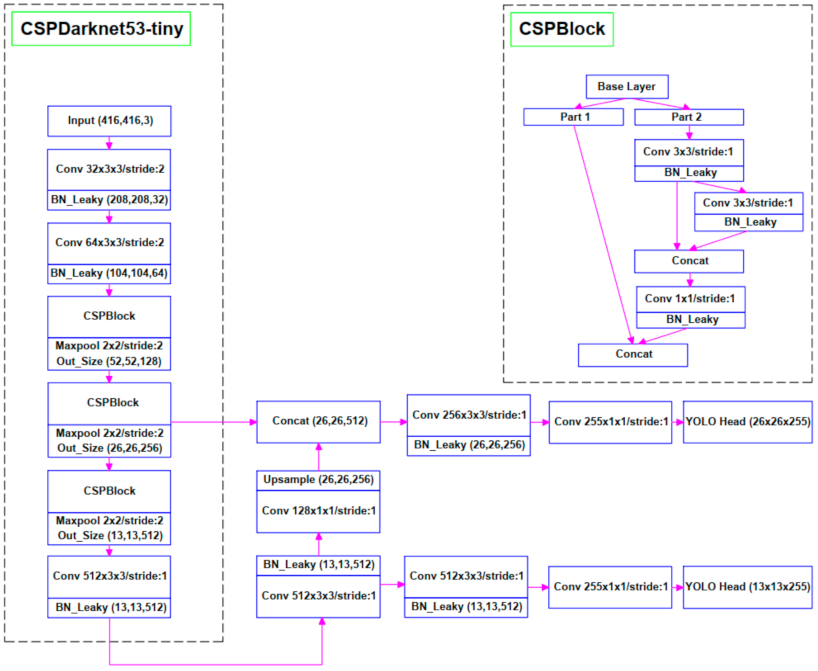
2.2. YOLO Architectures

After appearing the first version of YOLO (i.e., YOLOv1) [31] which complements the two-stage object detectors, it has been well accepted as the top notch deep convolutional neural models for object detection of which inference speed, accuracy, and generalizability are outstanding. The outstanding performance is achieved by handling the object detection as a regression rather than a classification problem using a single neural network. In addition, it may be easily trained to detect various objects. Indeed, it outperforms over other models in inference speed, hence, making it widely used in practical applications. Object detection models may be trained quickly and predictions using them may be obtained in a fraction of seconds, suitable for use in real-time. The detection time could be an important factor for video processing in real time. However, it was not measured in this study, because the study focusses on accuracy, as a metric for model selection. Noteworthy is that YOLOv4 and later versions have been significantly improved in speed and accuracy, all real-time processing.
Over the latest four years, YOLO has been developed into five versions by accommodating improvement ideas given from the object detection community. The first three versions, i.e., YOLOv1 [31], YOLOv2 [12], and YOLOv3 [13], were developed by the original author of YOLO algorithm. For sure, the YOLOv3 [13] arrived at substantial performance improvements owing to the introduction of multi-scale features (FPN) [32], a better backbone network (Darknet53), and replacement of the SoftMax categorical loss function with the binary cross-entropy loss function. Thereafter, YOLOv4 [14] was released by another research group rather than the original YOLO authors. The overall network architecture of YOLOv4 consisting of three parts (i.e., backbone, neck, and head), which is implemented using YOLOv4 in this study, is shown in Figure 1. The YOLOv4 upgrades several options involved in the YOLOv3 algorithm [13], including the backbone called bags of freebies and bags of specials. It arrives at 43.5% AP (65.7% AP50) for the MS COCO dataset at a real-time speed of 65 FPS on Tesla V100.
The pothole detector running on the graphics processing unit (GPU) may handle effectively real-time images [33]. However, it may completely eat up computational resource when the detector runs on devices having poor processing capabilities. YOLOv4-tiny [16] network may be used to complement the YOLOv4 which works slow on the confined hardware, hence, satisfying requests in real-time using limited hardware resources. The architecture of the YOLOv4-tiny network, which is implemented in this study, is defined using the attributes and their values shown in Figure 2. In the YOLOv4-tiny, the CSPDarknet53-tiny network plays a role as the backbone network, whereas the CSPDarknet53 network is used in the Yolov4 model.
The YOLOv4 [14] followed by YOLOv5 [15] was introduced within a month interval. YOLOv5 [15] was welcomed by the object detection community because it is smaller in size, higher in speed, and comparable in performance against to YOLOv4 [14], even if it does not arrive at outstanding algorithmic innovation. The overall network architecture of YOLOv5 consisting of three parts (i.e., backbone, PANet, and output), which was fully implemented using Python (PyTorch), is presented in Figure 3. An ordinary object detector is composed of several parts (i.e., backbones, neck, and heads, etc.). A neck includes either additional blocks (i.e., SPP, ASPP, RFB, SAM), or path-aggregation blocks (i.e., FPN, PAN, NAS-FPN, fully connected FPN, BiFPN, ASFF, SFAM). In YOLOv4, SPP + PAN is used in a neck part. The comparison of SPP + PAN with other blocks in the Neck part is beyond the scope of this study.

3. Dataset

Du et al. (2020) claims accurate the identification and diagnosis of nonconformity (or holes and cracks, etc.) types is important quality goal involved in road pavement [34]. The accuracy and reliability of the output variables associated with prediction using the deep learning model are assured by acquiring enough dataset needed for the training process on nonconformity image dataset. The larger the dataset is, the higher the model outperforms. A 665 pothole images each of which the resolution is 720 × 720 pixels were labelled and populated into a database administered by Kaggle [35]. The object classification was performed by an expert group by deciding if the pothole under study exists in the image and pinpointing its location within the corresponding image. All images in the database were iteratively and exhaustively underwent the object classification process. For sure, one or more objects could be delimited in the image.
The dataset consists of the images and their corresponding labels. The dataset was divided into training, validation, and testing subsets each of which ratio is 70%, 20%, and 10%, respectively. Typical pothole images in the testing subset are shown in Figure 4.

4. Methodology

The images in training subset were converted to a format size of 416 × 416 pixels to meet the input requirement for the chosen architecture. The images were reconstructed multiple times to improve the training performance of the model. The object detection model was trained using a desktop computer with access to the Google Colab virtual machine, which allows performing computations on the Tesla K80 GPU with 12 GB of memory.
Figure 5 shows the sequence of actions to perform tasks in order to detect potholes in the road surface. In the first step, a pothole dataset was collected from the previous research and the various YOLO models were reconstructed to be suitable for the tasks of pothole detection. Next, the models were trained and validated until the loss function reached a steady-state line, which the average loss insignificant changed. The quality of object detection, which requires to draw a bounding box around each detected object in the image, was confirmed by evaluating the performance of an object detector using three metrics (i.e., precision, recall, and mAP) as shown in Equations (1)–(3) [15].
precision = TP TP + FP
    recall = TP TP + FN
    mAP = 1 N i = 1 N AP i
As shown in Table 1, True Positive (TP) is the correct detection of an object that exists in the image; False Positive (FP) is incorrect object detection, i.e., the network marks an object that is not in the image; False Negative (FN) is an object that exists in the image but is not detected by the network; and True Negative (TN) is the correct detection of an object that do not exists in the image.
The precision is defined as the ratio of the number of true positives (TP) among those classified as positive (TP + FP), recall is the ratio of true positives (TP) out of those that are actually positive (TP + FN). Mathematically, the precision and recall parameters are two fractions having the same numerator and different denominators. Additionally, both the precision and recall are non-negative numbers and less than or equal to one. High precision means that the accuracy of the objects found is high. High recall means high True Positive Rate, which is the rate of missing positive objects is low.
The model is evaluated by changing a threshold and observing the values of precision and recall. For the precision and recall calculations, N thresholds are assumed and each threshold is a pair of precision (Pn) and recall (Rn) (n = 1, 2, …, N). Average precision (AP) is defined by Equation (4).
AP = n = 1 N ( R n   R n 1 )   P n
The mAP is set to 0.5 for comparing the performance of three models. The YOLOv4 and YOLOv4-tiny models are implemented using TensorFlow; the YOLOv5 model (YOLOv5s) using PyTorch. The maturity of model training was evaluated by stages while alternating between iterations and image resolution. The intersection over union (IoU), which measures the overlapping area between the predicted bounding box and the ground truth bounding box of an actual object, is compared to a threshold in order to classify if a detection is correct or incorrect. The threshold should be specified because the value of average precision (AP) metric depends on the threshold. The threshold is set to 0.3 in this study. Therefore, a detection box is considered as valid only when IoU is greater than or equal to 30%. It is well accepted that human bare eye may not distinguish predictions obtained given a threshold between 0.5 and 0.3 [12,13,14,15,16]. That is why it is justified to set the threshold to a value less than or equal to 0.3. Given a lower threshold than 0.3, the number of valid detections would be substantially increased, hence, avoiding false negatives in analyzing each image. The current state of the art involved in object detection do create thousands of “anchor boxes” or “prior boxes” for each predictor that represent the ideal location, shape and size of the object it specializes in predicting, calculate Intersection Over Union (IoU) denoting which object’s bounding box has the highest overlap divided by non-overlap for each anchor box, identify the anchor box that it detects the object that gave the highest IoU when the highest IoU is greater than 50%, tell the neural network that the true detection is ambiguous and not to learn from that example when the IoU is greater than 40%, and confirm that there is no object when the highest IoU is less than 40%. In this way, the current art works well in practice and the thousands of predictors do a very good job of deciding whether their type of object appears in an image. Using the default anchor box configuration can create predictors that are too specialized and objects that appear in the image may not achieve an IoU of 50% with any of the anchor boxes. In this case, the neural network will never know these objects existed and will never learn to predict them. The threshold should be specified because the value of average precision (AP) metric depends on the threshold. The threshold is set to 0.3 in this study. Therefore, a detection box is considered as valid only when IoU is greater than or equal to 30%.

5. Results

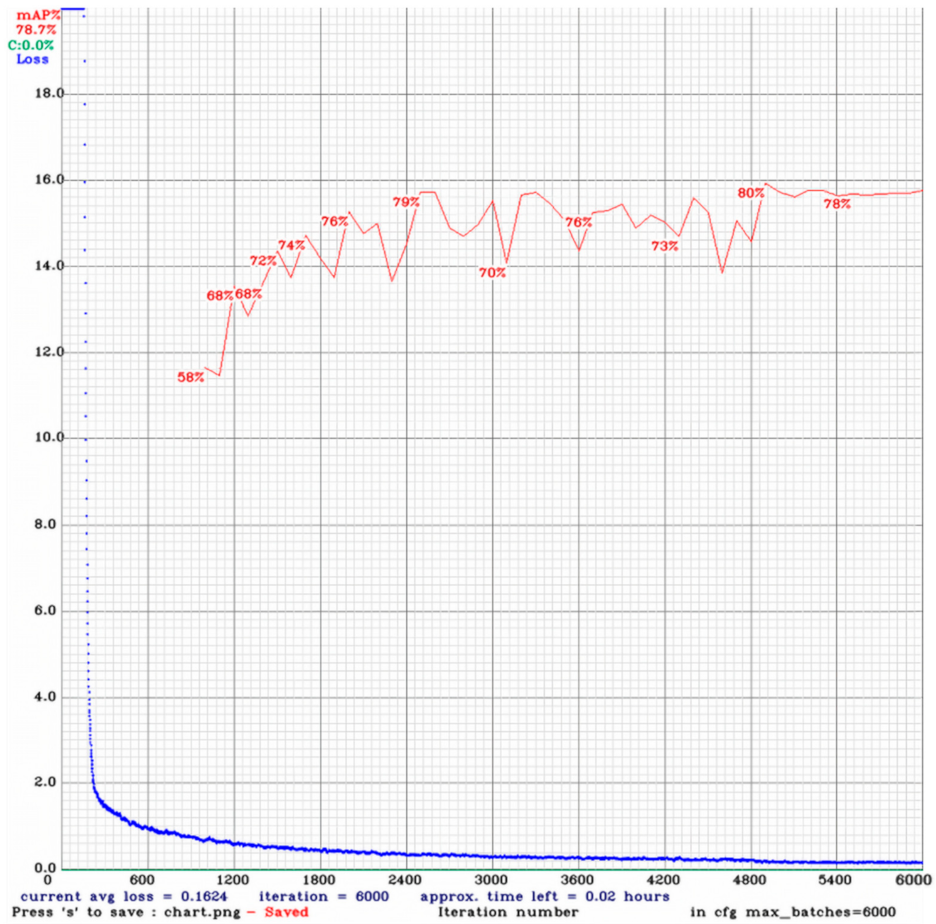
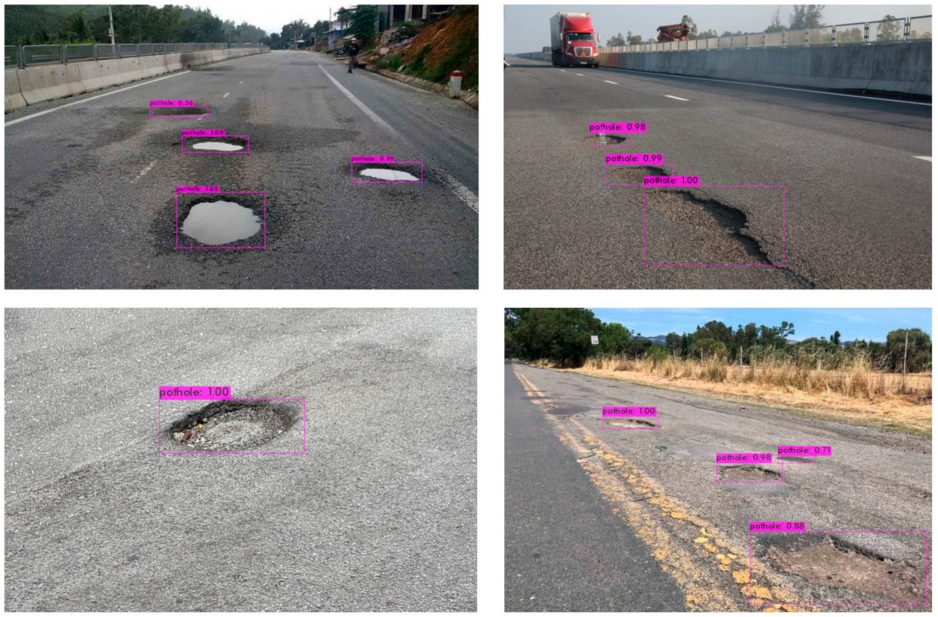
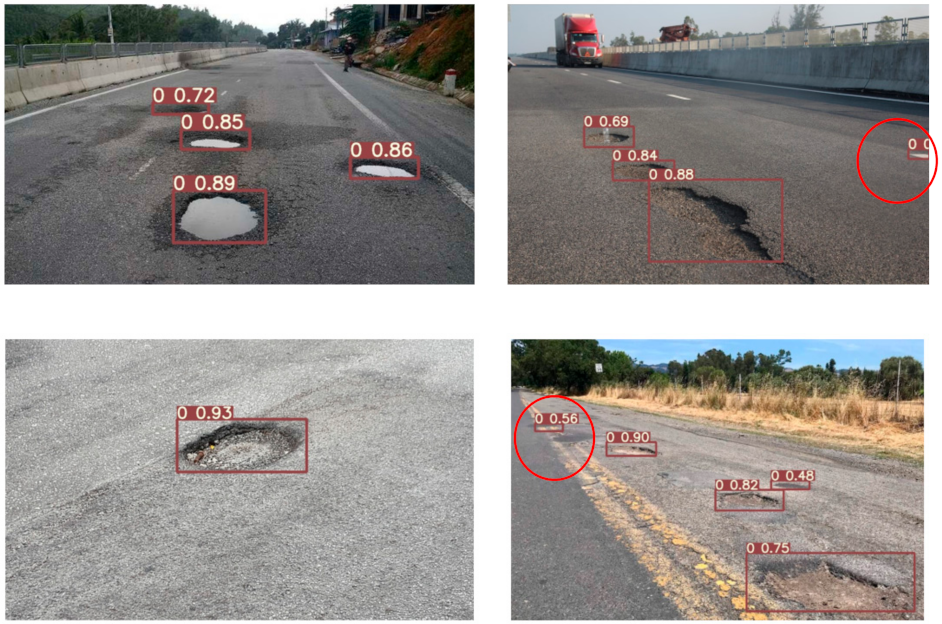
5.1. Performance Comparison between YOLOv4 and YOLOv4-Tiny

Pre-trained weight models and suitable filters of convolutional layers were used for YOLOv4 and YOLOv4-tiny in the training process. The weight parameters of models are stored after every thousand iterations. YOLOv4 and YOLOv4-tiny models have the same loss function divided into three parts: class loss, location loss, and confidence loss [16]. The loss and mAP_0.5 values obtained after each iteration are shown in Figure 6 and Figure 7, respectively. The training process of YOLOv4 runs 4000 epochs and takes more than seven hours for the dataset as shown in Figure 6. It appears that the training process is stable because an average success value of is 77.7% given a mAP_0.5. The training process of YOLOv4-tiny runs 6000 epochs and takes only about 1 h 7 min for the identical dataset as shown in Figure 7. For sure, the training process of YOLOv4-tiny model takes much shorter time than that taken by the YOLOv4 model. The training process of YOLOv4-tiny is more stable than that of YOLOv4 because then average success value is 78.7% which is slightly higher than that of the YOLOv4 model, given the identical mAP_0.5. Comparatively, a focal loss function addresses class imbalance while training for object detection. Focal loss applies a modulating term to the cross-entropy loss to focus learning on hard negative examples. It is a dynamically scaled cross entropy loss, where the scaling factor decays to zero as confidence in the correct class increases. Intuitively, this scaling factor can automatically down-weight the contribution of easy examples during training and rapidly focus the model on hard examples.
The performance of a predictor is computed by the loss function that classifies input data points in a dataset. The smaller the loss value is, the better the classifier models the relationship between the input data and the output target. The gradual decline of the loss value after each epoch shown in Figure 6 and Figure 7 represent the progressive learning process of YOLOv4 and that of YOLOv4-tiny, respectively. The curves obtained by the loss function of both YOLOv4 and YOLOv4-tiny arrive at quite stable after 3600 epochs. The curves confirm that the training process of the YOLOv4-tiny model is better and more stable than that of the YOLOv4 model.
The precision and recall values are shown in Table 2. It can be seen that the recall value of YOLOv4-tiny (74%) is slightly higher than that of YOLOv4 (73%). Both models are also the same precision value (84%).
A bounding box draws a boundary that makes crisp the spatial location of a predicted object. Each predicted object enclosed by a bounding box has five attributes (i.e., x, y, w, h, and confidence). The x and y are the center coordinate of the box relative to the cell’s box position. If the center is not within a cell, the cell is not responsible for it, hence, not representing it. Each cell has only one reference to the objects of which centers are within it. These coordinates are normalized to [0, 1]. The size of the box of which width and height are denoted to w and h, respectively, is also normalized to [0, 1] relative to the image size. The existence or non-existence of defect is rendered by the bounding box having a probability value denoting its confidence score ( C i j ) . The confidence score of the bounding box is shown in Equation (5). If the C i j values of bounding boxes are higher than its threshold, the bounding boxes is shown; else they will be disappeared.
C i j = P i , j * I o U p r e d t r u t h
where, C i j is the confidence score in the ith grid of the jth bounding box. P i , j is a function of the object. If the object is of the ith grid in the jth box, P i , j = 1 ; else P i , j = 0 . The I o U p r e d t r u t h represents the intersection over union between the ground truth box and the predicted box.
The detection outputs denoting the defects on the road surface obtained by the YOLOv4 model and those by the YOLOv4-tiny model are shown in Figure 8 and Figure 9, respectively. Indeed, YOLOv4-tiny model identifies defects on road surface more exhaustively without omission with a greater confidence value rather than YOLOv4 model does.

5.2. Performance of YOLOv5s

The training process of the YOLOv5s model took about 1 h 43 min to run 1200 epochs. The training result converged and stabilized after about 800 epochs, which were shown in the curves as given in Figure 10. Given the values of mAP_0.5, loss, precision, and recall were 0.748, 0.026, 0.82, and 0.68 at the 1200th epoch as shown in Figure 10a–d, respectively.
After the training process, YOLOv5s trains the model using the testing dataset images which were not employed during the training. Each pothole is highlighted using a bounding box having a label presenting the value of its corresponding confidence as shown in Figure 11. The YOLOv5s model identifies defects on road surface with confidence values ranging from 0.56 to 0.93. It is noted that this model gets the error detection of pothole in some cases as a red circle marked in the images.
Table 3 shows the mAP_0.5 value of YOLOv4, YOLOv4-tiny, and YOLOv5s. Given the parameter of mAP as 0.5, the mAP_0.5 values of YOLOv4, YOLOv4-tiny, and YOLOv5s are 77.7%, 78.7%, and 74.8%, respectively. It is confirmed that the YOLOv4-tiny model of which the mAP_0.5 value is the highest manifests the best performance, hence, being the best fittest for practical applications involved in pothole detection. Object detection algorithms sample many regions from the input image, determine if these regions contain objects of interest, and adjust the boundaries of the regions so as to predict the ground-truth bounding boxes of the objects accurately. Once the anchor shapes are determined, the sizes will be fixed during the training process. This might be sub-optimal since it disregards the augmented data distribution in training, the characteristics of the neural network structure and the task (loss function) itself. Improper design of the anchor shapes could lead to inferior performance in specific domains. In this study, the size of the box is fixed for all versions of YOLO to make controlled experiments.
However, all 3 models show low confidence values for small potholes located at long distances. In addition, under bad weather conditions, lack of light has not been studied. These are the limitations of this study and will need to be studied further.

6. Conclusions

In this study, the application of three YOLO models for detecting the pothole spots on images from road surfaces is investigated. Given the set of 665 images dataset used to train the models in this study, the research findings provide admissible evidence that the YOLOv4-tiny model achieves the purpose of the pothole detection application because it has the highest mean average precision of 78.7% compared to those of YOLOv4 (77.7%) and YOLOv5s (74.8%). It would be desirable to advance the model by further extending the network architecture of the backbone in-depth for higher accuracy in detecting potholes. In addition, the efficiency of the YOLO model runtime may be enhanced by automating the labeling strategy for potholes in a future study. This paper directly applies the YOLO series for pothole detection to mine new knowledge along with experimental analysis for comparison, hence, identifying the best model for the pothole detection issue. Indeed, the fittest model identified by this study may contribute to improve the prediction accuracy in future studies. In addition, small potholes located at long distances have low accuracy. Neither bad weather conditions nor lack of light has not been studied. These limitations may be covered by future study.

Author Contributions

Conceptualization, S.-S.P. and V.-T.T.; methodology, S.-S.P.; software, V.-T.T.; validation, S.-S.P., V.-T.T. and D.-E.L.; formal analysis, S.-S.P.; investigation, S.-S.P.; resources, S.-S.P.; data curation, S.-S.P.; writing—original draft preparation, V.-T.T.; writing—review and editing, D.-E.L.; visualization, V.-T.T.; supervision, S.-S.P.; project administration, D.-E.L.; funding acquisition, S.-S.P. All authors have read and agreed to the published version of the manuscript.

Funding

This work was supported by the National Research Foundation of Korea (NRF) grant funded by the Korea government (MSIT) (No. NRF-2018R1A5A1025137).

Institutional Review Board Statement

Not applicable.

Informed Consent Statement

Not applicable.

Data Availability Statement

Not applicable.

Conflicts of Interest

The authors declare no conflict of interest.

References

  1. Harvey, J.; Al-Qadi, I.L.; Ozer, H.; Flintsch, G. (Eds.) Pavement, Roadway, and Bridge Life Cycle Assessment 2020. In Proceedings of the International Symposium on Pavement. Roadway, and Bridge Life Cycle Assessment 2020, LCA 2020, Sacramento, CA, USA, 3–6 June 2020; CRC Press: Boca Raton, FL, USA, 2020. [Google Scholar]
  2. She, X.; Hongwei, Z.; Wang, Z.; Yan, J. Feasibility study of asphalt pavement pothole properties measurement using 3D line laser technology. Int. J. Transp. Sci. Technol. 2021, 10, 83–92. [Google Scholar] [CrossRef]
  3. Wang, H.W.; Chen, C.H.; Cheng, D.Y.; Lin, C.H.; Lo, C.C. A real-time pothole detection approach for intelligent transportation system. Math. Probl. Eng. 2015, 2015, 869627. [Google Scholar] [CrossRef] [Green Version]
  4. Li, W.; Shen, Z.; Li, P. Crack detection of track plate based on YOLO. In Proceedings of the 12th International Symposium on Computational Intelligence and Design (ISCID), Hangzhou, China, 14–15 December 2019; pp. 15–18. [Google Scholar]
  5. Cord, A.; Chambon, S. Automatic road defect detection by textural pattern recognition based on AdaBoost. Comput.-Aided Civ. Infrastruct. Eng. 2012, 27, 244–259. [Google Scholar] [CrossRef]
  6. Cha, Y.J.; Choi, W.; Suh, G.; Mahmoudkhani, S.; Büyüköztürk, O. Autonomous structural visual inspection using region-based deep learning for detecting multiple damage types. Comput.-Aided Civ. Infrastruct. Eng. 2018, 33, 731–747. [Google Scholar] [CrossRef]
  7. Jahanshahi, M.R.; Jazizadeh, F.; Masri, S.F.; Becerik-Gerber, B. Unsupervised approach for autonomous pavement-defect detection and quantification using an inexpensive depth sensor. J. Comput. Civ. Eng. 2013, 27, 743–754. [Google Scholar] [CrossRef]
  8. Luo, L.; Feng, M.Q.; Wu, J.; Leung, R.Y. Autonomous pothole detection using deep region-based convolutional neural network with cloud computing. Smart Struct. Syst. 2019, 24, 745–757. [Google Scholar]
  9. Silva, L.A.; Sanchez San Blas, H.; Peral García, D.; Sales Mendes, A.; Villarubia González, G. An architectural multi-agent system for a pavement monitoring system with pothole recognition in UAV images. Sensors 2020, 20, 6205. [Google Scholar] [CrossRef]
  10. Fernandez-Llorca, D.; Minguez, R.Q.; Alonso, I.P.; Lopez, C.F.; Daza, I.G.; Sotelo, M.Á.; Cordero, C.A. Assistive intelligent transportation systems: The need for user localization and anonymous disability identification. IEEE Intell. Transp. Syst. Mag. 2017, 9, 25–40. [Google Scholar] [CrossRef]
  11. Krizhevsky, A.; Sutskever, I.; Hinton, G.E. Imagenet classification with deep convolutional neural networks. Adv. Neural Inf. Process. Syst. 2012, 25, 1097–1105. [Google Scholar] [CrossRef]
  12. Redmon, J.; Farhadi, A. YOLO9000: Better, Faster, Stronger. In Proceedings of the IEEE Conference on Computer Vision and Pattern Recognition, Honolulu, HI, USA, 21–26 July 2017; pp. 7263–7271. [Google Scholar]
  13. Redmon, J.; Farhadi, A. Yolov3: An incremental improvement. arXiv 2018, arXiv:1804.02767. [Google Scholar]
  14. Bochkovskiy, A.; Wang, C.Y.; Liao HY, M. Yolov4: Optimal speed and accuracy of object detection. arXiv 2020, arXiv:2004.10934. [Google Scholar]
  15. Malta, A.; Mendes, M.; Farinha, T. Augmented Reality Maintenance Assistant Using YOLOv5. Appl. Sci. 2021, 11, 4758. [Google Scholar] [CrossRef]
  16. Jiang, Z.; Zhao, L.; Li, S.; Jia, Y. Real-time object detection method based on improved YOLOv4-tiny. arXiv 2020, arXiv:2011.04244. [Google Scholar]
  17. LeCun, Y.; Kavukcuoglu, K.; Farabet, C. Convolutional networks and applications in vision. In Proceedings of the 2010 IEEE International Symposium on Circuits and Systems, Paris, France, 30 May–2 June 2010; pp. 253–256. [Google Scholar]
  18. Ho, T.T.; Kim, T.; Kim, W.J.; Lee, C.H.; Chae, K.J.; Bak, S.H.; Choi, S. A 3D-CNN model with CT-based parametric response mapping for classifying COPD subjects. Sci. Rep. 2021, 11, 1–12. [Google Scholar] [CrossRef]
  19. Park, S.S.; Tran, V.T.; Doan, N.P.; Hwang, K.B. Evaluation of Damage Level for Ground Settlement Using the Convolutional Neural Network. In CIGOS 2021, Emerging Technologies and Applications for Green Infrastructure; Springer: Singapore, 2021; pp. 1261–1268. [Google Scholar]
  20. Ho, T.T.; Park, J.; Kim, T.; Park, B.; Lee, J.; Kim, J.Y.; Choi, S. Deep learning models for predicting severe progression in COVID-19-infected patients: Retrospective study. JMIR Med. Inform. 2021, 9, e24973. [Google Scholar] [CrossRef]
  21. Nguyen DL, H.; Do DT, T.; Lee, J.; Rabczuk, T.; Nguyen-Xuan, H. Forecasting damage mechanics by deep learning. CMC Comput. Mater. Contin. 2017, 61, 951–977. [Google Scholar]
  22. Do, D.T.; Lee, J.; Nguyen-Xuan, H. Fast evaluation of crack growth path using time series forecasting. Eng. Fract. Mech. 2019, 218, 106567. [Google Scholar] [CrossRef]
  23. Dinh, V.Q.; Munir, F.; Azam, S.; Yow, K.C.; Jeon, M. Transfer learning for vehicle detection using two cameras with different focal lengths. Inf. Sci. 2020, 514, 71–87. [Google Scholar] [CrossRef]
  24. Dinh, V.Q.; Nguyen, T.D.; Nguyen, P.H. Stereo Domain Translation for Denoising and Super-Resolution Using Correlation Loss. In Proceedings of the 7th NAFOSTED Conference on Information and Computer Science (NICS), Ho Chi Minh City, Vietnam, 26–27 November 2020; pp. 261–266. [Google Scholar]
  25. Girshick, R.; Donahue, J.; Darrell, T.; Malik, J. Rich feature hierarchies for accurate object detection and semantic segmentation. In Proceedings of the IEEE Conference on Computer Vision and Pattern Recognition, Columbus, OH, USA, 23–28 June 2014; pp. 580–587. [Google Scholar]
  26. Girshick, R. Fast r-cnn. In Proceedings of the IEEE International Conference on Computer Vision, Santiago, Chile, 7–13 December 2015; pp. 1440–1448. [Google Scholar]
  27. Ren, S.; He, K.; Girshick, R.; Sun, J. Faster r-cnn: Towards real-time object detection with region proposal networks. Adv. Neural Inf. Process. Syst. 2015, 28, 91–99. [Google Scholar] [CrossRef] [Green Version]
  28. He, K.; Gkioxari, G.; Dollár, P.; Girshick, R. Mask r-cnn. In Proceedings of the IEEE International Conference on Computer Vision, Venice, Italy, 22–29 October 2017; pp. 2961–2969. [Google Scholar]
  29. Cai, Z.; Vasconcelos, N. Cascade r-cnn: Delving into high quality object detection. In Proceedings of the IEEE Conference on Computer Vision and Pattern Recognition, Salt Lake City, UT, USA, 18–23 June 2018; pp. 6154–6162. [Google Scholar]
  30. Liu, W.; Anguelov, D.; Erhan, D.; Szegedy, C.; Reed, S.; Fu, C.Y.; Berg, A.C. Ssd: Single shot multibox detector. In Proceedings of the European Conference on Computer Vision, Amsterdam, The Netherlands, 11–14 October 2016; Springer: Cham, Switzerland, 2016; pp. 21–37. [Google Scholar]
  31. Redmon, J.; Divvala, S.; Girshick, R.; Farhadi, A. You only look once: Unified, real-time object detection. In Proceedings of the IEEE Conference on Computer Vision and Pattern Recognition, Amsterdam, The Netherlands, 11–14 October 2016; pp. 779–788. [Google Scholar]
  32. Lin, T.Y.; Dollár, P.; Girshick, R.; He, K.; Hariharan, B.; Belongie, S. Feature pyramid networks for object detection. In Proceedings of the IEEE Conference on Computer Vision and Pattern Recognition, Honolulu, HI, USA, 21–26 July 2017; pp. 2117–2125. [Google Scholar]
  33. Fang, W.; Wang, L.; Ren, P. Tinier-YOLO: A real-time object detection method for constrained environments. IEEE Access 2019, 8, 1935–1944. [Google Scholar] [CrossRef]
  34. Du, Y.; Pan, N.; Xu, Z.; Deng, F.; Shen, Y.; Kang, H. Pavement distress detection and classification based on YOLO network. Int. J. Pavement Eng. 2020, 22, 1659–1672. [Google Scholar] [CrossRef]
  35. Rahman, A.; Patel, S. Annotated Potholes Image Dataset. Kaggle. 2020. Available online: https://www.kaggle.com/chitholian/annotated-potholes-dataset (accessed on 21 November 2021).
Figure 1. Network architecture of YOLOv4.
Applsci 11 11229 g001
Figure 2. Network architecture of YOLOv4-tiny.
Applsci 11 11229 g002
Figure 3. Network architecture of YOLOv5.
Applsci 11 11229 g003
Figure 4. Typical pothole images on road surfaces of the testing subset.
Applsci 11 11229 g004
Figure 5. Flowchart of pothole detection using different YOLO architectures.
Applsci 11 11229 g005
Figure 6. Outputs obtained YOLOv4 running 4000 epochs using 720 × 720 images.
Applsci 11 11229 g006
Figure 7. Outputs obtained YOLOv4-tiny running 6000 epochs using 720 × 720 images.
Applsci 11 11229 g007
Figure 10. Performance and loss function of YOLOv5s.
Applsci 11 11229 g008
Figure 11. Detection results of YOLOv5s.
Applsci 11 11229 g009
Figure 8. Detection outputs obtained by YOLOv4 model.
Applsci 11 11229 g010
Figure 9. Detection outputs obtained by YOLOv4-tiny model.
Applsci 11 11229 g011
Table 1. Unnormalized confusion matrix.
PredictionPredicted as PositivePredicted as Negative
Actual
PositiveTrue Positive (TP)False Negative (FN)
NegativeFalse Positive (FP)True Negative (TN)
Table 2. Precision and recall values of YOLOv4 and YOLOv4-tiny models.
MetricPrecision (%)Recall (%)
Model
YOLOv48474
YOLOv4-tiny8473
Table 3. mAP comparison.
ModelmAP (%)
YOLOv477.7
YOLOv4-tiny78.7
YOLOv5s74.8
Publisher’s Note: MDPI stays neutral with regard to jurisdictional claims in published maps and institutional affiliations.

