Article

The Optimal Performance of the Energy Efficiency of a Pulse Dust Collection System towards Sustainability

1
College of Civil Engineering, Huaqiao University, Xiamen 361021, China
2
College of Engineering, National Yang Ming Chiao Tung University, Hsinchu 300093, Taiwan
3
Research and Development Department, O-SIP CO., LTD., Taoyuan 320056, Taiwan
*
Author to whom correspondence should be addressed.
Appl. Sci. 2021, 11(22), 10941; https://doi.org/10.3390/app112210941
Submission received: 25 October 2021 / Revised: 9 November 2021 / Accepted: 12 November 2021 / Published: 19 November 2021

Abstract

:
A growing number of manufacturers are realizing cost and environmental benefits through the sustainability of innovation and optimization processes. Based on polluting less and creating less, the study is pursuing sustainability on increasing operational efficiency by reducing costs and waste. Pulse dust collection systems are commonly used filtration equipment in industries and have lots of energy consumption due to running all day. This study is focused on the optimal parameters for energy saving and cost reduction, and the model is represented by the pressure drop of the filter and the residual powder. The characteristic values of the cleaning efficiency and the air permeability reduction are used for MATLAB to analyze the optimization state. This study found that the material of filter elements, the type of dust, the conditions of pulse-jet, and the filtering speed are the factors that affect the operational efficiency. In terms of cost, the pulse interval time in 10 s is the best parameter, and the pulse time does not affect the overall cost of the filter. Considering energy saving, 0.1 s of the pulse time is the best parameter. In addition, a lower dust concentration is a way to improve efficiency for increasing the filter life and reducing cost.

1. Introduction

The global issues of sustainable development and low-carbon life have gradually affected the production and service in industries’ processes in recent years, such as energy saving, green products, and circular economy. The problem of global warming has become more and more serious. In the past 100 years, the annual average temperature in Taiwan has risen by about 1.4 °C. Government agencies have also set reduction targets based on from the “business as usual” (BAU) of the United Nations Framework Convention on Climate Change. At present, many manufacturing industries respond to relevant low-carbon economy and green manufacturing policies to reduce the impact of manufacturing activities on the environment and ecology in terms of energy efficiency, reducing carbon emissions, and changing production methods. This is achieved through systematic organization, planning, control, implementation, and continuous improvement to propose energy-saving and carbon-reduction solutions, which can better achieve corporate competitiveness to keep the cost down and move towards the vision of sustainable manufacturing and corporate social responsibility of environmental friendliness. In traditional manufacturing and heavy industry, energy consumption can be divided into three categories. The first category is air conditioning systems, which include heat exchangers, cooling towers, air conditioning systems, freezing and refrigeration systems, and humidity control systems. The second category is equipment on processes, usually including power output systems and some high-power electrical systems. The third category is public facilities and also uses the least energy, including lighting systems, elevators, air compressor systems, etc. Therefore, it is necessary to investigate how the manufacturing industry can make the processes of energy saving and reducing carbon emissions better in the first and second categories, which will help reduce production costs and enhance corporate competitiveness.
This research is aimed at the development of energy conservation and industry sustainability and focuses on pulse dust collection systems in general production processes. The optimization design of energy conservation and cost reduction is the topic of this study. Pulse dust collection systems are mainly used to collect the dust from the turbid air, that is, the dust generated in the process is drawn off by the fan motor and collected on the surface of the filter. According to environmental protection laws, dust collection equipment needs to operate all day, which has become one of the main causes of energy consumption in the manufacturing process. According to the report on energy-saving and carbon-reduction services of manufacturing industries from the Ministry of Economic Affairs in Taiwan (2018) [1], energy saving in manufacturing can be divided into six parts, including power systems, lighting systems, air-conditioning systems, boiler systems, compressed air systems, and manufacturing process systems. Compressed air systems and manufacturing process systems account for the largest proportion of energy consumption, and the potential on energy saving is the highest. At present, benefits will be able to be produced in terms of energy saving through the simulation model to find suitable parameters of the dust collection system while operating all day long. Generally, energy saving cannot be achieved by the schedule management of production, manufacturing technology improvement, process reduction, etc.; however, the pulse interval time T w and pulse time T p can bring good energy-saving effects to the dust collector. The best parameter design and simulation of the dust system can bring benefits in industries towards sustainable development. Therefore, this research will first analyze the key factors of energy consumption of common dust collection systems, discuss the cost consumption and feasible energy-saving and carbon-reduction modes, and design the best operating parameters of pulse dust collectors through numerical simulation. In this study, the pulse-jet of the bag dust collection system is the main object, and the pressure drop of the temporary powder cake is used to consider the nonlinear problem of the porosity. Taking filter powder as the limiting condition of fly ash, this research will discuss the relationship between the characteristic values λ 1 (characteristic of cleaning efficiency) and λ 2 (characteristic of air permeability) from the mathematical model in the dust collector, T w and T p of the operating parameters. The simulation model is based on the filtration theory of stable flow field and the mathematical model of temporary powder cake [2,3]. With added energy and cost loss analysis, it uses numerical simulation on MATLAB to find out the optimal parameters for satisfying both energy saving and low cost.

2. Literature Review

2.1. Sustainable Development

Sustainable development is development that meets the needs of the present without compromising the ability of future generations to meet their own needs [4], and global sustainable development is still gradually increasing and spreading all over the world [5]. In addition, sustainability includes three dimensions, namely cultural sustainability, social sustainability, and economic sustainability [4,6]. In order to achieve sustainable development, environmental policies on pollution prevention have shifted from the end-of-pipe approach to front-end preventive control [7]. Manufacturing is the main component of the world’s resource consumption and waste generation. From 1971 to 2004, the energy consumption of the world’s manufacturing industry increased by 61% and accounted for nearly one-third of global energy use [8]. In contrast, the manufacturing industry has the potential to become a driving force for creating a sustainable society that can design and implement integrated sustainable practices and product and service development to help achieve better environmental performance [9]. Therefore, the concept of sustainable manufacturing came into being. By incorporating the spirit of sustainable development into products and services, the manufacturing and service industries can protect the environment and create their own profits while meeting customer needs and give back to society to achieve a sustainable enterprise with a long-lasting foundation [10,11]. Thus, sustainable manufacturing promotes minimizing or eliminating production and processing waste through eco-efficient practices, and encourages the adoption of new environmental technologies [11].
In order to realize sustainable manufacturing, there are more and more studies on sustainable green manufacturing. The topics include the rising cost of energy and resources, the risks of suppliers, consumer demand, policies and laws, reducing the influence on environmental impact, and so on [12]. For this reason, the important content of sustainable competitive advantage includes: (1) economic performance: cost reduction, market share growth, profit margin increase, avoiding unnecessary environmental penalties, etc.; (2) environmental performance (ecological performance): compliance with environmental regulations, controlling relevant pollution, recycling measures, etc.; and (3) social performance: social responsibility appraisal, corporate environmental image, customer satisfaction, customer and stakeholder attention, etc. [13]. Among them, environmental performance is positively helpful in improving economic performance. Improving environmental performance means having a better opportunity to enter certain specific markets, having the opportunity to differentiate products, and being able to promote pollution prevention technologies. In addition, improving the environment performance can reduce material costs, energy and service costs, and labor costs [14].
Industrial sustainability refers to the end state of a transformation process where industry is part of, and actively contributing to, a socially, environmentally, and economically sustainable planet. There is a three-stage change including efficiency, technology, and system changes in industrial sustainability [15]. About society’s consumption of natural resources and the impact of industrial activities, operation changes and equipment design for reduced energy consumption are discussed for process-related research, and new developments in process planning and production scheduling are highlighted that consider environmental performance [16,17]. Therefore, how to reduce the impact of the manufacturing process on the environment can be roughly divided into three categories: (1) Process improvement and optimization: the process is high-efficiency and low-cost and environmental issues are addressed. (2) New process development: new “green” processes are developed to replace traditional processes. (3) Process planning: integration factors of the environment are more towards sustainable manufacturing processes and inventory management [18]. This study focused on process improvement and optimization to achieve the goal of energy saving and cost reducing in pulse dust collection systems.

2.2. Pulse Dust Collection System

At present, there are four types of dust collectors such as cyclone, bag, electrostatic, and wet. Among them, the bag type dust collection system based on the cleaning method is divided into three types, which are oscillation type, backwash air type, and pulse-jet type. The pulse dust collection system is commonly used in industrial processes to collect dust. When the fan motor extracts the dust generated in the process, the dirty air will be filtered through the filter and be collected on the surface of the filter. Usually, the action of cleaning the filter element with reverse high-pressure air is used to control the cleaning time of the filter element. Therefore, the pressure drop P F i l t e r produced by the dust collection filter can be divided into three parts, as shown in Equation (1). The first is the pressure drop of the fresh filter as P f , which has not yet filtered the dust and can be described by Darcy’s law. The second is the pressure drop generated by the dust cake formed on the surface of the filter element during filtration, which is called the pressure drop of the temporary cake as P c . This part will change to follow the dust cake cleaned by pulse-jet air. The third is the pressure drop caused by the dust particles penetrating into the filter element and cannot be cleaned and eliminated by the pulse-jet air, which is called the pressure drop of the temporary powder cake as P r . This will gradually increase with the number of cleanings of the filter element.
P F i l t e r = P f + P c + P r
P f can be described in accordance with Darcy’s law (1856) to present the relationship between flow distance L 0 and the pressure P f in a fixed velocity V with a Reynolds number less than 2100, as shown in Equation (2), where μ is the viscosity of fluid, K F is the permeability of the filter, and L 0 is the thickness of the filter.
P f = 1 K F × μ L 0 V
In a stable flow with a Reynolds number less than 2100, the generation of temporary powder cake is the accumulation of powder on the surface of the filter element after a period of time. The mass will show a linear relationship with the pressure called the pressure drop of the temporary powder cake as P c . The Kozeny–Carman model was first applied to describe the pressure drop of a temporary powder cake and is represented as a series of parallel capillaries or channels [19]. The total volume of powder cake is equal to the void volume of the powder, and the surface area is equal to the surface area of the particles, as in Equation (3), where d s is the average diameter, κ K C is the constant, ε 0 is the porosity of the filter elements, and C K C is the Cunningham slip correction factor.
P c = 18 d s 2 × C K C × 2 κ K C 1 ε 0 ε 0 3 × μ L 0 V
In addition, the Happel cell model treats the powder cake as a collection of individual particles, and the porosity of the dust cake is equal to the ratio of the volume of the particles to the volume of the spherical shell [20]. Based on the above equations, the powder cake deposition thickness L 0   can be converted into the dust mass W accumulated per unit area, as described in Equation (4), where C is the dust concentration and ρ P is the dust density. P is composed of the resistance coefficient of powder cake as K 2 , mass of the powder cake as W , and the filtration speed V , as shown in Equation (5).
L 0 = C ρ P × V t d t = W ρ p
P c = K 2 × W × V
Based on the Kozeny–Carman model, it considers the polydispersity particles of the dust and uses standard deviation σ g , mean diameter d g , and dynamic shape factor κ to build a K 2   for the pressure drop of the temporary powder cake [2], as in Equation (6). The void function ν ε 0 must be tested for the porosity of the dust cake to obtain this function.
K 2 = 18 κ d g 2 e x p 4 l n 2 σ g ν ε o ε o 2 × μ ρ p
The dust inside the filter cannot be completely removed, which will block the filter and cause the pressure drop of the filter to increase [20,21,22,23]. This pressure drop is uniformly described by the pressure drop of the residual powder cake as P r , which will increase the number of pulse-jet cleanings [3,24,25,26] as in Equation (7), where S E   is the resistance coefficient of the residual powder cake and V is the filtration rate.
P r = S E × V

2.3. Operating Parameters of Dust Collector and Applications

The relevant papers on the optimized operating parameters of dust collectors mostly discussed the efficiency of pulse cleaning, which can make the filter element return to a better initial state after cleaning and achieve the purpose of energy saving. In addition, some studies explored the initial pressure of the storage tank, the average static pressure or maximum pressure of the pulsed air acting on the surface of the filter, the size of the nozzle, the distance between the nozzle and the filter, the filtration speed, and so on. By changing the operating parameters such as filtration speed, compressed air pressure, and nozzle diameter, it can evaluate the cleaning effect of the pulse-jet dust collection system, and the result showed that the value of the compressed air is the main factor that directly affects the pulse cleaning, and the pulse pressure on the filter bag will not always increase as the nozzle diameter increases [27]. Research has been conducted on the influence of the filter material or the shape of the folding filter on the cleaning efficiency. For example, the filter with surface treatment has better cleaning efficiency [28]. In addition, through various parameter experiments, such as the initial tension of the filter bag, filter speed, compressed air pressure, pulse time, and nozzle shape, it explored the changes in pressure and acceleration in the filter bag. It showed the greater the pressure and acceleration on the surface of the filter bag during pulse cleaning, the better the cleaning efficiency of the system, and it is proved that the pressure of compressed air and the shape of the nozzle are the main parameters that affect pulse cleaning [29]. Moreover, the study of the wrinkle ratio of the folding filter has an impact on the cleaning efficiency in the pulse dust collector system under different cleaning modes [30]. This involves analyzing the static pressure distribution on the surface to evaluate the cleaning effect of the filter. It showed that lower static pressure on the top of the filter will lead to poor cleaning efficiency. Secondly, the higher wrinkle ratio of the folding filters is prone to incomplete cleaning [31]. In addition, the amount of residual dust is used to evaluate the cleaning effect of the system. It tested the filtration speed, peak pressure of pulse, filter size, and the other parameters and showed that peak pressure is an important factor to lead the cleaning effect of the system. The cleaning resistance caused by the filtering speed does not affect the cleaning efficiency under pressure, but the higher the filtering speed becomes, the greater the cleaning resistance when peak pressure is insufficient. This is caused by the amount of residual dust increasing, and the cleaning efficiency is not good [32]. In addition, the type of filter dust will also significantly affect the cleaning efficiency of the dust collection system [3]. Summing up the above, the influence of the pulse interval time T w , pulse time T p , and dust concentration in the process on the dust collector has not yet been discussed.

3. Optimal Design of Pulse Dust Collection System
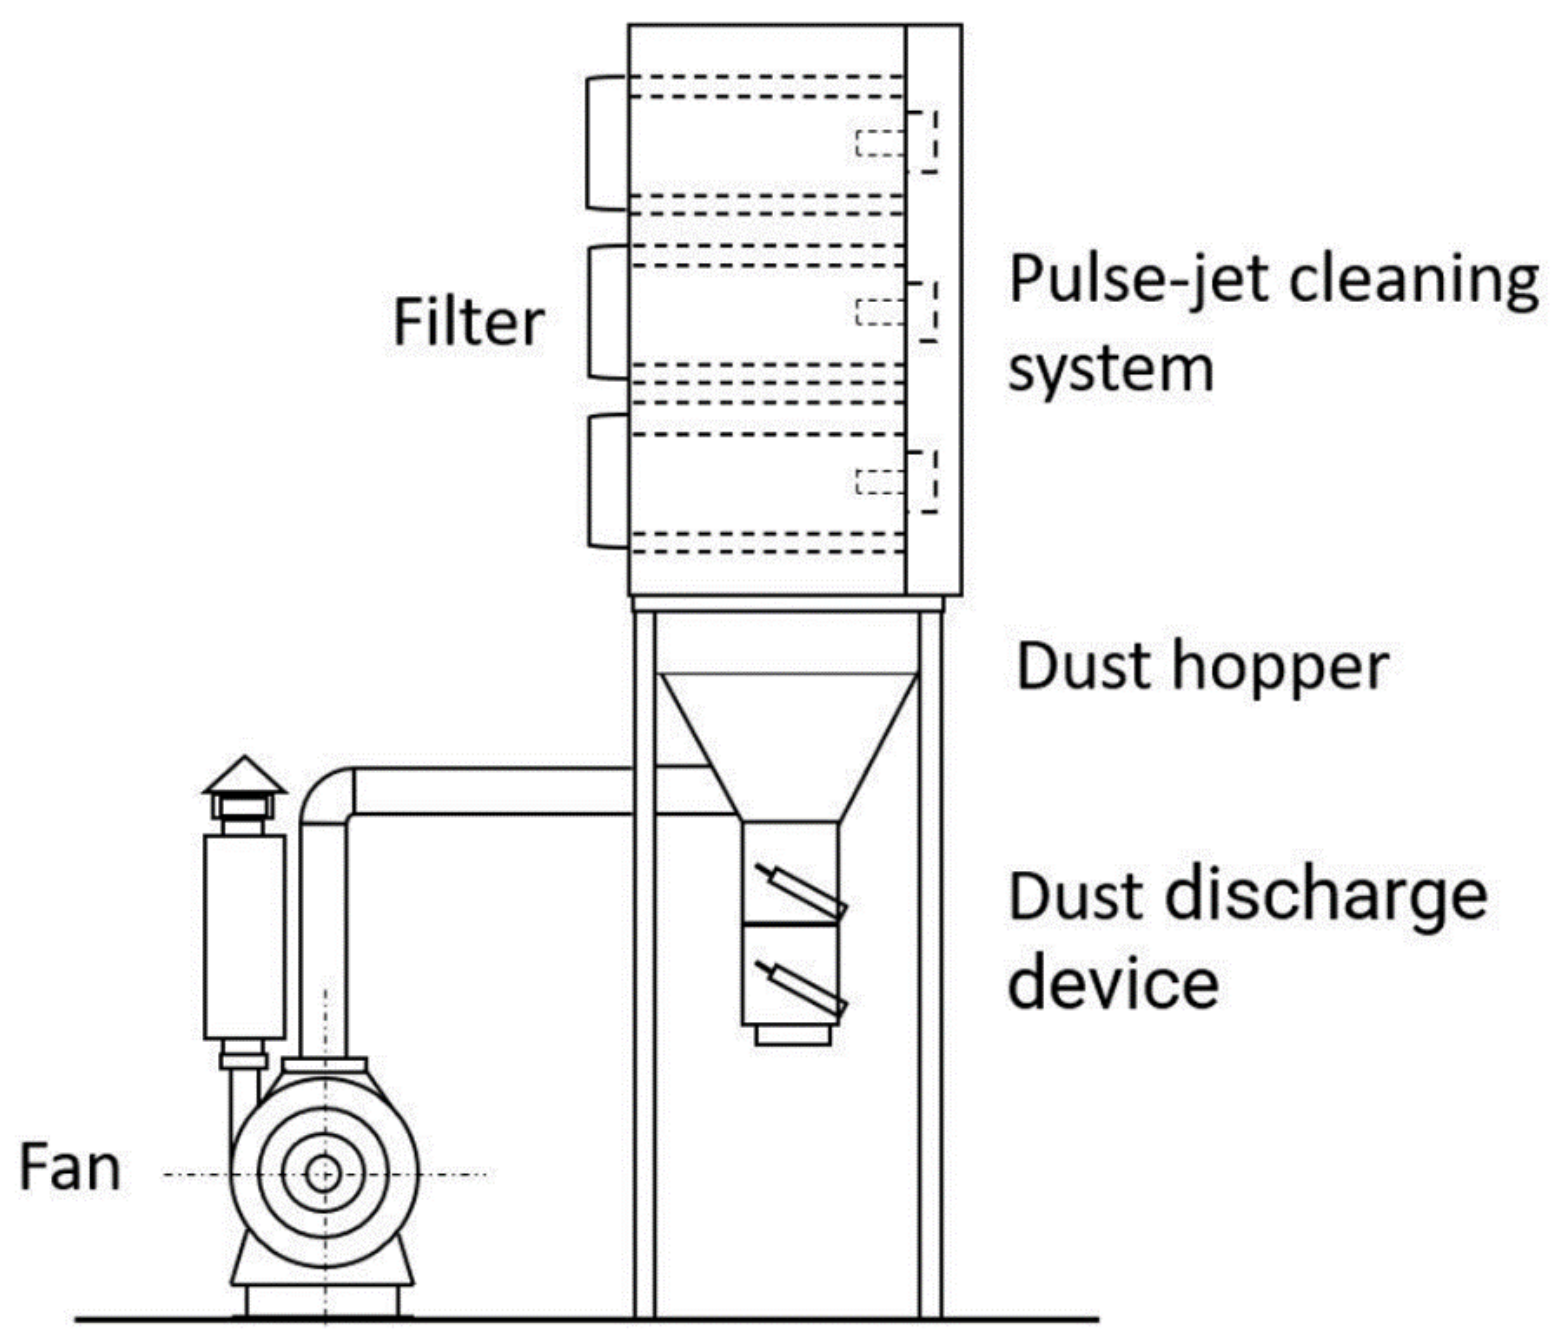
3.1. Concept Design

The pulse dust collection system used is composed of four parts in this research, as shown in Figure 1. The first part is a blower motor with a rotation speed of 3500   RPM , which is provided to the dust collector to generate a static pressure of about 1900   mmAq and a flow rate of Q = 78   CMM to extract the dust in the system. The second part is the filter, which is composed of N = 9 filter groups, and each group is composed of two filters in series. The size of a filter element with fold type is outer diameter D i = 9.5 , inner diameter D i = 9.5 , length L = 26 , and fold number N f o l d = 152 , and the theoretical filter area is A t = 110 10.219   m 2 , as shown in Figure 1. The filter is made of polyester fiber spunbond as the base material, and its fiber diameter is about 15 ~ 21   μ m . A layer of PTFE film, of which the diameter is 1 ~ 0.2   μ m and the thickness is about 0.1   mm , is plated on the outer layer of the spunbond. The fiber diameter of the material is about 1~0.2 μm and the thickness is about 0.1 mm. The air permeability of the filter is k f = 200   m 3 / m 2 · Pa · h . When the filter is aging, the dust will block it and cause the pressure drop to rise. When the static pressure difference between the inner and outer sides of the filter reaches 150   mmAq , the set of filters needs to be replaced. The third part is the pulse-jet cleaning system. When the outside of the filter is blocked by dust, the pulse timing controller of the backwashing unit will release pulse-jet air from the corresponding diaphragm valve to shake off the dust and discharge it into the funnel. The compressed air used in this study is P c l e a r = 6.5 7   kg / c m 2 , flow Q c l e a r = 30   L / min , and the pulse timing controller provides a set of operating parameters such as pulse interval time ( T w ) and pulse time ( T p ). At each setting time, one filter element of the dust collector is always being cleaned, and the other filters maintain normal filtration operations. The orders of cleaning are top to bottom and left to right, as shown in Figure 2. In this study, the adjustable range of pulse interval time is T w = 5 ~ 30 s, and pulse time is T p = 0.1 ~ 0.3 s. The fourth part is a dust collection and a dust discharge. The dust collection is a funnel-shaped dust storage device. It is usually designed with a slope of 60 ° in the inside of the funnel, so that dust can fall freely to the bottom of the funnel from above. There is an ash discharge valve at the bottom of the funnel to isolate the atmosphere to maintain the static pressure of the system and to prevent the discharged dust from being sucked into the funnel again. The ash discharge action in this is that when the filter is backwashed for two rounds, the upper ash discharge valve opens and closes once to leak the dust to the temporary storage area. About 10 s later, the lower ash discharge leaks the dust to the storage bucket.

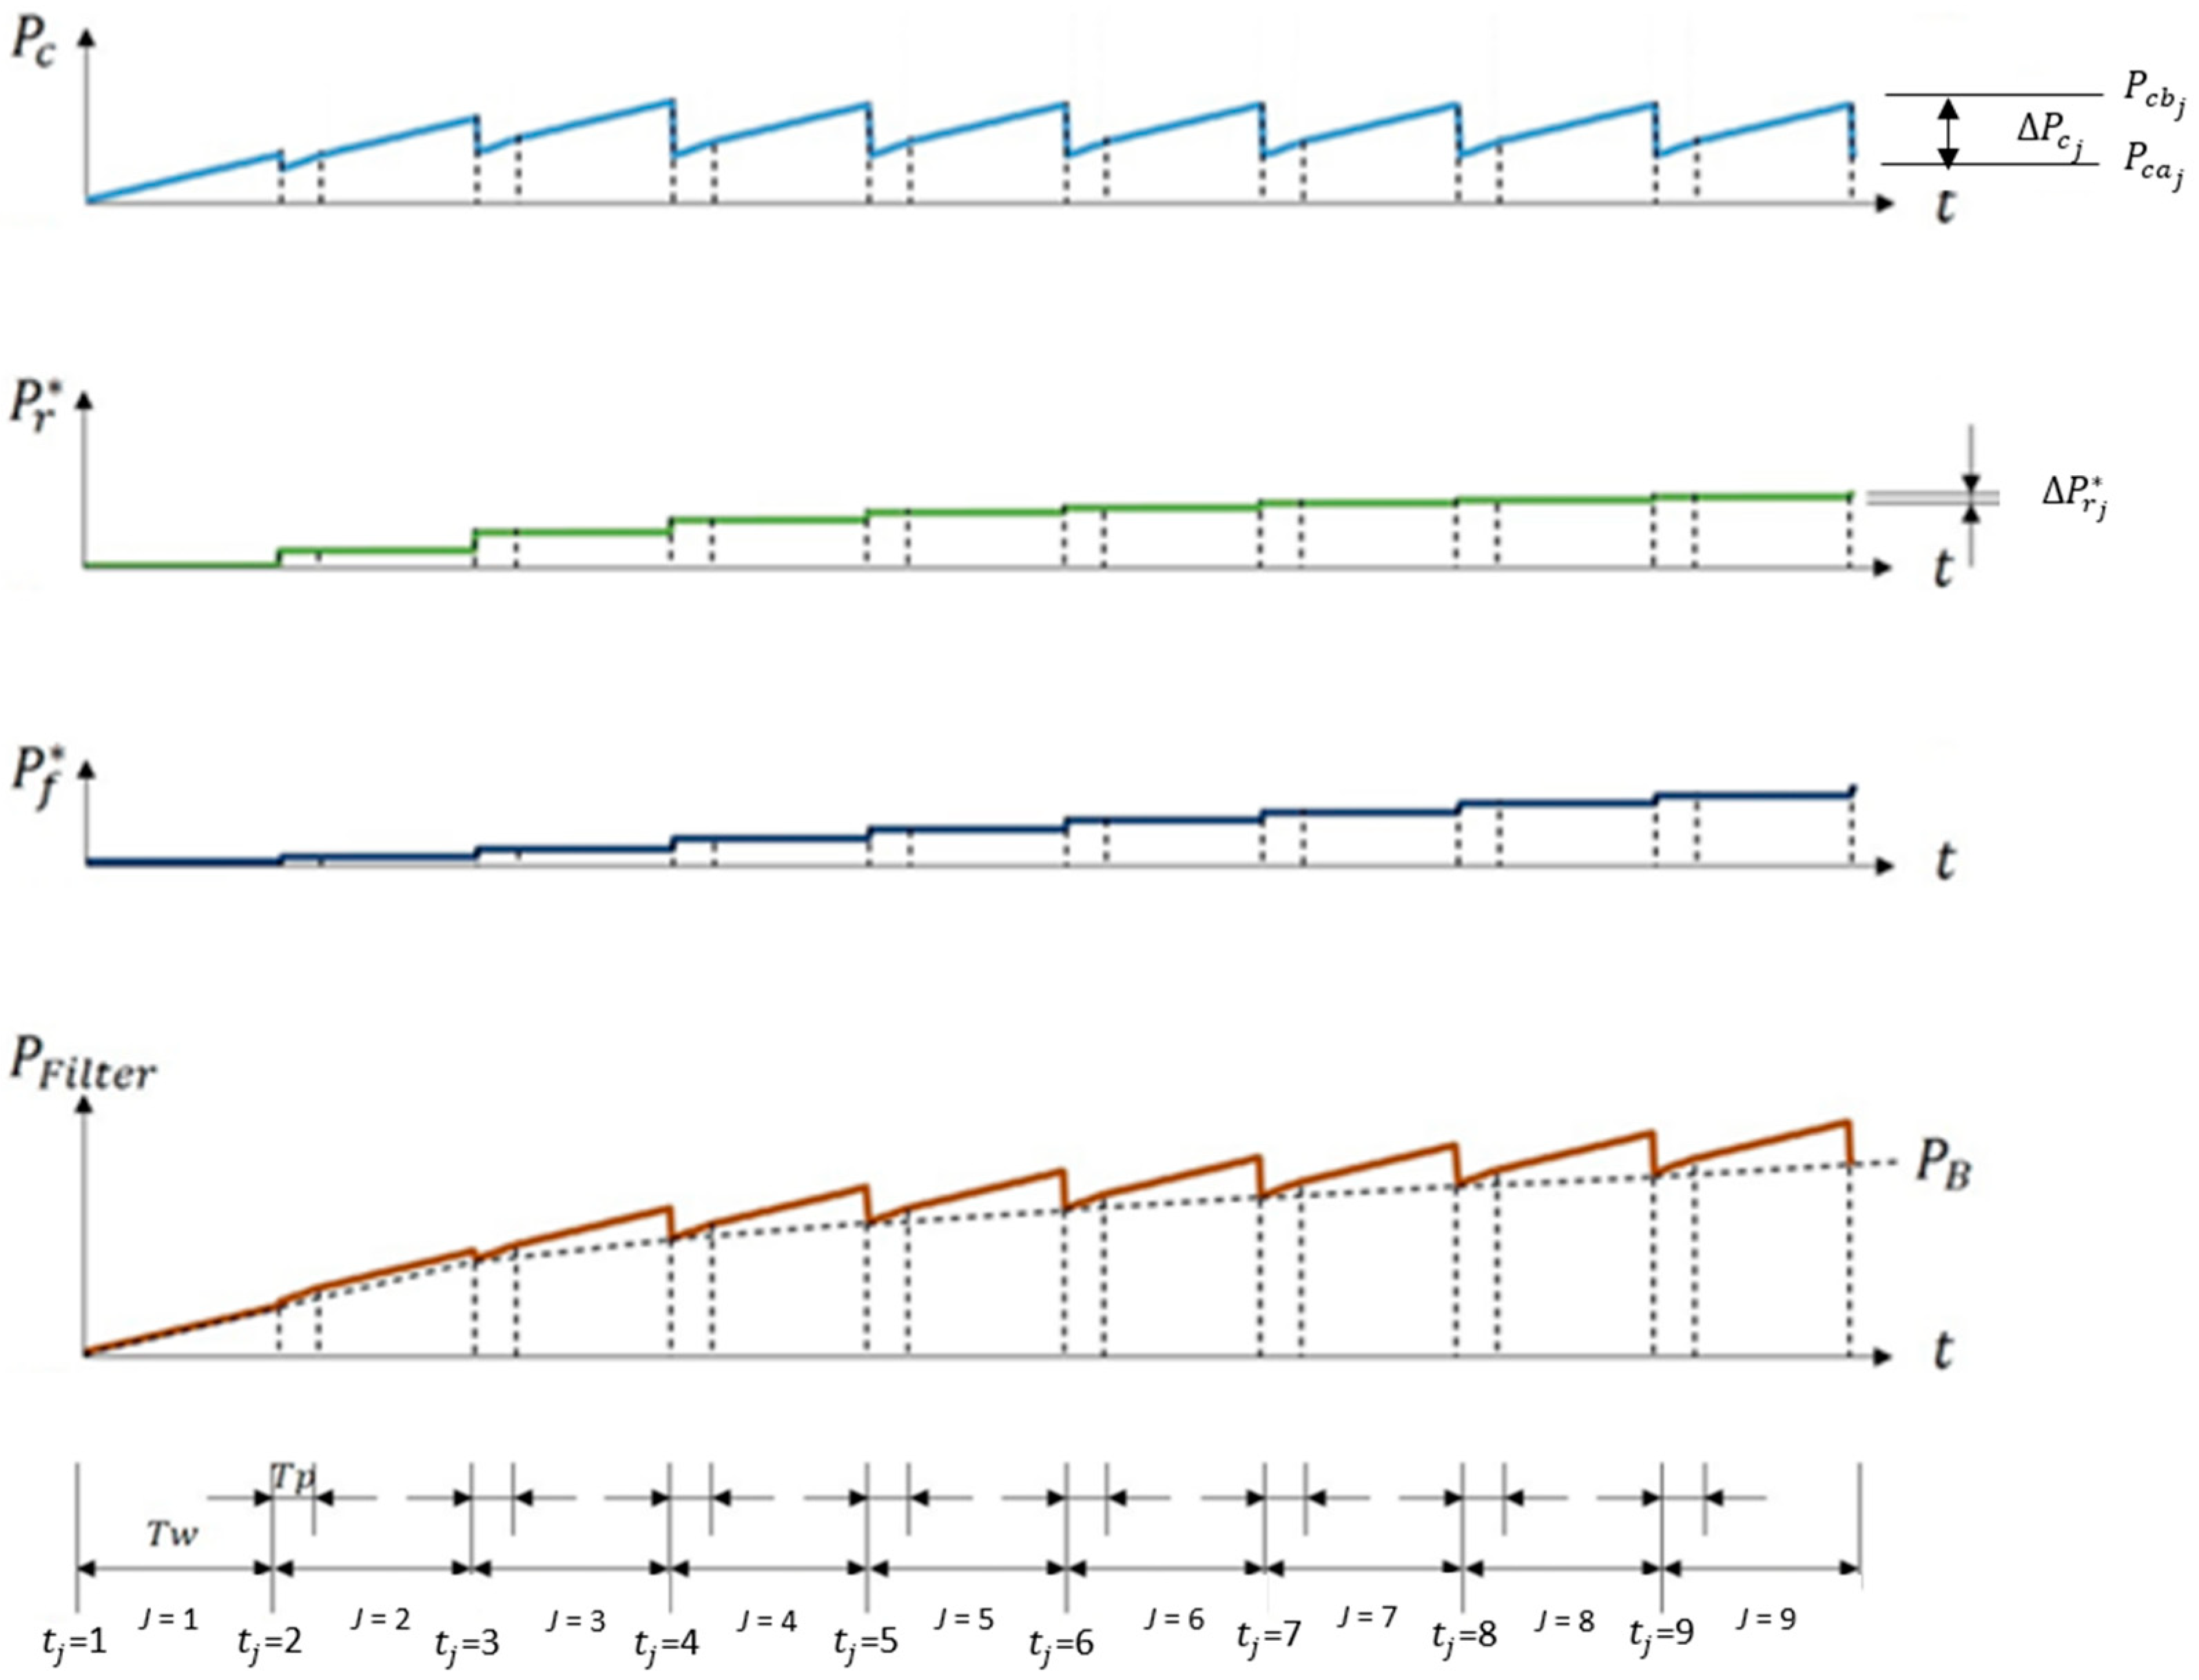
3.2. Working Principles of Pulse Dust Collector with Multiple Filter Groups

In order to fully describe the changes in pressure drop in the three stages of filter instability, filter stability, and filter aging during filtration, this study proposes a new model that is different from other studies. The dust collector is a structure of multiple filter groups (composed of N = 9 filter groups), and each group is composed of two filters in series. The effective filtering area of each filter group is A g = 2 × A e = 5.934   m 2 and the total effective filtering area is A = N × A g = 53.406   m 2 [33]. Therefore, the parameters of the analysis model include filtering speed, the pressure drop of the temporary powder cake, the pressure drop of the residual powder cake, the pressure drop of the filter, and the total pressure drop of the filter, as shown in Figure 3.
(1)
Filtration speed
We divide the state of the filter into a filtering and a cleaning period. During the filtering period, the flow V f according to the flow, speed, and area can be calculated as shown in Equation (8), where N is the number of filter groups, A g   is the filter area of each filter group, and Q is the gas flow of the filter [34].
V f = Q N × A g , t 0 , T w t j + T p ,   t j + T w , j 2
(2)
The pressure drop of the temporary powder cake
According to Darcy’s law, the overall pressure drop of the temporary powder cake is shown in Equation (9), where W is dust cake mass, V is filtration speed, and K 2 is the resistance coefficient of the temporary powder cake. Because the dust used in the simulation test is granular coal ash powder, we use the equation proposed by Endo, Y. et al. [2] to describe the resistance coefficient K 2 of the temporary powder cake, as shown in Equation (10), where κ is the dynamic shape factor, d g is the average diameter, σ g is the standard deviation, ρ p is the dust density, μ is the air viscosity, and ν ε o is the void function, which depends on the porosity ν ε o of the total dust cake.
P c = K 2 × W × V
K 2 = 18 κ d g 2 e x p 4 l n 2 σ g ν ε o ε o 2 × μ ρ p
(3)
The pressure drop of the residual powder cake
After pulse cleaning, there will be a certain percentage mass of the residual powder cake as Δ W r j , and this will form the pressure drop of the residual powder cake as Δ P r j * , with gradual accumulation and U for unit step functions, as shown in Equation (11). When the pressure drop of the residual powder cake P r j * is greater, the cleaning efficiency η j *   of the filter will also be greater, as shown in Equation (12). λ 1 is the characteristic value of cleaning efficiency, and P r j 1 * is the pressure drop of the residual powder cake in the previous filtration cycle.
P r j = m * = j = 2 m Δ P r j * U t t j ,   m , 2 ,
η j * = 1 e λ 1 × P r j 1 *
(4)
The pressure drop of the filter
The pressure drop of the filter is caused by the residual powder cake blocking the filter element, and the result is a decrease in the air permeability of the filter element. According to Darcy’s law, the filter pressure drop P f * can be expressed as Equation (13), where K 1 * is the resistance coefficient of the filter, k f is the air permeability of the filter, and λ 2 is the characteristic value with the air permeability of the filter due to dust blockage.
P f * = K 1 * × V
where
K 1 * = 1 k f × e λ 2 × P r j *
(5)
Total pressure drop of the filter
After the filter is cleaned, the total pressure drop P F i l t e r is the sum of the pressure drop of the filter P f * , the pressure drop of the residual powder cake P r j * , and the pressure drop of the temporary powder cake P c , as shown in Equation (14). Generally, more filter groups and a lower dust concentration have some unobvious changes in pressure drop before and after cleaning on the temporary powder [33]. Therefore, we use the baseline of the pressure drop P B   as the sum of the pressure drop of the temporary powder P c a j , P r j *   after cleaning, and P f * , as in Equation (15).
P F i l t e r = P f * + P r j * + P c
P B = P f * + P r j * + P c a j
To further confirm the availability on the model with P r j * , this study used the data to verify it in two experimental modes [35], namely Group1 and Group3. Group1 is an operation mode that cleans three filters at the same time when the pulse interval time T w is 9 min. Group3 is to clean only one of the three filters in order when T w is 3 min. The filtration speed of the filter in the system is maintained at V = 0.02   m / s . The dust used for filtration is fly ash with   d g = 3.45   μ m , and the dust concentration C = 366   g / m 3 . It selected λ 1 = 0.0035 , λ 2 < 0.001 in the simulation of Group3, and λ 1 = 0.006 , λ 2 < 0.001 for Group1.
The results of P B simulation can be seen in Figure 4. Whether it is the unstable filtration state 10 days ago or the stable state 10 days later, the result in this experiment is very similar to the data [35]. This means that the P r j * model is available and can be represented by the change in the pressure drop on P B with stable and unstable filtration. The simulation results on the pressure drop of the temporary powder cake are shown in Figure 5 and Figure 6. The pressure drop of the temporary powder cake caused by the compression of the dust cake will have a non-linear change, which is consistent with the data [1], and have some error with the data [35]. This is the model of porosity ε 0   in different temporary powder cakes to produce errors with the resistance coefficient K 2 of the powder cake [1,36]. Through verification, the filtration model proposed in this study can describe the change in the pressure drop during filtration, which will serve as the basis of the analysis of the overall energy saving and cost reduction for the dust collector.

3.3. Optimized Analysis on Energy Saving and Cost Reduction

In order to understand the overall energy consumption of the dust collector, the first step is to determine the pressure drop with the suction as P T o t a l from the energy consumption of the motor of the dust collector W m o t o r that is generated by the pressure drop loss of the pipeline and the equipment as   P P i p e ,   P E q u i p , and P F i l t e r . This can be expressed as Equation (16), where fan efficiency value η F a n is 0.6~0.65, Q is the flow rate of the filter, and P T o t a l is the sum of   P P i p e ,   P E q u i p , and P F i l t e r . At each T w , the pulse-jet cleaning provides compressed air T p as P c l e a r , flow rate as Q c l e a r , and sequentially cleans the set of filter groups. The operation will take some energy consumption as W c l e a r , shown in Equation (17).
W m o t o r = 1 η F a n × 0 t P T o t a l × Q   d t  
W c l e a r = P c l e a r × Q c l e a r × T p T w × 0 t d t
In addition to the cost of components and maintenance, the largest cost of the dust collector is electricity cost and filter materials. One must first determine the cost of the filter as C F and the time for the filter to age as t l i f e , then the loss cost of the filter per month is C F / m , as shown in Equation (18). Additionally, per kilowatt-hour of the electricity cost is C E , and then the monthly electricity cost from the energy consumption of the motor and pulse-jet cleaning is C E / m , as shown in Equation (19). Therefore, the overall monthly cost of the dust collector system is C T o t a l , which is the sum of the costs of the filter, the motor, and the pulse-jet cleaning, as shown in Equation (20).
C F / m = C F t l i f e
C E / m = W m o t o r + W c l e a r × C E t l i f e
C T o t a l = C E / m + C F / m

4. Results of Simulation

4.1. Building the Parameters of Simulation

The dust used is fly ash, and its parameters are d g = 3.7   μ m , ρ p = 2.20 g c m 2 ,   σ g = 1.5 , κ = 1.37 . In the flow field with filtration rate V f = 0.0243   m / s and V f = 0.0274   m / s , the Reynolds number is less than 2100, which is a steady laminar flow. The characteristic value λ 1 is related to the structure of the filter material, dust material, particle size, filtration speed, backwash compressed air pressure, nozzle size, and distance, and λ 2   is only related to the structure of the filter material and dust material and particle size. The setting of λ 1 and λ 2 is according to the actual pressure drop used by the dust collector, of which the parameters are T w = 10   s , T p = 0.1   s , and C = 2.0 × 10 3   kg / m 3   with the service life of the filter for 1–2 years, as shown in Figure 7. The actual performance of the pressure drop can be divided into unstable zone ( 0 ~ 50   mmAq ), stable zone (5 0 ~ 100   mmAq ), and aging zone ( 100 ~ 150   mmAq ). The unstable zone appears to rise rapidly because of a large amount of residual dust staying in the fibrous gaps of the filter, and the cleaning efficiency η * increases rapidly at this time. When it goes to stable zone, the baseline of the pressure drop P B will show a linear and slow increase. Because a certain amount of residual dust has been blocked in the filter, the subsequent dust will not easily enter the fiber gaps in the filter. This means η * and P r * will slowly increase. Thus, 100 ~ 150   mmAq is the aging of the filter, and at this time η * is close to 100%. Therefore, this study selected a set of characteristic values to approximate the actual production for the pressure drop ( λ 1 = 0.007, λ 2   = 0.011).
Regarding the setting of parameters during operation and production, we adopted the adhesion force between the dust and the filter and the separation force generated by the pulsed air to illustrate the effect of filter cleaning. Due to the dust concentration C , the pulse interval time T w , and the pulse time T p not affecting the adhesion and separation force, they will not affect the selection of λ 1 [37]. In addition, λ 2 will be affected by the structure and material of the filter, and the material and size of the dust, but not C , T w , and T p . Therefore, this research focuses on the analysis of energy saving and cost reduction towards sustainability development, and takes C , T w , and T p as the main variables of the simulation test. It also puts P E q u i p = 1500   mmAq , P P i p e = 250   mmAq for fixed constants, and the filter needs to be replaced when P F i l t e r   reaches 150   mmAq . Based on the actual cost, a single filter is T W D   5500 ,   the replacement cost of the filter is   C F = T W D   99,000 . and the per kWh of electricity is C E = T W D   3.27 .

4.2. Simulation Test of Optimal Parameters

Under the conditions of λ 1 = 0.007   and   λ 2 = 0.011 , the simulation test of C , T w , and T p is carried out to find the optimal parameters for the lowest energy consumption and the lowest cost. The test results are described below.

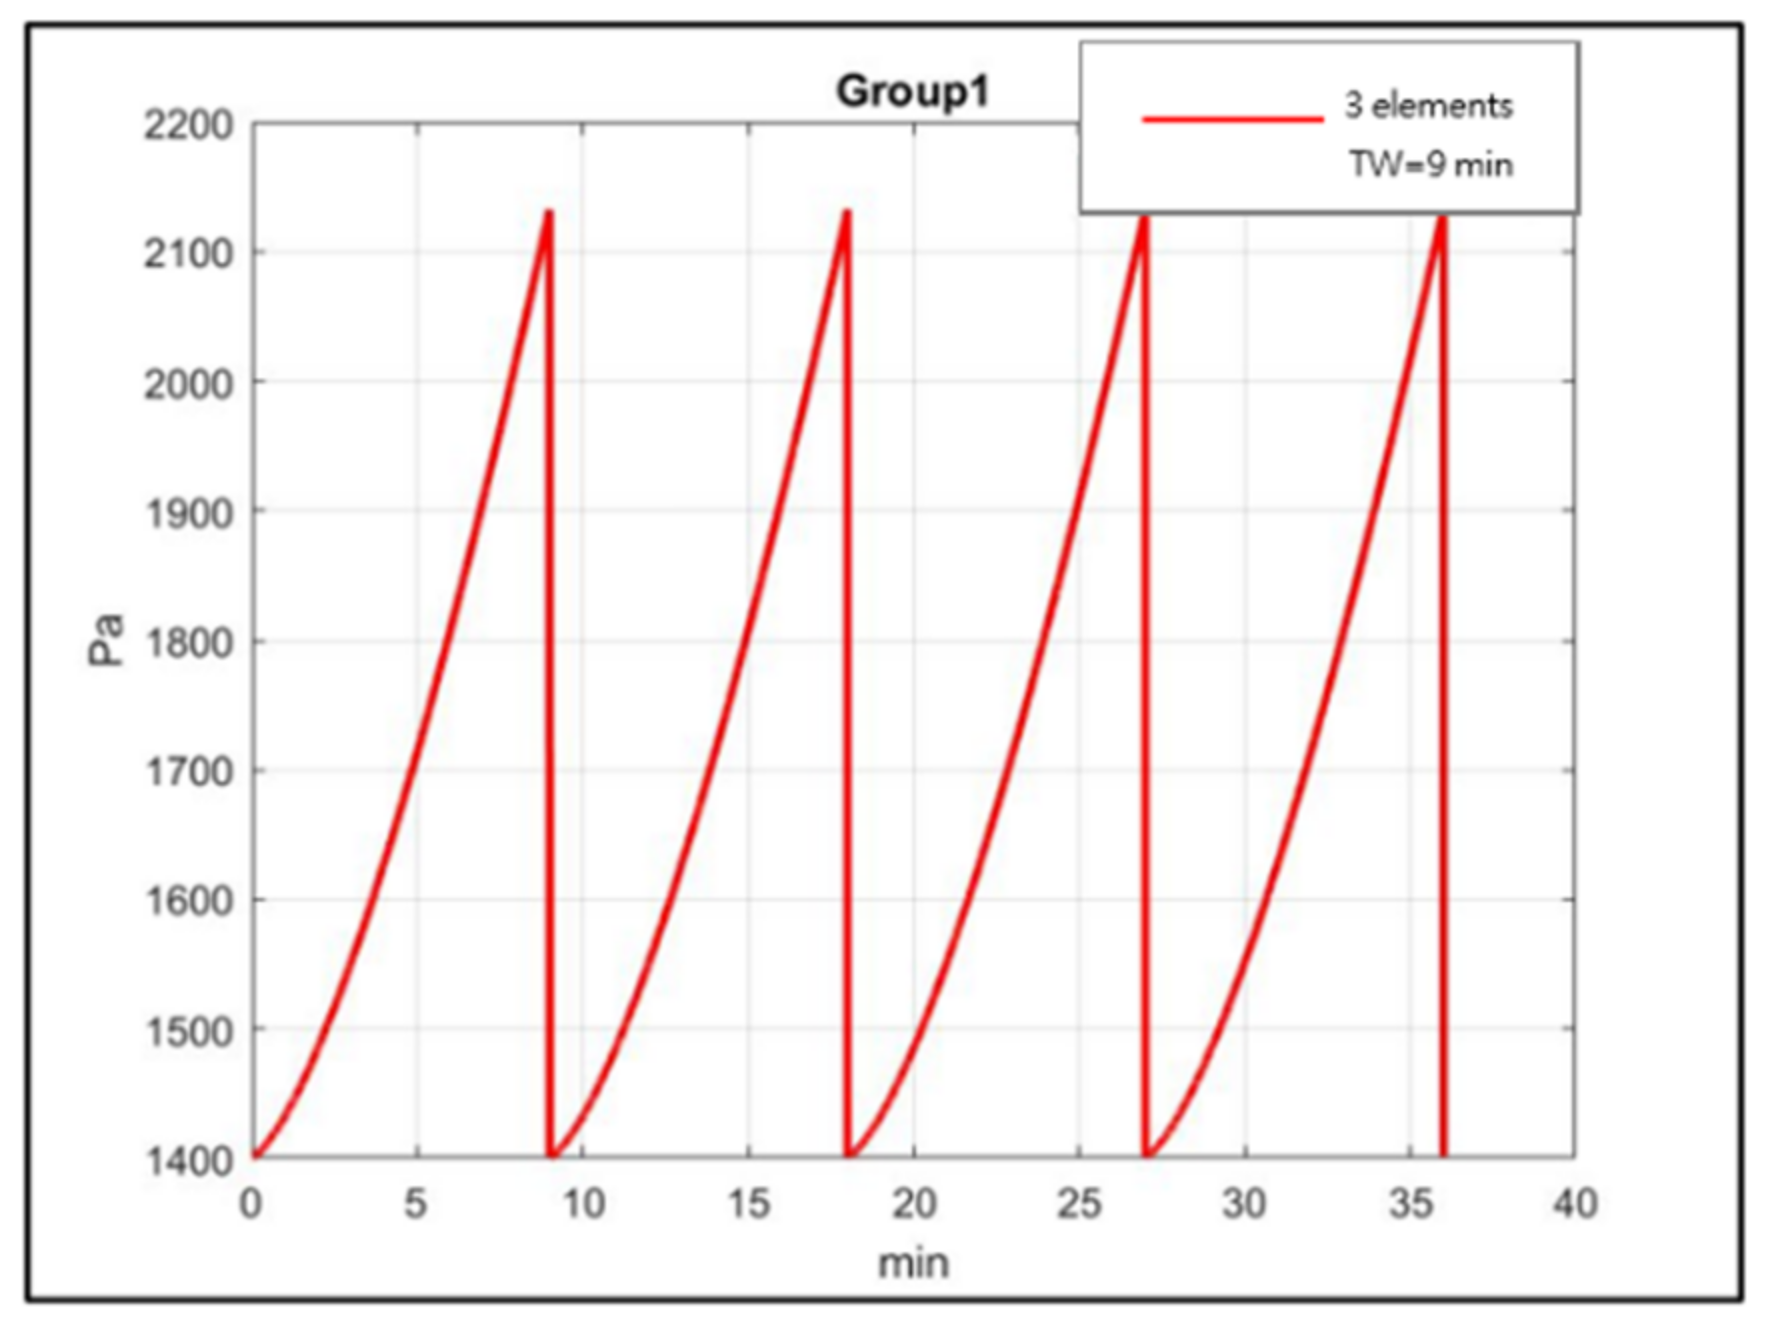
4.2.1. Simulation of Energy Consumption on Different Pulse Interval Times

This test is to evaluate the energy consumption generated by different pulse interval times T w under the constant of dust concentration C and pulse time T p , where setting   C = 2.0 × 10 3   kg / m 3 , T w = 5 ~ 30   s , T p = 0.1   s . When T w = 5 s -747 days (the filter has a service life of 747 T w days), it obtains T w = 10 s -559 days, T w = 15 s -474 days, T w = 20 s -422 days, T w = 25 s -386 days, and T w = 30 s -359 days, as shown in Figure 8a. According to the results, it is found that Tw is getting longer, and the service life of the filter will be shorter with the pressure drop to 150   mmAq . In the analysis of energy consumption, as shown in Figure 8b, we can observe that a different T w has little effect on the monthly energy consumption of the fan motor. Conversely, a decrease in the T w   causes an increase in the number of cleanings, which will significantly increase the energy consumption of the compressed air for backwashing. In the analysis of cost, as shown in Figure 8c, we can observe that a different T w has little effect on the electricity cost of the fan motor and the high-pressure backwash air due to the change from the fan motor mainly manifested by P E q u i p and P P i p e . Based on the results, the parameter of T w will not be considered on energy saving but for cost, and T w = 5 s is the best parameter setting for the simulation. However, considering that Tw is too short, it will cause frictional damage when the pressure drop is not to 150 mmAq. Therefore, according to this, the study recommended that the parameter T w = 10 s may be a better choice based on the actual use conditions to reduce the cost of cleaning by half.

4.2.2. Simulation of Energy Consumption on Different Pulse Times

This test is to evaluate the energy consumption generated by different pulse times T p under the constant of C and T w , where setting C = 2.0 × 10 3   kg / m 3 , T w = 10 s , T p = 0.1 ~ 0.3   s . The result can be observed that the filter has a service life of 559 days as T p = 0.1   s , and different T p values do not affect the service life of the filter until pressure drops to 150   mmAq , as shown as Figure 9a. On the other hand, this shows that different T p values have little effect on the energy consumption of the fan motor, as shown in Figure 9b, but increasing T p will increase the amount of energy consumption in monthly backwash compressed air. In the analysis of cost, this study found that a different T p has little effect on the electricity cost from the fan motor and pulse-jet cleaning, as shown in Figure 9c. It also does not affect the cost of the filter. Therefore, as long as the appropriate pulse pressure P c l e a r is set appropriately, the T p will not affect the cleaning efficiency of the dust collector. For energy saving, this study considers T p = 0.1   s to be the better parameter.

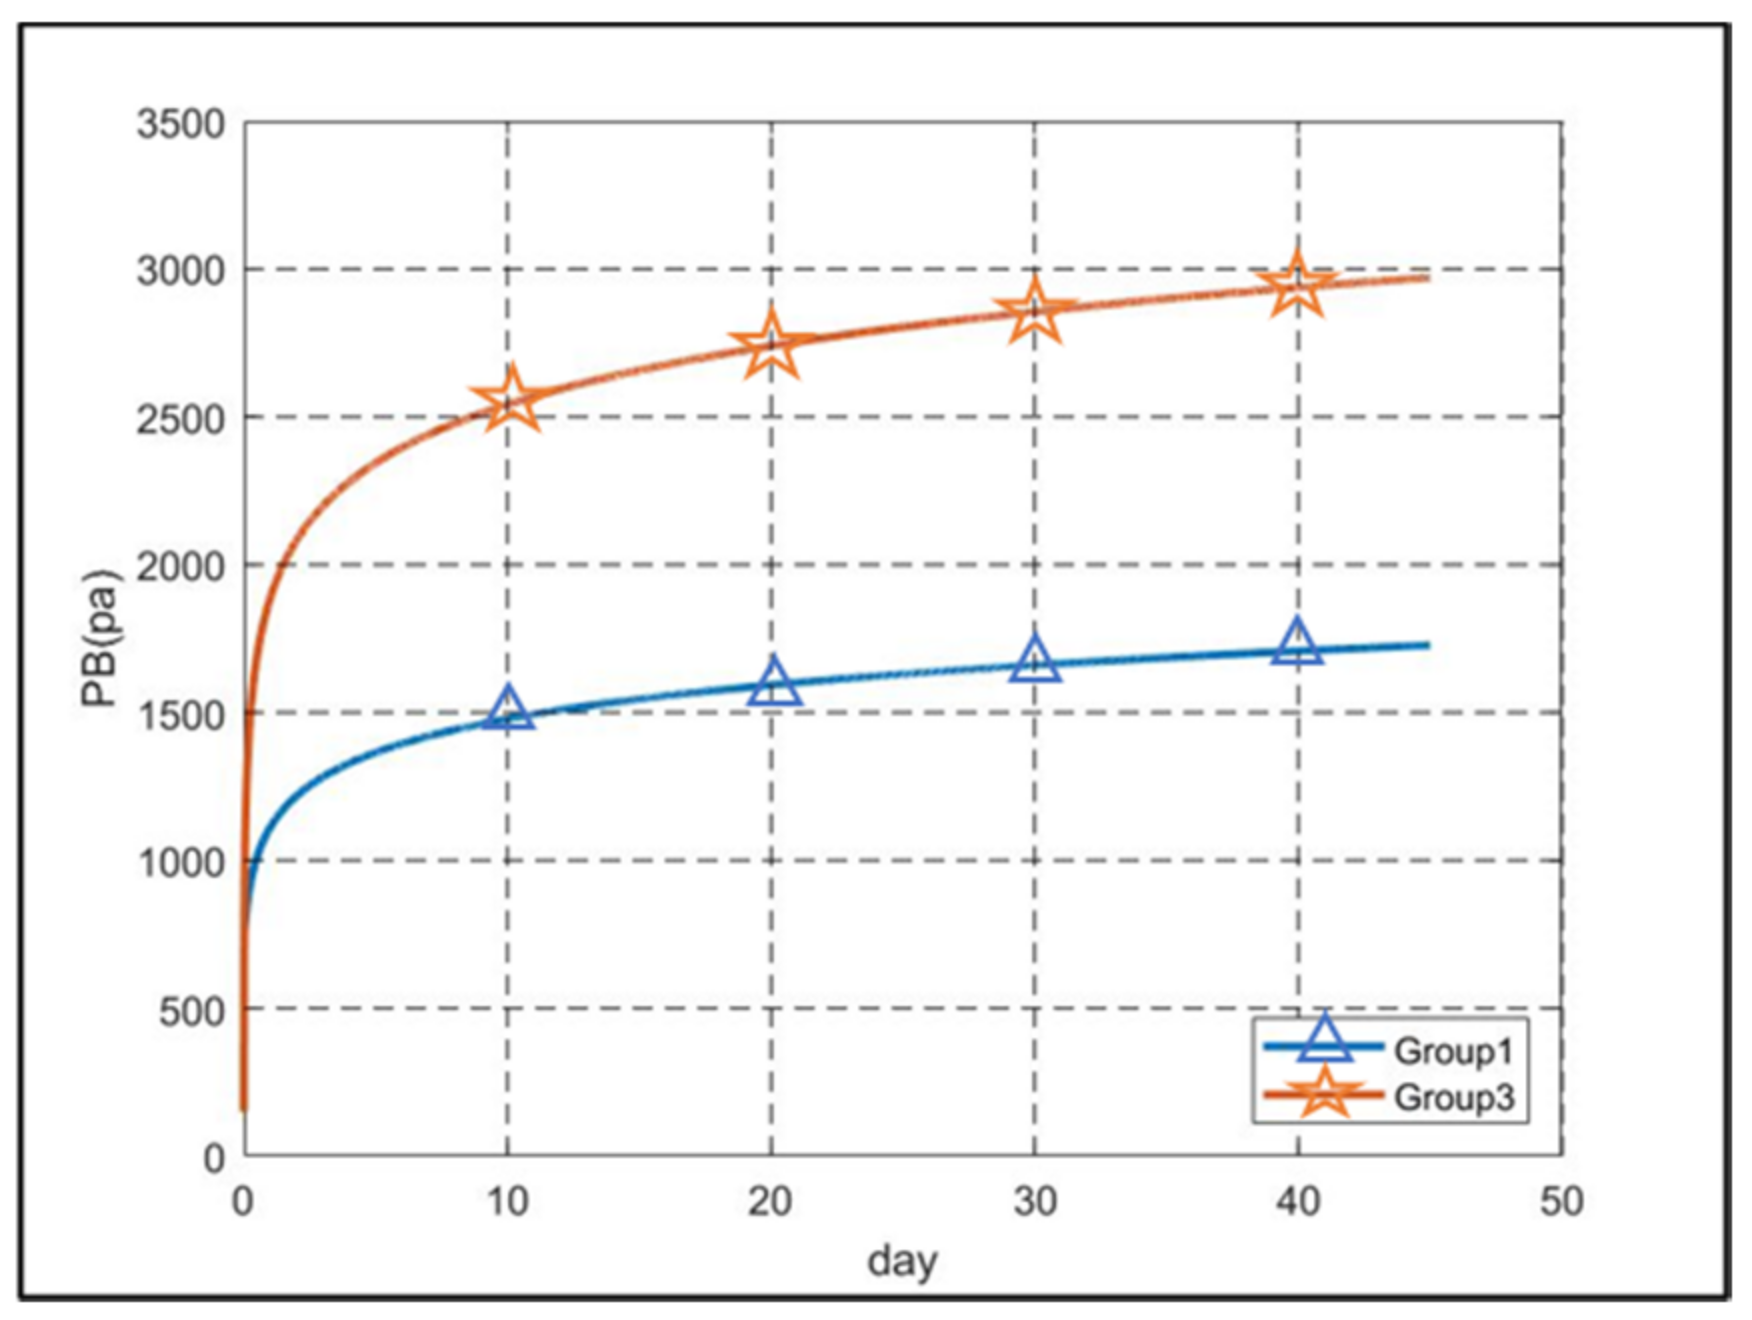
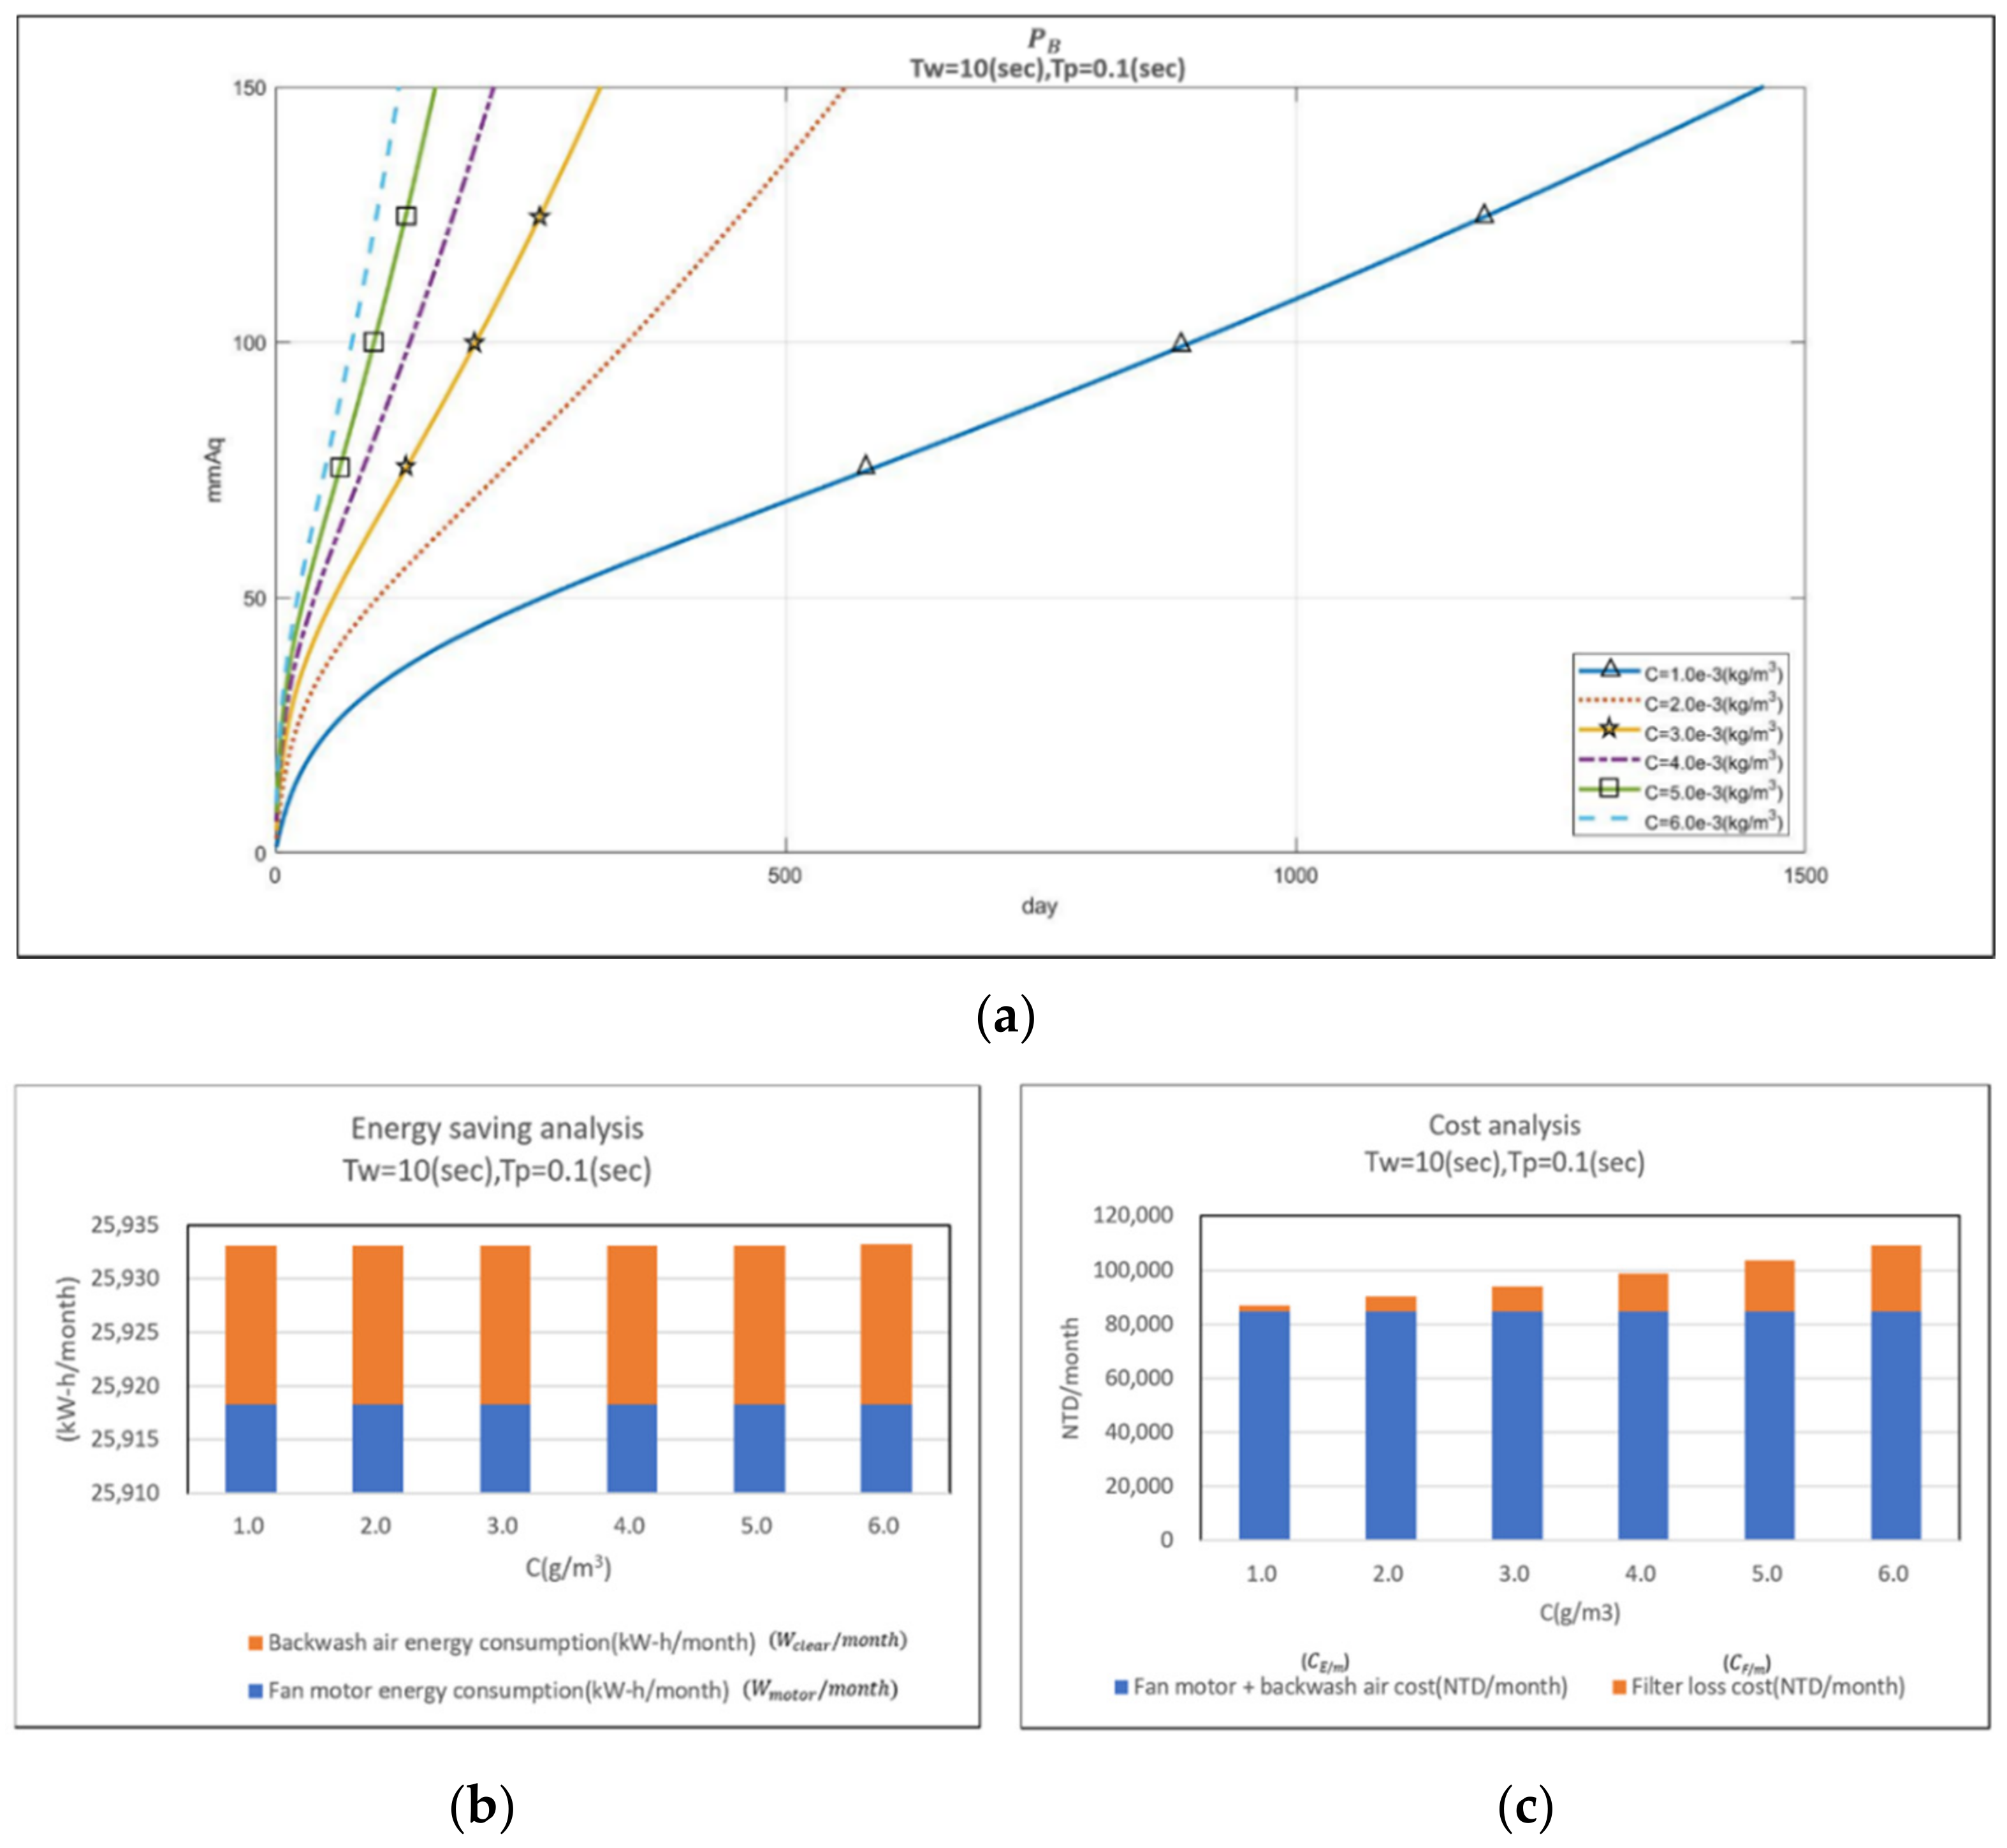
4.2.3. Simulation of Energy Consumption on Different Dust Concentrations

To further understand the influence of dust concentration C , the test takes different C values to evaluate the energy consumption under the constant of T p   and T w , where setting   C = 1.0 ~ 6.0 × 10 3   kg / m 3 , T w = 10   s , T p = 0.1   s . The filter has a service life of 1457 days as C = 1.0   g / m 3 , and there are 559 days as C = 2.0   g / m 3 , as shown in Figure 10a. Studies have found that a higher dust concentration C will mean a shorter service life of the filter. For energy consumption, this shows that C has little effect on the fan motor and the pulse-jet air, as shown in Figure 10b. In terms of cost analysis, as shown in Figure 10c, it can be observed that different C values have little effect on the electricity costs of fan motors and pulse-jet cleaning. However, a higher C will increase the cost of the filter because it shortens the life of the filter. Thus, a lower dust concentration C will be an effective operation parameter to reduce costs.

5. Conclusions

Manufacturing across the world generally faces competitiveness such as increased costs in materials and energy, and how to design processes for high performance and low cost with more attention paid to the environment has become an important issue. The purpose of this research is to find a better method to optimize processes toward sustainable manufacturing that minimizes waste and reduces the environmental impact. In the process of heavy industry, in addition to consuming a lot of energy, exhaust and dust are also generated. This is a serious issue for environmental protection. Therefore, dust collection equipment is often used to treat air pollutants, and the design of dust collection systems mostly considers the efficiency of dust collection, while ignoring the environmental impact caused by energy loss. In the past, the related research mostly used filter material selection, initial pressure, nozzle size, distance between the nozzle and filter bag, pressure impulse, and the methods of filter bag cleaning and design as improvement measures, but few studies investigated energy saving. Based on the past literature, this study proposed a method for predicting efficiency by using the pulse time and the pulse interval time as parameters to explore sustainable production and corporate competitiveness that achieve a win–win model of energy saving and cost effectiveness.
Therefore, it is an approach to fully examine the environmental impact of different simulations by pulse dust collection systems. The analysis of simulations includes pulse dust collection system design, effective filter area calculation, the filtration theory with multi-filter group establishment, and the model of pulse dust collectors to analyze energy saving and cost. A simulation environment is established based on the filtration theory of the stable flow and the related parameters of the powder. The energy consumption and cost are analyzed based on the mathematical model of the temporary powder cake, with the parameters used in the simulation process including pulse interval time, pulse time, and dust concentration. Through different conditions, the optimal and the best operating state can be found under the goal of energy saving and low cost.
According to the simulation results, the process design of the pulse dust collector is to lower the cost of filter elements and reduce the energy consumption of compressed air, which is good for the environment and beneficial for the sustainable development of manufacturing industries. The best parameters of operation are three conditions, including 10 s of the pulse interval time, 0.1 s of the pulse time, and a lower dust concentration, and it is also verified that energy saving can also bring the benefit of low cost and carbon reduction. Thus, this study refers to production processes that pollute less and create less overall production waste to maximize resource efficiency and achieve the social responsibility of environmental sustainability. The characteristic values λ 1 (characteristic of cleaning efficiency) and λ 2 (characteristic of air permeability) of the dust collector in the simulation model are dependent on the selection of filter material, including particle size, filtration speed, pulse-jet cleaning, nozzle size, nozzle distance, and other parameters. Thus, future research works will take different dusts for numerical simulation on the pressure drop with different temporary powder cakes. In addition, the current materials of dust filters such as nanomaterial will also achieve more effective pollution prevention. However, the cost also forms the consideration on the competitiveness of enterprises in the market. Therefore, future research will continue to carry out the different types of filter material and environmental conditions to compare the situation of on-site and simulations to accurately find the best operating parameters and provide energy-saving solutions for industry as a reference.

Author Contributions

Conceptualization, C.-L.H.; methodology, C.-L.H.; software, W.-C.C.; validation, Y.-C.T. and W.-C.C.; formal analysis, Y.-C.T. and W.-C.C.; investigation, Y.-C.T.; resources, Y.-C.T.; data curation, Y.-C.T.; writing—original draft preparation, Y.-C.T.; writing—review and editing, C.-L.H.; visualization, Y.-C.T.; supervision, C.-L.H.; project administration, C.-L.H.; funding acquisition, C.-L.H. All authors have read and agreed to the published version of the manuscript.

Funding

This research was funded by Scientific Research at Fujian Province of China, grant number 2020R0129.

Institutional Review Board Statement

Not applicable.

Informed Consent Statement

Not applicable.

Data Availability Statement

Data sharing is not applicable.

Conflicts of Interest

The authors declare no conflict of interest.

References

  1. Bureau of Energy. The Annual Energy Outlook in Energy-Saving and Carbon-Reduction Services of Manufacturing Industries 2018, Ministry of Economic Affairs in Taiwan. Available online: https://www.moeaboe.gov.tw/ECW/populace/home/Home.aspx (accessed on 8 November 2021).
  2. Choi, J.H.; Bak, Y.C.; Jang, H.J.; Kim, J.H.; Kim, J.H. Experimental investigation into compression properties of integrated coal gasification combined cycle fly ashes on a ceramic filter. Korean J. Chem. Eng. 2004, 21, 726–732. [Google Scholar] [CrossRef]
  3. Endo, Y.; Chen, D.R.; Pui, D. Effects of particle polydispersity and shape factor during dust cake loading on air filters. Powder Technol. 1998, 98, 241–249. [Google Scholar] [CrossRef]
  4. World Commission on Environment and Development (WCED). Our Common Future; Oxford University Press: Oxford, UK, 1987. [Google Scholar]
  5. AL-ALwani, M. Towards Sustainable Middle Eastern Cities: A Local Sustainability Assessment Framework; School of Architecture, Design, and Environment, University of Plymouth: Plymouth, UK, 2014. [Google Scholar]
  6. Kong, L. Improbable art: The creative economy and sustainable cluster development in a Hong Kong industrial district. Eurasian Geogr. Econ. 2013, 53, 182–196. [Google Scholar] [CrossRef]
  7. Kengpol, A.; Boonkanit, P. The decision support Framework for developing ecodesign at conceptual phase based upon ISO/TR 14062. Int. J. Prod. Econ. 2011, 131, 4–14. [Google Scholar] [CrossRef]
  8. OECD. Sustainable Mnufacturing and Eco-Innovation: Framework, Pactices and Masurement; OECD: Paris, France, 2009. [Google Scholar]
  9. Maxwell, D.; Sheate, W.; Van Der Vorst, R. Functional and systems aspects of the sustainable product and service development approach for Industry. J. Clean. Prod. 2006, 14, 1466–1479. [Google Scholar] [CrossRef]
  10. Gond, J.; Grubnic, S.; Herzig, C.; Moon, J. Configuring management control systems: Theorizing the integration of strategy and sustainability. Manag. Account. Res. 2012, 23, 205–223. [Google Scholar] [CrossRef] [Green Version]
  11. Carrillo-Hermosilla, J.; del Rio, P.; Konnola, T. Diversity of eco-innovations: Reflections from selected case studies. J. Clean. Prod. 2010, 18, 1073–1083. [Google Scholar] [CrossRef]
  12. Reich-Weiser, C.; Vijayaraghavan, A.; Dornfeld, D. Appropriate use of green manufacturing frameworks. In Proceedings of the CIRP Life Cycle Engineering Conference, Hefei, China, 19–21 May 2010. [Google Scholar]
  13. Tan, J.; Zailani, S. Green value chain in the context of sustainability development and sustainable competitive advantage. Glob. J. Environ. Res. 2009, 3, 234–245. [Google Scholar]
  14. Ambec, S.; Lanoie, P. Does it pay to be green: A systematic overview. Acad. Manag. Perspect. 2008, 22, 45–62. [Google Scholar]
  15. Tonelli, F.; Evans, S.; Taticchi, P. Industrial sustainability: Challenges, perspectives, actions. Int. J. Bus. Innov. Res. 2013, 7, 143–163. [Google Scholar] [CrossRef]
  16. Sutherland, J.W.; Skerlos, S.J.; Haapala, K.R.; Cooper, D.; Zhao, F.; Huang, A. Industrial sustainability: Reviewing the past and envisioning the future. J. Manuf. Sci. Eng. 2020, 142, 110806. [Google Scholar] [CrossRef]
  17. Arena, M.; Ciceri, N.D.; Terzi, S.; Bengo, I.; Azzone, G.; Garetti, M. A state-of-the-art of industrial sustainability: Definitions, tools and metrics. Int. J. Prod. Lifecycle Manag. 2009, 4, 207–251. [Google Scholar] [CrossRef]
  18. Ramani, K.; Ramanujan, D.; Bernstein, W.Z.; Zhao, F.; Sutherland, J.; Handwerker, C.; Choi, J.K.; Kim, H.; Thurston, D. Integrated sustainable life cycle design: A review. J. Mech. Des. 2010, 132, 091004. [Google Scholar] [CrossRef] [Green Version]
  19. Chen, Z.; Bao, B.; Zhu, W.; Lin, Z. Effect of test dust on performance test for a pleated filter cartridge. Aerosol Air Qual. Res. 2015, 15, 2436–2444. [Google Scholar] [CrossRef] [Green Version]
  20. Li, S.; Wang, F.; Xin, J.; Xie, B.; Hu, S.; Jin, H. Study on effects of particle size and maximum pressure drop on the filtration and pulse-jet cleaning performance of pleated cartridge filter. Process Saf. Environ. Prot. 2019, 123, 99–104. [Google Scholar] [CrossRef]
  21. Choi, J.H.; Ha, S.J.; Bak, Y.C.; Park, Y.O. Particle size effect on the filtration drag of fly ash from a coal power plant. Korean J. Chem. Eng. 2002, 19, 1085–1090. [Google Scholar] [CrossRef]
  22. Saleem, M.; Krammer, G. On the stability of pulse-jet regenerated-bag. Chem. Eng. Technol. 2012, 35, 877–884. [Google Scholar] [CrossRef]
  23. Li, J.; Li, S.; Zhou, F. Effect of cone installation in a pleated filter cartridge during pulse-jet cleaning. Powder Technol. 2015, 284, 245–252. [Google Scholar] [CrossRef]
  24. Park, B.; Kim, S.; Jo, Y.; Lee, M.H. Filtration characteristics of fine particulate matters in a PTFE/Glass composite bag filter. Aerosol Air Qual. Res. 2012, 12, 1030–1036. [Google Scholar] [CrossRef] [Green Version]
  25. Li, J.; Zhou, F.; Li, S. Experimental study on the dust filtration performance with participation of water mist. Process Saf. Environ. Prot. 2017, 109, 357–364. [Google Scholar] [CrossRef]
  26. Tanabe, E.; Barros, P.; Rodrigues, K.; Aguiar, M. Experimental investigation of deposition and removal of particles during gas filtration with various fabric filters. Sep. Purif. Technol. 2011, 80, 187–195. [Google Scholar] [CrossRef]
  27. Lu, H.C.; Tsai, C.J. Influence of different cleaning conditions on cleaning performance of pilot-Scale pulse-jet Baghouse. J. Environ. Eng. 2003, 129, 811–818. [Google Scholar] [CrossRef] [Green Version]
  28. Calle, S.; Contal, P.; Thomas, D.; Bemer, D.; Leclerc, D. Evolutions of efficiency and pressure drop of filter media during clogging and cleaning cycles. Powder Technol. 2002, 128, 213–217. [Google Scholar] [CrossRef]
  29. Simon, X.; Thomas, D.; Bémer, S.D.; Calle, S.; Régnier, R.; Contal, P. Influence of cleaning parameters on pulse-jet filter bags performances. Filtration 2004, 4, 253–260. [Google Scholar]
  30. Lo, L.M.; Chen, D.R.; Pui, D. Experimental study of pleated fabric cartridges in a pulse-jet cleaned dust collector. Powder Technol. 2010, 197, 141–149. [Google Scholar] [CrossRef]
  31. Lo, L.M.; Hu, S.C.; Chen, D.R.; Pui, D. Numerical study of pleated fabric cartridges during pulse-jet cleaning. Powder Technol. 2010, 198, 75–81. [Google Scholar] [CrossRef]
  32. Li, Q.; Zhang, M.; Qian, Y.; Geng, F.; Song, J.; Chen, H. The relationship between peak pressure and residual dust of a pulse-jet cartridge filter. Powder Technol. 2015, 283, 302–307. [Google Scholar] [CrossRef]
  33. Li, S.; Hu, S.; Xie, B.; Jin, H.; Xin, J.; Wang, F.; Zhou, F. Influence of pleat geometry on the filtration and cleaning characteristics of filter media. Sep. Purif. Technol. 2019, 210, 38–47. [Google Scholar] [CrossRef]
  34. Kim, J.; Lee, M.H. Measurement of effective filtration area of pleated bag filter for pulse-jet cleaning. Powder Technol. 2019, 343, 662–670. [Google Scholar] [CrossRef]
  35. Kim, J.H.; Kim, Y.C.; Choi, J.H. Characteristics of pressure drop during the pulse-jet cleaning of a ceramic filter for high temperature and high pressure. Korean J. Chem. Eng. 2016, 33, 726–734. [Google Scholar] [CrossRef]
  36. Cheng, Y.H.; Tsai, C.J. Factors influencing pressure drop through a dust Cake during filtration. Aerosol Sci. Technol. 1998, 29, 315–328. [Google Scholar] [CrossRef]
  37. Dennis, R.; Wilder, J.; Harmon, D. Predicting pressure loss for pulse jet filters. J. Air Pollut. Control Assoc. 1981, 31, 987–992. [Google Scholar] [CrossRef]
Figure 1. The pulse dust collection system.
Applsci 11 10941 g001
Figure 2. The pulse dust collection system.
Applsci 11 10941 g002
Figure 3. The model of filter elements in pulse dust collector.
Applsci 11 10941 g003
Figure 4. The results of Group1 and Group3 simulation on the pressure drop for 45 days.
Applsci 11 10941 g004
Figure 5. The results of Group1 simulation on the pressure drop of the temporary powder cake.
Applsci 11 10941 g005
Figure 6. The results of Group3 simulation on the pressure drop of the temporary powder cake.
Applsci 11 10941 g006
Figure 7. The changes in cleaning efficiency and pressure drop in the zones.
Applsci 11 10941 g007
Figure 8. The simulation of energy consumption on different pulse interval times. (a). The analysis of the pressure drop. (b). The analysis of energy saving. (c). The analysis of cost.
Applsci 11 10941 g008
Figure 9. The simulation of energy consumption on different pulse times. (a). The analysis of the pressure drop. (b). The analysis of energy saving. (c). The analysis of cost.
Applsci 11 10941 g009
Figure 10. The simulation of energy consumption on different dust concentrations. (a). The analysis of the pressure drop. (b). The analysis of energy saving. (c). The analysis of cost.
Applsci 11 10941 g010
Publisher’s Note: MDPI stays neutral with regard to jurisdictional claims in published maps and institutional affiliations.

