Article

Digitalization in Open-Pit Mining: A New Approach in Monitoring and Control of Rock Fragmentation

1
Department of Automation of Technological Processes and Production, Department of Blasting, St. Petersburg Mining University, 2, 21 Line of Vasilyevsky Island, 199106 St. Petersburg, Russia
2
Center for Reliability and Risk Management, Shamoon College of Engineering (SCE), Beer Sheva 8410802, Israel
*
Author to whom correspondence should be addressed.
Appl. Sci. 2021, 11(22), 10848; https://doi.org/10.3390/app112210848
Submission received: 24 October 2021 / Revised: 8 November 2021 / Accepted: 15 November 2021 / Published: 17 November 2021
(This article belongs to the Special Issue Advanced Design and Manufacturing in Industry 4.0)

Abstract

:
Mining enterprises are widely introducing digital technologies and automation is one of such tools. Granularity monitoring, namely, the size determination of rock mass pieces is a common operational component of the processes that extract minerals by open-pit mining. The article proposes an approach that, in addition to the lump size distribution, makes it possible to estimate the lump form distribution as well. To investigate the effectiveness of monitoring the form of blasted rock mass lumps, the authors conducted experiments in four stages related to the rock condition. They include geological occurrence, explosive crushing, trommelling, and mill crushing. The relationship between these stages is presented and the change in the lumps fragment form is traced. The present article proposes an informational and analytical model of the processes at mining enterprises, extracting minerals by open-pit mining, as well as an algorithm for determining the lumps form and obtaining their distribution in the rock mass.

1. Introduction

Digitalization is the most significant tool in the formation of the modern world economy [1,2]. Digital technologies are involved in all spheres of human activity and are a universal trigger for the creation of new approaches to solving ordinary issues [3,4]. Mining industry is not an exception [5,6]. The task of determining the rock fragmentation at the mining enterprises is one of the most important and constantly clarified issues [7,8]. There are a number of approaches to determine the rock fragmentation at the following various stages of mining production: geological research [9,10], blasting [11,12], influence on technological processes and apparatuses [13,14], and quality characteristics of finished products [15,16]. However, the introduction of digital technologies, the extended use of information models of mining production, as well as the introduction of new analytical algorithms that help to conduct advanced analysis in several operations, repartitions, enterprises, etc., will allow us to optimize technological processes and obtain more profit without significant costs [17,18].
The determination of rock fragmentation is an urgent task for mining enterprises; it is covered in many scientific papers [19,20]. In particular, an article by P.K. Singh et al. [21] evaluates the relationship between fragmentation (lump size) and drilling and blasting parameters. Ninety-one blasts are conducted with varying blast designs and charging patterns, and their impact on the rock fragmentation are documented. Software for the estimation of rock fragmentation is presented. Similar issues are covered in a work by Binay Kumar Singh et al. [22]. The article describes the relationship between fragment size and such factors as burden, bench height/drilling depth, stemming column, powder factor, and hole diameter using special software for digital image analysis. A paper by Riika M. Ylitalo et al. [23] shows the effect of detonator location and rock fragmentation. Detonator location is studied for open-pit bench blasting. The best detonator position is the middle of the explosive charge length. The middle detonator position significantly improves rock fragmentation. The fragment size ×50 was reduced by 11–24% in the field tests. An experimental study of rock fragmentation under different stemming conditions [24] uses model explosions to study grindstone composition. Nine blasts with cylindrical granite specimens were carried out under different stemming conditions. All the similar works, for instance, refs. [25,26], present a relationship between the parameters of drilling and blasting and fragmentation.
Another great direction is the application of various approaches and technologies to rock fragmentation analysis by decoding images of rock pieces [27,28]. For example, an article by Thomas Bamford et al. [29] considers the process of creating a deep neural network trained to predict the size of rock fragments from a photograph. A total of 61,853 images of blasted rock fragments were used to train and tune the neural network. A paper by Mohammad Babaeian et al. [30] presents the developed regression model for determining the average size of a lump and obtaining the rock pieces distribution. A work by Jian Tao et al. [31] is the closest to the idea of the present study. The paper uses integrated analytical modeling, finite element simulation, and image processing to investigate mechanical forces on rock fragmentation. The work identifies significant correlations between the fragment aspect ratio and its size and uniformity of distribution, highlighting the potential use of the fragment form as an indicator for evaluating the blasting performance alongside conventional grading analysis.
The main hypothesis of the present study was the assumption that the analysis of the rock mass fragmentation at all stages of the production cycle in open-pit mining should be carried out. In this case, lumps of rock mass were used as products or materials. In this instance, to increase the information content of such analytical system it was necessary to take into account the lump form in addition to the size estimation of the rock mass. An analytical review and the optimization of equipment operation or technological parameters should be carried out on the basis of changes in rock fragmentation at all stages of the production cycle.

2. Materials and Methods

The proposed method of the study was based on two main assumptions:
(1).
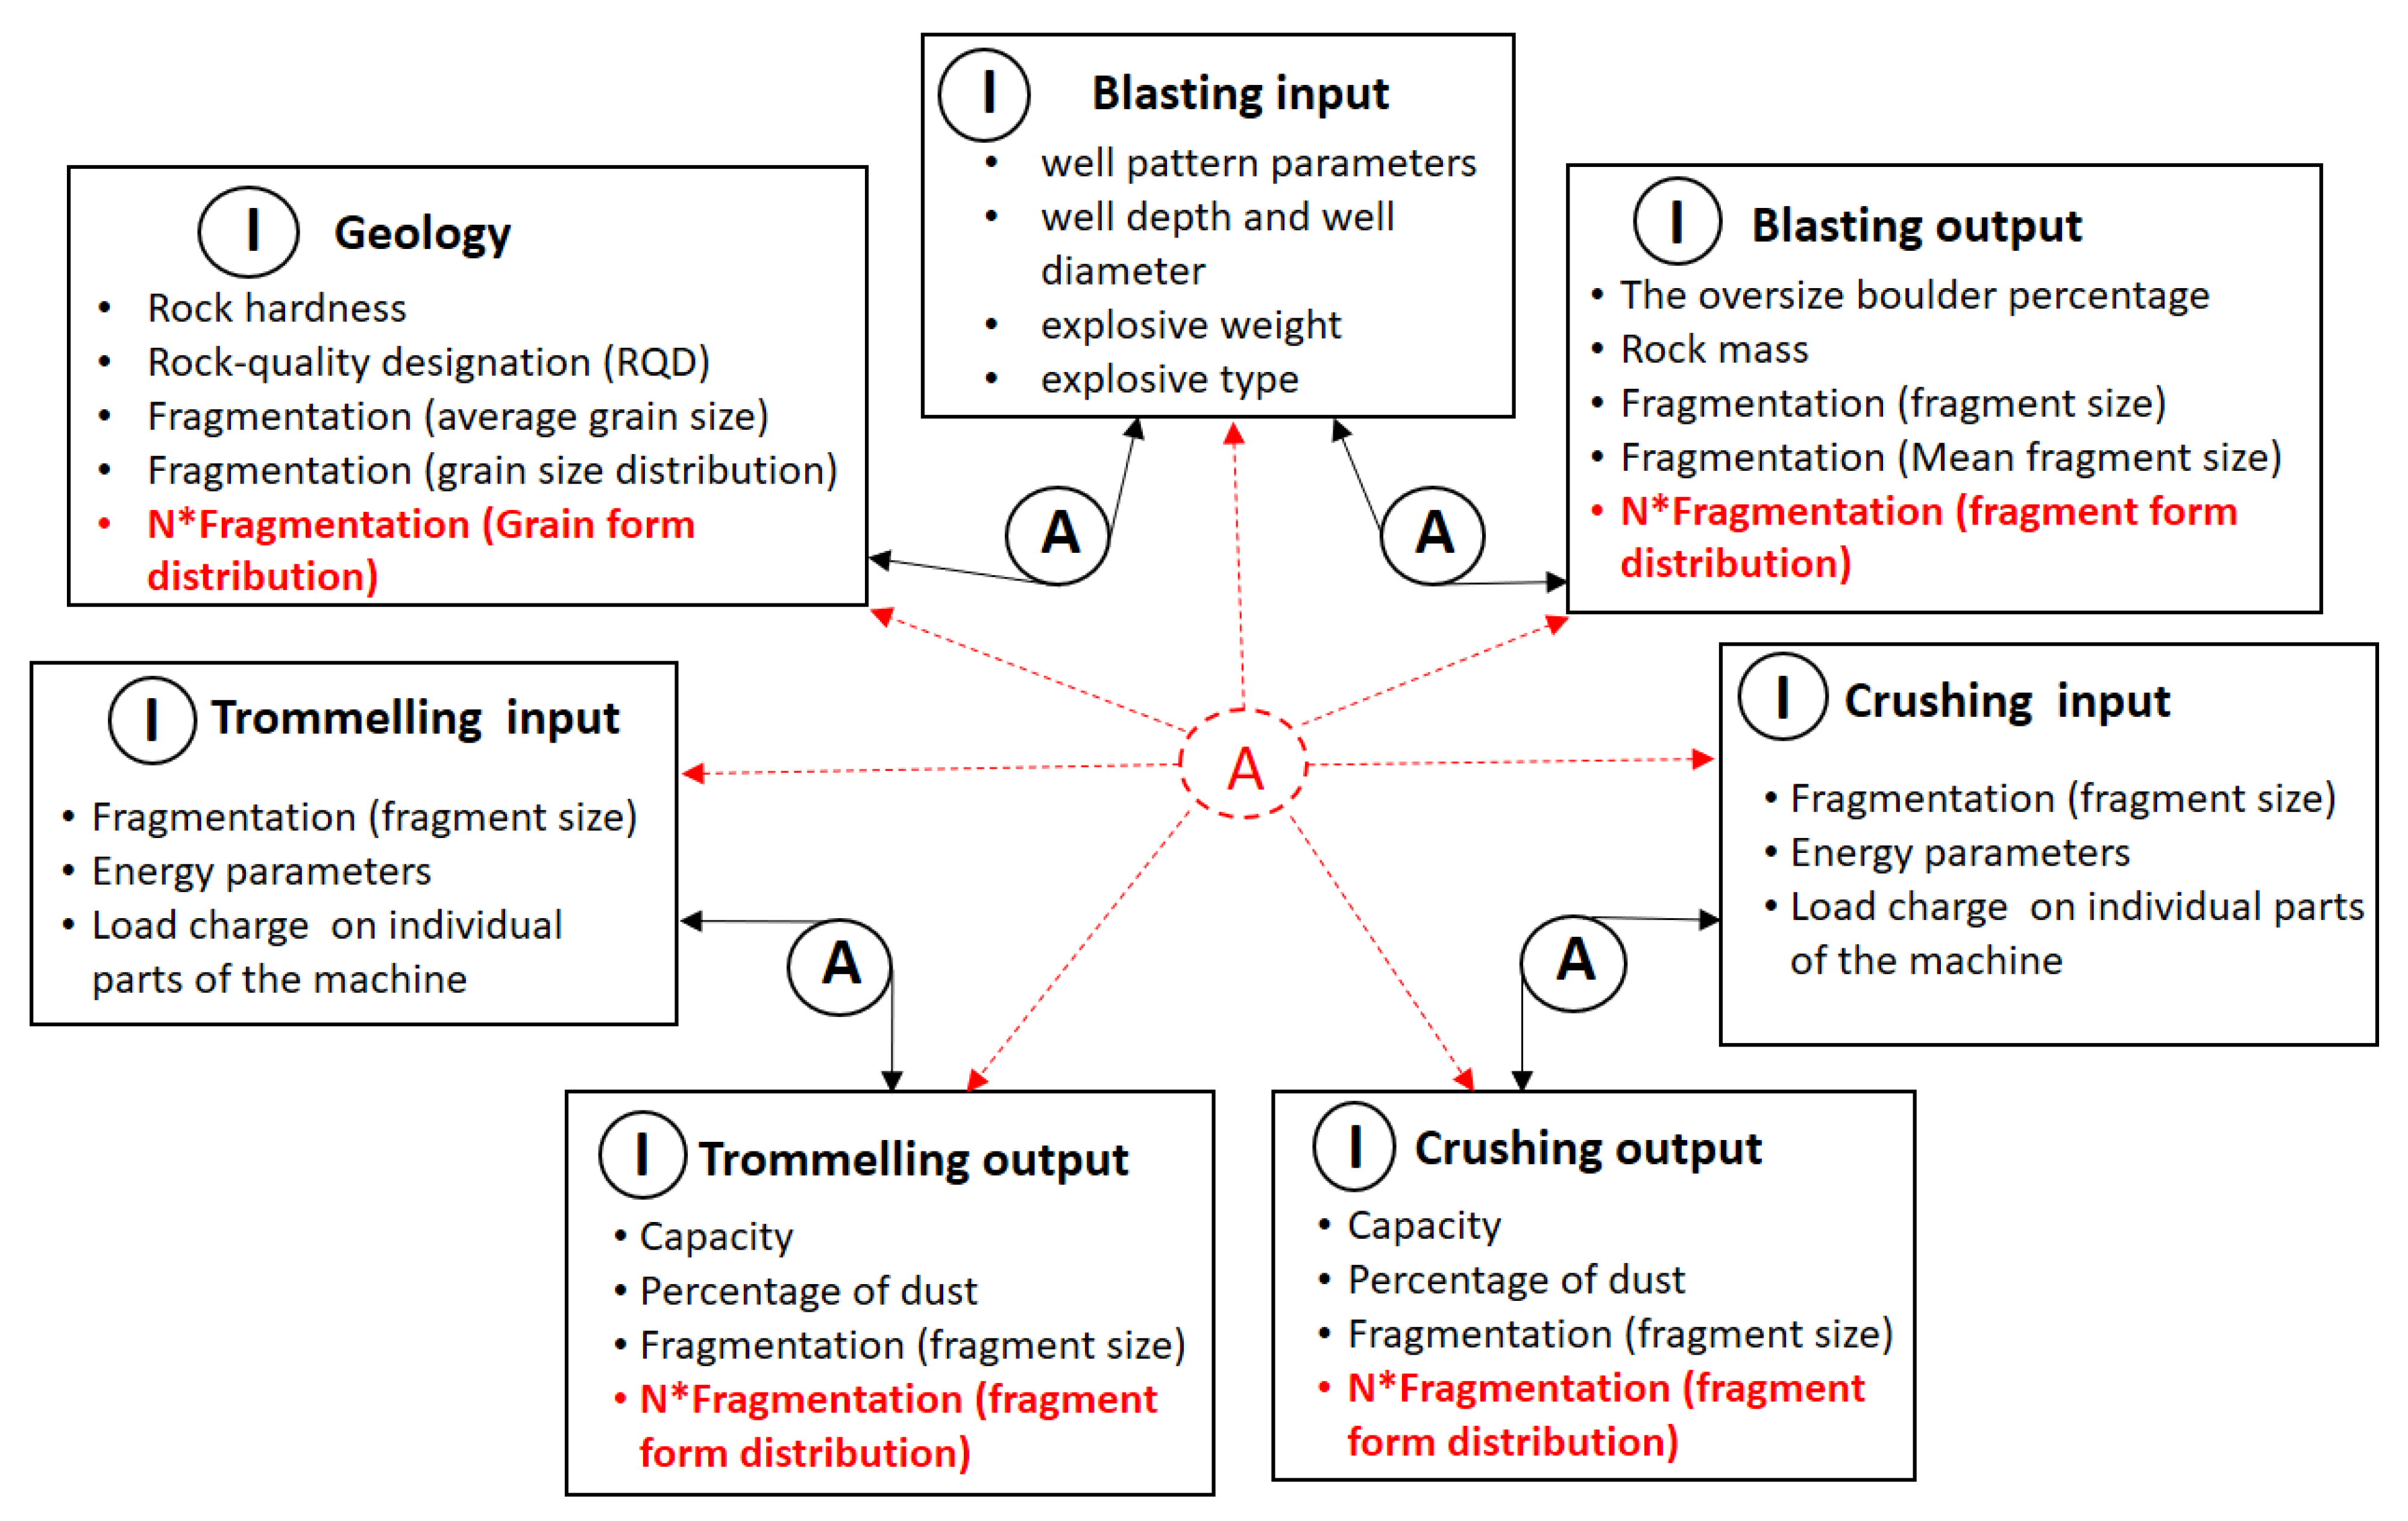
When evaluating the grading composition, the parameter of the lump form and its distribution should be taken into account in addition to the average lump size, etc. This will significantly increase the information component of the technological processes;
(2).
Analytical algorithms linking the parameters of rock fragmentation and technological processes and equipment should be developed for each technological operation separately, as well as to analyze and implement interrelationships with subsequent and previous stages.
Figure 1 shows a scheme of technological operations of a mining production with a detailed section of the ore dressing process. As a rule, it includes the following stages: geological research, blasting, trommelling, crushing, grinding, and flotation.
In this study, the validity of the hypothesis was tested experimentally in the four stages shown in Figure 1. Figure 2 presents the scheme of information-analytical model for these processes.
As indicated in Figure 1, this parameter is related to the measurement of the rock fragmentation and takes into account the rock pieces form. It should be emphasized that the authors of the work chose the most characteristic parameters of each technological operation in order to simplify the information model of these processes.
In addition to the information component, the model presents the analytical component (A). This is due to the relationship between blasting parameters—explosive weight, borehole diameter and depth, borehole grid, and fragmentation obtained as a result of blasting. There are a significant number of approaches to optimize drilling and blasting parameters to obtain the desired rock fragmentation during the blasting phase [32,33]. The dotted lines and red color show that the analytical algorithms of each operation should move to multistage analytics of all operations at once. In the context of present study, this approach will additionally provide the optimization of technological processes and apparatuses. This will allow, in turn, to more accurately formulate the inverse task of adjusting the parameters of technological parameters. As the increased information component will redefine existing and indicate new dependences between input and output parameters of all production stages. In this case, the increase in profits for a company that applies this model to its process control systems for mining operations is evident.
The following three forms of pieces were defined: cubic (all sides are equal), square (one of the sides is twice as big as the others), and spilt (one of the sides is three or more times bigger than the others). Thе division into forms is approximate and rather crude. In reality, it is better to take more variants of forms. However, demonstrating the division into forms even at the elementary level with an indication of the possible effectiveness will be evident when using a broader classification of forms. In this case, division into three simple classes will greatly simplify the experiments.
To determine the lumps form and obtain their distribution in the rock mass, we propose to use the theory of neural networks and the recognition algorithm [34,35] shown in Figure 3.
It should be noted that such an algorithm can be applied to image the entire rock mass. In this instance, we will obtain a picture of the lumps’ distribution by fragment form for the whole size range. However, it is more expedient to load the images after the procedure of automatic determination of the rock fragmentation and to output the images with pieces of rock mass of a certain size (range). Thus, in addition, it will be possible to obtain the fragment form distribution within each fraction, which gives more information to the system.

3. Experiments

To prove the hypothesis, experiments were carried out in a granite (crushed stone) quarry in the Leningrad region of the Russian Federation. Four technological stages were used for the experiments—geological including the study of the rock structure, blasting stage, trommelling, and crushing at the factory.
The geological stage of the experiment consisted of taking rock samples (samples were taken from three different areas of the rock massif, it allowed us to take into account the effect of heterogeneity) and further sample preparation—sawing and grinding, photographing samples using macroscopy against a measuring tape and counting the average grain size, evaluating the uniformity of grain structure, and evaluating grain fragment form by hand. Mineral resources are represented by igneous rocks—gneiss granites and gneisses, which do not differ from each other in physical and mechanical properties and belong to a single technological type of raw materials—moderately fractured rocks of III–IV categories, with compressive strength from 77 to 276, on average 180–200 MPa; average volumetric weight—2.67 t/m3. The strength coefficient according to Prof. Protodyakonovòs’ scale is in the range of 12–16. Figure 4 shows several fragments of rock samples prepared for the experiment.
The experiment at the blasting stage was conducted using the photoplanimetric method, piece-by-piece measurement of blasted rock mass pieces, and sieve analysis. It should be noted that such methods of experimentation were used because of the impossibility of using automated methods of visual control, etc. However, the experiments described in this paper can be performed using automatic control systems. These systems will make it possible to obtain significant experimental data and to more accurately determine parameters such as the average lump size and the distribution of rock fragmentation.
As part of the experiment, photo-fixing of the area of rock mass breakdown at a distance of 6 m was carried out at the end of blasting (Figure 5). Red-and-white measuring tape was applied to the breakdown areas, with red-and-white strips alternating at 1 m intervals. The measuring tape was overlaid every 10 m. The measuring tape was necessary to determine the scale, and to measure and determine the form of the blasted rock mass pieces. Additionally, two samples were taken from two places of rock explosion (with a volume of 2 special vehicles—a Belaz dump truck). These samples were poured onto a specially prepared flat area. The fragment form was determined; each piece of the blasted rock mass was measured and weighed. Additionally, the rock fragmentation was defined using special software and compared with the results obtained.
The crushing and trommelling stages were carried out manually in the same way as the blasting stage. Samples of material for the experiment were taken directly from the conveyor at three points—the beginning, middle and end of the belt—every hour during the entire shift. The volume of each sample to be taken was 1 linear meter.

4. Results and Discussion

Figure 6 presents the results of an experiment with a general fragment form distribution for all the experiments.
In the figure, you can see the following trend in the form change: the number of cubic pieces decreases after each stage of crushing, and the number of spilt and square pieces increases.
Figure 7 shows the same results but averaged over three experiments.
By analyzing Figure 7, it can be seen that the fragment form during the natural formation of the rock (geological stage) is distributed in such a way that the percentage of spilt minerals is almost twice as large as cube and square. We decided to compare the change in a set of cubic together with square and spilt forms. The result is presented in Figure 8.
By analyzing Figure 8, the following result is obtained: when evaluating a set of cubic and square forms with a spilt one, a ratio of 51.3 to 48.7 is observed. Thus, the set of irregular (spilt) and regular (cube and square) forms is uniform, which is probably not accidental. In addition, when analyzing Figure 8, one can see an increase in the spilt form from the first to the third technological stage and a decrease in the cubic one. At the same time, the graph shows the linear nature of this change. At the next stage of the experiment, we drew an approximating curve and assessed the nature of its change (Figure 9).
The analysis of the results presented in Figure 9 and the search for an approximating dependence shows an unexpected result for the researchers themselves. The change in the spilt form and the change in the set of square and cubic forms from the first to the third stage shows the dependences y = 7.7167x + 19.956 and y = −7.7167x + 80.044, respectively. That is, the coefficient at x of the linear approximating curve y for these dependences turns out to be the same, but with different signs. At the same time, the coefficient R2 is the same in both cases and is quite high, 0.9603. A uniform value indicates that the correct data set was analyzed, and a high R2 value means that the change in form obeys a linear law. The authors assume, however, that this change obeys a linear law until the time when the cubic and square form are in a 50/50 ratio (that is, close to the natural distribution). The coefficient at x showing the rate of change of parameters from stage to stage can be related to very important parameters—yield of fines, oversize, etc. In this case, it is also possible to relate the technological parameters and refining coefficients of various empirical formulas to this equation obtained in the estimation of the fragment form distribution.
Additionally, it was decided to analyze the set of cubic and square with spilt forms’ distribution for the data of each of the three experiments. The results are shown in Figure 10, Figure 11 and Figure 12.
As shown in Figure 10, Figure 11 and Figure 12, the trend continued in all three cases separately. At the same time, the R2 coefficient varies from 0.8663 to 0.9885.
To analyze this in detail, the forms’ distribution was also plotted for each fraction. Figure 13 shows the form distribution by fractions.
In Figure 13, you can see that the 60–90-centimeter fraction is represented only by the spilt and square form, and the 90–120-centimeter fraction is only cubic. In this case, no characteristic change in the form distribution is observed.
Thus, the results obtained show that a change in the pieces’ form distribution in combination with other measured parameters can provide additional knowledge about the process and, therefore, should be taken into account in the integrated information and analytical system of mining.
The authors emphasize that the results obtained from the form of the pieces were obtained during the experiments that were conducted by hand. Part of the rock mass was taken out by dump trucks (Belaz with a carrying capacity of 42 tons) on a flat site, disassembled manually and a piece-by-piece measurement of each piece and sieve analysis was performed, which gave the results presented above. However, this experiment is not possible under industrial conditions due to its high labor intensity. For industrial systems, it is necessary to develop special software that allows an assessment of the distribution of the shape of pieces to be made in an automated mode. According to the algorithm presented in Figure 3, the authors have developed a program that allows the fragment form parameter and its distribution to be obtained from photographs of blasted rock mass. Figure 14 shows the interface of the software that allows the form distribution to be determined. This fragment shows one of the steps of the algorithm in Figure 3. In this step, the user is prompted to select the eight squares in the figure and confirm their actions. Everything occurs in manual mode—a photo is loaded, and the user marks the eight squares
Since, at the current stage of the study, it is necessary to determine the possibility of form recognition to train and test the software performance, photographs obtained in the Power Sieve3 (PS3) automatic particle size distribution system (size of rock pieces) are used for form recognition. Figure 15 shows the stages of fragmentation recognition in Power Sieve3 (PS3).
The fragment form recognition system presents a fairly good result. The form recognition error does not exceed 20 percent in comparison with the experimental data, carried out in manual mode by a piece-by-piece measurement of each piece and sieve analysis. However, it must be emphasized that this system has been tested only on the available photographs of experiments and has not been applied in industrial conditions. In present work, the system is presented as a demonstration of the possibility of creating such systems, and it certainly needs to be improved. Thus, the obtained conclusions described in the article should be additionally confirmed by a larger series of experiments, while the algorithm and the form recognition system should operate in a continuous mode. This will require the adaptation of the developed system to these conditions. This will be a continuation of the current research.
Thus, the work presents one of the components presented in Figure 2, which is given additionally to explain the practical applicability of the obtained solutions. The main idea of the paper is the need to determine (control) the pieces’ form at each stage of mining/processing of the minerals. This paper presents how this information can be obtained, i.e., the “I” component. During the experiment, the authors obtained this information “manually” by measuring each piece. It has been proposed that in industrial conditions, it is necessary to add a module for fragment form evaluation to the system that determines the grading (average piece size)—this option will not require large investments in hardware and software. For this purpose, the authors showed how a photo processed by the software to determine the average size of a lump can be refined to determine the form of lumps. Thus, the input information of the model is the images from this software, obtained at each process. In the present work, pieces of rock of various shapes and sizes were used as input information. The output information is the fragment form distribution. During the experiment, the analytical component of this figure is that the fragment form distribution was considered at four different stages. The result showed that optimization should be carried out by considering the form distribution at all stages. For example, when we analyze the distribution of the form at once on three technological stages, we can conclude that the more spilt form there is, the greater the yield of fines is. In fact, during blasting, the yield of fines was 10%, and after the third stage—30%. However, the natural structure, i.e., geological stage, shows that the spilt form is half of a cube plus a square in the aggregate and this fact requires analysis and verification with a larger volume of data.
Summarizing the following obtained results, the authors want to emphasize their scientific and practical significance:
-
The use of information-analytical systems at mining enterprises is not new, they are widely used and certainly bring additional profits and increase economic efficiency. However, the relationships to be analyzed, as well as the mutual influence of changes in some parameters throughout the various stages of mining production are not fully defined. Regarding the process of rock fragmentation, mining enterprises usually equilibrate the parameter of the average lump size: determine it at one or more stages and conduct optimization measures to change this parameter [36,37]. The authors of this work made an assumption and tried to prove it. This assumption says that in addition to the parameter of the average lump size or the distribution of grading, it is necessary to take into account the parameter of the lump form. The results showed that even a rough assessment of the form (the division was carried out only on three varieties) can provide an opportunity to optimize technological processes. For example, changing the parameters of drilling and blasting, trying to obtain a certain size of the average piece, you can obtain a lot of spilt-shaped material. This form, firstly, is a substandard material of granite production; secondly, it fills the dump trucks transporting rock mass from the quarry to the factory in a special way, it passes through the crusher sieve (the smaller side) and the larger side will give the increased load on operation of mechanisms, etc. In other words, the form of lumps affects the parameter of bulk density, and the parameter of bulk density is very important for many processes of mining production [38,39].
-
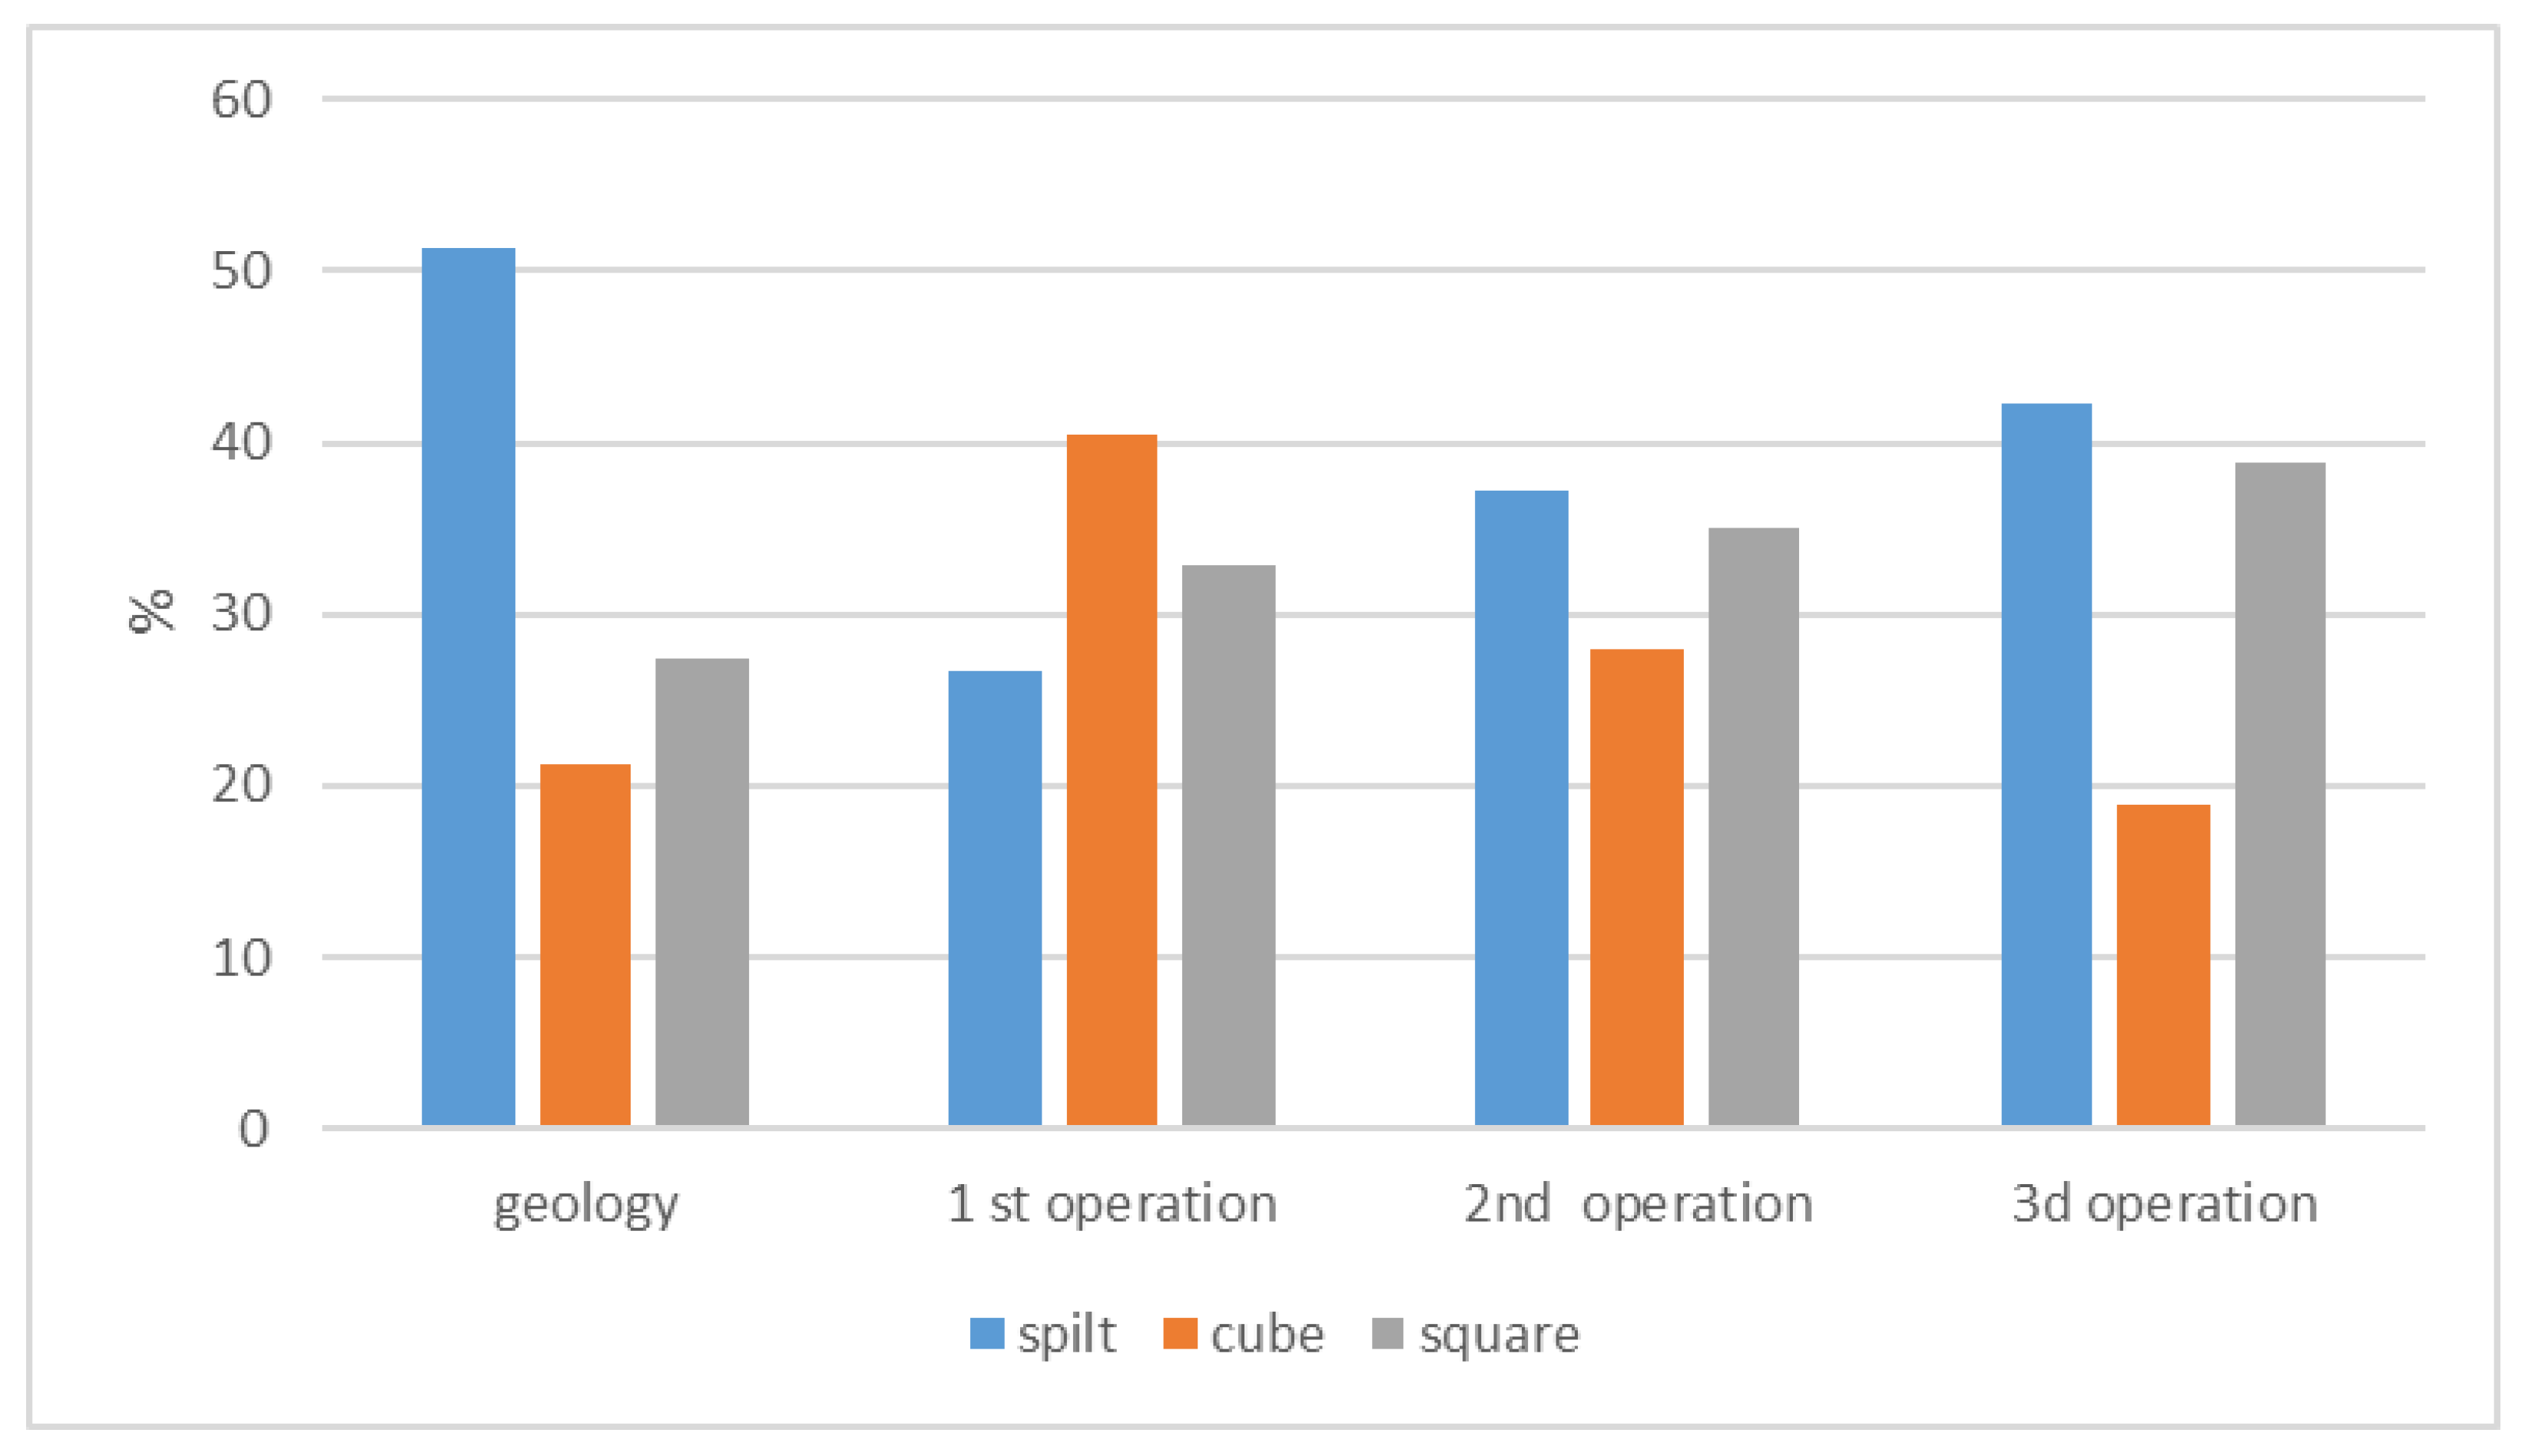
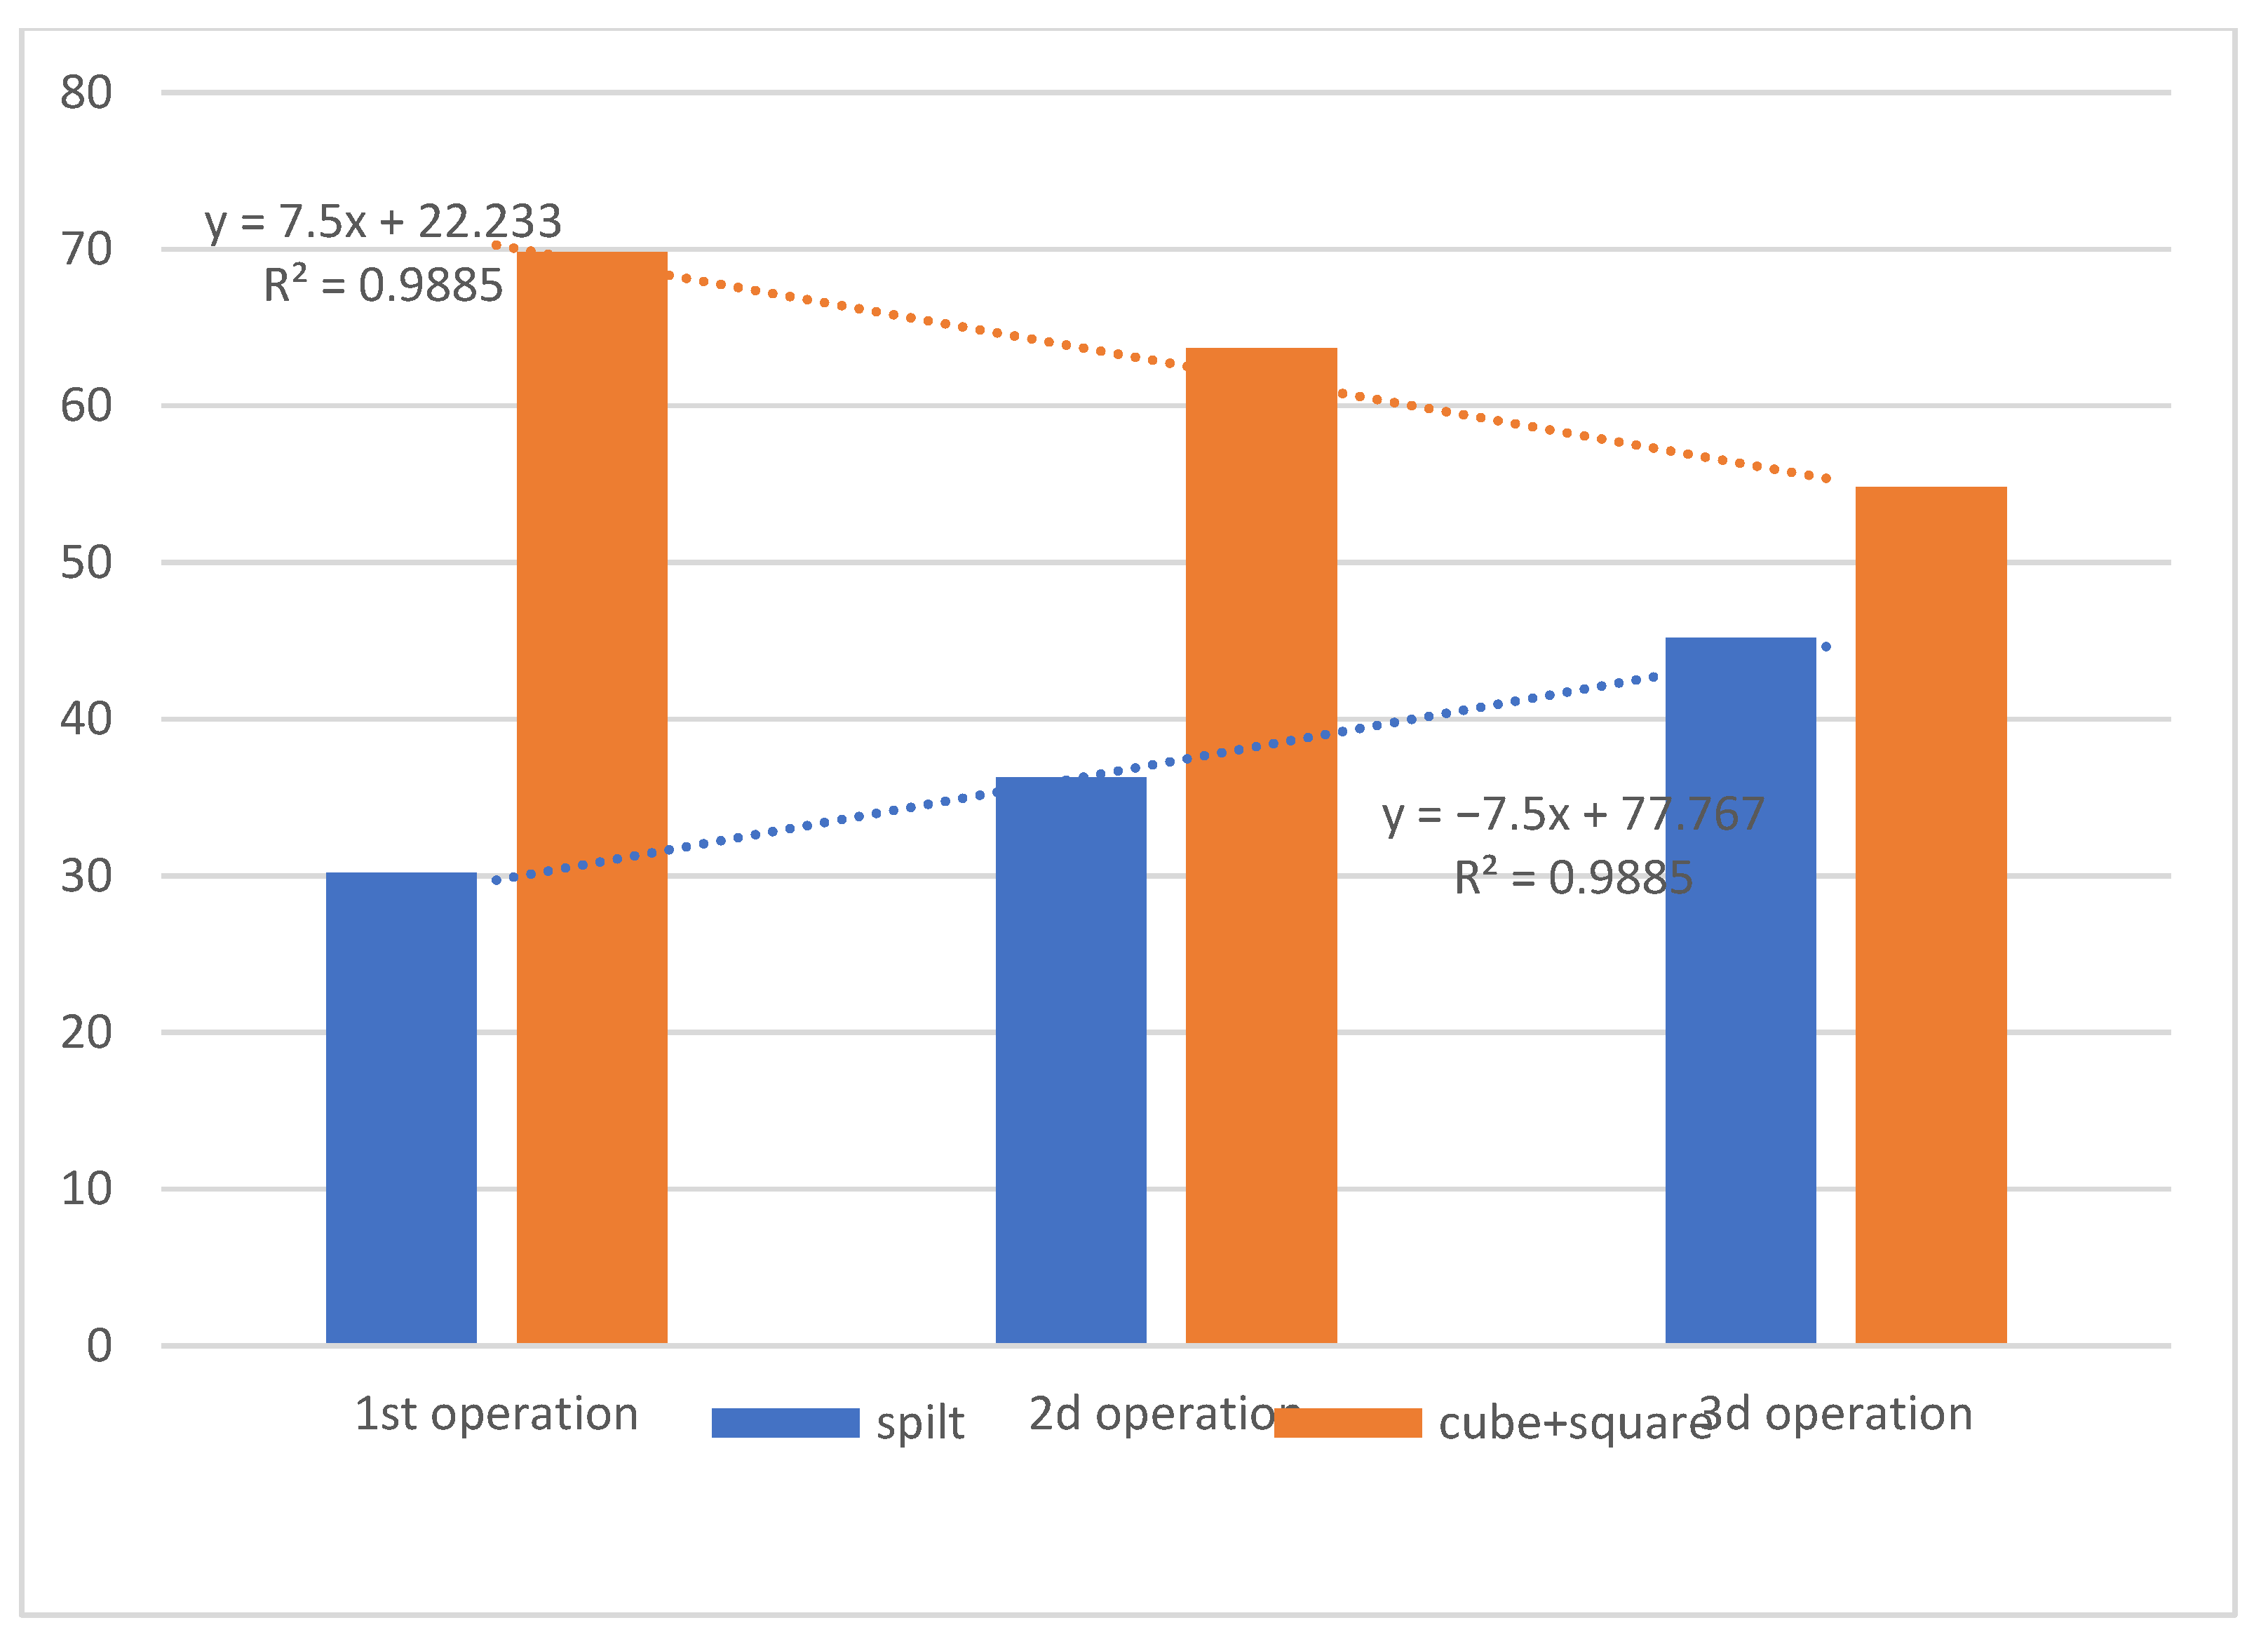
The authors saw a certain ratio in the aggregate form of cube together with square and spilt. At the stage of the geological measurement of the material, their ratio was 50 to 50; at the same time, after blasting, the ratio became 20 to 80, and after the fourth stage, the ratio again approached 50 to 50. This might indicate that during blasting, the destruction is not along the boundaries of the mineral grains, but along the inner section of the grains, or the boundaries of the mineral grains are not completely destroyed (which is more likely). There is a pre-destruction effect, where the weakened bonds between mineral grains are destroyed in the subsequent stages of mining, which means that the resulting material has a special internal energy. This energy can be leveled out in different ways in subsequent stages. If we concentrate only on the average lump size, then, for example, the yield of fines at the blasting stage will be normal, and at the stage of crushing and screening, it will exceed the norm.
A joint evaluation of the size of blasted rock mass pieces with the evaluation of the fragment form may have a greater effect.
-
The experiment conducted in the present paper is labor-intensive and very costly; therefore, the form was evaluated and a simplified division of forms into three classes was made. In reality, these classes may be much more, and therefore, the data for obtaining relationships and interdependencies should also increase. In the authors’ opinion, the existing software complexes for determining the size of pieces in the analysis of grading formation should be finalized with a module for identifying the form. This will reduce the implementation and development resources. For this purpose, the authors developed an algorithm, which was implemented in the software and tested on experimental data. The authors want to emphasize the importance of using the learning method of the algorithm with reinforcement and using a human in the first stages to train the program. The algorithm developed by the authors was tested based on photographs of a mountain range, the pieces’ form was determined during the experiment (manual enumeration of the pieces). The convergence was 80%, which is a good result. This fact showed the workability and feasibility of the assumptions made. However, according to the authors, the development of such a module is an additional scientific work and requires more detailed elaboration and more experimental data.

5. Conclusions

The results of the work indicate the effectiveness of the proposed new approach in monitoring and controlling rock fragmentation. However, the conclusions obtained in the course of the work require verification and an additional experiment with a large amount of data. To do this, a similar experiment must be reproduced at facilities with an installed automated system for the continuous determination of rock fragmentation. The introduction of an additional parameter “lump form” and tracking its change and establishing a connection between the change in shape and technological parameters will provide additional information about the process. As the experimental data show, this parameter will allow us to redefine the target functions when solving the issue of optimizing technological processes and equipment operation.
Research aimed at improving the system for the automated determination of the lumps’ form, the removal of a large amount of data on the form using the system, and the study of form change throughout the technological cycle of open-pit mining enterprises are a continuation of the present work.

Author Contributions

Conceptualization, N.K. and S.K.; methodology, N.K. and S.K.; software, N.K.; formal analysis, N.K. and S.K.; resources, S.K.; writing—original draft preparation, N.K.; writing—review and editing, I.F. and S.K.; visualization, N.K. and S.K.; supervision, I.F.; project administration, N.K. and S.K. All authors have read and agreed to the published version of the manuscript.

Funding

The research was performed at the expense of the subsidy for the state assignment in the field of scientific activity for 2021 No. FSRW-2020-0014.

Institutional Review Board Statement

Not applicable.

Informed Consent Statement

Not applicable.

Conflicts of Interest

The authors declare no conflict of interest.

References

  1. Litvinenko, V.S. Digital Economy as a Factor in the Technological Development of the Mineral Sector. Nat. Resour. Res. 2020, 29, 1521–1541. [Google Scholar] [CrossRef]
  2. Wenjing, L.; Jin, L. Artificial Intelligence and Emerging Digital Technologies in the Energy Sector. Appl. Energy 2021, 303, 117615. [Google Scholar] [CrossRef]
  3. Svetlana, V.; Razmanova, O.; Andrukhova, V. Oilfield service companies as part of economy digitalization: Assessment of the prospects for innovative development. J. Min. Inst. 2020, 244, 482–492. [Google Scholar] [CrossRef]
  4. Corejova, T.; Chinoracky, R. Assessing the Potential for Digital Transformation. Sustainability 2021, 13, 11040. [Google Scholar] [CrossRef]
  5. Vasilyeva, N.V.; Boikov, A.V.; Erokhina, O.O.; Trifonov, A.Y. Automated digitization of radial charts. J. Min. Inst. 2021, 247, 82–87. [Google Scholar] [CrossRef]
  6. Nikolaeva, N.V.; Aleksandrova, T.N.; Chanturiya, E.L.; Afanasova, A. Mineral and Technological Features of Magnetite-Hematite Ores and Their Influence on the Choice of Processing Technology. ACS Omega 2021, 6, 9077–9085. [Google Scholar] [CrossRef] [PubMed]
  7. Li, H.; Li, D.; Zhang, W.; Li, H.; Wang, S.; Wang, H.; Xu, X.; Li, Z. Numerical Damping Calibration Study of Particle Element Method-Based Dynamic Relaxation Approach for Modeling Longwall Top-Coal Caving. Energies 2021, 14, 2348. [Google Scholar] [CrossRef]
  8. Matas, G.; Lantada, N.; Corominas, J.; Gili, J.; Ruiz-Carulla, R.; Prades, A. Simulation of Full-Scale Rockfall Tests with a Fragmentation Model. Geosciences 2020, 10, 168. [Google Scholar] [CrossRef]
  9. Lyana, K.N.; Hareyani, Z.; Shah, A.K.; Hazizan, M.M. Effect of Geological Condition on Degree of Fragmentation in a Simpang Pulai Marble Quarry. Procedia Chem. 2016, 19, 694–701. [Google Scholar] [CrossRef] [Green Version]
  10. Xue, Y.; Zhou, J.; Liu, C.; Shadabfar, M.; Zhang, J. Rock fragmentation induced by a TBM disc-cutter considering the effects of joints: A numerical simulation by DEM. Comput. Geotech. 2021, 136, 104230. [Google Scholar] [CrossRef]
  11. Zhang, F.; Peng, J.; Qiu, Z.; Chen, Q.; Li, Y.; Liu, J. Rock-like brittle material fragmentation under coupled static stress and spherical charge explosion. Eng. Geol. 2017, 220, 266–273. [Google Scholar] [CrossRef]
  12. Hu, W.; Yin, Z.-Y.; Scaringi, G.; Dano, C.; Hicher, P.-Y. Relating fragmentation, plastic work and critical state in crushable rock clasts. Eng. Geol. 2018, 246, 326–336. [Google Scholar] [CrossRef] [Green Version]
  13. Meng, F.; Wong, L.N.Y.; Zhou, H. Rock Brittleness Indices and Their Applications to Different Fields of Rock Engineering: A Review. J. Rock Mech. Geotech. Eng. 2021, 13, 221–247. [Google Scholar] [CrossRef]
  14. Ouchterlony, F.; Sanchidrián, J.A. A review of development of better prediction equations for blast fragmentation. J. Rock Mech. Geotech. Eng. 2019, 11, 1094–1109. [Google Scholar] [CrossRef]
  15. Bamford, T.; Medinac, F.; Esmaeili, K. Continuous Monitoring and Improvement of the Blasting Process in Open Pit Mines Using Unmanned Aerial Vehicle Techniques. Remote Sens. 2020, 12, 2801. [Google Scholar] [CrossRef]
  16. Iakovleva, E.V.; Belova, M.V.; Popov, A.L. Mining and Environmental Monitoring at Open-Pit Mineral Deposits. J. Ecol. Eng. 2019, 20, 172–178. [Google Scholar] [CrossRef]
  17. Shabalov, M.Y.; Zhukovskiy, Y.L.; Buldysko, A.D.; Gil, B.; Starshaia, V.V. The influence of technological changes in energy efficiency on the infrastructure deterioration in the energy sector. Energy Rep. 2021, 7, 2664–2680. [Google Scholar] [CrossRef]
  18. Barykin, S.E.; Borisoglebskaya, L.N.; Provotorov, V.V.; Kapustina, I.V.; Sergeev, S.M.; De La Poza Plaza, E.; Saychenko, L. Sustainability of Management Decisions in a Digital Logistics Network. Sustainability 2021, 13, 9289. [Google Scholar] [CrossRef]
  19. Kondrasheva, N.K.; Kireeva, E.V.; Zyryanova, O.V. Development of new compositions for dust control in the mining and mineral transportation industry. J. Min. Inst. 2021, 248, 272–280. [Google Scholar] [CrossRef]
  20. Yastrebova, K.N.; Moldovan, D.; Chernobay, V. Moldovan Influence of the Nature of the Outflow of Explosion Products from Blast Holes and Boreholes on the Efficiency of Rock Destruction. E3S Web Conf. 2020, 174, 01017. [Google Scholar] [CrossRef]
  21. Singh, P.K.; Roy, M.P.; Paswan, R.K.; Sarim, M.D.; Kumar, S.; Jha, R.R. Rock fragmentation control in opencast blasting. J. Rock Mech. Geotech. Eng. 2016, 8, 225–237. [Google Scholar] [CrossRef]
  22. Singh, B.K.; Mondal, D.; Shahid, M.; Saxena, A.; Roy, P.N.S. Application of Digital Image Analysis for Monitoring the Behavior of Factors that Control the Rock Fragmentation in Opencast Bench Blasting: A Case Study Conducted Over Four Opencast Coal Mines of the Talcher Coalfields, India. J. Sustain. Min. 2019, 18, 247–256. [Google Scholar] [CrossRef]
  23. Ylitalo, R.M.; Zhang, Z.-X.; Bergström, P. Effect of detonator position on rock fragmentation: Full-scale field tests at Kevitsa open pit mine. Int. J. Rock Mech. Min. Sci. 2021, 147, 104918. [Google Scholar] [CrossRef]
  24. Zhang, Z.-X.; Qiao, Y.; Chi, L.Y.; De-Feng Hou, D.-F. Experimental study of rock fragmentation under different stemming conditions in model blasting. Int. J. Rock Mech. Min. Sci. 2021, 143, 104797. [Google Scholar] [CrossRef]
  25. Afanasev, P.I.; Makhmudov, K.F. Assessment of the Parameters of a Shock Wave on the Wall of an Explosion Cavity with the Refraction of a Detonation Wave of Emulsion Explosives. Appl. Sci. 2021, 11, 3976. [Google Scholar] [CrossRef]
  26. Alenichev, I.A.; Rakhmanov, R.A. Empirical regularities investigation of rock mass discharge by explosion on the free surface of a pit bench. J. Min. Inst. 2021, 249, 334–341. [Google Scholar] [CrossRef]
  27. Djordjevic, N. Image based modeling of rock fragmentation. Miner. Eng. 2013, 46–47, 68–75. [Google Scholar] [CrossRef]
  28. Chen, J.; Huang, H.; Cohn, A.C.; Zhang, D.; Zhou, M. Machine learning-based classification of rock discontinuity trace: SMOTE oversampling integrated with GBT ensemble learning. Int. J. Min. Sci. Technol. 2021. [Google Scholar] [CrossRef]
  29. Bamford, T.; Esmaeili, K.; Schoellig, A.P. A deep learning approach for rock fragmentation analysis. Int. J. Rock Mech. Min. Sci. 2021, 145, 104839. [Google Scholar] [CrossRef]
  30. Babaeian, M.; Ataei, M.; Sereshki, F.; Sotoudeh, F.; Mohammadi, S. A new framework for evaluation of rock fragmentation in open pit mines. J. Rock Mech. Geotech. Eng. 2019, 11, 325–336. [Google Scholar] [CrossRef]
  31. Tao, J.; Yang, X.-G.; Li, H.-T.; Zhou, J.-W.; Qi, S.-C.; Lu, G.-D. Numerical investigation of blast-induced rock fragmentation. Comput. Geotech. 2020, 128, 103846. [Google Scholar] [CrossRef]
  32. Zheng, X.; Nguyen, H.; Bui, X.-N. Exploring the relation between production factors, ore grades, and life of mine for forecasting mining capital cost through a novel cascade forward neural network-based salp swarm optimization model. Resour. Policy 2021, 74, 102300. [Google Scholar] [CrossRef]
  33. Abbaspour, H.; Drebenstedt, C.; Badroddin, M.; Maghaminik, A. Optimized design of drilling and blasting operations in open pit mines under technical and economic uncertainties by system dynamic modelling. Int. J. Min. Sci. Technol. 2018, 28, 839–848. [Google Scholar] [CrossRef]
  34. Wang, Y.; Tu, W.; Li, H. Fragmentation calculation method for blast muck piles in open-pit copper mines based on three-dimensional laser point cloud data. Int. J. Appl. Earth Obs. Geoinf. 2021, 100, 102338. [Google Scholar] [CrossRef]
  35. Kulatilake, P.H.S.W.; Qiong, W.; Hudaverdi, T.; Kuzu, C. Mean particle size prediction in rock blast fragmentation using neural networks. Eng. Geol. 2010, 114, 298–311. [Google Scholar] [CrossRef]
  36. Aleksandrova, T.; Nikolaeva, N.; Afanasova, A.; Romashev, A.; Kuznetsov, V. Selective Disintegration Justification Based on the Mineralogical and Technological Features of the Polymetallic Ores. Minerals 2021, 11, 851. [Google Scholar] [CrossRef]
  37. Gorelova, I.; Dmitrieva, D.; Dedova, M.; Savastano, M. Antecedents and consequences of digital entrepreneurial ecosystems in the interaction process with smart city development. Adm. Sci. 2021, 11, 94. [Google Scholar] [CrossRef]
  38. Zhukovskiy, Y.L.; Batueva, D.E.; Buldysko, A.D.; Gil, B.; Starshaia, V.V. Fossil Energy in the Framework of Sustainable Development: Analysis of Prospects and Development of Forecast Scenarios. Energies 2021, 14, 5268. [Google Scholar] [CrossRef]
  39. Filatova, I.; Nikolaichuk, L.; Zakaev, D.; Ilin, I. Public-Private Partnership as a Tool of Sustainable Development in the Oil-Refining Sector: Russian Case. Sustainability 2021, 13, 5153. [Google Scholar] [CrossRef]
Figure 1. Scheme of technological processes at a mining production.
Applsci 11 10848 g001
Figure 2. Scheme of the information-analytical model. I and A are the two components of this model. Component I describes the information model and a list of the main variables. Additional parameters of the existing model are highlighted in red with N*. Black, solid lines highlight operations that are typical for mining enterprises.
Applsci 11 10848 g002
Figure 3. Algorithm of the system for recognizing the distribution of lumps of rock mass by their fragment form.
Applsci 11 10848 g003
Figure 4. Experimental rock samples.
Applsci 11 10848 g004
Figure 5. The area of the rock mass explosion.
Applsci 11 10848 g005
Figure 6. The experiment results: overall fragment form distribution for all experiments.
Applsci 11 10848 g006
Figure 7. The experimental results: general fragment form distribution (mean values for three experiments).
Applsci 11 10848 g007
Figure 8. The experimental results: comparison of the distribution of a cubic together with square and spilt fragment form based on the mean values for the three experiments.
Applsci 11 10848 g008
Figure 9. Experimental results: distribution comparison of cubic and square and spilt fragment forms based on the mean values for the three experiments. Approximating curve shows these changes.
Applsci 11 10848 g009
Figure 10. The experimental results: comparison of cubic together with square and spilt fragment forms’ distribution based on the average values for the 1st experiment. Approximating curve shows these changes.
Applsci 11 10848 g010
Figure 11. The experimental results: comparison of cubic together with square and spilt fragment forms’ distribution based on the mean values for the 2nd experiment. Approximating curve shows these changes.
Applsci 11 10848 g011
Figure 12. The experimental results: comparison of cubic together with square and spilt fragment forms distribution based on the mean values for the 3rd experiment. Approximating curve shows these changes.
Applsci 11 10848 g012
Figure 13. Fragment form distribution by fractions for the 1st stage of the first experiment.
Applsci 11 10848 g013
Figure 14. Software interface for defining the fragment form distribution.
Applsci 11 10848 g014
Figure 15. Stages of rock fragmentation recognition in the Power Sieve3 software (PS3).
Applsci 11 10848 g015
Publisher’s Note: MDPI stays neutral with regard to jurisdictional claims in published maps and institutional affiliations.

