1. Introduction
As an important industry in the national economy, games play an important role in social development [
1]. Along with the rapid development of mobile devices, such as smartphones, the mobility and portability characteristics of games have increased [
2]. The mobile phone user market has gradually matured to become the main means of mobile electronic entertainment [
3]. However, it is worth noting that the user’s understanding of an application is formed in stages [
4]. The user’s initial impression may not be consistent with the actual game, and the icon sometimes largely determines the first impression [
5]. If the impression formed at the icon stage does not match with the game’s function, it may create resistance to the game’s entry into the market and may even directly cause business failure. For example, some game users are not good at games that require frequent finger operations and prefer non-action games. If the icons of certain strategy or business simulation games seem to match those of action games better, this type of user may avoid downloading or trying; conversely, some users who prefer action games may be misled into downloading them. The perceptual matching of icons and gameplay is an important part of the user experience in game interface design. In addition, for developers and designers, judging the matching relationship between icons and gameplay in the early stages of design, such as the manuscript stage, can help to save a lot of time and labor costs. Therefore, it is also important to pay attention to the perceptual quality of game icon manuscript design.
1.1. Character-Centric Mobile Game Icon Design
Icons play an important role in guidance and execution in human–computer interaction [
6]. A successful icon can eliminate the communication barrier between the computer and user, making the user’s operation process easy and smooth [
7]. However, the icon needs to provide a large amount of information that is highly abstract in a limited space [
8]. Sometimes, the meaning of design is difficult for users to recognize and understand. Among the many types of games available today, with the exceptions of simple puzzle-solving, racing, music, or keyboard games, a large number of games involve characters [
9]. Character design is responsible for the critical task of giving life and soul to the game, which determines the entertainment level to a large extent [
10]. In the process of commercial promotion, characters are often used as an identification and selling point [
11]. Therefore, game characters are usually used as an essential design element at different levels of game interface design.
1.2. Gameplay and Perceptual Quality of Icons
With the continuous emergence of various game applications, comprehensively meeting players’ needs has become the common pursuit of every game application development company. Identifying and selecting a particular game is closely related to gameplay, theme, and other factors. Awareness of the influence of emotional factors in the decision-making process is becoming increasingly prominent [
12]. Understanding how to increase the perceptual quality of the game application through design allows users to intuitively perceive whether the gameplay is in line with their interests at the initial stage and is also incredibly critical in game design research [
13].
Generally, forward-looking market research should be conducted to obtain user impressions and preferences. They can be defined as the goals for affective design in the later stages [
14]. Based on users’ needs, designers can use their subjective experience and aesthetic skills to create icons. Each game’s design also tends to convey design ideas and emotions to users. This emotional attraction is aimed at users’ needs and, thus, attracts their attention [
15]. It can be summarized by the target feeling, determined by the game’s function and market positioning [
16]. The specific target feeling can arouse the user’s attention, interest them in the application, and facilitate download or purchase [
17].
Kansei engineering, founded by Mitsuo Nagamachi, aims to develop products and services by translating the customer’s psychological feelings and needs into parameters [
18]. It has been widely used in various fields related to user interface design. Chen, Xu, and Yang [
19] researched the culture-adapted user interface design method for mobile phones; Jylhä [
20] researched the relationship between consumer perceptions and mobile game icon success; Chen [
21] examined the relationship between the various rear cameras in smartphones and consumer perceptions. As a development and extension of Kansei engineering theory, perceptual matching has also begun to be carried out in the research of various products, such as the design of vehicles [
22], beverage bottles [
23], vehicle interiors [
24], and digital cameras [
25]. Many methods and models of psychology and statistics have been studied and applied, for example, the principal component analysis method [
26], cluster analysis method [
27,
28,
29], multiple regression analysis method [
30], and scenario analysis [
31].
However, there is no systematic research on the relationship between the perceptual attributes of game icon design and gameplay. The present study focused on the design content of the game icon manuscript, aiming to verify whether the game icon’s design can cause players to have a certain feeling with regard to gameplay as expected by the designers. In the evaluation procedures of this study, the subjects were required to perform classification tasks and semantic differential method (SD) experiments [
32] that measured their perceptions to game icons and gameplay from a visual and emotional perspective. Then, through the results of the classification tasks and the correlation analysis, the accuracy of both the visual matching and affective matching of the game icons was measured. After the analyses, the icons with the best-perceived quality were extracted as the evaluation result. The analyses and discussions of the reasons for the high scores of those icons can help designers and developers re-evaluate their design work in order to reduce the possibility of emotional dissonance and improve user satisfaction.
2. Perceptual Matching
The perceptual matching method is derived from psychological research and is usually used to describe the strength of the correlation between a phenomenon and the human response it evokes [
33]. For example, Lechelt, Eliuk, and Tanne [
34] studied the asymmetry of perceptual orientation through the spatial comparison of vision and touch. Stones [
35] studied the relationship between chronic disease pain and the affective quality of graphics design. Özcan, Cupchik, and Schifferstein [
36] evaluated affective quality differences in the auditory and visual aspects of product appearances and their potential contribution. Dai, Cone, and Moher [
37] examined the role of visual attention in healthy eating intentions and choices. The common purpose of these studies was to establish a connection between human perceptions and objects to understand or predict reactions. In this research, authors use the perceptual matching method to evaluate the perceptual quality of character-centric game icon design, describing the interaction between the user perceptual field and user interface design field. As an evaluation mechanism, the perceptual matching method can quantify the strength of the matching relationship and determine the most promising design among many alternatives [
38].
Perception is the organization, identification, and interpretation of sensory information to represent and understand the presented information or environment [
39]. Two types of consciousness must be considered: phenomenological (any observable and physical event) and psychological [
40]. The difference between the two can be easily proven by the fact that the former involves rich visual sensations, while the latter involves emotions caused by feelings. This disentanglement of perception helps to clearly explain user evaluations obtained from different sources. Therefore, perceptual matching is divided into two aspects in this research: visual matching and affective matching.
2.1. Visual Matching
When using visual perception to describe application products, people will organize the information they see and provide definitions or explanations for the attributes based on observable characteristics [
41]. Users are accustomed to categorizing presented products into a category to help them understand the products’ attributes according to the previously developed cognitive models that they have in their minds. In other words, defining categories is the most intuitive way for humans to describe visual presentations [
42]. For example, when a user is presented with images of “Clash Royale”, the category that they are most likely to name is the strategy game category. This aligns with the cognitive theory that human beings’ first perception allows them to judge “what it is” based on visual information [
43].
In this article, visual matching describes the correlation between game icon design and gameplay. The strength of this matching relationship reflects the accuracy of the game icon’s design for guiding users to perceive game attributes. An accurately matched game icon design can guide the user’s perception in the expected direction, increase recognition, and lay the foundation to attract more appropriate users.
2.2. Affective Matching
According to human cognition research, after visual perception, people tend to derive deeper perceptions from their emotional state [
44], which is in line with the logical cognitive process [
45]. The user’s affective perception is expressed as the acquired feeling, corresponding to the target feeling, and it describes the user’s emotional impression of the product. According to the literature on affective design, both the target feeling and the acquired feeling can be described by a set of Kansei words [
46]. Users usually use several descriptive adjectives to express their feelings [
47]. Similarly, when advertising to consumers, descriptive adjectives are used to briefly convey the feelings promoted by the product. Using these words, the user side and the design side can communicate on the same level.
Affective matching is defined as the matching relationship between emotional state and emotional stimulus [
48]. This article describes the correlation between the target emotional perception in game interface design and the user’s acquired emotional perception. In other words, it is used to investigate the relationship between the user’s feeling and the attractiveness of the icon to determine whether the icon evokes the same feelings as the promotional materials in the user. The matching quality can be determined based on the similarity or correlation between two sensations in different domains. A successfully designed icon will arouse the user experience that the designer hopes to. Therefore, matching relationships should be useful for predicting user feedback and determining icon development and design style.
3. Method and Procedure
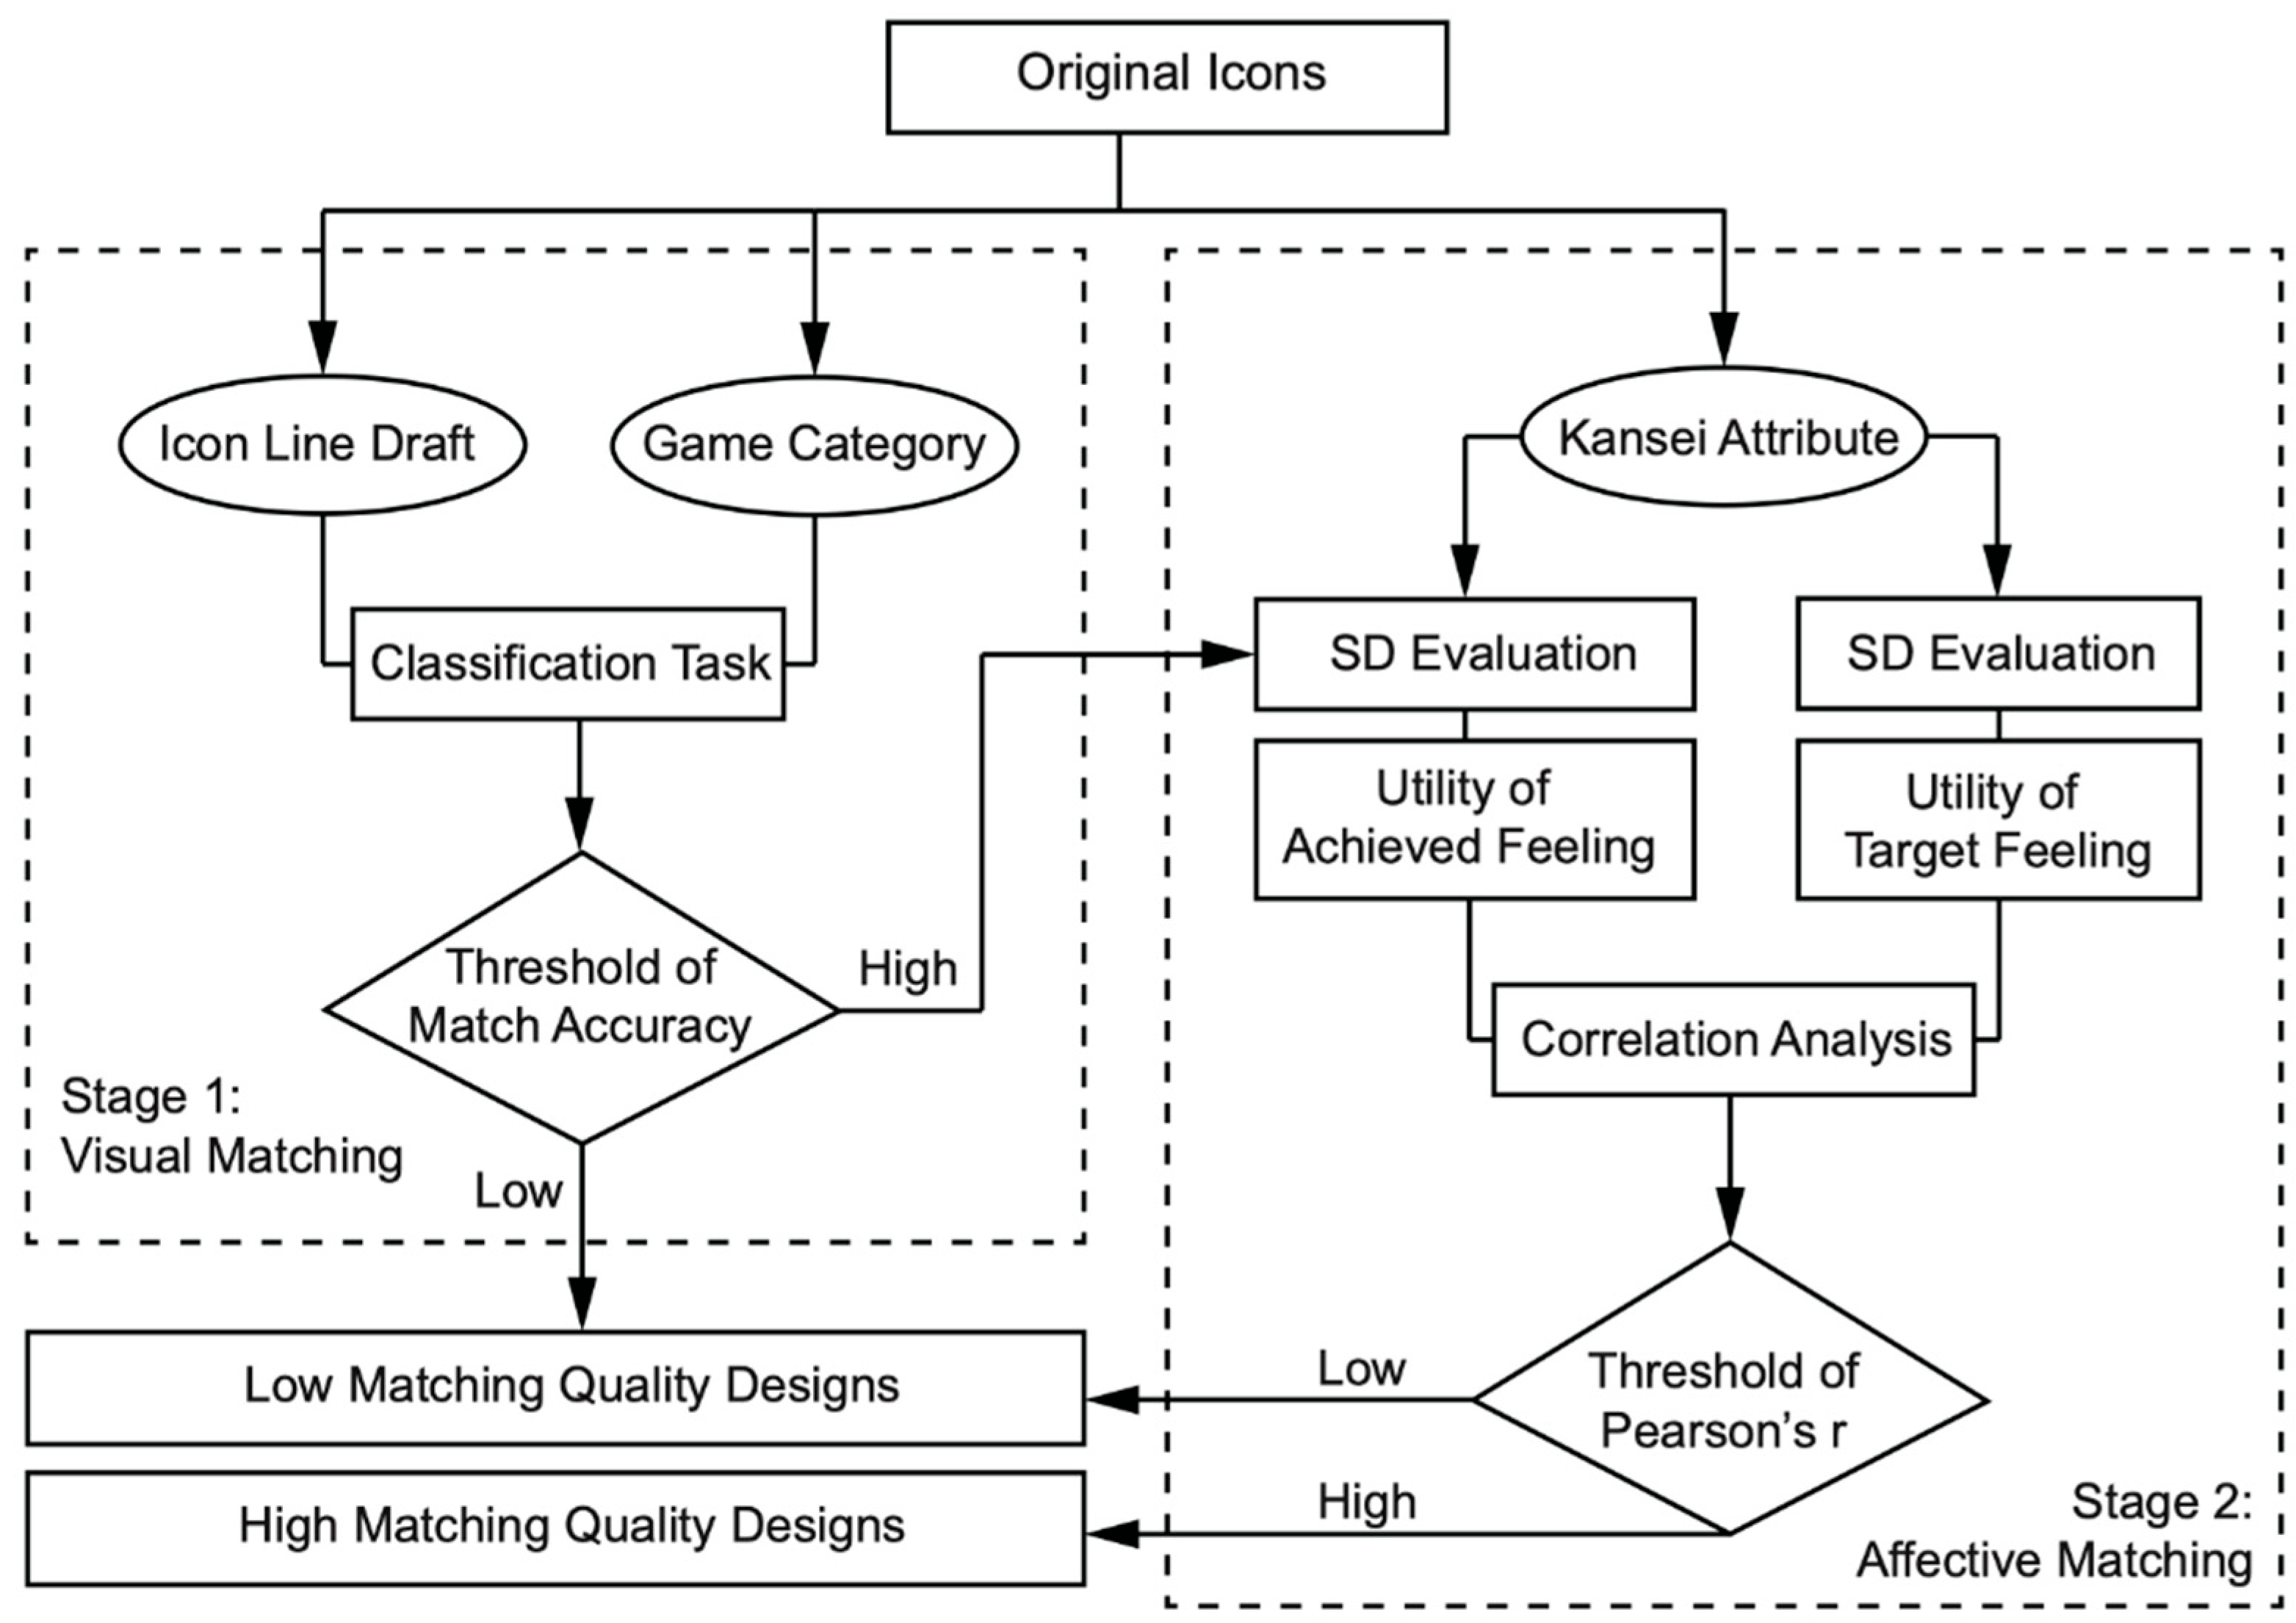
In this study, a perceptual matching method was used to evaluate the character-centric design of game icons, and the impact of game icons on human perception from visual, semantic, and aesthetic perspectives was measured. The evaluation procedure consisted of two stages, as shown in
Figure 1. First, the original icon material and the appropriate semantic space for the SD experiment were prepared. Then, the evaluation procedure was performed as follows: Stage 1: Visual matching experiments conducted by classification task. In this task, subjects were required to classify game icon samples into 6 categories, and the matching quality was evaluated in the subsequent accuracy analysis. Stage 2: Affective matching, starting with the SD experiment, quantifies the acquired feeling and target feeling evoked by the highly matching icons with specific values. Since affective perception is based on visual perception, in stage 2, 60 highly visually matching icons were selected as the objects to be analyzed. That means that objects for stage 2 should be at least obviously relevant to a certain type of game. The correlation between the acquired feeling and target feeling of the analyzed icons was evaluated through correlation analysis. Finally, we judged the matching quality of the icon design samples according to their scores in both stages. Thus, a batch of game icon designs with high matching quality and low matching quality was obtained.
3.1. Material Preparation
3.1.1. Original Material
All icon samples were collected from current rankings on the Apple and Android markets. As shown in
Table 1, this study collected game icons for strategy, role-playing, action, adventure, business simulation, and trading card games. All of the icons were collected from pretest game applications that could be downloaded and used by mainland China accounts. A total of 300 icons were collected. After removing some icons that were very similar or contained many distracting factors, such as text, 200 samples were selected for this research. These icon samples were marked as P1, P2…P200.
3.1.2. Semantic Space
In the affective matching stage, the SD experiment needs to convert feelings into specific values. Before starting, to define an effective semantic space, five professional designers, including staff from Tencent Games(Shenzhen), Shanda Games(Shanghai), and NetEase Games(Guangzhou), and two language experts were selected to form an expert group. They brainstormed and discussed terms that are highly related to internet applications. Kansei words were collected from many sources, including the related literature, advertisements, reviews, and user feelings.
For example, users may use “hot-blooded”, “masculine”, or “straightforward” to describe their impression of “King of Fighters”. In contrast, they may use words such as “kind”, “mysterious”, or “exquisite” to describe their feelings about “Monument Valley”. Based on the Kansei words collected by brainstorming, unrelated words were filtered through internet game and industry language experts, and similar words were merged. Finally, 12 pairs of adjectives were defined as bipolar pairs of Kansei words [
49], as shown in
Table 2.
3.2. Stage 1: Visual Matching
3.2.1. Subject
A total of 50 college students (23 males and 27 females, aged 18 to 23 years) were selected to complete the classification task. Students in this age group are usually considered internet natives in China, as they have had extensive contact with the internet and electronic products since an early age. In addition, they all come from an art background university, which has a strong correlation with media and games. Relatively, they have a basic interest and knowledge of games.
3.2.2. Material
Two hundred icon samples that were screened and processed were used as materials for the matching stage. Each sample was processed into a corresponding document by the designer using professional software. Only the line draft of the icon was retained, and the color, text, developer, etc., were excluded to eliminate interference.
3.2.3. Procedure
The entire classification task was conducted online, and the subjects were kept unaware of the original category of the game icons. The icons were randomly shuffled and arranged in a random order in an electronic document to present the subjects with a quick perception and classification experiment. At the beginning of the task, the subjects were summoned online, and the key definitions of the six game categories were introduced in about five minutes. Then, they were asked to visually sort the prepared icon files into one of the six game categories. To avoid experimental failure caused by an excessively long classification time, the 200 processed icon samples were divided into 10 groups of 20 icons, and the 10 groups were distributed to the same batch of subjects for classification experiments over a 10-day period. The main advantage of using this classification task to collect perception data is its ability to obtain the user’s instinctive judgment of differences. Moreover, in order to strengthen the participants’ cognition and memory, the brief definitions of the six categories appeared each time before the start of the classification tasks.
3.2.4. Result
After the completion of the classification task, a 6 × 200 table was generated in which each sample had 50 choices for related categories created by the subject. Equation (1) was used to determine the match rate:
where
represents the sample number m,
represents the classification of the sample into a certain category,
is defined as the frequency at which the sample is classified into each game category, and
is the total frequency at which a subject classifies the sample. The obtained percentage (
) was defined as the matching rate of the sample with the specific category and was used to indicate their correlation.
According to the classification task results, the matching rate (
) of each sample with the six categories was calculated. As shown in
Table 3, each category received a specific percentage score. The higher the score, the stronger the correlation is between the sample and the category. Based on the matching accuracy score, 10 icon samples with a relatively high degree of matching were selected from each category based on the results at the visual matching stage. The 60 icons shown in
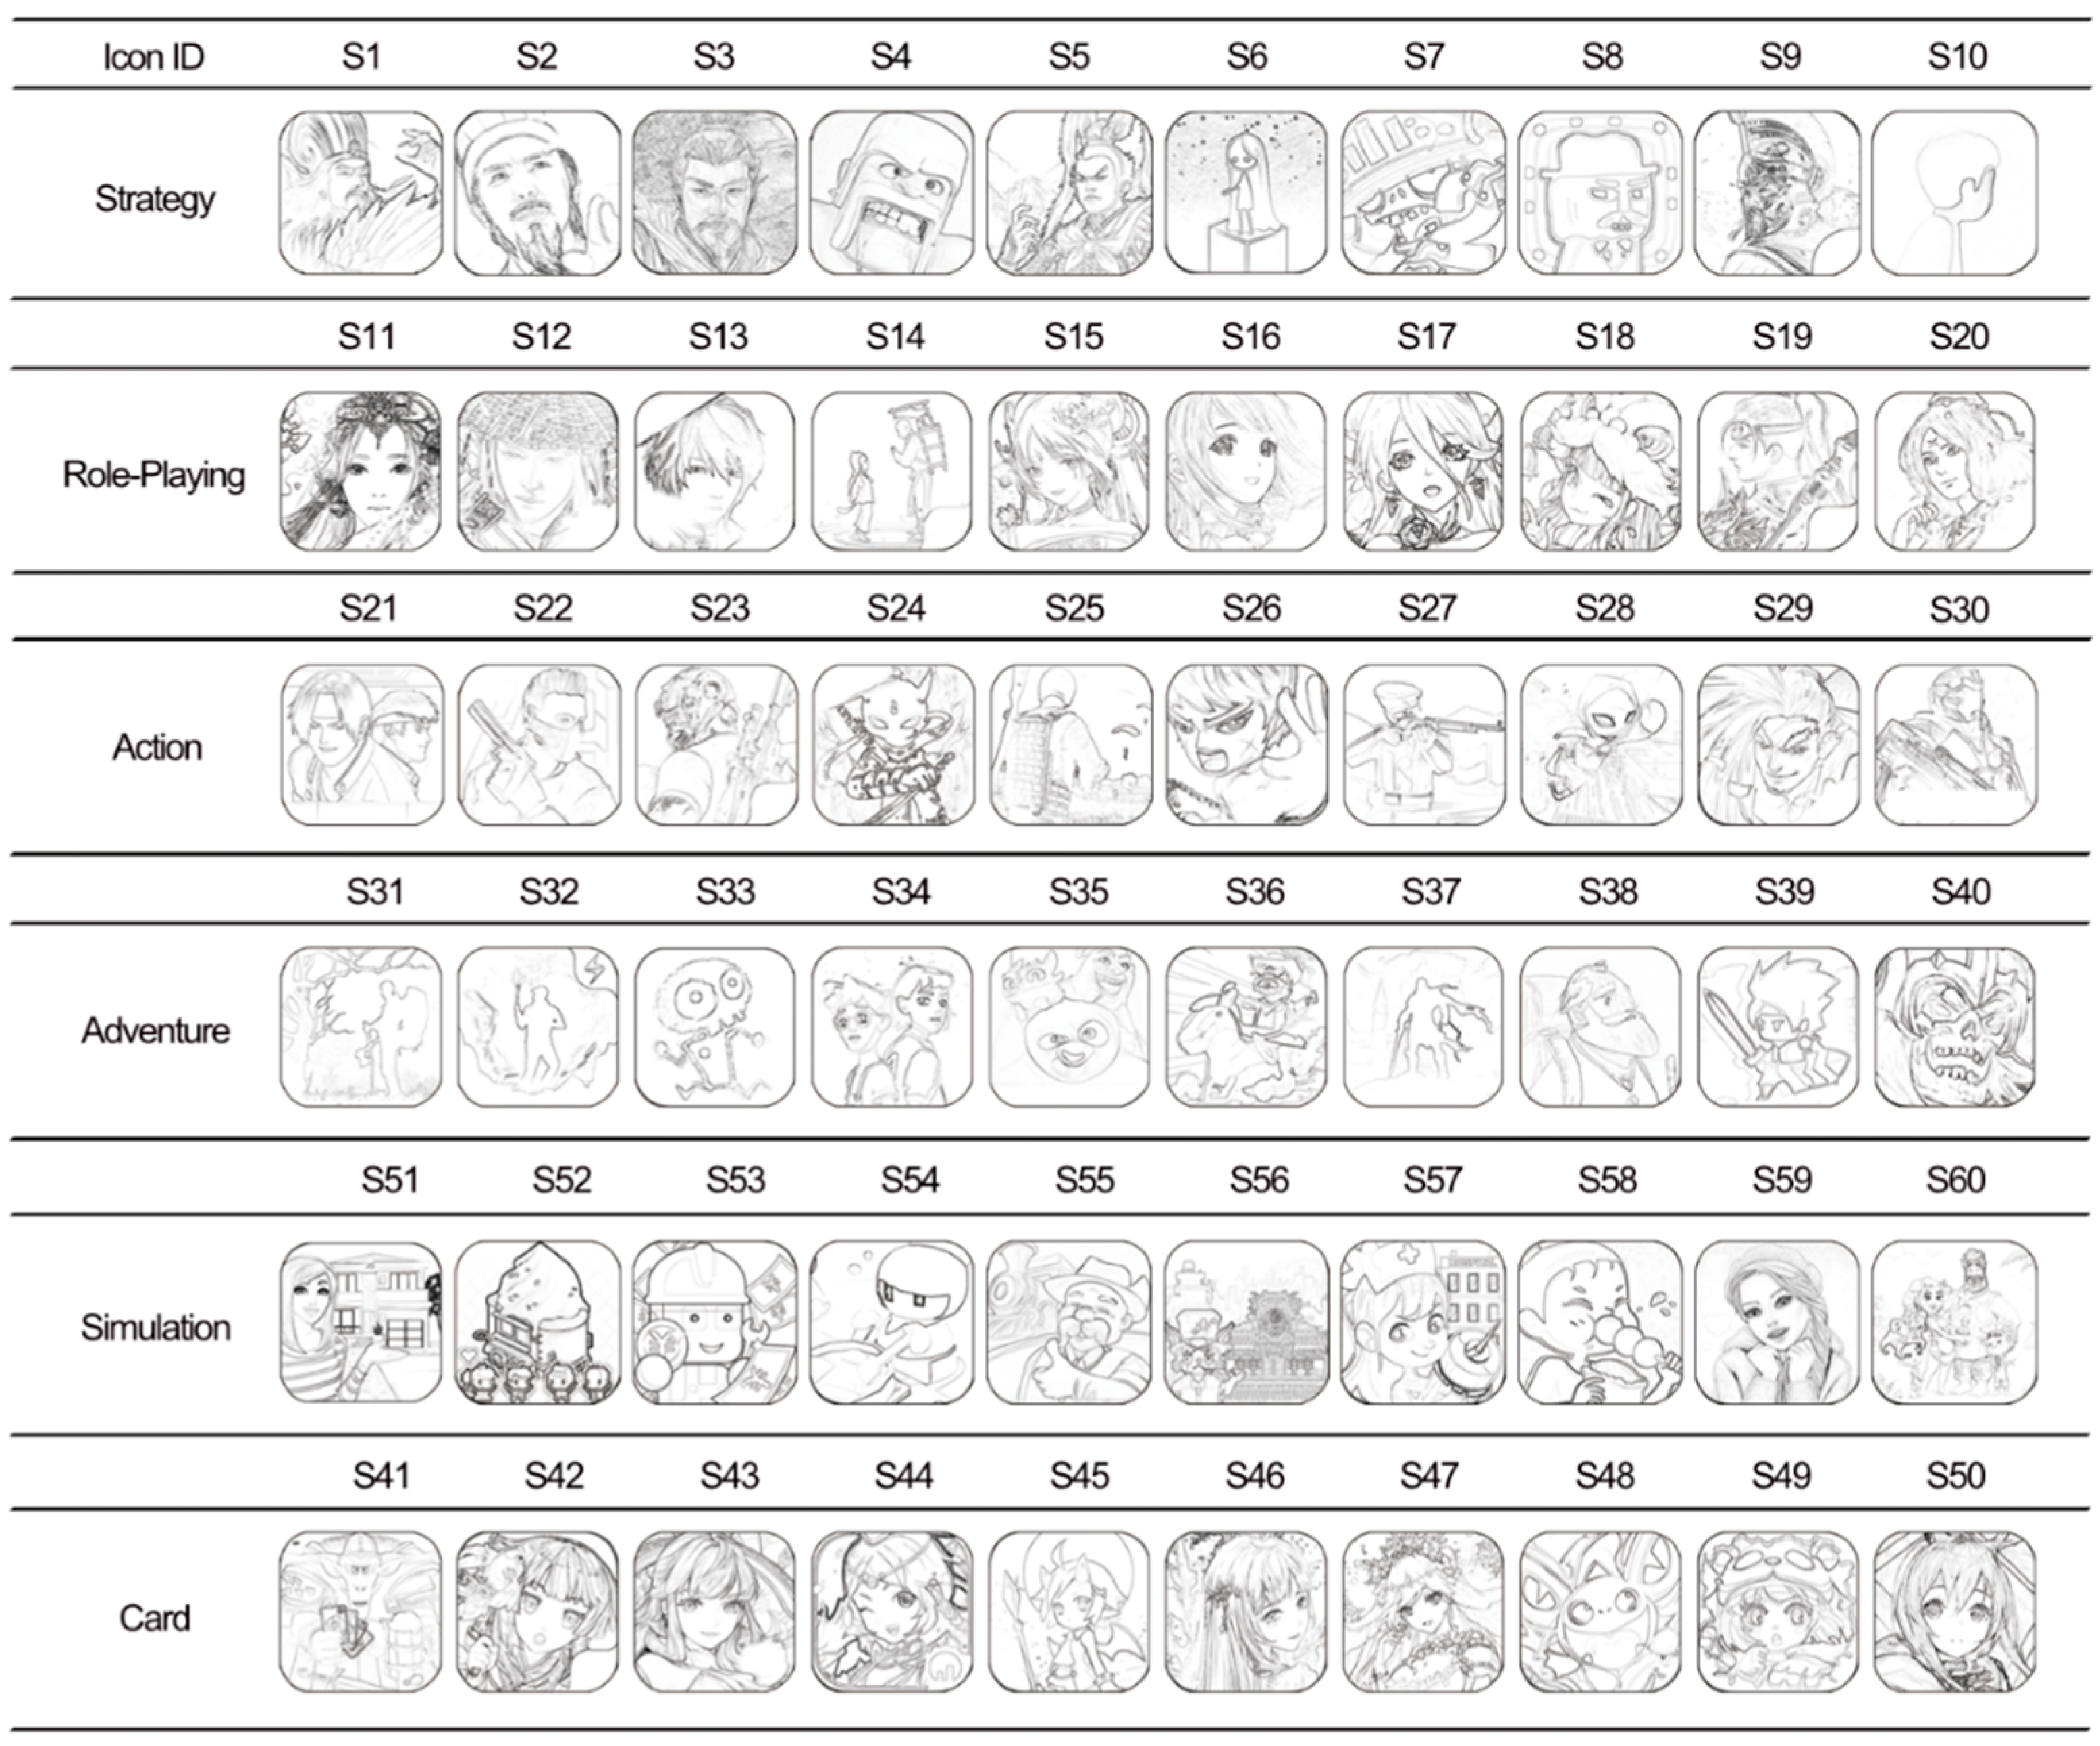
Table 4 were used as materials for the affective matching experiment for further research, and the data were also used as reference and basis in the result and discussion section below.
3.3. Stage 2: Affective Matching
3.3.1. Subject
Since the target feeling and the acquired feeling are evoked by different domains, they must be estimated separately by the user and the designer. The expert group consisted of 25 professionals employed by mainland Chinese game development companies. They worked as game designers and planners and were familiar with the game industry’s design strategies. The user group consisted of 25 undergraduates (12 males and 8 females) with a design background. The experiment was conducted in Chinese and was approximately translated into English in this article.
3.3.2. Material
As shown in
Figure 2, 60 highly matching game icon line drafts selected from the visual classification experiment were used as experimental materials for the second stage. For convenience in the experiments and statistical analyses, the selected icons were renumbered from S1 to S60. The SD assessment questionnaire included the 12 previously defined Kansei attributes. They were listed on an e-questionnaire platform, with one word on the left and its antonym on the right. Evaluations were conducted with a seven-point Likert scale, “−3” means very close to the word on the left, “3” means very close to the word on the right, and “0” means between the two terms. The Kansei words used in the experiment were written in Chinese, and the experiment was also carried out in Chinese; they are approximately translated into English in this article.
3.3.3. Procedure
To determine the target feelings evoked by the samples, the expert group subjects were asked to evaluate six game categories on an e-questionnaire platform. The user group subjects were asked to conduct the same SD experiment on the e-questionnaire platform at the same time, but the objects were 60 icons selected from stage 1. For each category, or each icon, they chose their suitable score for each Kansei attribute.
3.3.4. Result
After the SD experiment, the number of scores from the expert group was 25 × 6 × 12, and the number of scores from the user group was 25 × 60 × 12. According to the method devised by Jindo and Hirasago [
50], the average of each evaluation score was used as the result for each object on the certain Kansei attribute.
4. Result and Discussion
4.1. Visual Matching
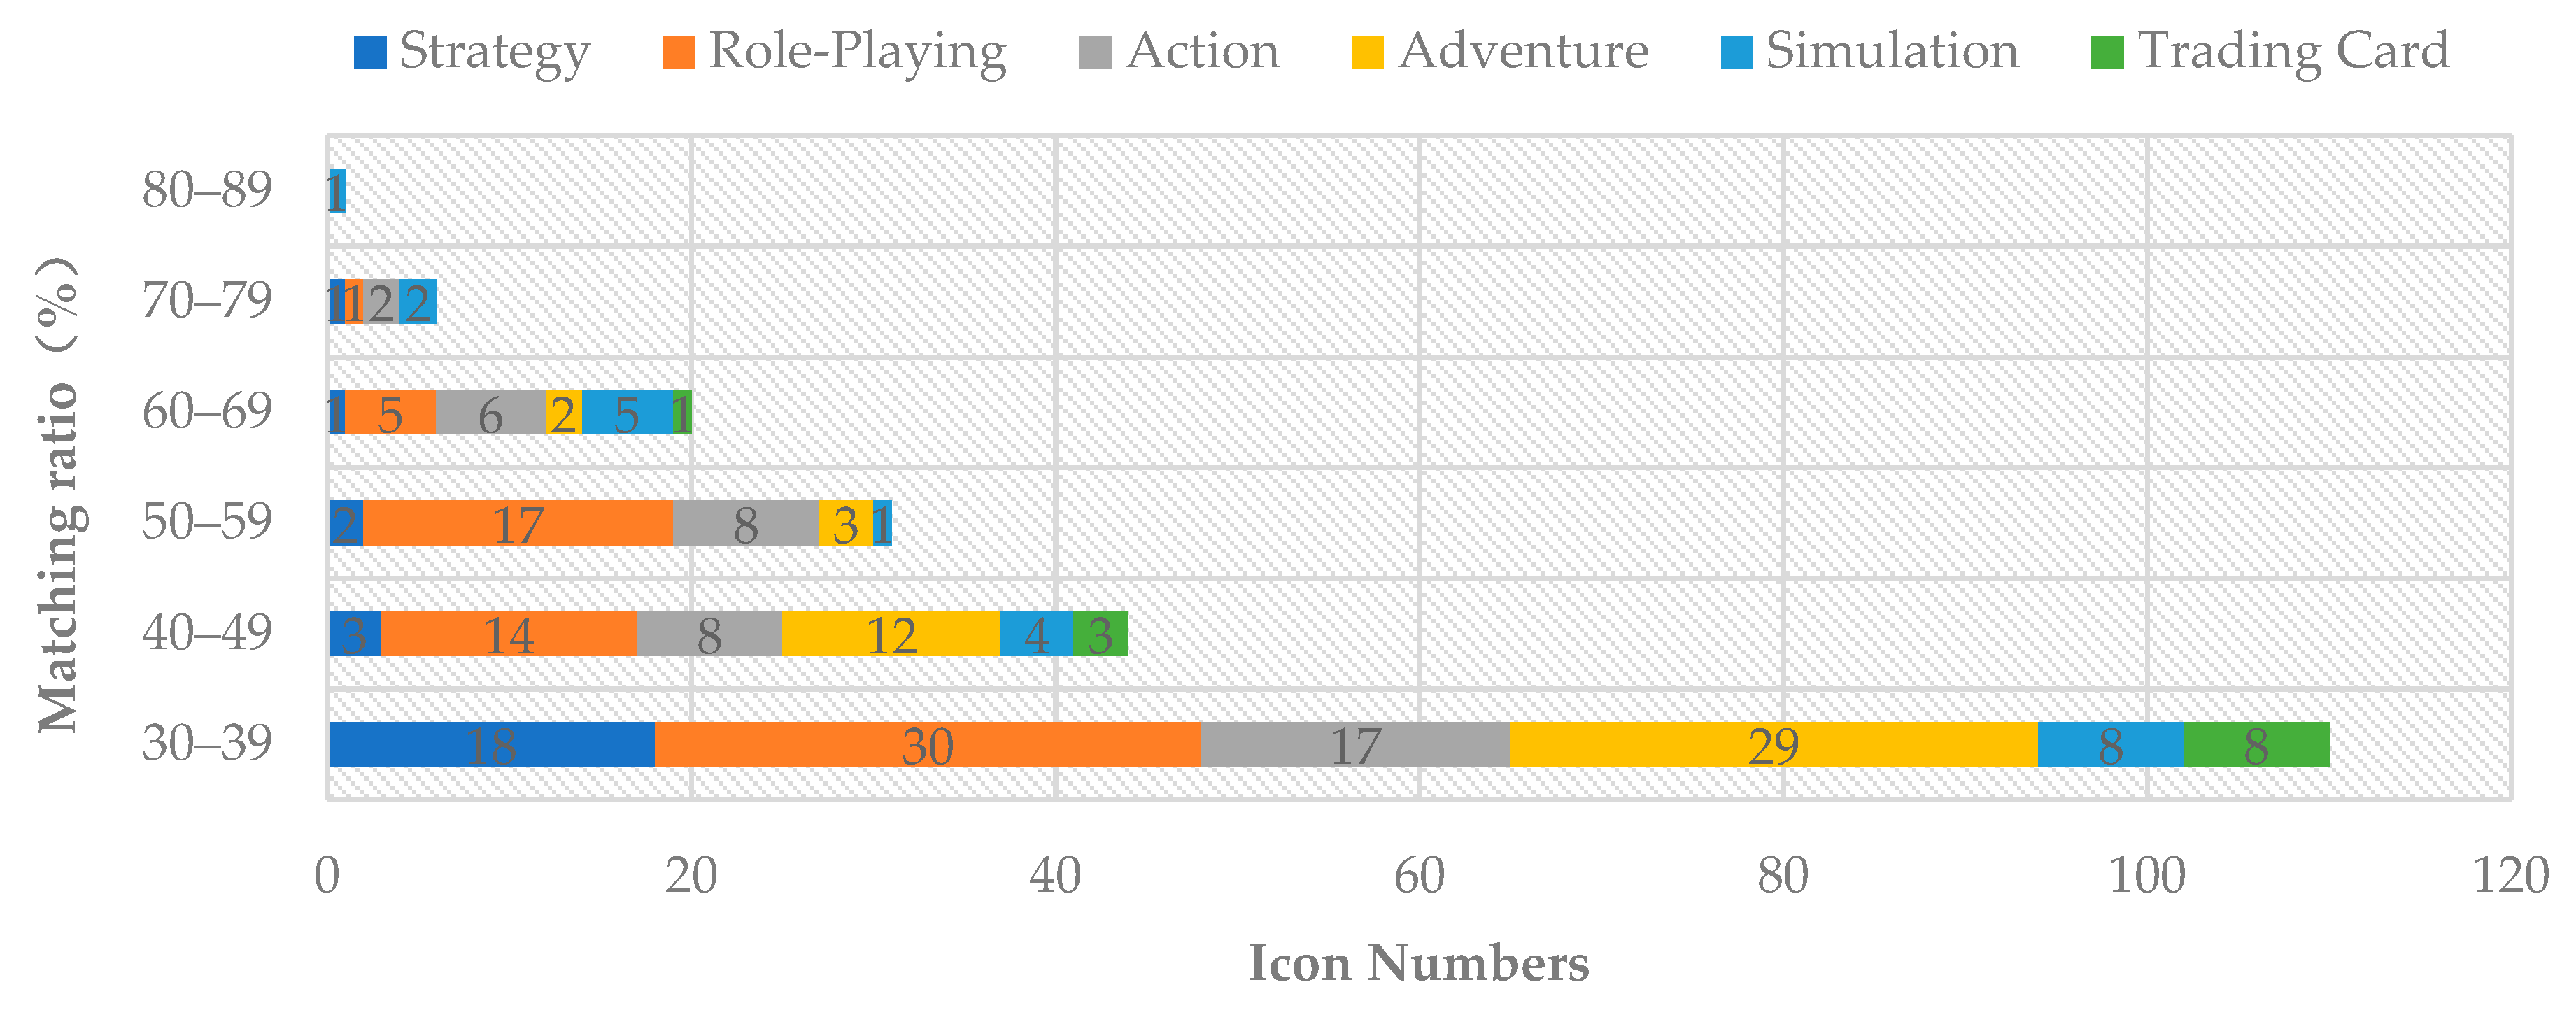
The match ratio data for the 200 icons in six categories in
Table 1 were counted as a result of visual matching, and a stacked bar chart was generated, as shown in
Figure 3. In general, simulation games and action games had a higher degree of matching, while trading card games had a lower degree of matching. This shows that icons that use a character as a marketing element for simulation and action games had better recognition. In contrast, trading card games were difficult to identify through icons. Therefore, developers of trading card-type games may need to advance their icon design in this direction to improve gameplay recognition when using characters as elements.
4.2. Affective Matching
After the SD experiment, 60 acquired feeling value (V
A) samples and the target feeling values (V
T) of six game categories were obtained. They are presented as 12 rows of evaluation scores corresponding to 12 Kansei attributes in
Table 5. V
T shows several key target feelings promoted by the game icons in each category. For example, the Kansei words relating to the strategy category included “solemn”, “mysterious”, and “exquisite”. In contrast, the images depicted in the action category were completely different, conveying Kansei words such as “passionate”, “masculine”, and “straightforward”. When the user feeling aroused by the icon design is consistent with the design strategy and positioning, the design is considered to be highly matched with the category.
To quantify the quality of affective matching, Pearson’s correlation analysis was performed on V
A and V
T. First, the V
T score of the game was input into SPSS as the target perception criterion. Then, correlation analysis was performed on the V
A of each sample with the corresponding V
T. The Pearson product–moment correlation coefficient (Pearson’s r) represents the strength of the correlation between the acquired feeling and the target feeling and the quality of the affective matching. A positive correlation means that the user’s feeling is consistent with the feeling promoted by the design strategy, while a negative correlation means the opposite. A correlation close to zero is considered irrelevant. The results are shown in
Table 6.
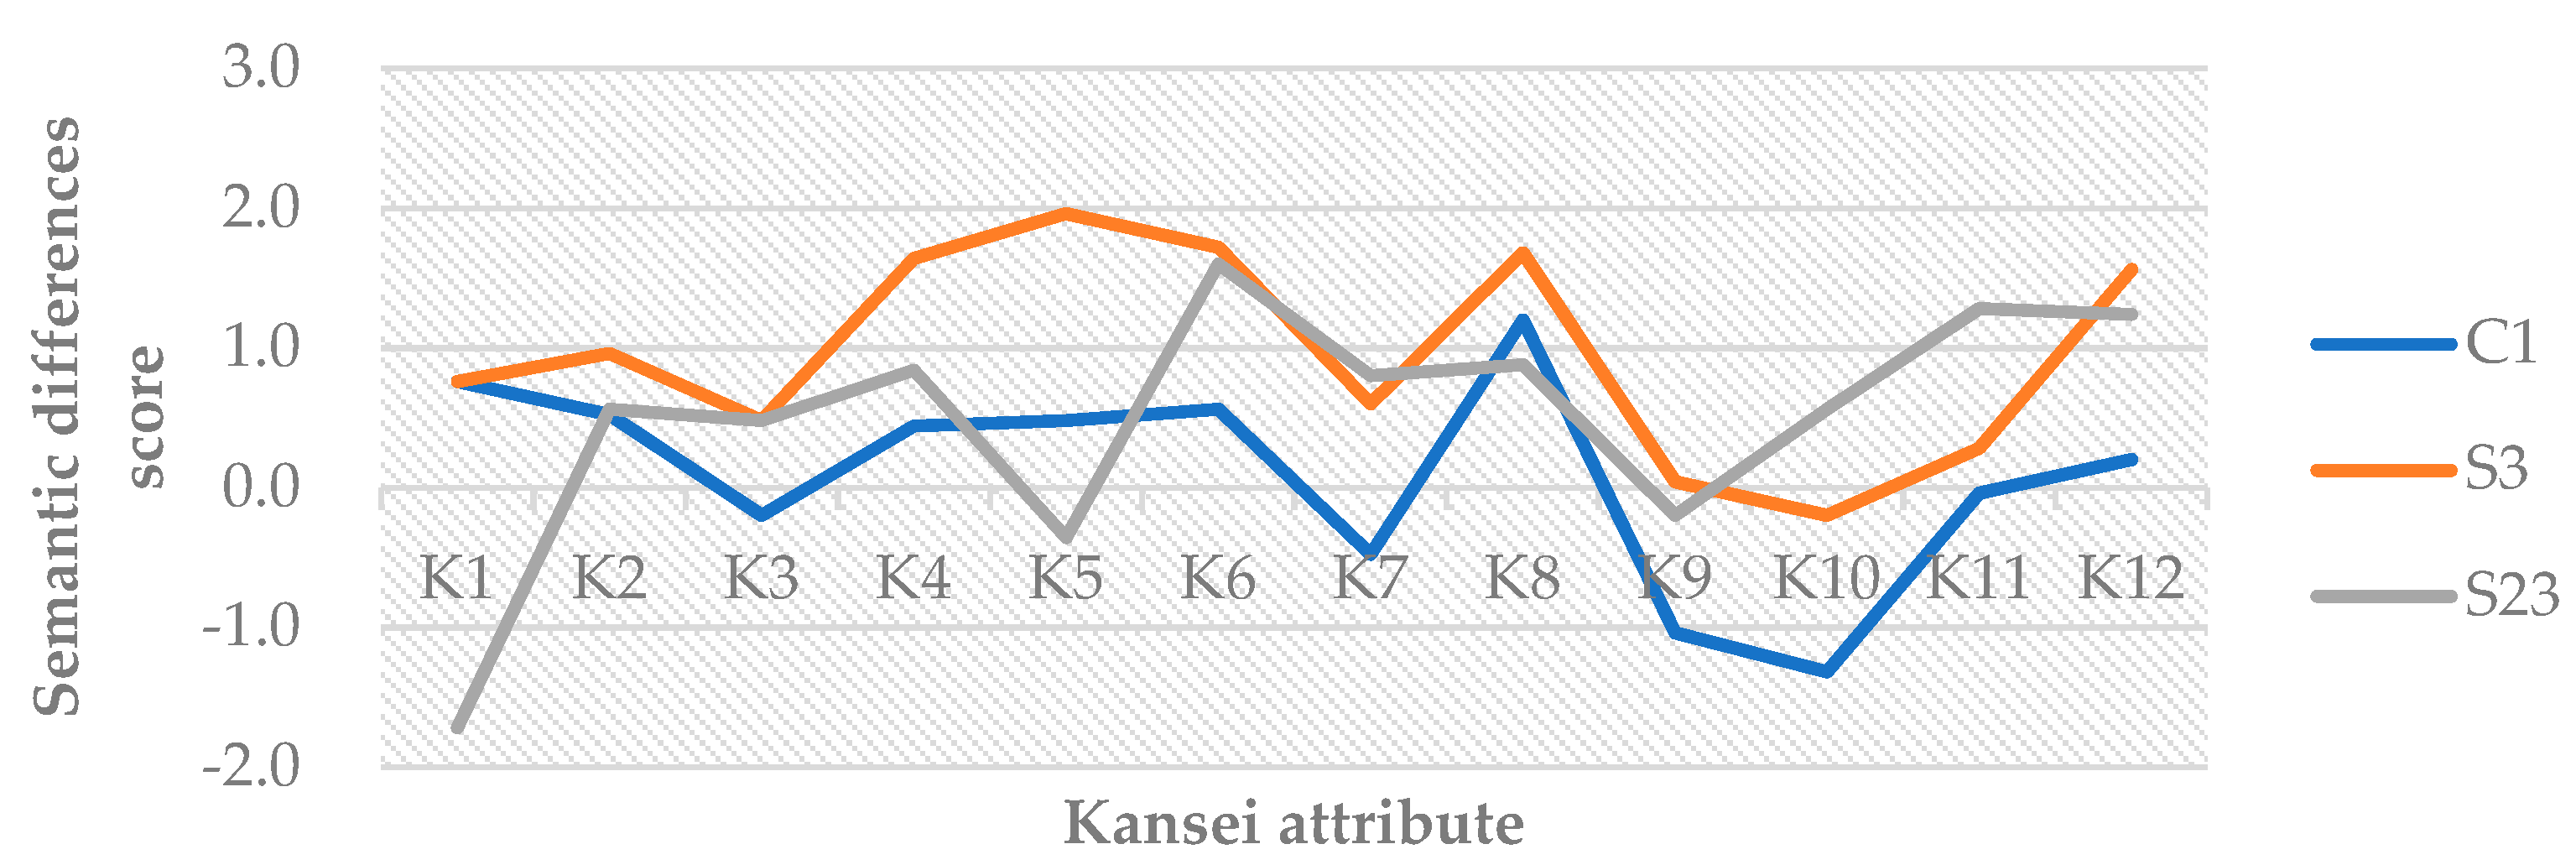
Figure 4 shows an example of the difference between icons with different correlation levels. S3 was originally set as a role-playing and strategy game, and S23 was an adventure and strategy game, but it was closely related to different categories (S3 most accurately matched the strategy category; S23 was more highly related to the action category). This example shows a sharp contrast and illustrates the meaning of affective matching. As shown in
Figure 4, based on the SD evaluation score, a line chart was drawn in a two-dimensional space, where the
X-axis represents the attributes based on the 12 Kansei words, and the
Y-axis represents the specific SD score.
4.3. Evaluate Survey Results
To obtain better design strategies for the related game categories, it is necessary to investigate further to discover the reasons for differences in matching qualities.
4.3.1. Strategy Games
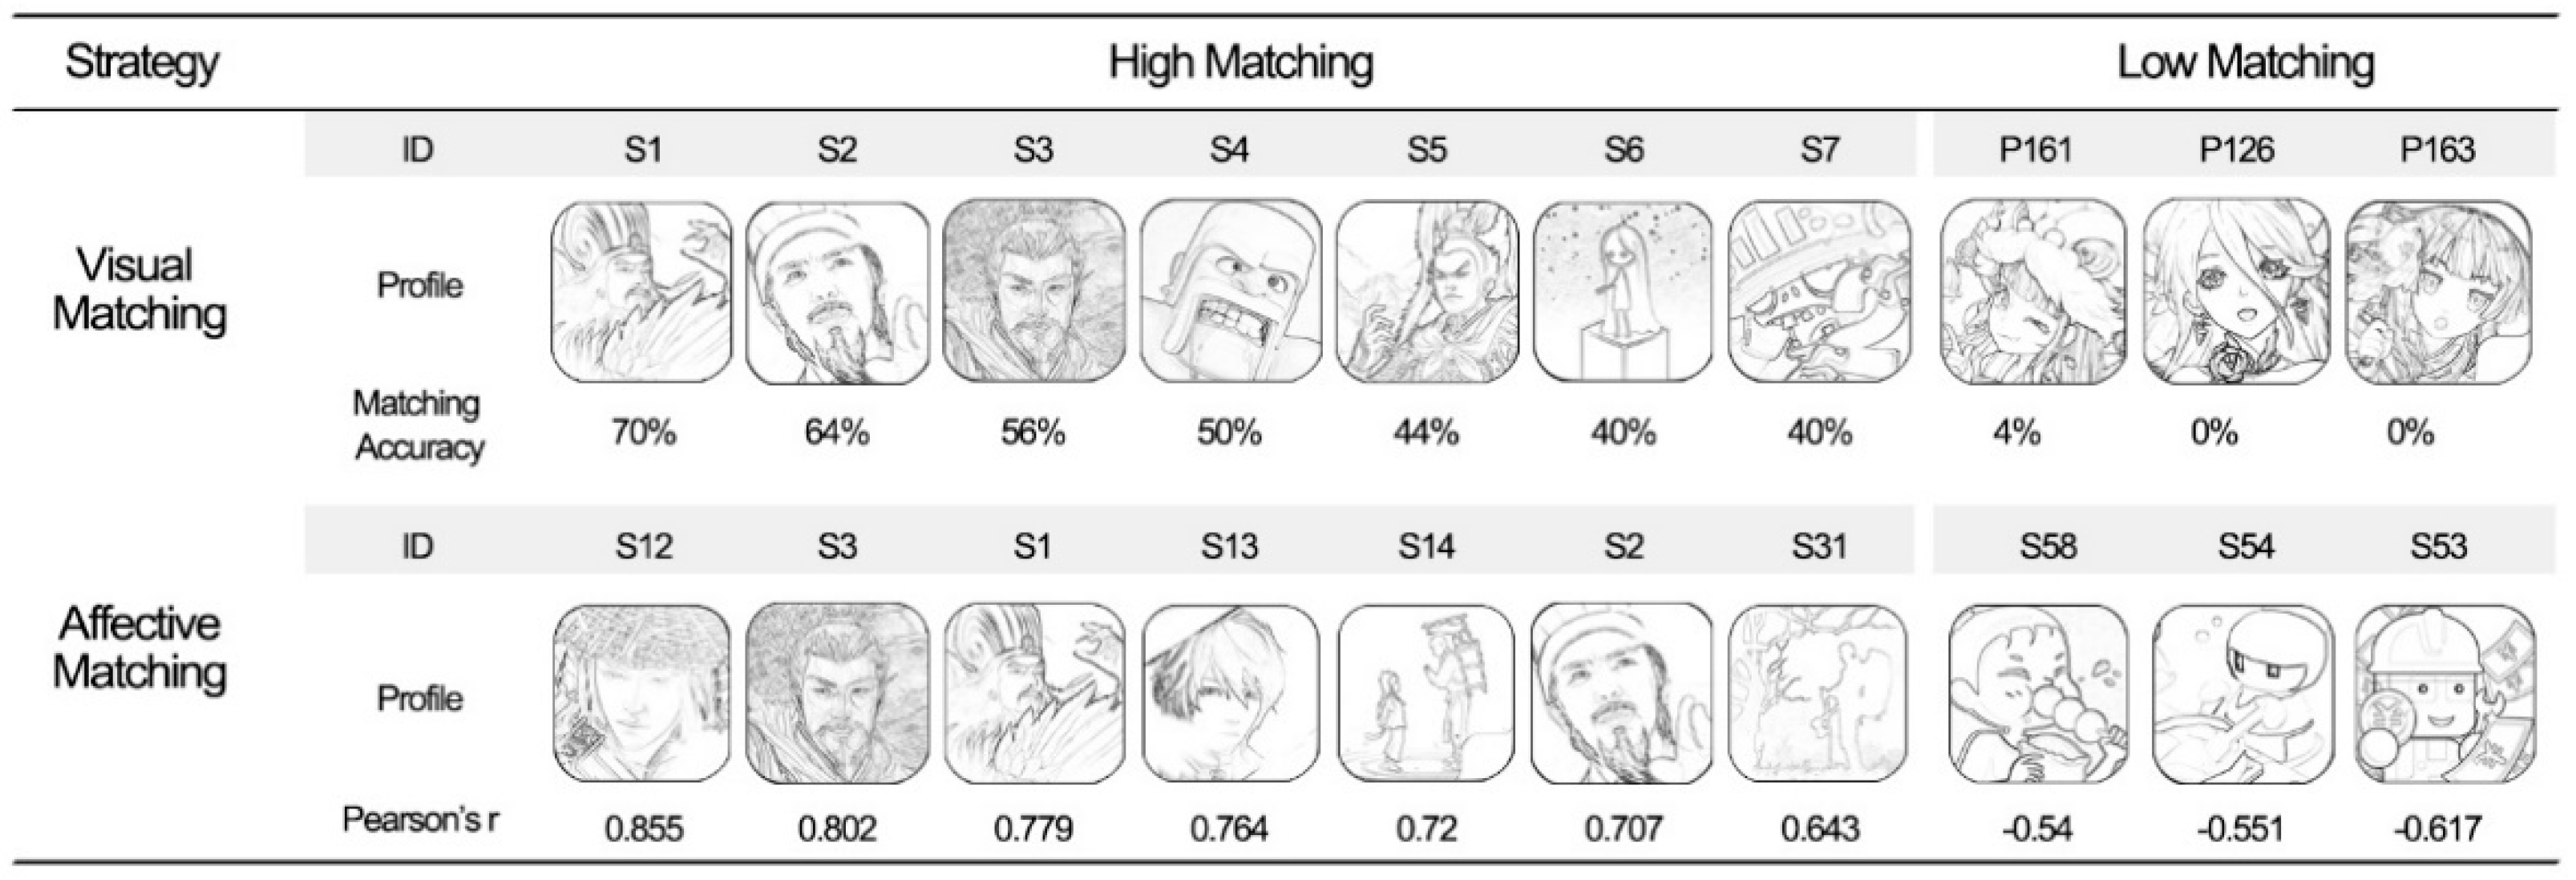
Figure 5 shows the perceptual matching results for the strategy game icons. Among the 200 icons, the icons with the best visual matching in this group had match rates from 40% to 70%. There were only four icons with match rates greater than 50%. The overall visual matching ratio was moderate, and the intended category was not very easily recognized by users. Icons S3, S1, and S2 achieved high scores of 0.802, 0.779, and 0.707 for affective matching. The results show that, currently, “The Romance of Three Kingdoms” generally has a high degree of matching with strategic gameplay in the Chinese game application market in terms of both visual and affective aspects. The designer has successfully created a high-quality perceptual association between the icon and the gameplay, and the user’s impression is consistent with the perception intended by the designer’s planning and setting. From a visual perspective, the icons with a higher degree of matching all used resourceful male characters. The design of costumes and other features of the characters is softer, the action range of the characters is smaller, and the expression of the character’s personality is the core of the icon design. The design elements of low-matching strategy game icons usually contain female characters. In terms of affective perception according to the evaluation scores from the SD experiment, the designs of S1, S2, and S3 were mainly associated with the Kansei words “complicated”, “classic”, “masculine”, “solemn”, and “concrete”. The main negatively related icon Kansei words were “cute”, “simple”, and “bright”.
4.3.2. Role-Playing Games
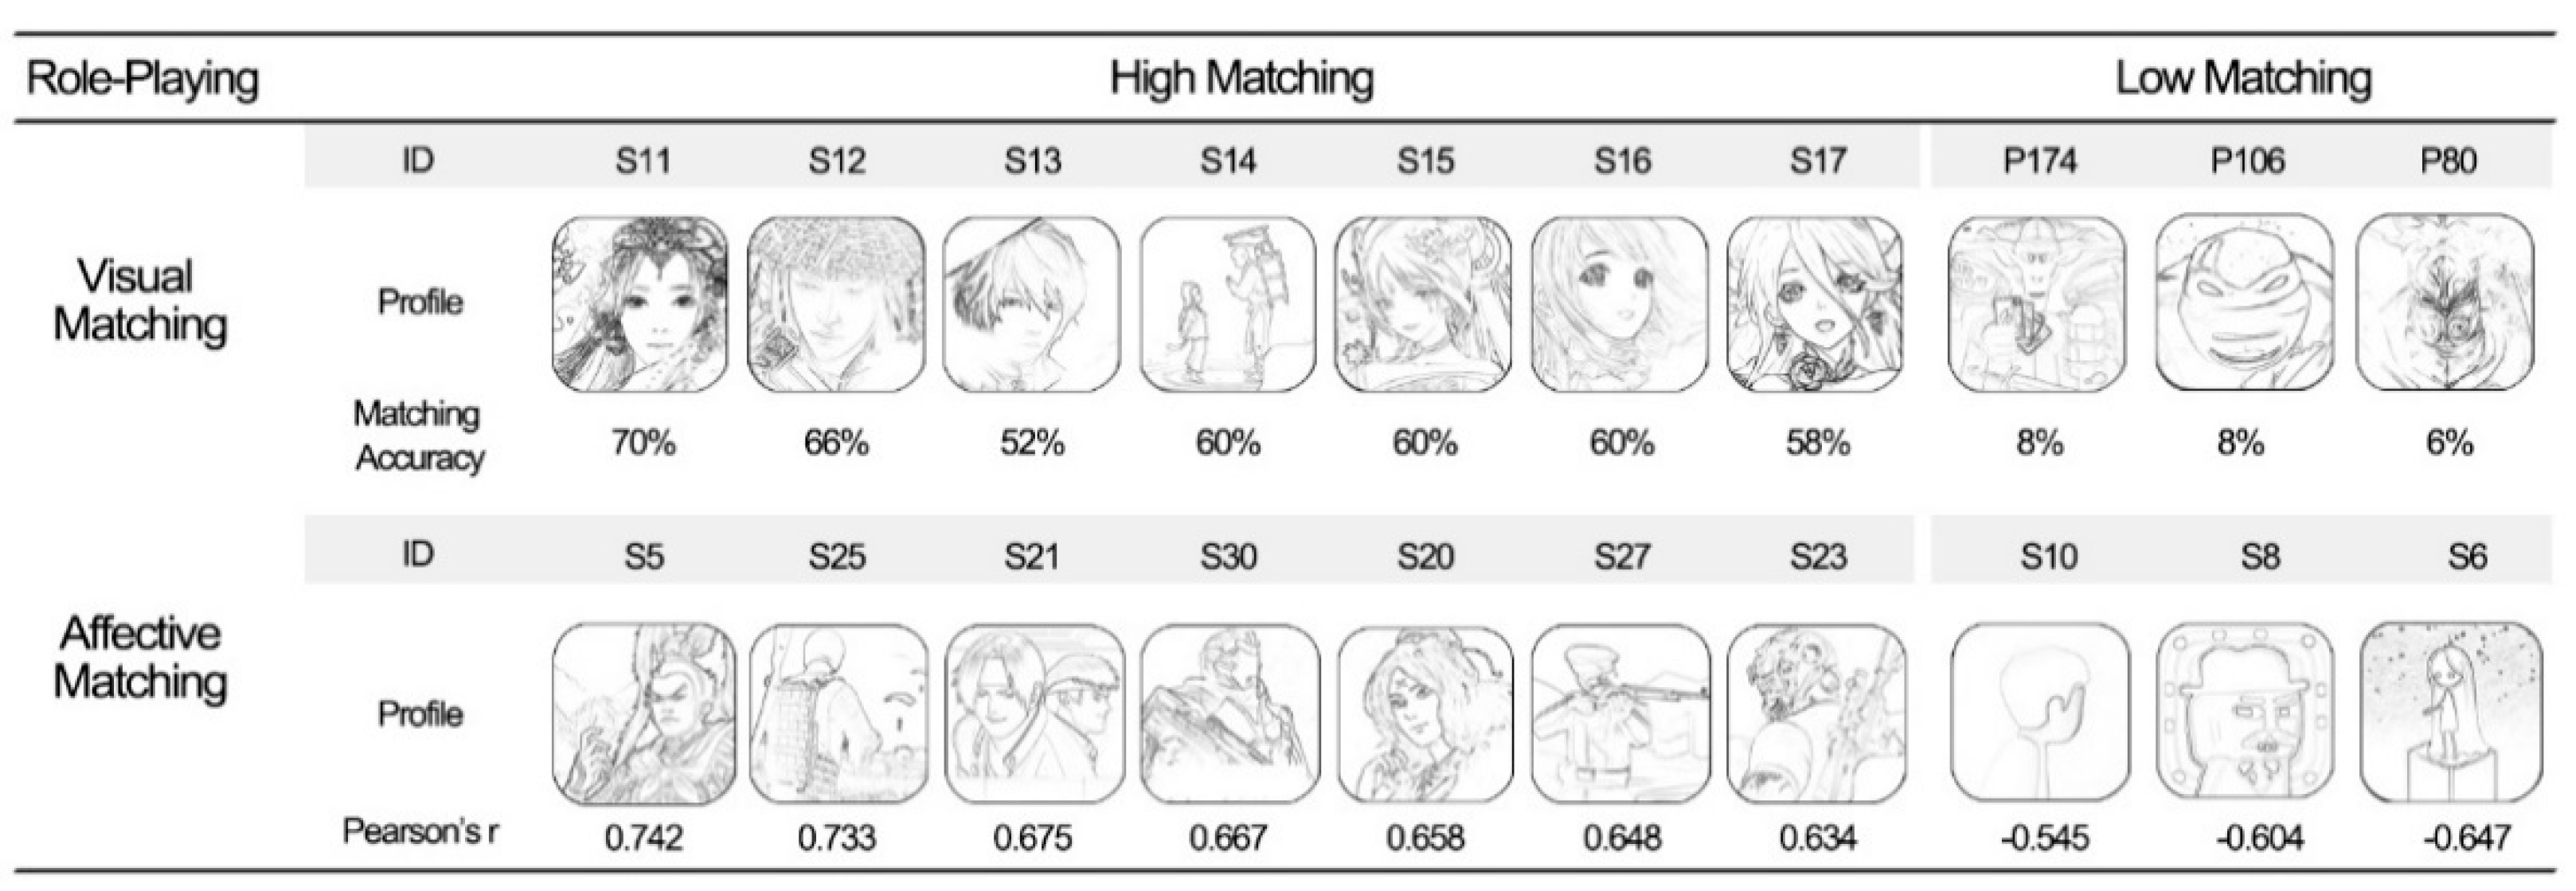
Figure 6 shows the perceptual matching results for role-playing game icon design. Their matching rates ranged from 58% to 70%. It was easier for the user to visually recognize character-centric icon designs as role-playing games. However, only S20 had high visual matching and affective matching at the same time, with a visual matching rate of 54% and an affective matching score of 0.658. The results show that the role-playing games currently on the Chinese game application market have not formed an obvious direction for affective perception. The perceptions established by developers and users’ perceptions have not yet formed an obvious matching relationship. The positively related words were predominantly “masculine” and “concrete”, while the main negatively related word was “mysterious”.
4.3.3. Action Games
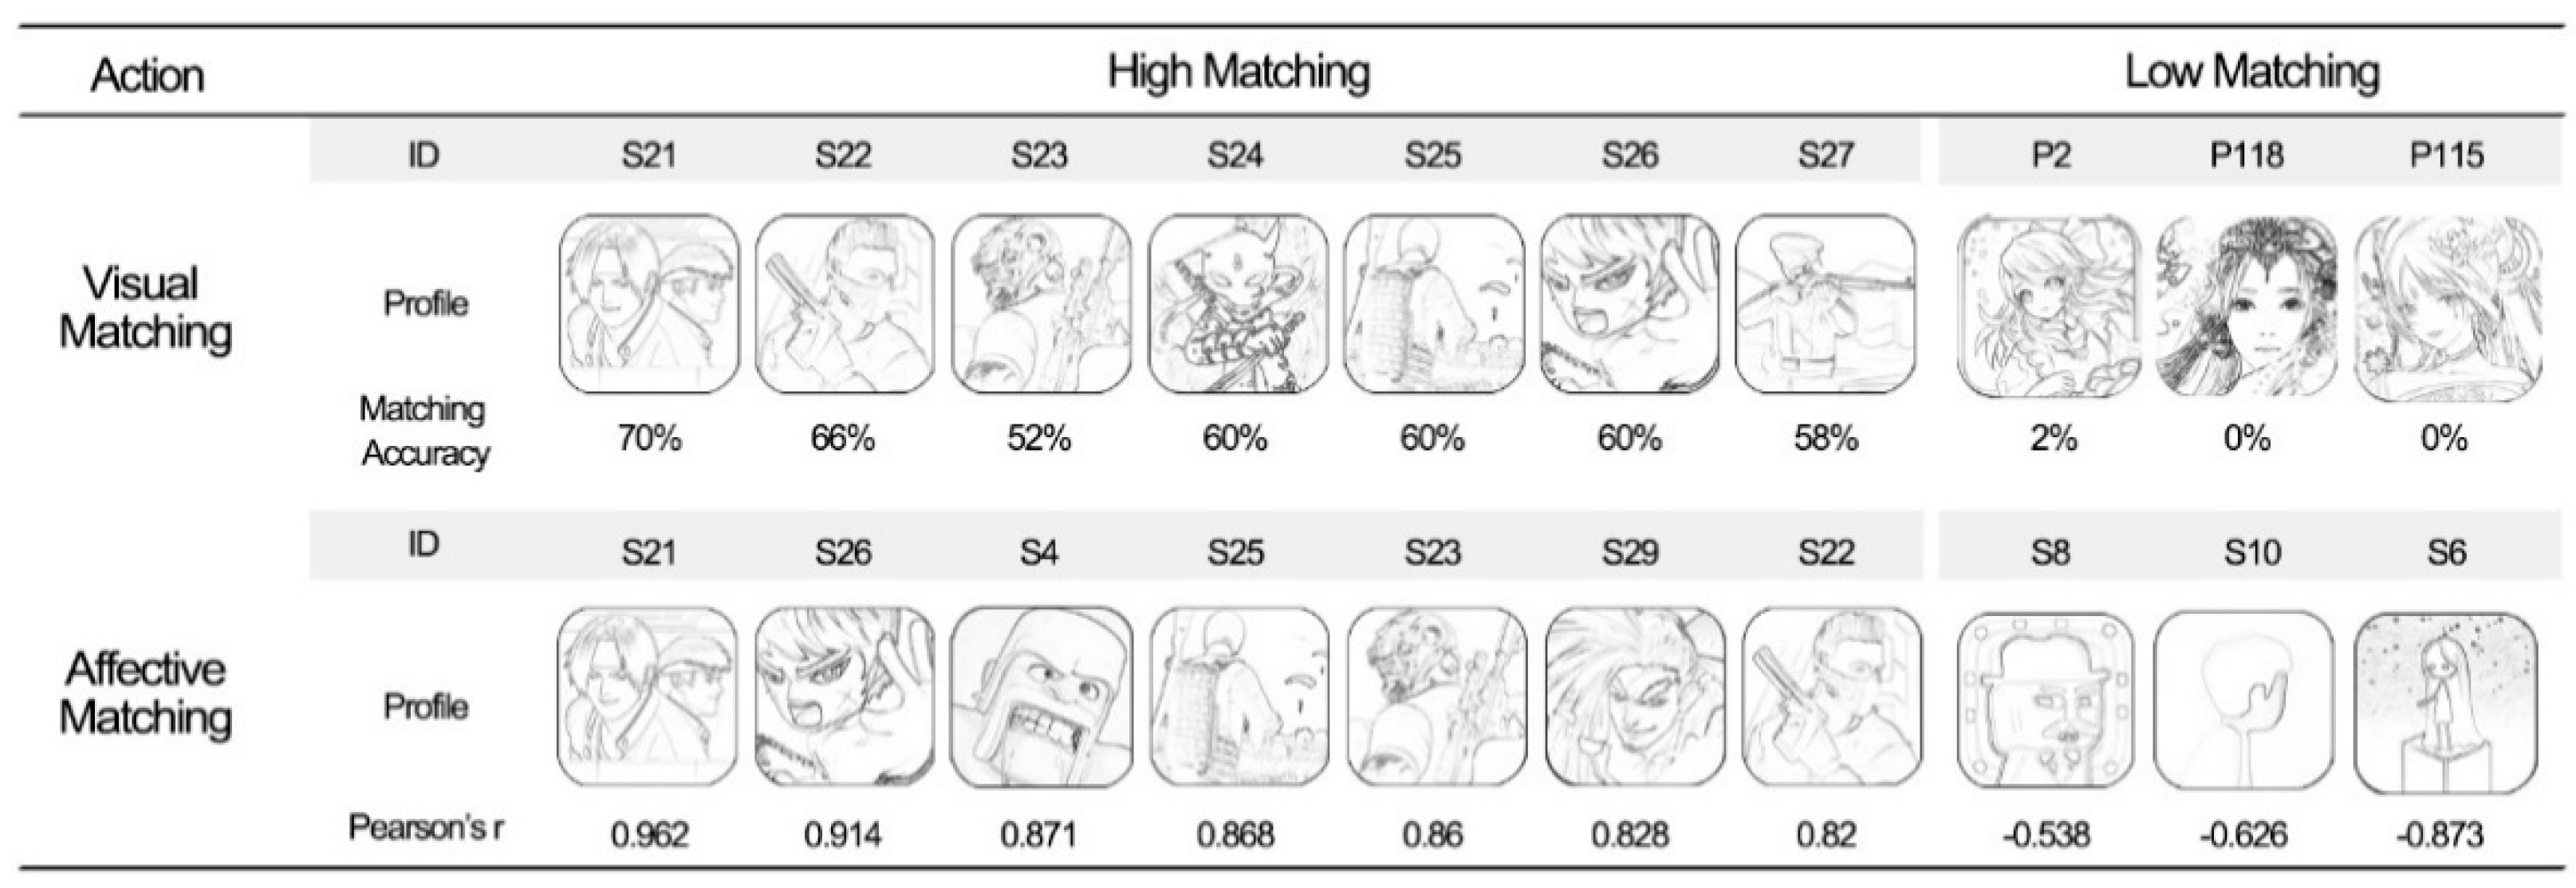
Figure 7 shows the degree of perceptual matching for action game icons. The icons with high visual matching had rates ranging from 58% to 70%. It was easier for users to visually recognize certain character-centric icons as action games. At the same time, S21, S26, S25, S23, S29, S22, and S27 also obtained very high affective matching scores. The results show that action games have a higher degree of overall perceptual matching in the Chinese game application market. The perception positioning intended by designers of action games is better conveyed to users. The visual elements of icons with a high matching degree usually include character elements in a specific posture. This posture is usually unstable, conveying a dynamic and ready-to-go feeling, which helps users understand and recognize action games to a certain extent. Based on the evaluation score from the SD experiment, the main Kansei words for the action category were “passionate”, “masculine”, “straightforward”, and “concrete”. The main negatively related word was “mysterious”.
4.3.4. Adventure Games
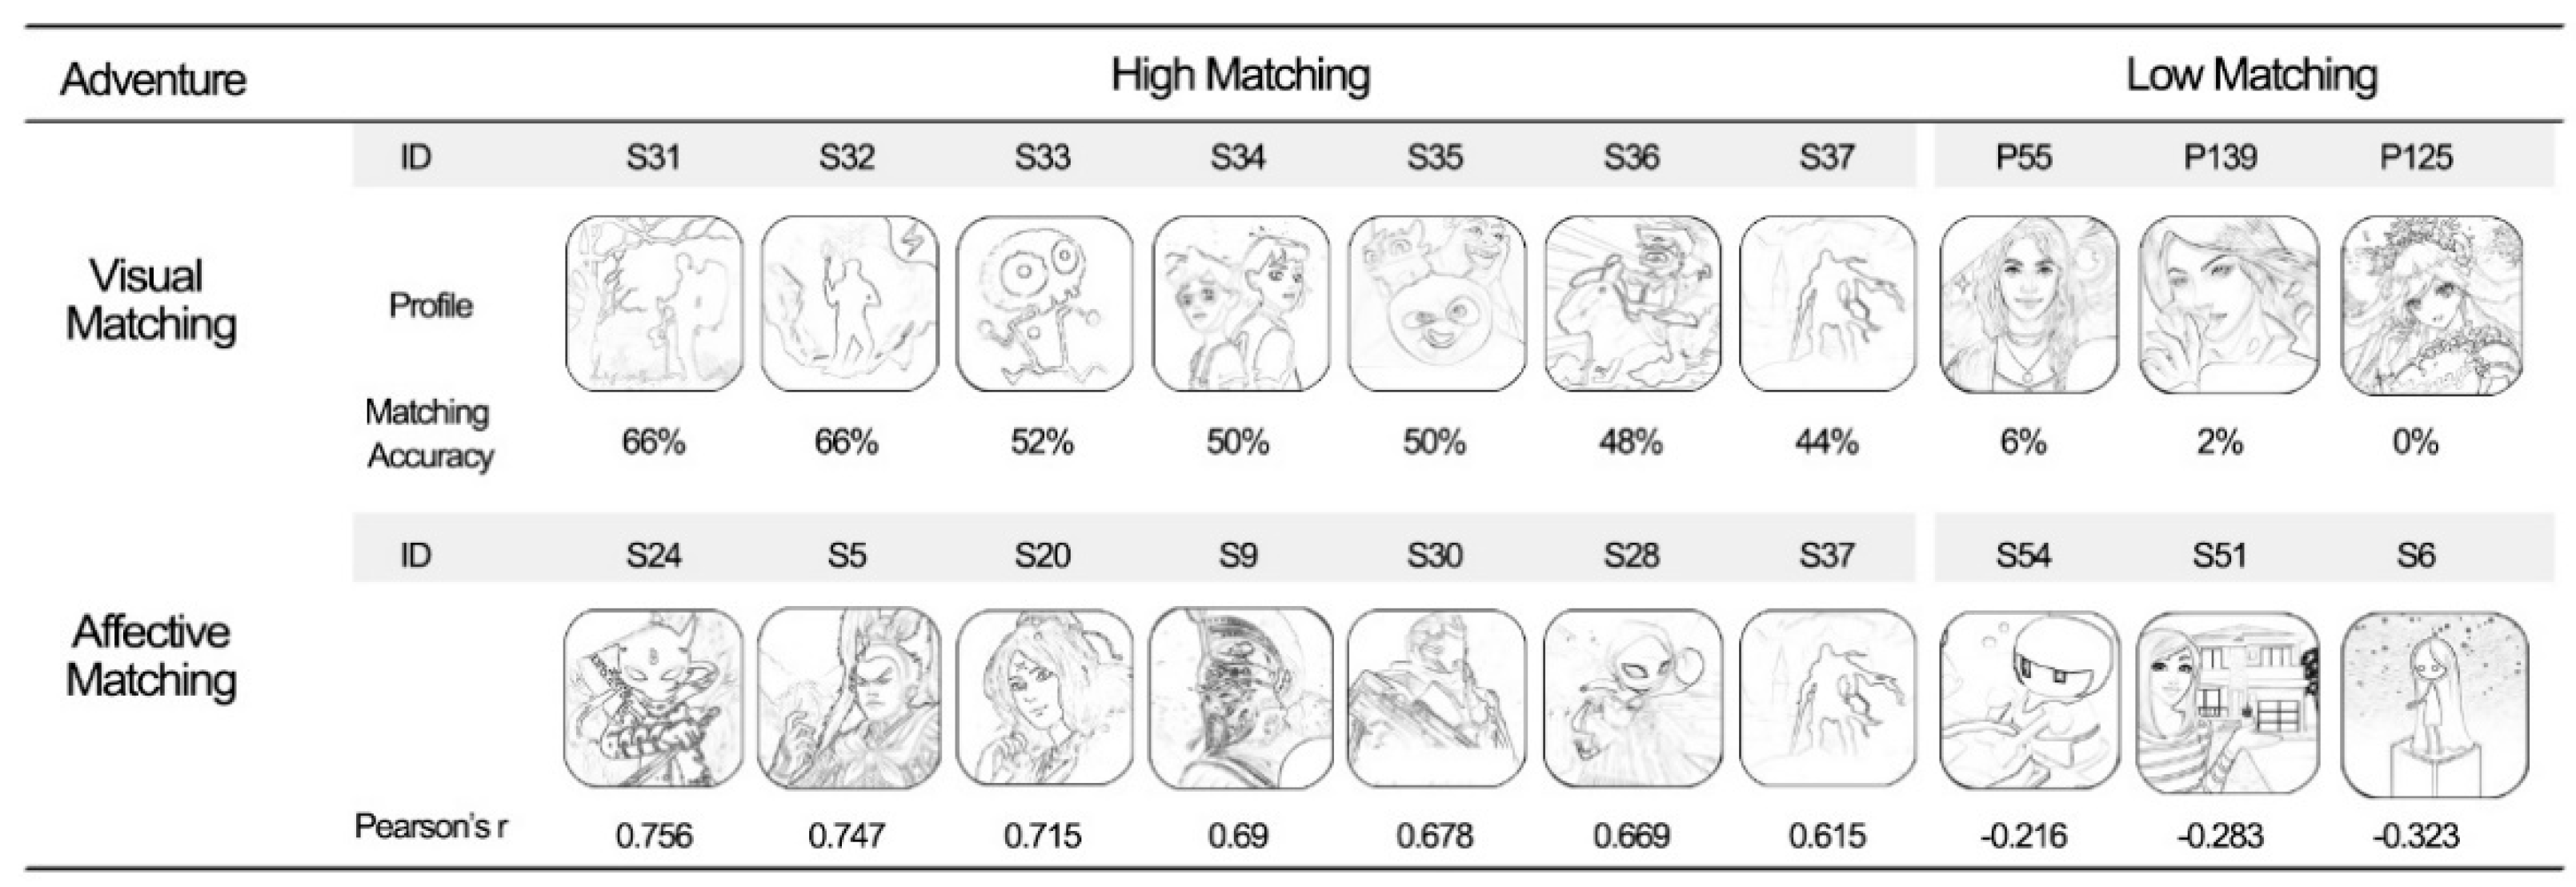
Figure 8 shows the perceived matching degree of adventure game icons. Their rate of matching was distributed from 44% to 66%. Compared with other categories, the visual matching degree of adventure games currently on the market is moderate. From a visual perspective, adventure game icons have a relatively abstract and concise line form, with white space and multiple abstract lines in the figure form, leaving space for users’ imagination. This provides hints for users and prompts them to use their imagination to a certain extent; additionally, it is in line with the characteristics of collection in adventure games. The scores for adventure games were not high based on the SD experiment results, and the main associated Kansei words were “passionate” and “exquisite”. However, there was no clear emotional intention, and there were no obvious negatively related words. S37 achieved relatively high visual and affective matching, with scores of 44% and 0.615, respectively.
4.3.5. Simulation Games
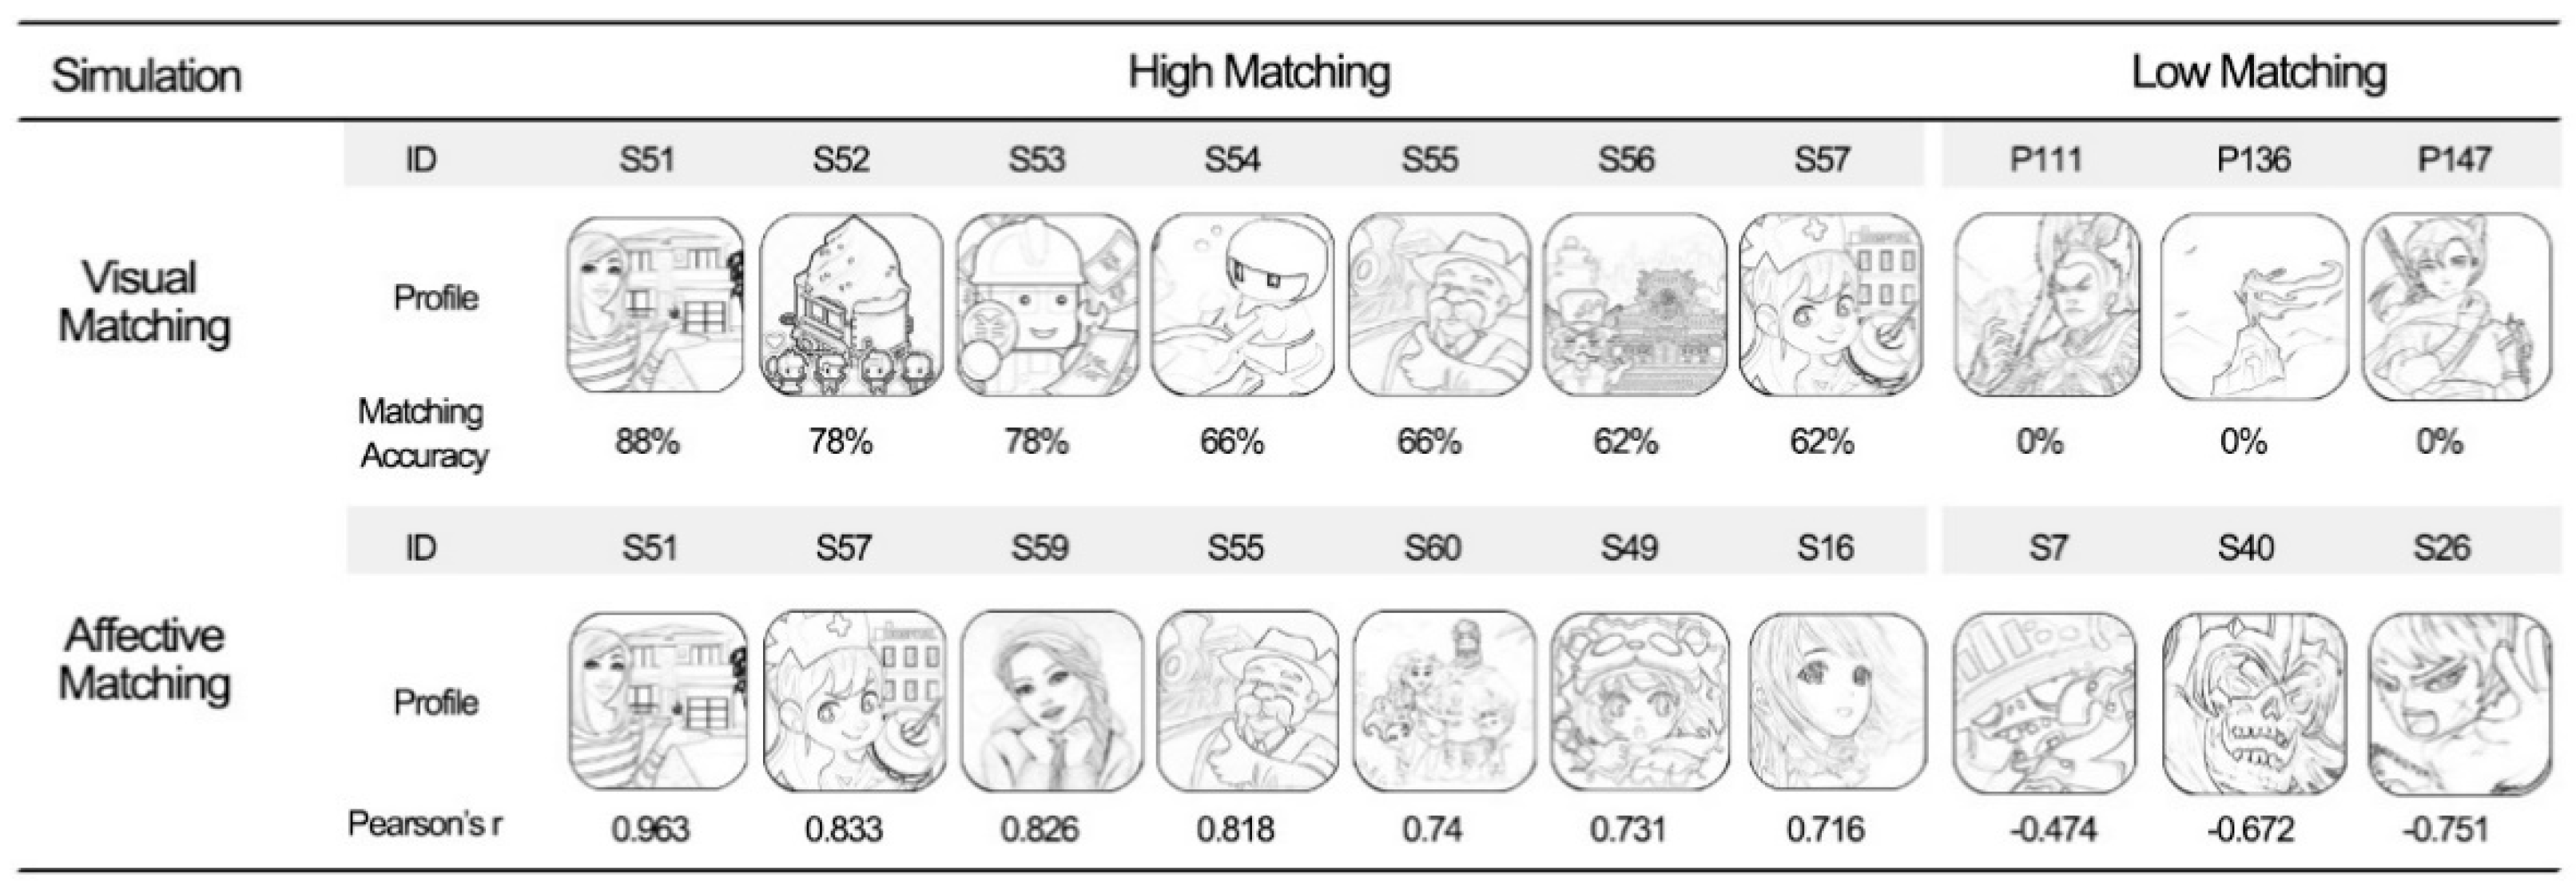
Figure 9 shows the perceived matching degree for simulated business game icons. The match rates of icons with a high visual matching icon ranged from 62% to 88%, and the perceptual matching scores ranged from 0.716 to 0.963. Compared with other categories, simulation games had the highest degree of perceived matching of simulation games. S51, S57, S59, S60, S55, S58, and S53 all obtained high scores in terms of visual and affective matching. The characters in simulated business games are most often female or cute and neutral, with soft line elements from a visual perspective. Highly matching icons most often combine scenes and characters, and related props and other elements are extracted from daily life. The Kansei words with the highest scores on the SD experiment for simulation games were “warm”, “bright”, and “fashionable”. The main negatively correlated words were “passionate” and “masculine”.
4.3.6. Trading Card Game
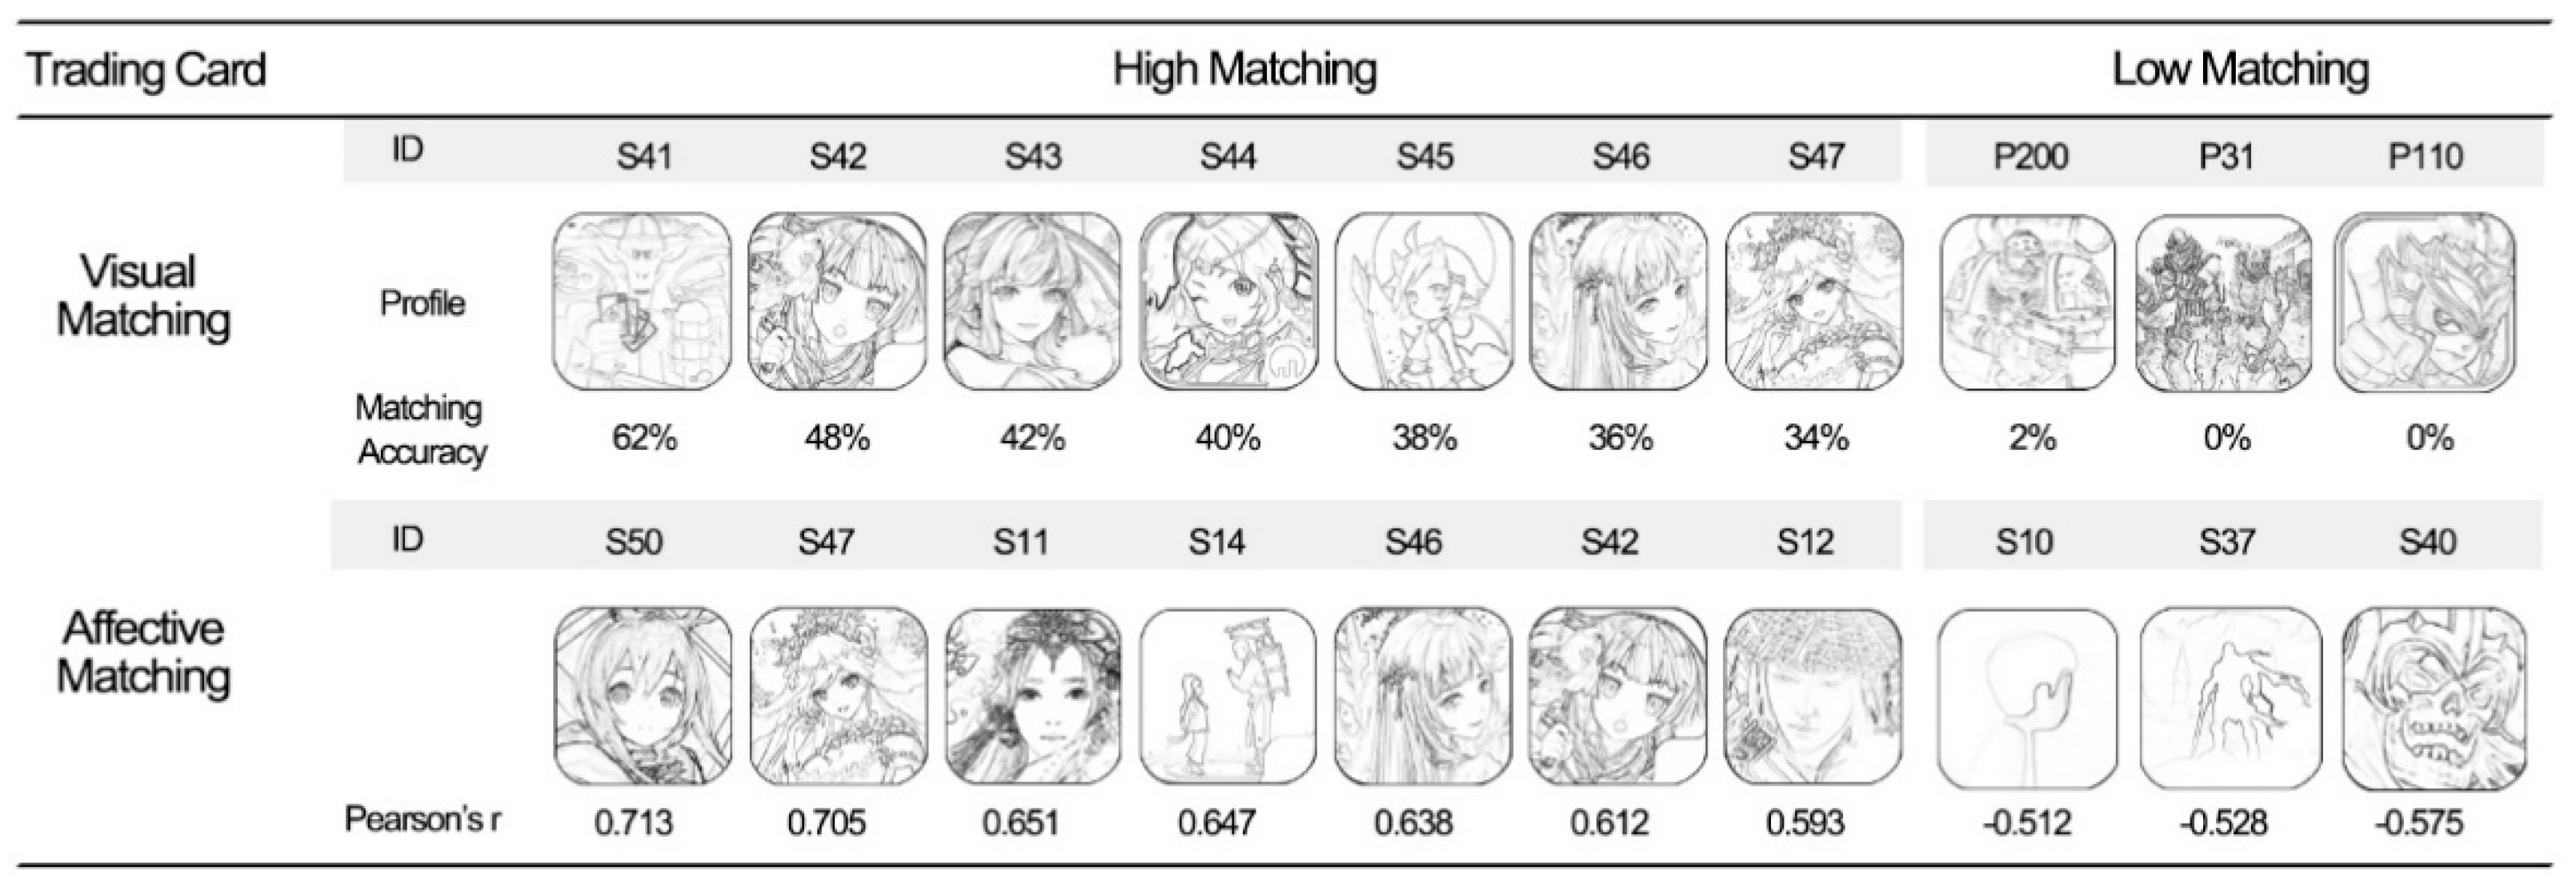
Figure 10 shows the perceived matching degree for trading card game icon designs. The icons with high visual matching had match rates ranging from 34% to 62%, and the perceptual matching scores ranged from 0.593 to 0.713. The degree of perceptual matching for trading card games was lower than that of several other categories. Only S50 was ranked relatively high in visual and affective matching. Visually, the icons of trading card games include the most delicate and complex line elements of all the categories, indicating that users generally recognize icons with more sophisticated and complex visual design as trading card games. Unlike strategy games, the trading card game icons with higher visual matching had relatively feminine characteristics. The only icon design with a visual match rate greater than 50% was S41, and the character’s props still contained card elements. This shows that for current trading card games created with characters as elements, users have difficulty matching icons to gameplay unless the icons depict the cards themselves. In addition, the Kansei words obtained from the SD experiment were not very clear, and only the word “exquisite” obtained a high score. The results show that trading card games have not formed a very accurate perceptual match in terms of either visual or affective aspects in the current Chinese game application market. Without the card elements themselves, it is difficult for users to intuitively judge the gameplay from the icons.
4.4. Recommendations for Enhancing the Perceptual Matching Quality of Character-Centric Mobile Game Icons
4.4.1. Visual Design and the Gameplay
Before a game icon is created, the story structure, themes, and characters of the game itself are usually already determined. Therefore, it is possible to improve the perceptual match between game icons and gameplay by selecting appropriate characters and icon styles and designing the icon character’s costumes, demeanor, actions, and corresponding props and scenes.
For example, in strategy games, male characters are most often used for character roles. Compared with action games, the costume design is softer, and the movement range is smaller. Images mainly convey a thoughtful attitude. When designing a game that includes action operations and gameplay, such as King of Fighters, the character design may include specific non-steady-state postures to provide a dynamic and ready-to-go visual experience. Adventure game icons can be designed using a relatively abstract and simple style that considers white space, leaving users room to think metaphorically and use their imaginations. When creating simulation games, it is usually best to combine the design with game scenes. The line elements are relatively soft and feminine, and it is better to include some related props in the icons.
4.4.2. Establishing a Necessary Mapping Model for Feeling and Design Features
For affective matching, establishing an effective mapping model linking feeling and design is the key to improving matching quality. Designers and developers use perceptual mapping models to transform design intent into responsive features that are passed on to users, thereby ensuring a connection between the intended and the acquired feeling. The Kansei attributes proposed in this article are general models based on different categories of games and can be used as a reference for designing and developing games in these categories. As each game is developed, from the icon to the underlying interface, it should have its own goals based on positioning, and Kansei engineering methods should be used to verify these goals during the design and development process.
5. Conclusions
In this article, the perceptual matching method was used to evaluate the match between character-centered icons and gameplay and user experience. As a measure, this method was used to determine whether the design provides accurate images for users and promotes an accurate perception of visual and emotional aspects. Using this method, a two-stage procedure was used to evaluate the matching quality of 200 game icons. We obtained visual matching scores for 200 icon samples and affective matching scores for 60 icons that showed high visual matching after two stages.
After an analysis, design rules were proposed for each game icon category. Several recommendations were provided to help improve matching quality, including (1) selecting appropriate characters and creation styles; presenting the costumes, demeanor, and actions of the characters in the icons; and including corresponding props and scenes to improve the perceptual matching quality of game icons and gameplay; and (2) establishing a mapping model for feeling and design features to promote the perceptual interaction between designers and users.
For designers and developers, perceptual matching provides a new method for evaluating products’ perceived quality in terms of cognitive processes. Before presenting a design concept draft for further in-depth design and development, it can be quickly checked to assess its perceptual quality. In addition, identifying the matching relationship between a game’s design and how it is perceived can help designers and developers better understand user needs. The knowledge gained from perception matching can guide users to use more specific descriptions or behaviors to express their needs. At the same time, it can help users better understand their game expectations and identify game products that fit their interests.
6. Future Works
This article used the perceptual matching method to test the overall perceived quality of character-centered game icons in six categories. From a design element perspective, further research needs to determine how specific cartoon characters, design styles, graphic areas, colors, etc., affect users’ perceptions of mobile game application categories. The particular element analysis will be able to guide the design work effectively. In addition, users of different genders and ages also show other perceptual biases for games and cartoon characters. Further research needs to be carried out on this aspect. Besides, generating relevant materials consistent with user perception with the help of artificial intelligence will also be an exciting topic in future research.
Author Contributions
Conceptualization, X.C. and M.W.; formal analysis, X.C.; funding acquisition, X.C.; investigation, X.C.; methodology, X.C.; project administration, K.O.; supervision, M.W.; validation, K.O.; visualization, X.C.; writing—original draft, X.C. All authors have read and agreed to the published version of the manuscript.
Funding
This research project is supported by FUND for KEY R&D PROJECTS in ZHEJIANG PROVINCE: 2021C03137, grant number 2021C03137, and the CHINA SCHOLARSHIP COUNCIL, grant number 202008330389.
Institutional Review Board Statement
Not applicable.
Informed Consent Statement
Informed consent was obtained from all subjects involved in the study.
Data Availability Statement
Acknowledgments
Thanks to the guidance and help during the article’s writing from Associate Professor Zhang Tao from Zhejiang Sci-Tech University.
Conflicts of Interest
The authors declare that they have no known competing financial interests or personal relationships that could have appeared to influence the work reported in this paper.
References
- Bojanić, M.; Bojanić, G. Self-Learning Mechanism for Mobile Game Adjustment towards a Player. Appl. Sci. 2021, 11, 4412. [Google Scholar] [CrossRef]
- Taylor, K.; Silver, L. Smartphone Ownership is Growing Rapidly around the World, but not Always Equally. In Technical Report; Pew Research Center: Washington, DC, USA, 2019; pp. 1–47. [Google Scholar]
- Manuaba, I.B.K. The Design and Game Mechanic of Combined Game Application Prototype for Learning Social Business. Procedia Comput. Sci. 2018, 135, 52–59. [Google Scholar] [CrossRef]
- Gu, J.; Xu, Y.; Xu, H.; Zhang, C.; Ling, H. Privacy Concerns for Mobile App Download: An Elaboration Likelihood Model Perspective. Decis. Support Syst. 2017, 94, 19–28. [Google Scholar] [CrossRef]
- Hou, K.-C.; Ho, C.-H. A Preliminary Study on Aesthetic of Apps Icon Design. In Consilence and Innovation in Design—Proceedings and Program; Shibaura Institute of Technology: Tokyo, Japan, 2013. [Google Scholar]
- Blankenberger, S.; Hahn, K. Effects of Icon Design on Human-Computer Interaction. Int. J. Man-Mach. Stud. 1991, 35, 363–377. [Google Scholar] [CrossRef]
- Shen, Z.; Zhang, L.; Li, R.; Liang, R. The Effects of Icon Internal Characteristics on Complex Cognition. Int. J. Ind. Ergon. 2020, 79, 102990. [Google Scholar] [CrossRef]
- Bovea, M.D.; Quemades-Beltrán, P.; Pérez-Belis, V.; Juan, P.; Braulio-Gonzalo, M.; Ibáñez-Forés, V. Options for Labelling Circular Products: Icon Design and Consumer Preferences. J. Clean. Prod. 2018, 202, 1253–1263. [Google Scholar] [CrossRef]
- Soukup, C. Mastering the Game: Gender and the Entelechial Motivational System of Video Games. Women’s Stud. Commun. 2010, 30, 157–178. [Google Scholar] [CrossRef]
- Hodges, D.; Buckley, O. Deconstructing Who You Play: Character Choice in Online Gaming. Entertain. Comput. 2018, 27, 170–178. [Google Scholar] [CrossRef] [Green Version]
- Dessart, L. Do Ads That Tell a Story Always Perform Better? The Role of Character Identification and Character Type in Storytelling Ads. Int. J. Res. Mark. 2018, 35, 289–304. [Google Scholar] [CrossRef]
- Sajjadi, P.; Hoffmann, L.; Cimiano, P.; Kopp, S. A Personality-Based Emotional Model for Embodied Conversational Agents: Effects on Perceived Social Presence and Game Experience of Users. Entertain. Comput. 2019, 32, 100313. [Google Scholar] [CrossRef]
- Green, G. The Effects of Action Video Game Experience on Perceptual Decision Making—ProQuest. Ph.D. Thesis, University of Rochester, Rochester, NY, USA, 2008. [Google Scholar]
- Zhao, D.; Li, R.; Zhao, J. Affective Judgment in Creative Design: A Method of Fitness Evaluation to the Problem/Solution Spaces. Int. J. Ind. Ergon. 2019, 71, 84–91. [Google Scholar] [CrossRef]
- Taquet, P.; Romo, L.; Cottencin, O.; Ortiz, D.; Hautekeete, M. Video Game Addiction: Cognitive, Emotional, and Behavioral Determinants for CBT Treatment. J. Ther. Comport. Cogn. 2017, 27, 118–128. [Google Scholar] [CrossRef]
- Park, C.W.; Jaworski, B.J.; MacInnis, D.J. Strategic Brand Concept-Image Management. J. Mark. 1986, 50, 135–145. [Google Scholar] [CrossRef]
- Cohen, E.L. What Makes Good Games Go Viral? The Role of Technology Use, Efficacy, Emotion and Enjoyment in Players’ Decision to Share a Prosocial Digital Game. Comput. Hum. Behav. 2014, 33, 321–329. [Google Scholar] [CrossRef]
- Nagamachi, M. Kansei Engineering; Kaibundo Publishing Co. Ltd.: Tokyo, Japan, 1989. [Google Scholar]
- Yumiao, C.; Jiang, X.; Zhongliang, Y. Culture-Adapted User Interface Design Method for Mobile Phone: Correlation between User Knowledge and Icon. In 2010 IEEE 11th International Conference on Computer-Aided Industrial Design & Conceptual Design 1; IEEE: Piscataway, NJ, USA, 2010; Volume 1, pp. 177–180. [Google Scholar] [CrossRef]
- Jylhä, H. An Icon That Everyone Wants to Click on: An Empirical Study on the Relationship between Consumer Perceptions and Mobile Game Icon Successfulness. Master’s Thesis, Tampere University, Tampere, Finland, 2017. [Google Scholar]
- Chen, C.-H.; Lin, Z. The Application of Fuzzy Theory in the Evaluation of Visual Images of Smartphone Rear Cameras. Appl. Sci 2021, 11, 3555. [Google Scholar] [CrossRef]
- Luo, S.-J.; Fu, Y.-T.; Zhou, Y.-X. Perceptual Matching of Shape Design Style between Wheel Hub and Car Type. Int. J. Ind. Ergon. 2012, 42, 90–102. [Google Scholar] [CrossRef]
- Luo, S.-J.; Fu, Y.-T.; Korvenmaa, P. A Preliminary Study of Perceptual Matching for the Evaluation of Beverage Bottle Design. Int. J. Ind. Ergon. 2012, 42, 219–232. [Google Scholar] [CrossRef]
- Yun, M.H.; You, H.; Geum, W.; Kong, D. Affective Evaluation of Vehicle Interior Craftsmanship: Systematic Checklists for Touch/Feel Quality of Surface-Covering Material. In Proceedings of the Human Factors and Ergonomics Society Annual Meeting; SAGE Publications Inc.: Los Angeles, CA, USA, 2004; Volume 48, pp. 971–975. [Google Scholar] [CrossRef] [Green Version]
- Vazquez-Corral, J.; Connah, D.; Bertalmío, M. Perceptual Color Characterization of Cameras. Sensors 2014, 14, 23205–23229. [Google Scholar] [CrossRef] [Green Version]
- Ishihara, S.; Ishihara, K.; Nagamachi, M.; Matsubara, Y. An Analysis of Kansei Structure on Shoes Using Self-Organizing Neural Networks. Int. J. Ind. Ergon. 1997, 19, 93–104. [Google Scholar] [CrossRef]
- Yang, S.; Nagamachi, M.; Lee, S. Rule-Based Inference Model for the Kansei Engineering System. Int. J. Ind. Ergon. 1999, 24, 459–471. [Google Scholar] [CrossRef]
- Shimizu, Y.; Jindo, T. A Fuzzy Logic Analysis Method for Evaluating Human Sensitivities. Int. J. Ind. Ergon. 1995, 15, 39–47. [Google Scholar] [CrossRef]
- Park, J.; Han, S.H. A Fuzzy Rule-Based Approach to Modeling Affective User Satisfaction towards Office Chair Design. Int. J. Ind. Ergon. 2004, 34, 31–47. [Google Scholar] [CrossRef]
- Ishihara, S.; Ishihara, K.; Nagamachi, M.; Matsubara, Y. An Automatic Builder for a Kansei Engineering Expert System Using Self-Organizing Neural Networks. Int. J. Ind. Ergon. 1995, 15, 13–24. [Google Scholar] [CrossRef]
- Hsia, P.; Samuel, J.; Gao, J.; Kung, D.; Toyoshima, Y.; Chen, C. Formal Approach to Scenario Analysis. IEEE Softw. 1994, 11, 33–41. [Google Scholar] [CrossRef]
- Heise, D.R. Some Methodological Issues in Semantic Differential Research. Psychol. Bull. 1969, 72, 406–422. [Google Scholar] [CrossRef]
- Krueger, L.E. A Theory of Perceptual Matching. Psychol. Rev. 1978, 85, 278–304. [Google Scholar] [CrossRef]
- Lechelt, E.C.; Eliuk, J.; Tanne, G. Perceptual Orientational Asymmetries: A Comparison of Visual and Haptic Space. Percept. Psychophys. 1976, 20, 463–469. [Google Scholar] [CrossRef]
- Stones, C. Positively Picturing Pain? Using Patient-Generated Pictures to Establish Affective Visual Design Qualities. Int. J. Des. 2013, 7, 85–97. [Google Scholar]
- Özcan, E.; Cupchik, G.; Schifferstein, R. Auditory and Visual Contributions to Affective Product Quality. Int. J. Des. 2017, 11, 35–50. [Google Scholar]
- Dai, J.; Cone, J.; Moher, J. Perceptual Salience Influences Food Choices Independently of Health and Taste Preferences. Cogn. Res. Princ. Implic. 2020, 5, 2. [Google Scholar] [CrossRef] [PubMed] [Green Version]
- Hsu, S.H.; Chuang, M.C.; Chang, C.C. A Semantic Differential Study of Designers’ and Users’ Product Form Perception. Int. J. Ind. Ergon. 2000, 25, 375–391. [Google Scholar] [CrossRef]
- Schacter, D.L. Psychology; Worth Publishers: New York, NY, USA, 2011. [Google Scholar]
- Balcetis, E.; Lassiter, G.D. Social Psychology of Visual Perception; Psychology Press: New York, NY, USA, 2010. [Google Scholar]
- Forgas, J.P.; Bower, G.H. Mood Effects on Person-Perception Judgments. J. Pers. Soc. Psychol. 1987, 53, 53–60. [Google Scholar] [CrossRef] [PubMed]
- Elizabeth, R.-J. Different Visions, Different Visuals: A Social Semiotic Analysis of Field-Specific Visual Composition in Scientific Conference Presentations. Vis. Commun. 2004, 3, 145–175. [Google Scholar] [CrossRef]
- Pylyshyn, Z. Is Vision Continuous with Cognition?: The Case for Cognitive Impenetrability of Visual Perception. Behav. Brain. Sci. 1999, 22, 341–365. [Google Scholar] [CrossRef]
- Keil, A.; Gruber, T.; Müller, M.M.; Moratti, S.; Stolarova, M.; Bradley, M.M.; Lang, P.J. Early Modulation of Visual Perception by Emotional Arousal: Evidence from Steady-State Visual Evoked Brain Potentials. Cogn. Affect. Behav. Neurosci. 2003, 3, 195–206. [Google Scholar] [CrossRef] [Green Version]
- Nagamachi, M. Kansei Engineering. In Handbook of Human Factors and Ergonomics Methods; CRC Press: Boca Raton, FL, USA, 2004. [Google Scholar]
- Rizk, N.M.; Ebada, A.; Nasr, E.S. Investigating Mobile Applications’ Requirements Evolution through Sentiment Analysis of Users’ Reviews. In Proceedings of the 2015 11th International Computer Engineering Conference (ICENCO), Cairo, Egypt, 29–30 December 2015; pp. 123–130. [Google Scholar] [CrossRef]
- vanOyen Witvliet, C.; Vrana, S.R. Emotional Imagery, the Visual Startle, and Covariation Bias: An Affective Matching Account. Biol. Psychol. 2000, 52, 187–204. [Google Scholar] [CrossRef]
- Osgood, C.E.; Suci, G.J.; Tannenbaum, P.H. The Measurement of Meaning; Illini Books; University of Illinois Press: Urbana/Chicago, IL, USA, 1957; Volume 47. [Google Scholar]
- Yan, H.-B.; Huynh, V.-N.; Murai, T.; Nakamori, Y. Kansei Evaluation Based on Prioritized Multi-Attribute Fuzzy Target-Oriented Decision Analysis. Inf. Sci. (N. Y.) 2008, 178, 4080–4093. [Google Scholar] [CrossRef]
- Jindo, T.; Hirasago, K. Application Studies to Car Interior of Kansei Engineering. Int. J. Ind. Ergon. 1997, 19, 105–114. [Google Scholar] [CrossRef]
| Publisher’s Note: MDPI stays neutral with regard to jurisdictional claims in published maps and institutional affiliations. |
© 2021 by the authors. Licensee MDPI, Basel, Switzerland. This article is an open access article distributed under the terms and conditions of the Creative Commons Attribution (CC BY) license (https://creativecommons.org/licenses/by/4.0/).


