1. Introduction
Advances in immersive technologies, such as virtual reality (VR) and augmented reality (AR), have provided another great platform for immersive analytics tasks [
1,
2]. In particular, VR has allowed researchers to explore innovative immersive approaches to visualize data and interact with them [
3]. Recent research has focused on how VR and AR technologies can support learning scenarios [
4]. Virtual reality learning environments (VRLE) play an important role in assisting and promoting learning performance. It can provide students with a rich and tailored personalized learning environment, which allows them to experience the situational and intuitive presentation of knowledge and improves their internal motivation. Therefore, VR-based learning technologies can become excellent tools that can enhance the engagement level of users. In VR environments, the flexibility of workspace organization and the ability to share information and resources can improve knowledge acquisition and enhance the learning experience of users. In particular, VR can be suitable for supporting immersive collaborative analytics tasks, especially when users are in different physical locations. For one, VR can afford collaborators a sense of the presence and the actions of one another within a virtual environment [
5], for example, with the use of virtual avatars of each user [
6,
7]. Moreover, because of its inherent affordance to support the interaction with visual–spatial elements, VR is a viable platform for the collaborative analysis of visual data for sense-making and knowledge acquisition activities. Furthermore, in education applications, research suggests that VR is a suitable collaborative tool because it can support social interactions and experimental, constructivist-based learning in more natural and immersive ways [
8,
9].
Despite its potential benefits to support collaborative sense-making tasks, there is minimal research on the design of collaborative visualizations in VR environments, and, as such, many design questions remain. When immersive analytical tasks are performed in collaborative settings, space is an essential factor, which could involve a virtual workspace or a physical environment. For example, is shared interaction (or control) and workspace beneficial for collaborators to exchange feedback and share input throughout the sense-making process? Similarly, how would users collaborate and share tasks when they are each given a separate workspace within a virtual environment? In non-VR settings, the effectiveness of public and private workspaces has been broadly discussed. For example, Whittaker et al. [
10] claim that a public shared workspace facilitates the monitoring and coordination of activities by allowing direct visual inspections by all participants. Instead, Tang and Leifer [
11] suggest that users prefer to begin representing their ideas and manipulating them privately in their workspace rather than in a public one. Multiple workspaces can be easily implemented in VR environments and, when there are multiple users, they can be allowed to see in real-time the workspace(s) of other users [
7,
12]. However, one underexplored aspect is how users collaborate with visual analytic tasks when they are given separate and/or shared workspaces within a VR environment, especially in learning scenarios.
Another point is that VR environments can be considered as social spaces. In the physical space, proxemics, especially users’ body orientation, has been considered a very important factor in social interactions. In the physical world, spatial proximity, an estimation of people’s desire to communicate [
13], and users’ position arrangement can have an impact on their collaboration patterns using interactive tools. Researchers have highlighted the importance of the position arrangement for mobile devices [
14,
15] and tabletops [
16]. However, do proxemics issues translate to the virtual world where avatar representations are used? To our knowledge, there is limited work that has explored whether this translates to users in the form of avatars in VR environments and how the proxemics in these environments influences collaborative behaviors.
Therefore, this research aims to fill this gap and explores whether shared vs. non-shared interaction (or control) and view is beneficial to collaborative sense-making, learning, and task performance. Moreover, it investigates the effect of position arrangement in VR collaborative environments because it is helpful to know whether the position arrangement in these virtual environments influences the collaborative behaviors of users who need to perform visual analytics tasks. To explore the above issues, we have designed and developed a VR application that allows users to investigate and learn the structural and transformational properties of 3D geometric shapes. We used the tool in an experiment with two collaborative modes: (1) shared and (2) non-shared control/view. To explore the position arrangement, participants can freely switch between three positions in the virtual space: (1) side-by-side (S-S); (2) corner-to-corner (C-C); and (3) back-to-back (B-B).
This paper presents the following main contributions: (1) an exploration of the task performance, engagement level, and collaboration behaviors and patterns of users in a VR environment that deals with visualizations; (2) an investigation into the effects of private/personal and public virtual workspace and virtual proxemics relationships and arrangements; (3) an understanding of the positive affordances and limitations of shared and non-shared modes of collaborations; and (4) a set of recommendations for the design of VR systems aimed at supporting collaborative interaction with visualizations.
2. Related Work
2.1. Collaboration with Visual-Spatial Information in VR Environments
Collaboration brings many benefits to the exploration of visual–spatial elements (the representation or visualizations, for short), which play an important role in data analytics [
17] and exploratory learning tasks [
18]. Isenberg et al. [
19] defined collaborative visualization as the shared use of computer-supported interactive visual representations of data by more than one person to do sense-making tasks. Some researchers have tried to provide different representation possibilities to explore collaborative interaction in colocated tasks [
20]. For example, Prouzeau et al. [
21] investigated how different types of graph visualizations affect multiple users’ exploration. Similarly, Chen et al. [
22] explored the effect of visual cues on task performance and user experience in a collaborative AR pointing scenario.
Unlike traditional platforms, VR allows fully immersive experiences and intuitive ways to connect participants over geographic distances [
23,
24]. For example, Bente et al. [
25] explored the influence of avatars on social presence, interpersonal trust, perceived communication quality, nonverbal behavior, and visual attention in a VR environment. To a large extent, VR can increase the sense of presence and situational awareness [
26]. Therefore, it represents an optimal platform to provide unique immersive experiences for users [
27,
28] and to support sense-making with visualizations [
29] and social interaction for group activities. However, its effectiveness depends heavily on how the virtual workspace(s), whether for individuals or the whole group, and collaborative interactions are provided, as a poor design may harm the collaboration and exploratory process [
4].
In recent years, there has been some emphasis on investigating how to facilitate collaboration in VR. Buxton [
30] argued that quality sharing within an environment and the task space could lead to better collaboration and telepresence experience. Fleury et al. [
31] compared remote collaboration using a three-hand manipulation technique for scientific data analysis. Their results showed that their remote collaborative manipulation technique was significantly more efficient than the single-user manipulation. Donalek et al. [
32] explored the use of immersive VR platforms for scientific data visualizations and showed that immersion led to a demonstrably better perception and understanding of the data. Royston et al. [
33] presented an HMD-based collaborative environment for interacting with social network visualizations. Although Donalek et al. [
32], Royston et al. [
33], and others (e.g., [
34]) have suggested that their tools provided an easy and natural platform to help multiple users explore visualizations, these studies are somewhat preliminary and limited. Moreover, they have not investigated how separate and shared workspaces affect user behaviors and collaboration within these VR environments, how their systems influence the collaboration process, or whether their techniques facilitate (or hinder) collaborative activities.
2.2. Collaborative Immersive Learning Analytics
Immersive analytics relies on the use of interactive technologies for data visualization, analytical reasoning, and decision making [
8]. By extension, immersive collaborative analytics investigates how groups of users collaborate and interact in a collaborative setting using such technologies [
35].
The high level of immersion afforded in VR/AR provides benefits beyond traditional desktop-based visualization tools, and can lead to a demonstrably better perception of data visualizations and a better retention of the perceived relationships in the data [
32,
36]. An increasing number of analytical activities in a wide range of areas are expected to rely on collaborative activities within VR environments to improve their efficiency and effectiveness [
37]. In the context of learning activities, recent research has demonstrated that immersive systems could foster enhanced experiences that draw on situated learning [
38,
39]. For example, Arya et al. [
40] found that online real-time immersive learning using simulated 3D avatars can enhance immersiveness and web integration without the need for physical presence during collaboration. Besides, they could also effectively affect users’ degree of engagement and learning efficiency [
41,
42]. Another study [
43] suggested that VR ultimately improves the students’ understanding of the content, performance and grades, and learning experience in engineering education. Similarly, Lorusso et al. [
44] suggested that their semi-immersive VR system (NIRVANA) elicited high levels of engagement, cooperation, and social interaction.
Immersive collaborative analytics has been applied to various learning domains like assembling personal computers [
45], multiculturalism [
46], and sciences [
47]. Although these studies suggest that multiple aspects can affect learning performance, task efficiency, collaborative behavior, and immersion, there is still limited research that has focused on VR. Moreover, as much of this research is still emergent, these aspects and their interactions are not well understood. While prior work demonstrated how an immersive virtual exploration could be added to students’ learning activities, they have not explored collaborative strategies, nor have they been able to provide specific design guidelines for collaborative activities within immersive VR environments.
2.3. Shared vs. Non-Shared View and Control
Shared views and interaction (or control) for multiple users play an important role in collaborating within a VR environment. Bonada et al. [
48] presented preliminary ideas toward a vision of personalized views in immersive collaborative analytics systems. The different separate views in a system developed by Leigh et al. [
49] caused confusion in their participants, especially when they wanted to communicate with each other what they saw in the virtual environment. Their results indicate that an appropriate interface should have a component that allows participants to share their views to help maintain proper coordination of activities and group analytical efforts. Tang et al. [
11] suggested that a shared view of the workspace activity and the ability to interact and build upon others’ work facilitates the process of developing ideas during collaboration. Chuah et al. [
50] presented the CoMotion application to allow group sharing. When working together with CoMotion, the shared frame remains active even if the original user’s workspace is closed, providing both synchronous and asynchronous collaboration. However, their research is for desktop displays, not for VR. Besides, Donalek et al. [
32] added a broadcasting function where users can obtain a shared view of the workspace with another user. For the research above, only one study mentioned the user study [
11]. Others, however, did not report any experiments with users.
On the flip side, Nguyen and Duval [
6] have argued that shared views and manipulation could be detrimental to users’ explorations because they can be distracted by other users’ actions and can lead to the unawareness of any changes to their own representations. Agrawala et al. [
51] looked at the role of specialized views in their projection-based VR system. They concluded that these specialized views might be effective for reducing information overload or balancing the boundary between public and private spaces. One aspect that they did not explore is whether the non-shared (private) views would enhance collaboration compared with having the shared (public) views only. Wossner et al. [
5] explored collaboration modes using a volumetric rendering application with three modes: loose coupling, tight coupling, and master/slave coupling. They, however, presented only limited results and without showing clear patterns of three collaboration modes. In addition, they did not have an entirely noncoupled mode and pointed out another important limitation: their users were not totally aware of which parts of the system were synchronized in the different collaboration modes.
In summary, most research has only explored how users interacted with their own workspace or with the same space together, as a group. However, the above research points to the fact that there is still very little work that has thoroughly investigated the effects of shared and non-shared interaction and view on collaborative exploration of visualizations in VR environments. In addition, little exploration has been carried out with tools that can support users in freely switching between public and private workspaces. Our research aims to fill these important yet under-explored aspects of VR environments.
2.4. Collaborators’ Position Arrangements
In the physical world, spatial relationships and the positioning of people in close proximity can significantly influence their performance and behavior during collaboration [
15]. That is, different relative physical orientations afford different types of collaborative styles and user experiences when working together (e.g., competition vs. collaboration) [
52,
53]. Whether the same applies to VR environments is not clear because there is not much research that has looked at this in detail. For social spaces in VR, it is a key factor that affects how users will behave when collaborating. F-formations, a social construct that describes the distance and relative body orientation among a group of users, consider the spatial relationships that occur as people arrange themselves during face-to-face interaction for optimal task-dependent communication [
15]. In the real world, different body orientations, such as face-to-face, side-by-side, or corner-to-corner, can afford different types of collaboration behaviors and feelings: competitive, collaborative, or communicative. Similar to human-to-human interaction, it is important for immersive collaborative systems to investigate whether avatar-to-avatar, or virtual proxemics relationships, can also result in different collaborative experiences and performances, and what these are.
Much research has explored how users worked together under different collaborative couplings in other platforms, such as tabletops [
16,
54] and displays [
55,
56]. When wearing VR HMDs, users are immersed in the environment and, as such, the only way to perceive other collaborators is via their avatars. In the CALVIN VR system [
49], users can see the avatar of their partners, including positions and orientations, but it is difficult for them to perceive what their partner is viewing and their actions. Duval et al. [
57] proposed the IIVC model that enables developers to embed the users’ physical environment into the virtual environment and can make a user aware of the physical limitations of their partners. Despite this research, whether avatar positioning has an effect on users’ tasks and their perception of them is an aspect that has not been studied in great detail, especially in the context of exploring visualizations in learning scenarios.
Our research seeks to increase the understanding of whether proxemics relationships and arrangements that occur in the physical world also apply to 3D virtual worlds and what effect they have on users’ task performance and learning. We want to draw implications for how we can design collaborative VR tools that deal with visualizations of nontrivial concepts for learning, sense-making, and data analysis.
In short, collaboration brings many benefits to exploratory and sense-making activities with interactive visualizations. Research on collaborative visualizations has mainly focused on the use of large displays (such as interactive tabletops and situated displays), small screen displays (such as mobile phones and tablets), and desktop displays. However, VR is still largely an emerging but fast-growing technology that is changing how we can interact with virtual objects and environments. To the best of our knowledge, there has not been any research looking at collaborative visualizations in VR learning environments. This research aims to fill this gap and expand our understanding of how collaborative activities with visualizations can take place within VR. Therefore, we extend the prior work with a comprehensive experiment with a collaborative visualization VR tool to explore issues of public and private workspaces, control and view sharing, and social space arrangement.
3. Virtual Reality Visualization Tool
3.1. Immersive Virtual Reality System Overview
A higher degree of immersion afforded by VR could further enhance learners’ exploratory learning. Therefore, to conduct this research, we developed an immersive VR application to facilitate the collaborative process of exploring, analyzing, and learning 3D geometries [
58,
59]. The multiuser collaborative virtual immersive tool was developed in Unity3D (version 2017.1.3f1).
Figure 1 shows a screenshot of the tool. The cube, octahedron, and tetrahedron were the main 3D representations.
There were some visuo-interactive techniques embedded within the tool to support users’ interaction with the 3D solids [
60].
Figure 1 shows the workspace, which is implicitly divided into three sections: (1) users’ current and possible arrangements (see
Section 3.3); (2) exploratory tasks to be completed during the experiment; and (3) 3D (enlarged) solid visualizations, which are interactable through sets of visuo-interactive techniques. The tool provided the functions of taking notes and erasing, which are started by clicking the buttons on the Oculus controller. The function of taking notes is provided to users for more convenient discussion (see
Figure 2). When users need to mark important points, they can click button A on the controller and a line-based pen will be shown. Besides, it also allows users to erase the notes using the eraser function. Before using the eraser, users have to first hide the pen. Then the notes taken by users will disappear one by one by clicking button B on the controller.
Users can operate the virtual joystick on the solids and maps using a hand in a VR environment (using the controller in the real world to move the virtual hand and grab the virtual objects) to change the shape of solids, as shown in
Figure 3. Then users were required to complete the questions on the task panel. Besides, users were allowed to change the position arrangement freely using the controller during collaboration.
The tool was designed to support collaborative interactions. In the virtual space, each user was represented as an avatar. Prior research has shown that the avatar representations could affect users’ behaviors, how they use their interpersonal space, and their communication patterns [
61,
62]. As our research was not about the effect of different avatar representations, we used a low-realism avatar representation that could clearly show users’ hand and head movements and their body orientations for all our conditions. We tried to let our participants not be distracted by the features of the avatars but focus on the main content of the collaboration. The movement of hands and head was continuously synchronized between two users. As such, they were able to see easily the physical actions of their partner, where they were looking at, and which solids they were interacting with.
3.2. Shared/Non-Shared Interaction
The tool had two workspaces to support two users simultaneously, one for each user. All visualizations were interactive, and each participant could interact with the visualizations in these workspaces. To investigate the effect of the shared/non-shared control and view on task and learning performance, we developed two versions: Shared and Non-Shared.
In the Non-Shared version, the two workspaces were not dynamically linked. As such, changes of the solids (like their position, orientation, rotation, or transformation states) in one workspace would not be reflected on the corresponding solids in the other user’s workspace (see
Figure 4a). In other words, participants would not know what their partner was doing unless they turned their heads to take a look at the partner’s workspace.
In the Shared version, the virtual solids in one workspace were connected to the corresponding solids in their partner’s workspace. That is, their position change, rotation, and morphing states were instantly synchronous in both workspaces (see
Figure 4b). In this way, the participants could always see what their partner was doing without the need to turn their head (but they could if they still wanted to). To avoid confusion, each visual object was designed so that only one user could manipulate it at a time. The solid currently being controlled by one user was no longer selectable and interactable for the other user. For example, when user A interacts with the cube, the cube on user B’s workspace could not be manipulated until user A releases control over it.
3.3. Switching Position Arrangements
As stated earlier, users’ position arrangement affects how they work together and their perception of the nature of the collaborative work. The tool had three predefined positions for participants to switch freely while interacting with the tool to allow us to assess the possible effects of position arrangements on their task performance and engagement.
Figure 5 shows these three arrangements: (1) S-S (see
Figure 5a); (2) C-C or L-shape (see
Figure 5b); and (3) B-B (see
Figure 5c). These positions had been inspired by the F-formations [
32]. We also included the B-B position to see if and how such positioning would affect users’ collaboration experience and performance.
In addition to the three positions with separate workspaces, we also included an additional condition where users would share one public workspace in the S-S position (see
Figure 5d). We had the merged workspace option for the Shared group because it represented the case of multiple users collaborating around one single workspace (e.g., around a large display in real life). In the Non-Shared version, where participants were not to be able to see the effects of their partners’ interactions on their own workspace, the single workspace would be contradictory to the definition of the non-shared view. Thus, we did not include this case for Non-Shared participants.
4. Experiment Design
4.1. Participants
Thirty undergraduate students (14 males) aged between 18 to 30 years old (M = 21.23, SD = 2.445) were recruited to participate in the study. They were from a local university with different backgrounds. None had used the tool before the experiment. There were 10 participants in each group.
Table 1 shows the descriptive data of the participants in each group. A between-subjects design was used to avoid carry-over effects, where each participant could only interact with one version of the tool. This study was approved by the University Ethics Committee (UEC) of Xi’an Jiaotong-Liverpool University.
The experiment had three conditions. (1) Singles: one participant alone interacted with the tool to complete the task; (2) Shared: a pair of participants interacted with two VR headsets, each running the shared version of the tool, where controls were shared and the view of the two workspaces was synchronized. In the shared mode, only one user could control the system at a time, so the two users needed to coordinate their interactions; (3) Non-Shared: a pair of participants interacted with two VR headsets, each running the non-shared version of the tool, where control and view were independent of each other. In this user study, we chose a colocated setting to allow participants to use verbal communication in real-time if they needed to talk with each other.
4.2. Apparatus
The experiment was run using two laptops that had an i7 CPU and a GTX1070 GPU. Attached to each laptop was a set of Oculus CV1 HMD with a 1080 × 1200 display resolution for each eye. The Oculus Touch was used as the input device. Users’ heads and hands were tracked in 6 DoF (Degrees of Freedom) by the Oculus Touch sensors to reproduce users’ physical actions in the virtual environment via their avatars. During the experiment, two participants were standing in front of the device and were allowed to move around in the work area. The HMD cables were long enough to allow them to move freely within the specified space. The two laptops were networked and connected to a local server so two users could be copresent in the same virtual environment and able to see and interact with each other in real-time (see
Figure 6b,c). The two laptops are placed close to each other in the same lab space (see
Figure 6a).
4.3. Analytical Tasks
Pre- and post-test: Users were required to complete a test before the experiment and the same test after. They would allow us to determine their knowledge of the subject before and after interacting with the tool. The test had 18 questions based on the transformational and structural properties of the solids. Each question, when completed correctly, was given a mark of one (18 marks in total). Two users were required to complete the test independently.
Collaborative tasks: During the experiment, participants were given a set of exploratory, question-based tasks to complete with the help of the tool. The tasks were intended to provide participants with predetermined goals to facilitate data gathering within the study’s short duration and encourage collaboration and discussion during the exploration process (see
Figure 7 for some sample tasks). Each pair was asked to work collaboratively to arrive at the correct answer for each task. Each pair could only give one single answer for each question.
Participants were initially set at a position following a counterbalanced order when the application started to avoid biasing the participants toward one arrangement. They could also freely switch to any of the predefined position arrangements (S-S, B-B, and C-C) for both conditions. The Shared users could also use a fourth arrangement, the single public workspace (see
Figure 5). To prevent the situation where one user wanted to keep a position, but the one user wanted to change, before switching positions both users had to reach a consensus on which position they wanted to be in before making the switch. A researcher would be present with the participants to mediate conflicts, if any. While they interacted with the system, they were allowed to discuss with each other freely.
4.4. Procedure
The experiment was divided into seven phases.
P1. A brief description of the experiment and procedure was given to all participants, who also signed a consent form to participate in the study (~5 min);
P2. Pretest: complete the pretest, which contained 18 questions about the structural properties and transformational properties of 3D shapes (10 min);
P3. Let the participants get familiar with the VR device and tool to understand better how to interact with the visualizations and, in the case of the paired groups, how to switch from one collaboration position to the others (~10 min);
P4. Users were asked to finish a set of problem-based tasks while interacting with our tool (~40 min);
P5. The Singles participants were asked to complete the VisEngage questionnaire [
15] to assess their perceived level of engagement with the tool. The other two collaboration groups were required to complete the VisEngage questionnaire [
15] and the collaboration questions listed in
Table 2 to measure their perceived levels of engagement and collaboration (~10 min);
P6. Post-test: same as the pretest (10 min);
P7. Interview with participants about their feelings and perceptions of the tool and experiment. Participants in the two collaboration groups were also asked about their subjective feedback about the collaboration and the different position arrangements (~5 min).
The language used in the task questions was plain and easy to understand. The whole experiment took about 90 min to complete, and participants were allowed to take breaks at any time. This setup was similar to a typical weekly lab session the participants would attend for their classes. A short training session was provided to participants before starting the task to let them become familiar with the interface and interactive features. After that, we would not provide any further assistance to participants. The interaction process was video captured for later analysis.
4.5. Hypotheses
We tested three hypotheses in this experiment:
Hypothesis 1 (H1). Task performance: If task performance depends on collaborative engagement, then both Shared and Non-Shared groups would perform better in the tasks than the Singles group. At the same time, the Shared group would perform better than the Non-Shared group. Prior research has emphasized the importance of collaboration in supporting learning. We expected that the same would apply to collaborative problem solving in VR environments.
Hypothesis 2 (H2). Engagement level when collaborating: If the engagement level relies on collaborative exploration, then the Shared group would have a higher perceived engagement level than the Non-Shared and Singles groups. For subscales, the Singles group would have a higher level of perceived control than the paired group. However, for other items, the Shared group would have higher engagement scores than the other two groups. Shared view/control would facilitate communication and interaction, which could contribute to a higher engagement level.
Hypothesis 3 (H3). Position arrangements: If users’ choice of position arrangement is to enhance their collaboration, then participants in the Shared group would likely choose to be in the S-S or the “public” setting the longest, while the Non-Shared participants would be in the C-C position the longest. This hypothesis was inspired by F-formations (see Section 3.3). Participants in the Shared group would feel more connected, and thus either the S-S position or “public” setting would be more preferred since they would favor better collaboration. On the other hand, the Non-Shared participants could feel less connected to their partners. As such, the C-C position could be a better option because it allows users to see their partner’s workspace with more ease. 4.6. Data Collection
Prior research has indicated that students’ persistence, academic achievement, and satisfaction with learning can be easily reflected by their engagement level [
63,
64]. Research by Liu et al. [
65] found that a low level of engagement indicates poor collaboration. Our study has adopted two methods, qualitative self-reporting and quantitative measures, to access users’ engagement levels. The seven-point Likert scale VisEngage user engagement questionnaire proposed by Hung and Parsons [
66] was used to measure users’ engagement levels (via self-reporting). VisEngage quantifies 11 engagement characteristics with 22 seven-point Likert scale questions. Moreover, we recorded videos that captured participants’ behavior when interacting with or collaborating using the tool. We also collected their subjective feedback in the post experiment interviews.
In addition to the engagement questions, another questionnaire to assess collaboration experience was also administered. It had 16 seven-point Likert scale questions, which were adapted for our purpose from the works of Isenberg et al. [
54], Jakobsen and Hornbaek [
55], Hwang and Hu [
9], and Lee et al. [
67]. We categorized these questions into four groups with reference to the research of Monahan et al. [
68]. These questions were used to measure the collaboration experience in different positions as well. The answers to these questions would show participants’ perception of how they collaborated when interacting with the tool and other users.
5. Results
In this experiment, we employed both quantitative and qualitative measures. By assessing users’ performance on task questions and ratings on engagement and collaboration questions, we were able to quantify their problem-solving process and, in the case of the paired groups, their perceived level of engagement and collaboration. Video recordings and screen captures of the interactions were analyzed to assess their collaboration efficiency, the frequency of their communications, and how they tended to work together with the tool within the virtual environment.
We next present the results of the quantitative measures first and then combine those with the qualitative measures to cross-validate user performance and collaboration patterns. For simplicity, we will use M and SD to denote mean and standard deviation. The significance level is set to 0.05.
5.1. Test Improvement Scores
Table 2 shows the descriptive data of the test score difference between the pre- and post-test. They show that all participants, regardless of the tool they used, experienced different levels of improvement. Participants from the Singles group had the lowest mean improvement and lowest standard deviation. The Shared group obtained a very similar mean improvement to the Singles group, but their higher standard deviation indicated that the level of improvement was not as homogeneous. The Non-Shared group had the highest improvement on tests. Despite these differences, no statistical significance was found among the groups, as indicated by the result of a one-way ANOVA (F(2,27) = 0.391,
p = 0.680).
5.2. Performance and Completion Time on Collaboration Tasks
As stated before, participants working either independently or collaboratively in pairs were required to complete a set of tasks. The correctness (one mark for each question) on the task questions and the time spent could provide insights on task efficiency, especially how participants’ interactions were affected if they had shared and non-shared control and view.
Score. An ANOVA test yielded a significant difference in task scores among the three groups (F(2,27) = 3.371,
p = 0049*). A further Duncan’s post hoc test (see
Table 3) showed that the collaborative groups generally obtained higher scores than the Singles group. The Shared group obtained the highest task performance, which was significantly higher than Singles group (
p = 0.039*). There were no statistical differences between the Non-Shared group and either of the other two groups.
Time. The average time spent by the shared and non-shared pairs was very similar. The Singles group generally spent more time.
Table 4 shows the descriptive data. It is also noteworthy to mention that the Singles group had a large standard deviation. Due to this notable nonhomogeneity, Welch’s ANOVA test was used to check if there was significance in the data that did not meet the equal variance assumption. No statistical significance was found (F(2, 16.040) = 1.369,
p = 0.283).
5.3. Engagement with the Tool
5.3.1. Overall Engagement Ratings
As mentioned earlier, we used the engagement questionnaire [
66] to gauge users’ engagement levels while collaborating. The mean ratings of Non-Shared, Shared, and Single’s groups were 133.90 (SD = 10.796), 134.10 (SD = 14.216), and 134.30 (SD = 13.005), respectively. No significant difference was found on overall engagement level from a one-way ANOVA test (F(2,27) = 0.002,
p = 0.998).
5.3.2. Ratings on the 11 Engagement Categories
Figure 8 shows the results according to the 11 individual categories of engagement. To explore whether the two interaction modes influenced users’ ratings on each category, we performed the Mann–Whitney U test, which showed that control was rated significantly higher by the Singles group than the Non-Shared group (U = 21.50,
p = 0.023*). The difference for the exploration category between the Shared and Singles groups was at the margin of being significant (U = 26.50,
p = 0.056). No other significant differences were found for the other engagement categories among the three modes.
5.4. Collaboration Patterns
In this section, we further dive in and investigate their collaboration patterns and combine these findings with participants’ comments from the interviews. The Mann–Whitney test was used to conduct pairwise comparisons and analyze potential differences for each collaboration category (i.e., communication, collaboration, comfort, and satisfaction) between the two interaction modes and position arrangements. For data that did not meet the preassumptions of the test, independent t-tests with bootstraps were used instead. The bootstrap results were based on 1000 bootstrap samples.
5.4.1. Collaboration Categories
Participants in the two paired groups were asked to complete a survey about their perceived level of collaboration right after completing the engagement questionnaire. There were sixteen seven-scale Likert questions focusing on four different categories that could influence the process of participants working together: communication, collaboration, satisfaction, and comfort [
9,
45,
46,
69].
Table 5 shows the questions for each category. This comparison was for assessing how participants conceived their collaboration with shared and non-shared control/view, and when placed at different position arrangements.
Figure 9 shows the mean ratings for the four categories. As can be observed, although the Shared group gave generally higher ratings than the Non-Shared group, no significance was spotted between the two interaction modes. It is evident that shared control and view fostered greater collaboration, communication, and satisfaction, while comfort did not vary very much. For Question 5 (see
Table 4), which was related to task division, the Non-Shared group gave a rating of 4.3 (above neutral), whereas the Shared group gave a rating of 5.3 (above slightly agree). It seemed that shared interaction and view could facilitate task division. We observed that these participants tended to divide up tasks from the beginning, which improved their efficiency and problem solving. For Question 9 (see
Table 3), which dealt with the awareness of the partner’s actions, the Shared group gave a rating of 6 (Agree), while the Non-Shared group only gave a rating of 4.4 (Slightly Agree).
We also noticed that the pairs who were not acquainted with each other before the experiment talked more in the shared version than those in the non-shared condition. In the words of one participant, shared interaction could “force” participants to exchange ideas and work together closely. As a result of this, they had to talk more than those in the Non-Shared group.
5.4.2. Position Arrangements
For the two collaborative groups, we incorporated different possible position arrangements within the VR environment. These participants could choose these three arrangements: S-S, C-C, and B-B (see
Figure 5).
Non-Shared group. In general, these participants spent most of their time on S-S position (M = 1357.62s, SD = 546.04), about twice as much than C-C (M = 727.54s, SD = 616.59) and four times more than B-B (M = 305.34s, SD = 135.20). Due to the nonhomogeneity of variance, the Dunnett’s T3 post-hoc test was used to find out if there were significant differences in their means. The results indicated that participants spent significantly more time in the S-S position than the C-C (p = 0.005**) and B-B (p < 0.001***) positions. When asked about their preference for these positions, S-S was ranked the first choice by 60% of the participants.
Figure 10 shows the results of the collaboration questions for position arrangement in the Non-Shared version. We can observe that these participants had the best collaboration experience in S-S and the worst experience in B-B. The scores of the S-S position for the four categories were all higher than the Corner position. Likewise, C-C received higher scores in all categories other than Back. The Mann–Whitney tests showed that S-S was significantly more favored than B-B in terms of communication and collaboration. C-C also contributed to better communication than B-B. Independent
t-tests with bootstrap showed that S-S was rated significantly higher on comfort and satisfaction than B-B. Participants may have thought the B-B position prevented them from communicating and collaborating, which had led to a less comfortable and satisfactory experience.
Shared group. As stated earlier, in the shared mode, participants had four available positions to choose from: S-S, C-C, B-B, and Single public workspace.
Table 6 shows the descriptive data of how much time they spent on each of the four positions. Results showed that they spent a longer time in the S-S position and the public workspace than C-C and B-B. Due to the nonhomogeneity of variance of the data, we used the Dunnett’s T3 post-hoc test to determine if there were significant differences. It showed that participants spent significantly more time in S-S than C-C (
p < 0.001). Like the Non-Shared group results, 80% of participants rated B-B as the least preferred one, while 60% of participants rated S-S as the most preferred position. In the case of the single public workspace, only 30% rated it as their most favorite position, although they actually spent the longest time using this single workspace setting. It was interesting that participants had different opinions of the public workspace. One participant favored it, while one other participant ranked it lower.
Similar to the non-shared mode, S-S got the highest scores in all categories (see
Figure 11). The S-S was rated significantly higher in all four categories than C-C and B-B. The single public workspace was rated significantly higher than C-C on communication and significantly higher than B-B on communication and collaboration. It is interesting that S-S was rated significantly higher than the public workspace on satisfaction. We could see that while collaborating in the public workspace, users felt less satisfied than having a separate workspace of their own.
6. Discussion
In this section, we discuss the results from three aspects: (1) task performance; (2) engagement level and collaboration patterns; and (3) position arrangements and collaboration behaviors.
6.1. Task Performance
As the results show, all three groups have benefited from interacting with the VR tool—they all show improvements in their postexperiment test scores. However, we could not find any significant difference in terms of test improvement scores, which does not support our hypothesis H1. According to the mean results for collaborative tasks, compared to the two collaborative groups, participants working alone had the lowest task performance while still spending the most time solving the tasks. From this perspective, having participants working together (in our case, in pairs) might be positive for problem solving and sense-making even within a VR environment. Participants were able to solve the exploratory tasks more efficiently and gained more knowledge. This result is somewhat contradictory to the findings reported in [
70]. Their investigation of the effect of competition and collaboration on the memory recall of objects randomly placed in an indoor virtual environment (similar to a shopping mall) has shown that single users have the best memory recall as compared to two users collaborating together. One main reason that could account for this difference is the nature of the tasks. In their study, users are only required to memorize object positions in a 3D virtual space. In contrast, in our scenario, participants had to perform analytical reasoning tasks to gain an understanding of abstract concepts, which invariably would have required more cognitive demand than merely remembering positions. It seems that while exploring with these visualizations to solve more complex tasks, working in pairs, whether having shared or independent views, could be more helpful than as single users alone.
Each version of the tool provides different collaborative affordances. Both groups of paired users were able to support each other in the tasks. We observed that the Shared group had the best task performance (significantly higher than the Singles group and higher than the Non-Shared group) but spent the smallest amount of time. As such, the shared control and view might be beneficial on task performance for real-time collaborative interactions compared to working alone, which aligns partially with H1, as we can see an improvement of collaboration in supporting learning. This finding is also supported by the results in [
31], where the researchers stated that their remote collaborative manipulation technique was significantly more efficient than the single-user manipulation. However, we did not find strong evidence showing that the shared interactions/view is significantly more beneficial than the non-shared interaction/view. One reason for this is that the two users were very close to each other in the VR environment. Therefore, even for the Non-Shared group, it was easy for the pairs to look at the workspace of the partner. From this perspective, there might not be much significant difference in task performance between the Shared and Non-Shared groups. For the Non-Shared group, we can see that they obtained the highest improvement between pre- and post-test. Although it is not significantly higher than the Shared group, this result seems to indicate that the non-shared control and view could have helped users in gaining better understanding and recall of information. There is one main reason for this. As the Non-Shared users have benefited from having a partner to share their explorations and tasks with and, at the same time, they had control over their private workspace, they had more freedom to make their own explorations (e.g., to test their ideas and verify their hypotheses), and this could have helped them gain better understanding of the concepts. For Single users, they had to spend more time solving problems by themselves, individually. In this sense, it may lead to nonsignificant differences among the different conditions.
6.2. Engagement Level and Collaboration Patterns
As we mentioned earlier, immersive systems can effectively affect the degree of engagement of users. We can observe from the overall engagement scores that the three groups obtained a similar level of engagement. This result does not provide support for our H2. If we look closely into the mean ratings of each category, Single participants gave lower ratings on challenge, exploration, and discovery. By inference, we can say that there are perceived and actual benefits of having a partner to work with. However, the Singles group provided a significantly higher score than Non-Shared one on control, which partially supports H2. By inference, we can say that even though participants in the Non-Shared group had control over their exploration, just having a partner interacting alongside made the participants feel less in control of this process. They might feel to have less freedom and were somewhat influenced or even ‘bothered’ by what their partner was doing or saying. This was especially the case for the Shared group. Between the two collaborative groups, participants in the Non-Shared group felt that shared interaction could be especially beneficial for joint discoveries and explorations. These participants also felt very focused on the visualizations and tasks because the shared view made it easier for them to know what their partner was doing. This could have helped enhance their level of attention on how the visualizations were changing in response to their partner’s interactions.
In addition, the shared view could have supported a more fluid collaborative experience (than the non-shared view). According to the video recordings, we observed that participants in the shared condition tended to divide the tasks between them, and they did so very quickly and more often. We also noticed that the shared control facilitated more communication between each pair. Participants in the Non-Shared group tended to do explorations independently and did not often share ideas, despite having the possibility to glance at their partner’s workspace (by simply turning their heads). Therefore, participants in the non-shared condition operated the visual elements more frequently when solving the tasks. In the shared condition, it was evident that these participants discussed more and interacted with each other more. They were observed making demonstrations to each other, commenting on their partner’s interactions, and sharing their insights to arrive at a solution together. In addition, for the Non-Shared participants, when they wanted to discuss the task, they had to walk over to show what they are doing or gesture to each other. Face-to-face communication was more necessary in this case. However, for the Shared group users, they did not need much body movement for sharing ideas. For example, when one user was interacting with one of the solids, the partner just needed to look at his/her own workspace.
It was also quite interesting that participants in the Shared condition tended to show what would qualify as leadership and being more proactive. In previous studies, researchers have shown that while being placed in an immersive virtual environment, participants tended to become leaders and take more proactive roles, but the same participants may not exhibit this quality in the real world [
18]. Our finding could further extend these results to the cases of public and private workspaces. A public workspace within a virtual environment seemed to have fostered proactiveness and assertiveness.
Not everything was positive in the shared condition. These participants gave lower ratings on Creativity. Our analysis of the video captures and interviews with the participants pointed to one main reason for this low rating, and that was when conflicts showed up. We noticed that when sharing the controls, both participants wanted to access the same visual objects at the same time. In such cases, one participant must make a compromise and wait until his/her partner has finished the interactions. During the interviews, one participant commented that “Sometimes I had different ideas with my partner about morphing the shapes, but when I wanted to try something, I have to wait for him to finish his interactions”. When asked why he did not interrupt his partner’s interaction, he commented, “Since I was not sure whether my idea is correct or worth trying, I felt it was better to wait for my partner to finish the interaction; then, I can try my own idea”. It seems that shared interaction may inhibit participants’ implementation of their own thoughts quickly. This was not the case in the non-shared condition, where both users had their own workspace and could do anything they wanted without disturbing the other user. Participants in the shared condition resorted to two actions. One was to wait for their partner’s current operation to finish, and the other was just to give up their intentions. Despite some disadvantages, the Shared group still obtained higher ratings on communication, collaboration, comfort, and satisfaction. It was then evident that the shared control and view fostered a greater collaboration experience.
6.3. Preference on Position Arrangements
Whether they shared control or not, 60% of these paired participants ranked S-S as the most preferred arrangement, followed by C-C. Participants spent significantly more time in S-S than C-C in both collaborative modes. This observation is aligned with the data from the user preference questionnaire (60% for S-S). Moreover, for both collaborative modes, S-S received significantly higher scores than C-C among all the categories of the collaboration experience questionnaire, which partially contradicts H3. These results seem to align with findings in [
15], where it was claimed that S-S affords the greatest collaboration experience. Another study also stated that S-S is the most favorable and can improve task efficiency [
53]. However, it is inconsistent with what Marquardt et al. [
15] have suggested, in that C-C promotes further communication. This may be because, in the VR environment, they preferred to communicate in a way that they could easily see their partner’s avatars, and their interaction results with less body rotation (e.g., to minimize the effect of motion sickness). Our participants favored the S-S position because they felt that it was easier for them to cooperate when solving the tasks as a team and facilitated communication in the VR environment. When asked why, the participants gave comments like: “I can easily see what my partner was doing without large body movements”, “I was close enough so I can easily communicate with my partner and show something [to him]”, and “I was so close to my partner that we could easily communicate and divide up the tasks”. However, one other participant who ranked it lower had a different point of view: “I was too close to my partner, so it was sometimes messy… I wish to have more private space”.
It is also noteworthy that B-B was ranked the least preferred by 90% of the participants. This was somewhat unexpected, as we had thought that with shared view, where the interaction of one participant was reflected on the other participant’s workspace, there would no longer be a need for participants to directly see what the partner is doing in real-time (like looking at his or her side). One of them stated, “I can barely see what my partner was doing when I was interacting with my own visualizations”, and another commented that “It was just hard to share information between us, I always had to turn around”. Our video records also show that, although they had a shared view, when they needed to discuss with each other, these participants still wished to have a clear sense of the physical movements of their partner’s avatar in the virtual environment. Therefore, having each user’s avatars, movements, and manipulations continuously visible to one another could enhance their awareness of each other, which seemed to improve their collaboration experience. Incidentally, the participants in the non-shared condition shared the same feelings about the B-B position.
In addition, we observed that participants in the non-shared condition preferred to be positioned physically and perceptually closer to their partner in the virtual environment. This would allow them to see what their partner was doing and to exchange ideas together when needed (and, as stated earlier, mostly when they wanted to check if their answers matched). In the B-B position, they had to turn their heads to look at what their partner was doing. Therefore, they rated this position the lowest. At the same time, when they stayed in the B-B position (even if they spent the least amount of time on this position), we observed that they had very little communication with each other because of the greater physical exertion needed to talk with each other. In the S-S and C-C positions, they would discuss more.
For the shared condition, it is interesting to note that these participants spent the longest time staying in the single public workspace setting, but only 30% of them rated it as their most favorite arrangement. This observation indicates that, although participants favored a separate workspace, they would think the public workspace is more beneficial for collaborative tasks. In addition, from the results of the collaboration questions, we found that the public workspace was rated significantly lower on satisfaction than the S-S position. This observation reveals that collaborators felt less satisfied when their avatars were in close proximity to one another, which aligns with social norms and conventions (like face-to-face communication in the real world). From these participants’ comments, we could see that with shared view, where participants could always see what the partner was doing, they somehow wanted to have their private space more than staying together in one single shared workspace.
6.4. Design Implications of Our Findings
Based on the results and findings of the experiment, we can distill the following design implications for deploying collaborative visual analytics systems in VR environments.
DI1. When the task involves sense-making or problem-solving activities, placing users in pairs could be more beneficial than having them work as single users;
DI2. When the task involves sense-making or problem-solving activities in real-time in a team-based setting, shared view/interaction could be helpful;
DI3. If the goal is to improve the task performance and to facilitate communication between users, shared view could be more helpful than working alone or not sharing the view in real-time;
DI4. In a VR environment, the S-S position arrangement allows for optimal collaboration experience in terms of collaboration, communication, comfort, and satisfaction;
DI5. When implementing collaborative interactions in VR, making the physical actions and manipulations continuously visible to collaborators (even in the form of a simple avatar) is important to users working together.
7. Limitations and Future Work
This research has several limitations, which could also serve as directions for future work. One notable limitation was that during the experiment, we did not consider whether participants’ relative body positions in the real world should be synchronized with their avatar positions. For our case, this may not have a significant impact as the distance between participants was short. However, for a more rigorous experimental design, they will be coincident in the next main study. On the other hand, when the distance among users is large, the direction of sound could have an effect on the user experience (e.g., if users are facing different directions). In future studies, this element may need to be considered when dealing with colocated collaborations. Regarding the position arrangements, we did not include a face-to-face possibility as one of the major forms for collaborating in real-world scenarios. We did this because of the relatively large size of the user interfaces and 3D visualizations, which may block the view of participants from seeing each other. In addition, instead of strictly controlling the time in each position arrangement, we gave the participants the freedom to choose their preferred position(s) because we wanted to find out participants’ preferences for each arrangement. Given that we now know their preferences, in the near future we plan to run a more controlled study on both interaction and position and try to distill further insights that can guide the design of collaborative VR environments.
We did not use a high-fidelity avatar because we did not want the physical features and facial expressions to become a confounding variable in our study. Instead, we chose a simple avatar representation in which users of a pilot study indicated that their features were not culturally orientated and were sufficient to give them a good awareness of the other user’s actual physical movements. Similarly, we did not explore the suitability of the interaction techniques provided in the VR environment. As prior research shows that the types of interactions provided in an interactive environment can affect exploration and sense-making [
60,
71], it is important to explore what types of interactions are suitable in VR collaborative environments. A user-elicitation approach with multiple users is one way to explore the design of simple interaction techniques [
72,
73] or more complicated ones, for example those that include haptics feedback [
74] and involve other body parts in addition to users’ hands [
75].
Finally, as a pilot study, our sample size was small and lacked statistical power to do more robust analyses. Given the number of participants we had per group, we also acknowledge that the results and interpretations of this pilot study are only predictive and may have been underpowered to detect significant differences in certain aspects. On the other hand, the number of participants is within the normal for this kind of experiment (e.g., see [
76]), and the results still led us to several useful findings and observations that have some practical implications. However, further experimentations will be needed to more precisely understand how collaborative modes and position arrangements can influence task performance and immersive experiences of users. In a future study, we will use a larger and possibly more representative sample pool when the situation for large-scale studies is possible.
8. Conclusions
This paper represents a pilot study used to formulate further research about the effect of collaboration mode and position arrangement on immersive analytics tasks in VR. We conducted a user study that compared single users and two groups of paired users who were tasked to work together with a virtual reality (VR) collaborative tool aimed at supporting analytical tasks with visual representations. In both paired versions, users have their own workspaces. One version supported a shared view/control of the visual objects, while the other provided an independent control/view. Although there are a number of limitations present in the pilot study we presented, from our results we have provided some predictive insights. Our results show that paired users with the shared view were able to achieve significantly higher performance on a set of sense-making tasks than the control group with single users. Both groups of users found that the best collaborative position was one that placed their avatars and workspace next to each other (i.e., side-by-side). Having a partner might reduce users’ sense of control over what they could do. Although users were in a virtual world, they still behaved like in the physical world and preferred to be aware of the physical actions of their partner. They were also sensitive about their proximity, even though it was virtual, to each other. Based on this, we will move toward future experiments in which more subjects will be recruited, and more controlled variables are used.
Author Contributions
Conceptualization, L.C., H.-N.L. and F.L.; Data curation, L.C., J.W. and W.C.; Formal analysis, L.C., H.-N.L., F.L. and W.C.; Funding acquisition, H.-N.L. and Y.Y.; Investigation, L.C., F.L., J.W. and W.C.; Methodology, L.C., H.-N.L., F.L. and W.C.; Project administration, Y.Y.; Resources, H.-N.L. and Y.Y.; Software, F.L. and J.W.; Supervision, H.-N.L. and Y.Y.; Validation, L.C.; Visualization, L.C.; Writing–original draft, L.C., H.-N.L., F.L., J.W., W.C. and Y.Y.; Writing–review & editing, L.C., H.-N.L., F.L., J.W., W.C. and Y.Y. All authors have read and agreed to the published version of the manuscript.
Funding
This research was funded in part by Xi’an Jiaotong-Liverpool University’s Key Special Fund (#KSF-A-03 and #KSF-A-19) and Research Development Fund (#RDF-16-02-43).
Institutional Review Board Statement
The study was conducted according to the guidelines of the Declaration of Helsinki, and approved by the University Ethics Committee at Xi’an Jiaotong-Liverpool University (#21-01-09).
Informed Consent Statement
Informed consent was obtained from all subjects involved in the study.
Data Availability Statement
The datasets used and/or analyzed during the current study are available from the corresponding author on reasonable request.
Conflicts of Interest
The authors declare no conflict of interest.
References
- Zielasko, D.; Weyers, B.; Bellgardt, M.; Pick, S.; Meibner, A.; Vierjahn, T.; Kuhlen, T.W. Remain Seated: Towards Fully-Immersive Desktop VR. In Proceedings of the 2017 IEEE 3rd Workshop on Everyday Virtual Reality (WEVR), Los Angeles, CA, USA, 19 March 2017; pp. 1–6. [Google Scholar]
- Lu, F.; Yu, D.; Liang, H.-N.; Chen, W.; Papangelis, K.; Ali, N.M. Evaluating engagement level and analytical support of interactive visualizations in virtual reality environments. In Proceedings of the 2018 IEEE International Symposium on Mixed and Augmented Reality—ISMAR ’18, Munich, Germany, 16–20 October 2018; pp. 143–152. [Google Scholar]
- Cordeil, M.; Dwyer, T.; Klein, K.; Laha, B.; Marriott, K.; Thomas, B.H. Immersive collaborative analysis of network connectivity: CAVE-style or head-mounted display? IEEE Trans. Visual. Comput. Graphics 2017, 23, 441–450. [Google Scholar] [CrossRef]
- Zandavi, S.M.; Hu, Z.; Chung, Y.Y.; Anaissi, A. Augmented reality vision improving educational learning. Aust. J. Intell. Inf. Process. Syst. 2019, 15, 49–58. [Google Scholar]
- Wössner, U.; Schulze, J.P.; Walz, S.P.; Lang, U. Evaluation of a Collaborative Volume Rendering Application in a Distributed Virtual Environment. In Proceedings of the 8th Eurographics Symposium on Virtual Environments—EGVE, Barcelona, Spain, 2 May 2002; pp. 113–122. [Google Scholar]
- Nguyen, T.T.H.; Duval, T. A Survey of Communication and Awareness in Collaborative Virtual Environments. In Proceedings of the 2014 International Workshop on Collaborative Virtual Environments (3DCVE), Minneapolis, MN, USA, 30 March 2014; pp. 1–8. [Google Scholar]
- Piumsomboon, T.; Lee, G.A.; Hart, J.D.; Ens, B.; Lindeman, R.W.; Thomas, B.H.; Billinghurst, M. Mini-Me: An Adaptive Avatar for Mixed Reality Remote Collaboration. In Proceedings of the 2018 CHI Conference on Human Factors in Computing Systems—CHI, Montreal, QC, Canada, 21–26 April 2018; pp. 1–13. [Google Scholar]
- Chandler, T.; Cordeil, M.; Czauderna, T.; Dwyer, T.; Glowacki, J.; Goncu, C.; Klapperstueck, M.; Klein, K.; Marriott, K.; Schreiber, F.; et al. Immersive Analytics. In Proceedings of the 2015 Big Data Visual Analytics, BDVA, Hobart, Australia, 22–25 September 2015; pp. 1–8. [Google Scholar]
- Hwang, W.-Y.; Hu, S.S. Analysis of peer learning behaviors using multiple representations in virtual reality and their impacts on geometry problem solving. Comput. Educ. 2013, 62, 308–319. [Google Scholar] [CrossRef]
- Whittaker, S.; Geelhoed, E.; Robinson, E. Shared workspaces: How do they work and when are they useful? Int. J. Man-Mach. Stud. 1993, 39, 813–842. [Google Scholar] [CrossRef]
- Tang, J.C.; Leifer, L.J. A Framework for Understanding the Workspace Activity of Design Teams. In Proceedings of the 1988 ACM Conference on Computer-Supported Cooperative Work, Portland, OR, USA, 26–28 September 1988; pp. 244–249. [Google Scholar]
- Cardoso, J.; Ribeiro, J.M. Tangible VR book: Exploring the design space of marker-based tangible interfaces for virtual reality. Appl. Sci. 2021, 11, 1367. [Google Scholar] [CrossRef]
- Marshall, P.; Rogers, Y.; Pantidi, N. Using F-Formations to Analyse Spatial Patterns of Interaction in Physical Environments. In Proceedings of the ACM 2011 Conference on Computer Supported Cooperative work—CSCW, Hangzhou, China, 19–23 March 2011; p. 445. [Google Scholar]
- Dearman, D.; Guy, R.; Truong, K. Determining the Orientation of Proximate Mobile Devices Using Their Back Facing Camera. In Proceedings of the 2012 ACM Annual Conference on Human Factors in Computing Systems—CHI ’2, Austin, TX, USA, 5–10 May 2012; p. 2231. [Google Scholar]
- Marquardt, N.; Hinckley, K.; Greenberg, S. Cross-Device Interaction via Micro-Mobility and F-Formations. In Proceedings of the 25th Annual ACM Symposium on User Interface Software and Technology—UIST, Cambridge, MA, USA, 7–10 October 2012; p. 13. [Google Scholar]
- Tang, A.; Tory, M.; Po, B.; Neumann, P.; Carpendale, S. Collaborative Coupling over Tabletop Displays. In Proceedings of the SIGCHI Conference on Human Factors in Computing Systems—CHI, Montréal, QC, Canada, 22–27 April 2006; pp. 1181–1190. [Google Scholar]
- Lee, B.; Hu, X.; Cordeil, M.; Prouzeau, A.; Jenny, B.; Dwyer, T. Shared surfaces and spaces: Collaborative data visualisation in a co-located immersive environment. IEEE Trans. Vis. Comput. Graph. 2020, 27, 1171–1181. [Google Scholar] [CrossRef] [PubMed]
- Heer, J.; Agrawala, M. Design considerations for collaborative visual analytics. Inf. Vis. 2008, 7, 49–62. [Google Scholar] [CrossRef]
- Isenberg, I.; Elmqvist, N.; Scholtz, J.; Cernea, D.; Ma, K.-L.; Hagen, H. Collaborative visualization: Definition, challenges, and research agenda. Inf. Vis. 2011, 10, 310–326. [Google Scholar] [CrossRef] [Green Version]
- Wallace, J.R.; Scott, S.D.; Stutz, T.; Enns, T.; Inkpen, K. Investigating teamwork and taskwork in single- and multi-display groupware systems. Pers. Ubiquit. Comput. 2009, 13, 569–581. [Google Scholar] [CrossRef]
- Prouzeau, A.; Bezerianos, A.; Chapuis, O. Evaluating multi-user selection for exploring graph topology on wall-displays. IEEE Trans. Visual. Comput. Graphics 2017, 23, 1936–1951. [Google Scholar] [CrossRef]
- Chen, L.; Liu, Y.; Li, Y.; Yu, L.; Gao, B.; Caon, M.; Yue, Y.; Liang, H.-N. Effect of visual cues on pointing tasks in co-located augmented reality collaboration. In Proceedings of the 2021 ACM Symposium on Spatial User Interaction—SUI ’21, 9–10 November 2021; pp. 1–12. [Google Scholar]
- Kharoub, H.; Lataifeh, M.; Ahmed, N. 3D user interface design and usability for immersive VR. Appl. Sci. 2019, 9, 4861. [Google Scholar] [CrossRef] [Green Version]
- Soto-Martin, O.; Fuentes-Porto, A.; Martin-Gutierrez, J. A digital reconstruction of a historical building and virtual reintegration of mural paintings to create an interactive and immersive experience in virtual reality. Appl. Sci. 2020, 10, 597. [Google Scholar] [CrossRef] [Green Version]
- Bente, G.; Rüggenberg, S.; Krämer, N.C.; Eschenburg, F. Avatar-mediated networking: Increasing social presence and interpersonal trust in net-based collaborations. Hum. Commun. Res. 2008, 34, 287–318. [Google Scholar] [CrossRef]
- Butscher, S.; Hubenschmid, S.; Müller, J.; Fuchs, J.; Reiterer, H. Clusters, Trends, and Outliers: How Immersive Technologies Can Facilitate the Collaborative Analysis of Multidimensional Data. In Proceedings of the 2018 CHI Conference on Human Factors in Computing Systems—CHI, Montreal, QC, Canada, 21–26 April 2018; pp. 1–12. [Google Scholar]
- Ban, S.; Hyun, K.H. Directional force feedback: Mechanical force concentration for immersive experience in virtual reality. Appl. Sci. 2019, 9, 3692. [Google Scholar] [CrossRef] [Green Version]
- Tran, H.T.T.; Ngoc, N.P.; Pham, C.T.; Jung, Y.J.; Thang, T.C. A subjective study on user perception aspects in virtual reality. Appl. Sci. 2019, 9, 3384. [Google Scholar] [CrossRef] [Green Version]
- Cardona-Reyes, H.; Munõz-Arteaga, J.; Mitre-Ortiz, A.; Villalba-Condori, K.O. Model-driven approach of virtual interactive environments for enhanced user experience. Appl. Sci. 2021, 11, 2804. [Google Scholar] [CrossRef]
- Buxton, W. Telepresence: Integrating shared task and person spaces. Proc. Graph. Interface 1992, 92, 123–129. [Google Scholar]
- Fleury, C.; Duval, T.; Gouranton, V.; Steed, A. Evaluation of Remote Collaborative Manipulation for Scientific Data analysis. In Proceedings of the 18th ACM Symposium on Virtual Reality Software and Technology—VRST, Toronto, ON, Canada, 10–12 December 2012; p. 129. [Google Scholar]
- Donalek, C.; Djorgovski, S.G.; Cioc, A.; Wang, A.; Zhang, J.; Lawler, E.; Yeh, S.; Mahabal, A.; Graham, M.; Drake, A.; et al. Immersive and Collaborative Data visualization Using Virtual Reality Platforms. In Proceedings of the 2014 IEEE International Conference on Big Data (Big Data), Washington, DC, USA, 27–30 October 2014; pp. 609–614. [Google Scholar]
- Royston, S.; DeFanti, C.; Perlin, K. A collaborative Untethered virtual reality environment for interactive social network visualization. arXiv 2016, arXiv:1604.08239. [Google Scholar]
- Xia, H.; Herscher, S.; Perlin, K.; Wigdor, D. Spacetime: Enabling Fluid Individual and Collaborative Editing in Virtual Reality. In Proceedings of the 31st Annual ACM Symposium on User Interface Software and Technology—UIST, Berlin, Germany, 14–17 October 2018; pp. 853–866. [Google Scholar]
- Billinghurst, M.; Cordeil, M.; Bezerianos, A.; Margolis, T. Collaborative Immersive Analytics. In Immersive Analytics; 11190; Marriott, K., Schreiber, F., Dwyer, T., Klein, K., Riche, N.H., Itoh, T., Stuerzlinger, W., Thomas, B.H., Eds.; Springer International Publishing: Cham, Switzerland, 2018; pp. 221–257. [Google Scholar]
- Rosenbaum, R.; Bottleson, J.; Liu, Z.; Hamann, B. Involve Me and I Will Understand!–Abstract Data Visualization in Immersive Environments. In International Symposium on Visual Computing; Springer: Berlin/Heidelberg, Germany, 2011; pp. 530–540. [Google Scholar]
- Mahyar, N.; Tory, M. Supporting communication and coordination in collaborative sensemaking. IEEE Trans. Vis. Comput. Graph. 2014, 20, 1633–1642. [Google Scholar] [CrossRef]
- Sanchez-Sepulveda, M.V.; Torres-Kompen, R.; Fonseca, D.; Franquesa-Sanchez, J. Methodologies of learning served by virtual reality: A case study in urban interventions. Appl. Sci. 2019, 9, 5161. [Google Scholar] [CrossRef] [Green Version]
- Fanini, B.; Cinque, L. Encoding, exchange and manipulation of captured Immersive VR sessions for learning environments: The PRISMIN framework. Appl. Sci. 2020, 10, 2026. [Google Scholar] [CrossRef] [Green Version]
- Arya, A.; Nowlan, N.; Sauriol, N. Data-Driven Framework for an Online 3D Immersive Environment for Educational Applications. In Proceedings of the International Conference on Education and New Learning Technologies—EDULEARN10, Barcelona, Spain, 5–7 July 2010; pp. 4726–4736. [Google Scholar]
- Mystakidis, S.; Berki, E.; Valtanen, J.-P. Deep and meaningful E-learning with social virtual reality environments in higher education: A systematic literature review. Appl. Sci. 2021, 11, 2412. [Google Scholar] [CrossRef]
- Camilleri, V.; Freitas, S.d.; Montebello, M.; McDonagh-Smith, P. A Case Study Inside Virtual Worlds: Use of Analytics for Immersive Spaces. In Proceedings of the Third International Conference on Learning Analytics and Knowledge—LAK, Leuven, Belgium, 8–12 April 2013; pp. 230–234. [Google Scholar]
- Soliman, M.; Pesyridis, A.; Dalaymani-Zad, D.; Gronfula, M.; Kourmpetis, M. The application of virtual reality in engineering education. Appl. Sci. 2021, 11, 2879. [Google Scholar] [CrossRef]
- Lorusso, M.L.; Travellini, S.; Giorgetti, M.; Negrini, P.; Reni, G.; Biffi, E. Semi-immersive virtual reality as a tool to improve cognitive and social abilities in preschool children. Appl. Sci. 2020, 10, 2948. [Google Scholar] [CrossRef]
- Chiang, H.-K.; Chou, Y.-Y.; Chang, L.-C.; Huang, C.-Y.; Kuo, F.-L.; Chen, H.-W. An Augmented Reality Learning Space for PC DIY. In Proceedings of the 2nd Augmented Human International Conference—AH’ 11, Tokyo, Japan, 13 March 2011; pp. 1–4. [Google Scholar]
- Juan, M.C.; Furió, D.; Seguí, I.; Aiju, N.R.; Cano, J. Lessons Learnt from an Experience with an Augmented Reality iPhone Learning Game. In Proceedings of the 8th International Conference on Advances in Computer Entertainment Technology—ACE, Lisbon, Portugal, 8–11 November 2011; p. 1. [Google Scholar]
- Ables, A. Augmented and Virtual Reality: Discovering Their Uses in Natural Science Classrooms and Beyond. In Proceedings of the 2017 ACM SIGUCCS Annual Conference, Seattle, WA, USA, 1–4 October 2017; pp. 61–65. [Google Scholar]
- Bonada, S.; Veras, R.; Collins, C. Personalized Views for Immersive Analytics. In Proceedings of the 2016 ACM Companion on Interactive Surfaces and Spaces—ISS Companion, Niagara Falls, ON, Canada, 6–9 November 2016; pp. 83–89. [Google Scholar]
- Leigh, J.; Johnson, A.E.; Vasilakis, C.A.; DeFanti, T.A. Multi-Perspective Collaborative Design in Persistent Networked Virtual Environments. In Proceedings of the IEEE 1996 Virtual Reality Annual International Symposium, Santa Clara, CA, USA, 30 March–3 April 1996; pp. 253–260. [Google Scholar]
- Chuah, M.C.; Roth, S.F. Visualizing Common Ground. In Proceedings of the Seventh International Conference on Information Visualization, London, UK, 18 July 2003; pp. 365–372. [Google Scholar]
- Agrawala, M.; Beers, A.C.; McDowall, I.; Fr, B. The Two-User Responsive Workbench: Support for Collaboration through Individual Views of a Shared Space. In Proceedings of the 24th Annual Conference on Computer Graphics and Interactive Techniques—SIGGRAPH, Los Angeles, CA, USA, 3–8 August 1997; pp. 327–332. [Google Scholar]
- Thorgeirsdottir, T.; Kelliher, C. Changing interfaces: The implications of flexible work arrangement use on team collaboration. Acad. Manag. Proc. 2017, 2017, 11496. [Google Scholar] [CrossRef]
- Chen, L.; Liang, H.-N.; Lu, F.; Papangelis, K.; Man, K.L.; Yue, Y. Collaborative behavior, performance and engagement with visual analytics tasks using mobile devices. Hum. Cent. Comput. Inf. Sci. 2020, 10, 47. [Google Scholar] [CrossRef]
- Isenberg, P.; Fisher, D.; Paul, S.A.; Morris, M.R.; Inkpen, K.; Czerwinski, M. Co-located collaborative visual analytics around a tabletop display. IEEE Trans. Visual. Comput. Graphics 2012, 18, 689–702. [Google Scholar] [CrossRef] [Green Version]
- Jakobsen, M.R.; Hornbæk, K. Up close and personal: Collaborative work on a high-resolution multitouch wall display. ACM Trans. Comput.-Hum. Interact. 2014, 21, 1–34. [Google Scholar] [CrossRef]
- Liu, C.-C.; Kao, L.-C. Do handheld devices facilitate face-to-face collaboration? Handheld devices with large shared display groupware to facilitate group interactions: Handheld devices with large shared display groupware. J. Comput. Assist. Learn. 2007, 23, 285–299. [Google Scholar] [CrossRef]
- Duval, T.; Nguyen, T.T.H.; Fleury, C.; Chauffaut, A.; Dumont, G.; Gouranton, V. Improving awareness for 3D virtual collaboration by embedding the features of users’ physical environments and by augmenting interaction tools with cognitive feedback cues. J. Multimodal User Interfaces 2014, 8, 187–197. [Google Scholar] [CrossRef] [Green Version]
- Yair, Y.; Mintz, R.; Litvak, S. 3D-virtual reality in science education: An implication for astronomy teaching. J. Comput. Math. Sci. Teach. 2001, 3, 293–305. [Google Scholar]
- Phelps, E.; Damon, E. Problem solving with equals: Peer collaboration as a context for learning mathematics and spatial concepts. J. Educ. Psychol. 1989, 81, 639–646. [Google Scholar] [CrossRef]
- Liang, H.-N.; Sedig, K. Role of interaction in enhancing the epistemic utility of 3D mathematical visualizations. Int. J. Comput. Math. Learn. 2010, 15, 191–224. [Google Scholar] [CrossRef]
- Bailenson, J.N.; Blascovich, J.; Beall, A.C.; Loomis, J.M. Interpersonal distance in immersive virtual environments. Pers. Soc. Psychol. Bull. 2003, 29, 819–833. [Google Scholar] [CrossRef] [PubMed] [Green Version]
- Garau, M.; Slater, M.; Vinayagamoorthy, V.; Brogni, A.; Steed, A.; Sasse, M.A. The impact of avatar realism and eye gaze control on perceived quality of communication in a shared immersive virtual environment. New Horizons 2003, 8, 529–536. [Google Scholar]
- Carini, R.M.; Kuh, G.D.; Klein, S.P. Student engagement and student learning: Testing the linkages*. Res. High Educ. 2006, 47, 1–32. [Google Scholar] [CrossRef]
- Sedig, K.; Klawe, M.; Westrom, M. Role of interface manipulation style and scaffolding on cognition and concept learning in learnware. ACM Trans. Comput.-Hum. Interact. 2001, 8, 34–59. [Google Scholar] [CrossRef]
- Liu, C.; Chapuis, O.; Beaudouin-Lafon, M.; Lecolinet, E. Shared Interaction on a Wall-Sized Display in a Data Manipulation Task. In Proceedings of the 2016 CHI Conference on Human Factors in Computing Systems—CHI ’16, San Jose, CA, USA, 7–12 May 2016; pp. 2075–2086. [Google Scholar]
- Hung, Y.-H.; Parsons, P. Assessing User Engagement in Information Visualization. In Proceedings of the 2017 CHI Conference Extended Abstracts on Human Factors in Computing Systems—CHI EA, Denver, CO, USA, 6–11 May 2017; pp. 1708–1717. [Google Scholar]
- Ai-Lim Lee, E.; Wong, K.W.; Fung, C.C. How does desktop virtual reality enhance learning outcomes? A structural equation modeling approach. Comput. Educ. 2010, 55, 1424–1442. [Google Scholar] [CrossRef] [Green Version]
- Monahan, T.; McArdle, G.; Bertolotto, M. Virtual reality for collaborative e-learning. Comput. Educ. 2008, 50, 1339–1353. [Google Scholar] [CrossRef]
- Tsai, C.H.; Huang, J.Y. A Mobile Augmented Reality Based Scaffolding Platform for Outdoor Fieldtrip Learning. In Proceedings of the 2014 IIAI 3rd International Conference on Advanced Applied Informatics—IIAIAAI ’14, Kokura Kita-ku, Japan, 31 August–4 September 2014; pp. 307–312. [Google Scholar]
- Liang, H.-N.; Lu, F.; Shi, Y.; Nanjappan, V.; Papangelis, K. Evaluating the effects of collaboration and competition in navigation tasks and spatial knowledge acquisition within virtual reality environments. Future Gener. Comput. Syst. 2019, 95, 855–866. [Google Scholar] [CrossRef]
- Sedig, K.; Parsons, P.; Liang, H.-N.; Morey, J. Supporting sensemaking of complex objects with visualizations: Visibility and complementarity of interactions. Informatics 2016, 3, 20. [Google Scholar] [CrossRef] [Green Version]
- Nanjappan, V.; Liang, H.-N.; Lu, F.; Papangelis, K.; Yue, Y.; Man, K.L. User-elicited dual-hand interactions for manipulating 3D objects in virtual reality environments. Hum.-Centric Comput. Inf. Sci. 2018, 8, 1–16. [Google Scholar] [CrossRef]
- Shi, R.; Zhu, N.; Liang, H.-N.; Zhao, S. Exploring Head-based Mode-Switching in Virtual Reality. In Proceedings of the 2021 IEEE International Symposium on Mixed and Augmented Reality—ISMAR’21, Bari, Italy, 4–8 October 2021; pp. 118–127. [Google Scholar]
- Monteiro, D.; Liang, H.-N.; Wang, X.; Xu, W.; Tu, H. Design and Development of a Low-cost Device for Weight and Center of Gravity Simulation in Virtual Reality. In Proceedings of the 2021 International Conference on Multimodal Interaction—ICMI '21, Montréal, QC, Canada, 18–22 October 2021; pp. 453–460. [Google Scholar]
- Yu, D.; Lu, X.; Shi, R.; Liang, H.-N.; Dingler, T.; Velloso, E.; Goncalves, J. Gaze-Supported 3D Object Manipulation in Virtual Reality. In Proceedings of the 2021 CHI Conference on Human Factors in Computing Systems, Virtual Event, Yokohama, Japan, 8–13 May 2021; pp. 1–13. [Google Scholar]
- Šašinka, Č.; Stachoň, Z.; Sedlák, M.; Chmelík, J.; Herman, L.; Kubíček, P.; Šašinková, A.; Doležal, M.; Tejkl, H.; Urbánek, T.; et al. Collaborative immersive virtual environments for education in geography. IJGI 2018, 8, 3. [Google Scholar] [CrossRef] [Green Version]
Figure 1.
The workspace for an individual user: (a) UI indicating current position arrangement; (b) task questions to complete; (c) interactive 3D solid visualizations.
Figure 1.
The workspace for an individual user: (a) UI indicating current position arrangement; (b) task questions to complete; (c) interactive 3D solid visualizations.
Figure 2.
Screenshot of the process of one user taking notes in the task panel using the pen function.
Figure 2.
Screenshot of the process of one user taking notes in the task panel using the pen function.
Figure 3.
Screenshots of the process of morphing the shapes: A user grabs the virtual joystick (top left) and moves it around (top right and bottom left) until reaching the desired object of exploration and finally releases the joystick (bottom right).
Figure 3.
Screenshots of the process of morphing the shapes: A user grabs the virtual joystick (top left) and moves it around (top right and bottom left) until reaching the desired object of exploration and finally releases the joystick (bottom right).
Figure 4.
Different two modes of interaction. (a) Interaction in the Non-Shared version (asynchronous change in two applications). (b) Interaction in the Shared version (synchronous change in two applications).
Figure 4.
Different two modes of interaction. (a) Interaction in the Non-Shared version (asynchronous change in two applications). (b) Interaction in the Shared version (synchronous change in two applications).
Figure 5.
The position arrangements: (a) side-by-side; (b) corner-to-corner; (c) back-to-back; and (d) public workspace. (a–c) are available to both Shared and Non-Shared users, while (d) is only for the Shared group.
Figure 5.
The position arrangements: (a) side-by-side; (b) corner-to-corner; (c) back-to-back; and (d) public workspace. (a–c) are available to both Shared and Non-Shared users, while (d) is only for the Shared group.
Figure 6.
(a) Two users are interacting collaboratively with the visual objects in the virtual reality tool. (b,c) Each user is represented as an avatar and can see what actions the other user is doing within the virtual environment. (d) The corner-to-corner position of the avatars and user workspaces—this is one of the three possible position arrangements in the virtual environment.
Figure 7.
Some sample tasks used in this study.
Figure 7.
Some sample tasks used in this study.
Figure 8.
Engagement ratings on the 11 categories for Singles, Shared, and Non-Shared groups. Error bar indicates ±2 standard errors.
Figure 8.
Engagement ratings on the 11 categories for Singles, Shared, and Non-Shared groups. Error bar indicates ±2 standard errors.
Figure 9.
Mean ratings for the communication, collaboration, comfort, and satisfaction categories of the collaboration questionnaire. Error bar indicates ±2 standard errors.
Figure 9.
Mean ratings for the communication, collaboration, comfort, and satisfaction categories of the collaboration questionnaire. Error bar indicates ±2 standard errors.
Figure 10.
Mean ratings with significant results (*: statistically significant) on communication, collaboration, comfort, and satisfaction categories depending on three position arrangements for the Non-Shared group. Error bar indicates ±2 standard errors.
Figure 10.
Mean ratings with significant results (*: statistically significant) on communication, collaboration, comfort, and satisfaction categories depending on three position arrangements for the Non-Shared group. Error bar indicates ±2 standard errors.
Figure 11.
Mean ratings with significant results (*: statistically significant) on the communication, collaboration, comfort, and satisfaction categories depending on four position arrangements for the shared group. Error bar indicates 2 standard errors.
Figure 11.
Mean ratings with significant results (*: statistically significant) on the communication, collaboration, comfort, and satisfaction categories depending on four position arrangements for the shared group. Error bar indicates 2 standard errors.
Table 1.
Overall descriptive data of the participants.
Table 1.
Overall descriptive data of the participants.
| | Total (N) | Males (N) | Females (N) | Acquaintance (N) |
|---|
| Singles | 10 | 6 | 4 | / |
| Shared | 10 | 3 | 7 | 4 (2 pairs) |
| Non-Shared | 10 | 5 | 5 | 4 (2 pairs) |
Table 2.
Overall descriptive data for test scores improvement in %.
Table 2.
Overall descriptive data for test scores improvement in %.
| | Mean | N | Std. Deviation | Std. Error Mean |
|---|
| Singles | 21.111 | 10 | 11.944 | 3.777 |
| Shared | 21.111 | 10 | 16.312 | 5.158 |
| Non-Shared | 25.555 | 10 | 13.146 | 4.157 |
Table 3.
Duncan’s test for difference between mean task performances in %.
Table 3.
Duncan’s test for difference between mean task performances in %.
| Group | Subset for α = 0.05 |
|---|
| N | 1 | 2 |
|---|
| Singles | 10 | 79.60% | |
| Non-Shared | 10 | 85.00% | 85.00% |
| Shared | 10 | | 89.28% |
| a. Uses Harmonic Mean Sample Size = 10.000 |
Table 4.
Overall descriptive data time spent on task completion (in seconds).
Table 4.
Overall descriptive data time spent on task completion (in seconds).
| | Mean | N | Std. Deviation | Std. Error Mean |
|---|
| Singles | 2898.30 | 10 | 1049.579 | 331.906 |
| Shared | 2314.62 | 10 | 328.45 | 103.266 |
| Non-Shared | 2390.50 | 10 | 253.67 | 80.220 |
Table 5.
Questions defined for communication, collaboration, satisfaction, and comfort.
Table 5.
Questions defined for communication, collaboration, satisfaction, and comfort.
| Communication |
| 1. I communicated a lot with my partner. |
| 2. Our communication was effective. |
| 3. I was able to share my ideas and visualization easily. |
| Collaboration |
| 4. We completed the task together efficiently. |
| 5. We divided up tasks between us. |
| 6. I felt part of the team. |
| 7. I was engaged in the collaboration. |
| 8. We worked together all the time. |
| 9. I was fully aware of what my partner was doing. |
| Satisfaction |
| 10. I enjoyed the collaboration experience. |
| 11. I was satisfied with my contribution to solve the tasks. |
| 12. I was satisfied with the application in its assistance to my task solving. |
| Comfort |
| 13. I seldom compromised myself for collaboration. |
| 14. I was able to move around freely. |
| 15. I felt my partner positioned at a comfortable distance from me. |
| 16. I was seldom disturbed by my partner’s actions. |
Table 6.
Overall descriptive data for time spent under each position with shared interaction (in seconds).
Table 6.
Overall descriptive data for time spent under each position with shared interaction (in seconds).
| Position | Mean | N | Std. Deviation | Std. Error Mean |
|---|
| B-B | 192.39 | 10 | 302.93 | 95.79 |
| C-C | 434.58 | 10 | 123.13 | 38.93 |
| S-S | 794.57 | 10 | 361.00 | 114.16 |
| Public workspace | 893.07 | 10 | 227.59 | 71.97 |
| Publisher’s Note: MDPI stays neutral with regard to jurisdictional claims in published maps and institutional affiliations. |
© 2021 by the authors. Licensee MDPI, Basel, Switzerland. This article is an open access article distributed under the terms and conditions of the Creative Commons Attribution (CC BY) license (https://creativecommons.org/licenses/by/4.0/).


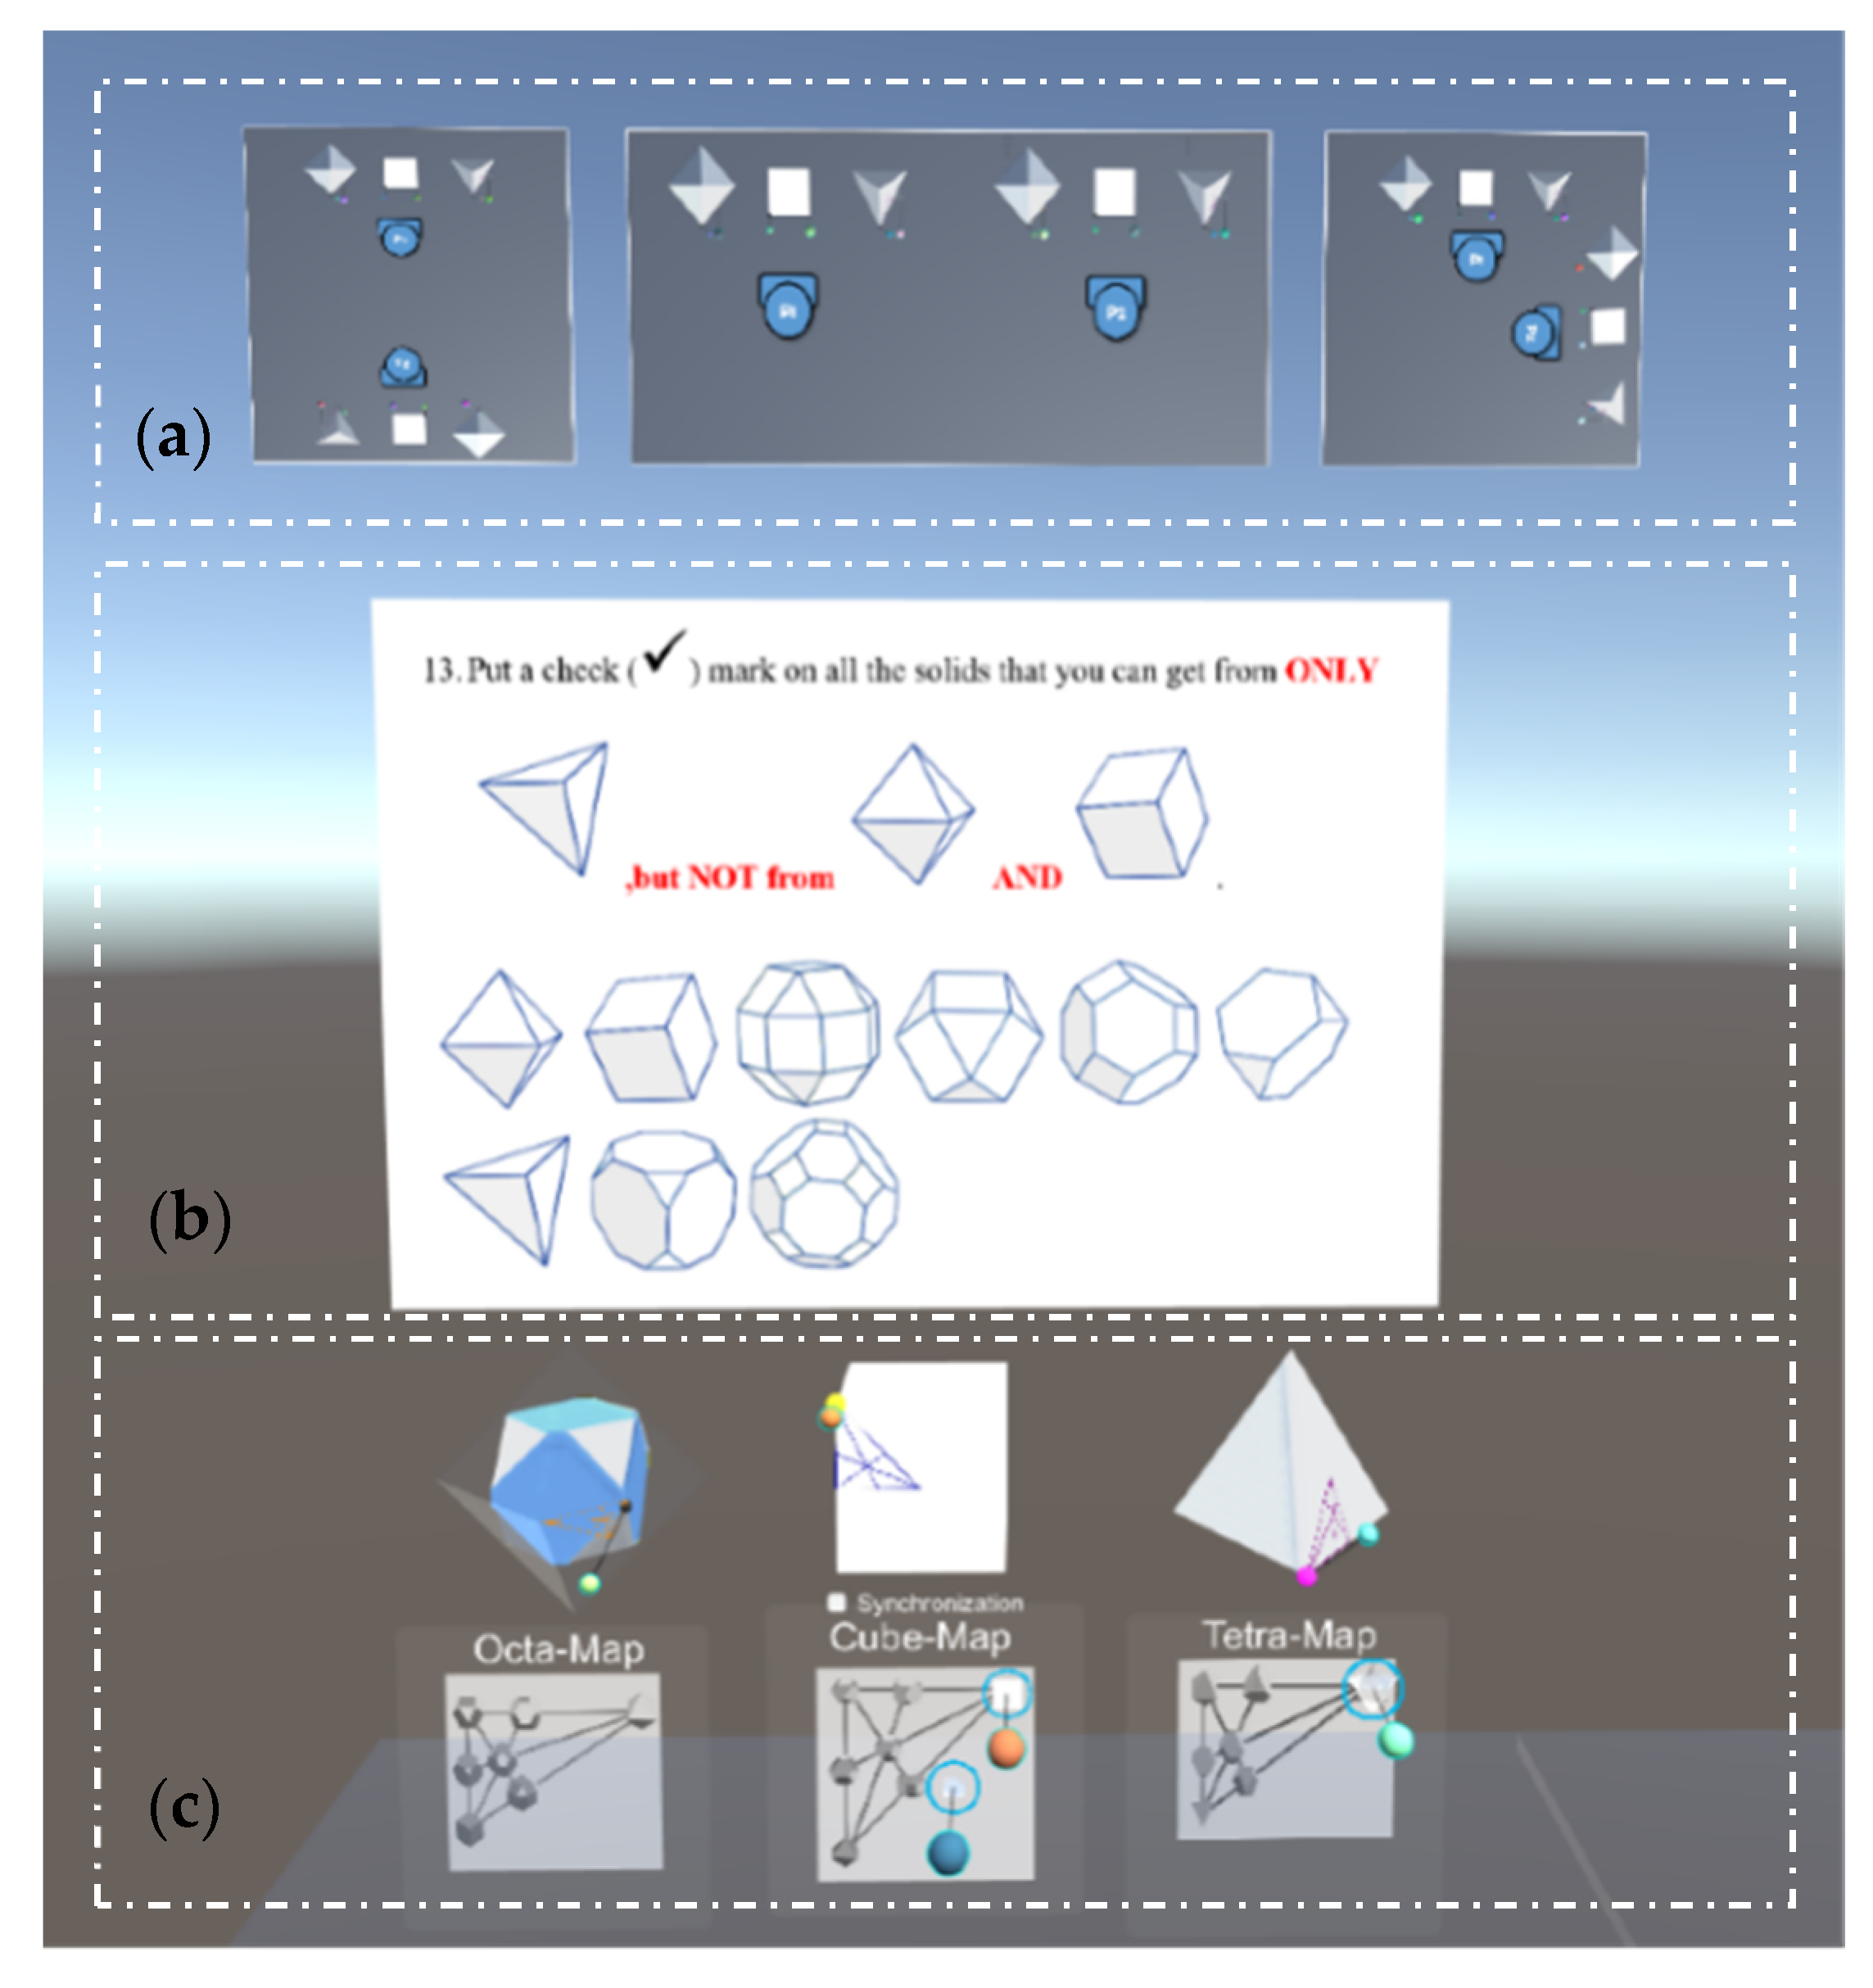
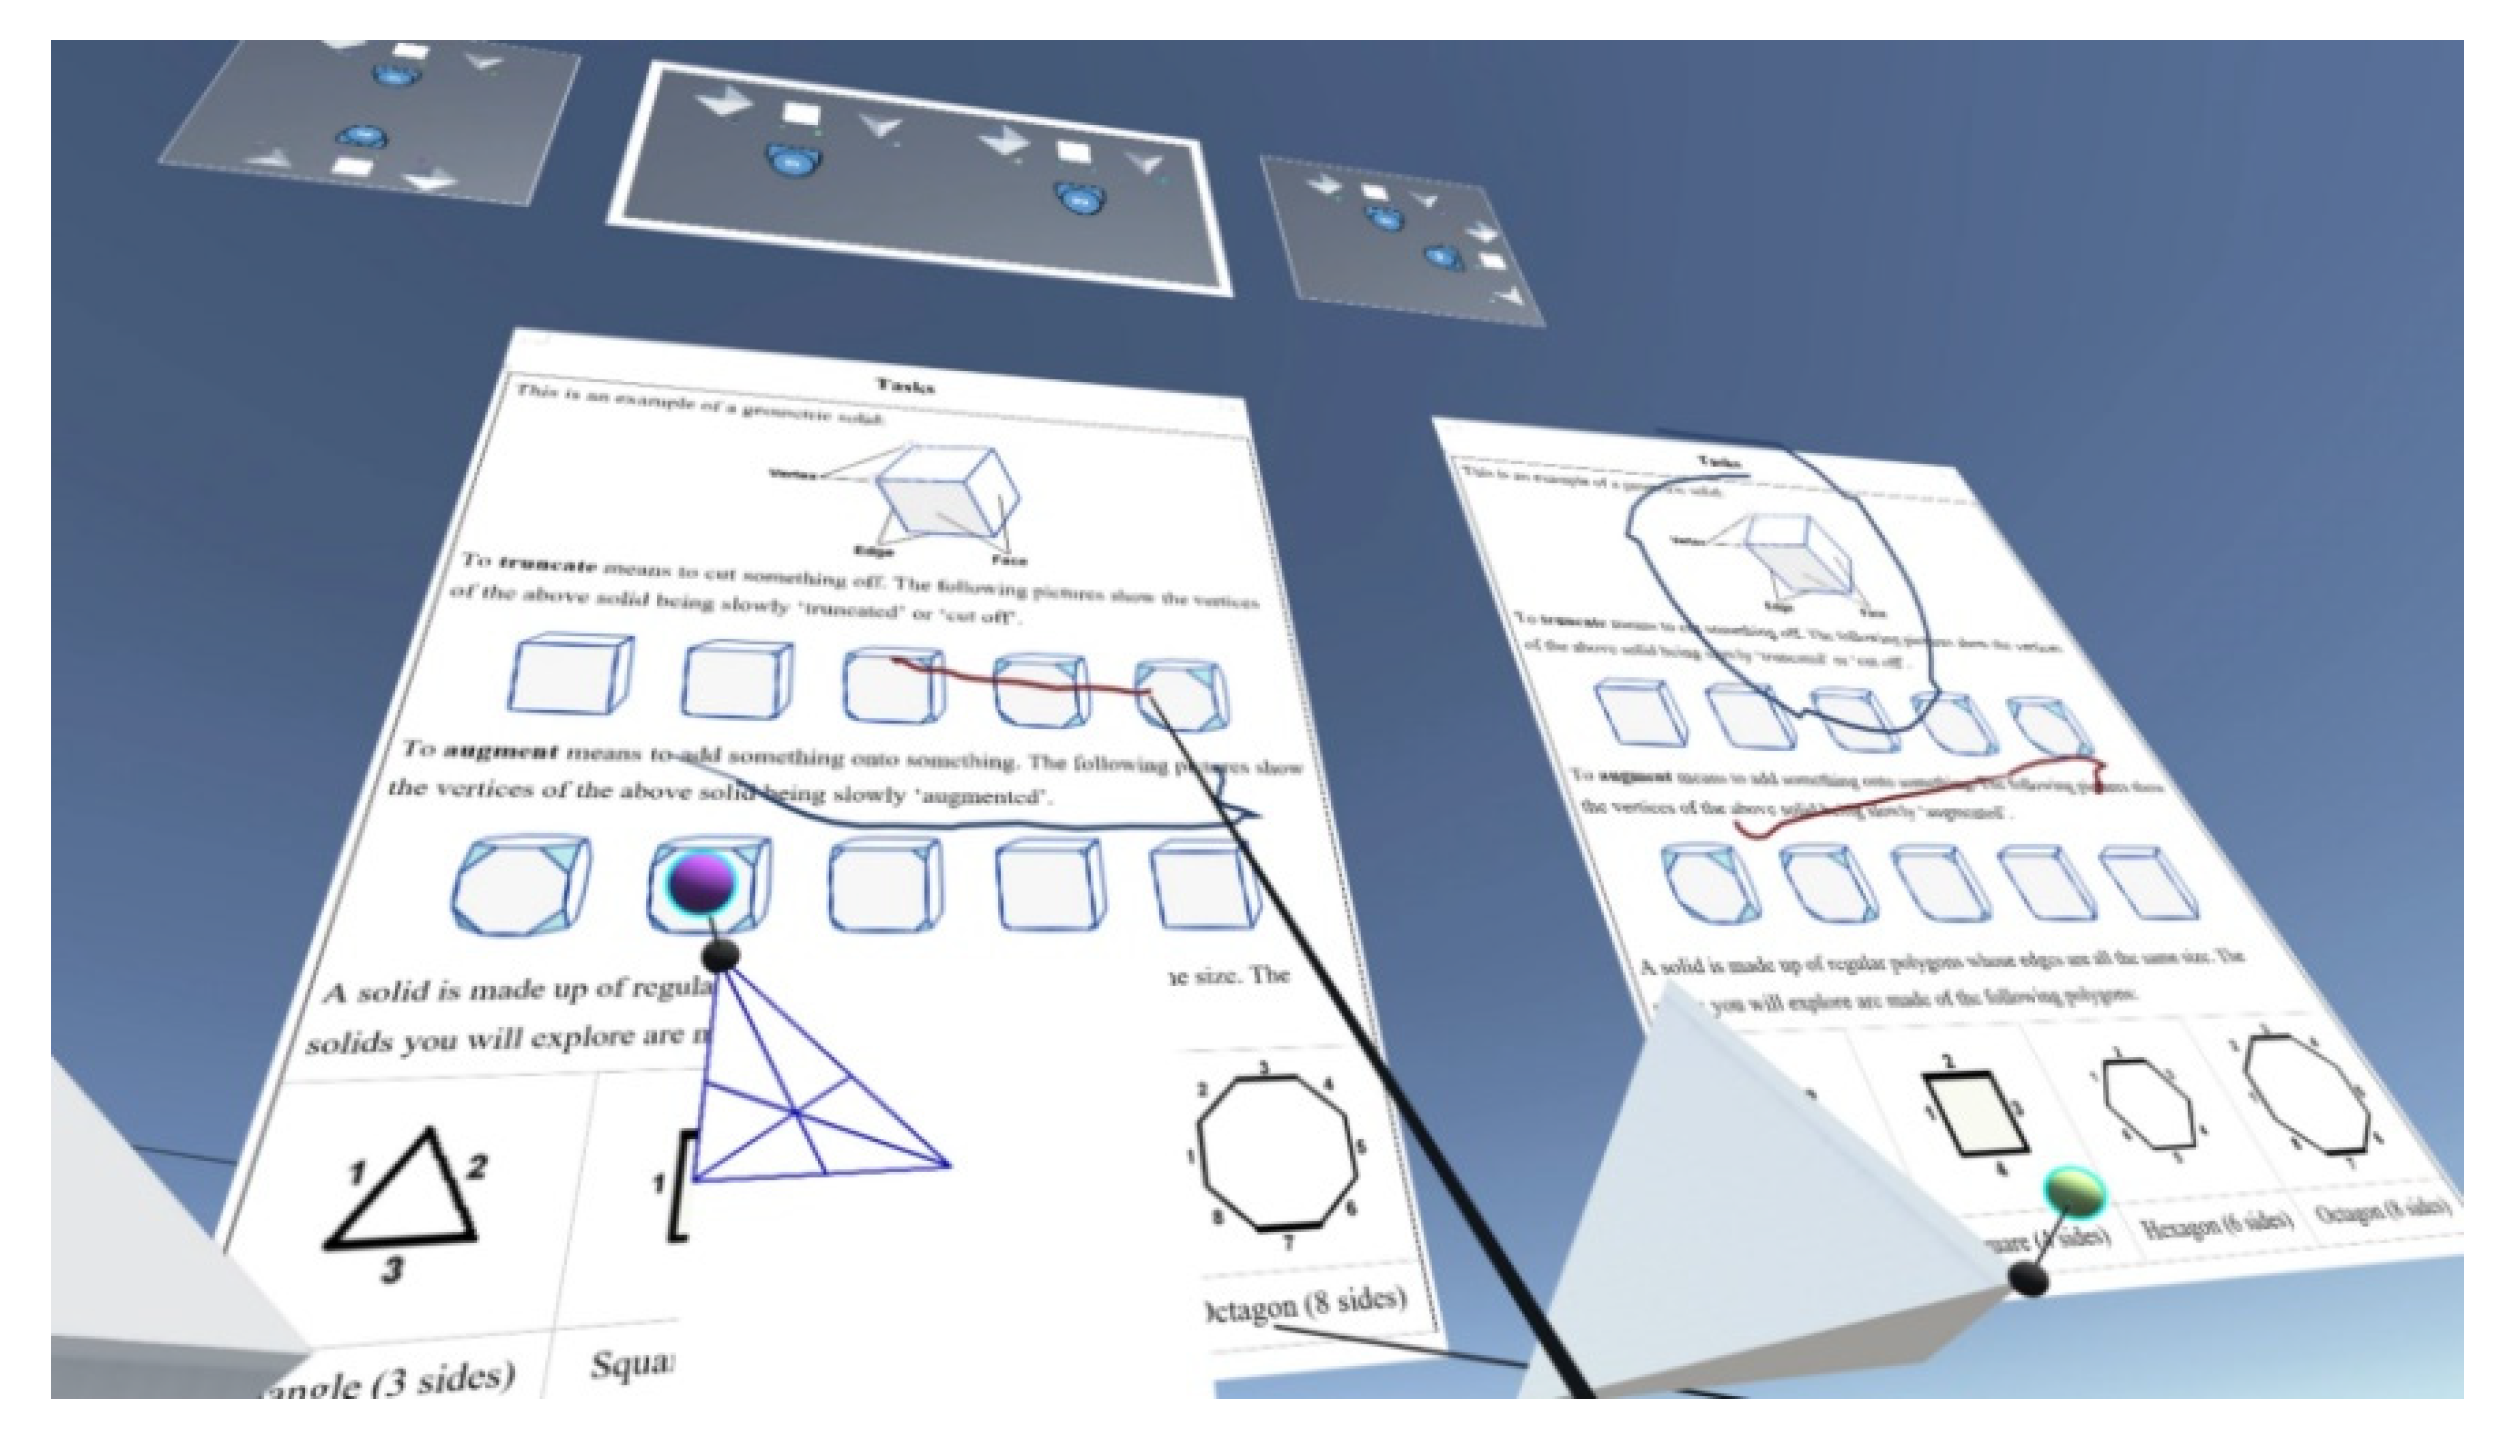
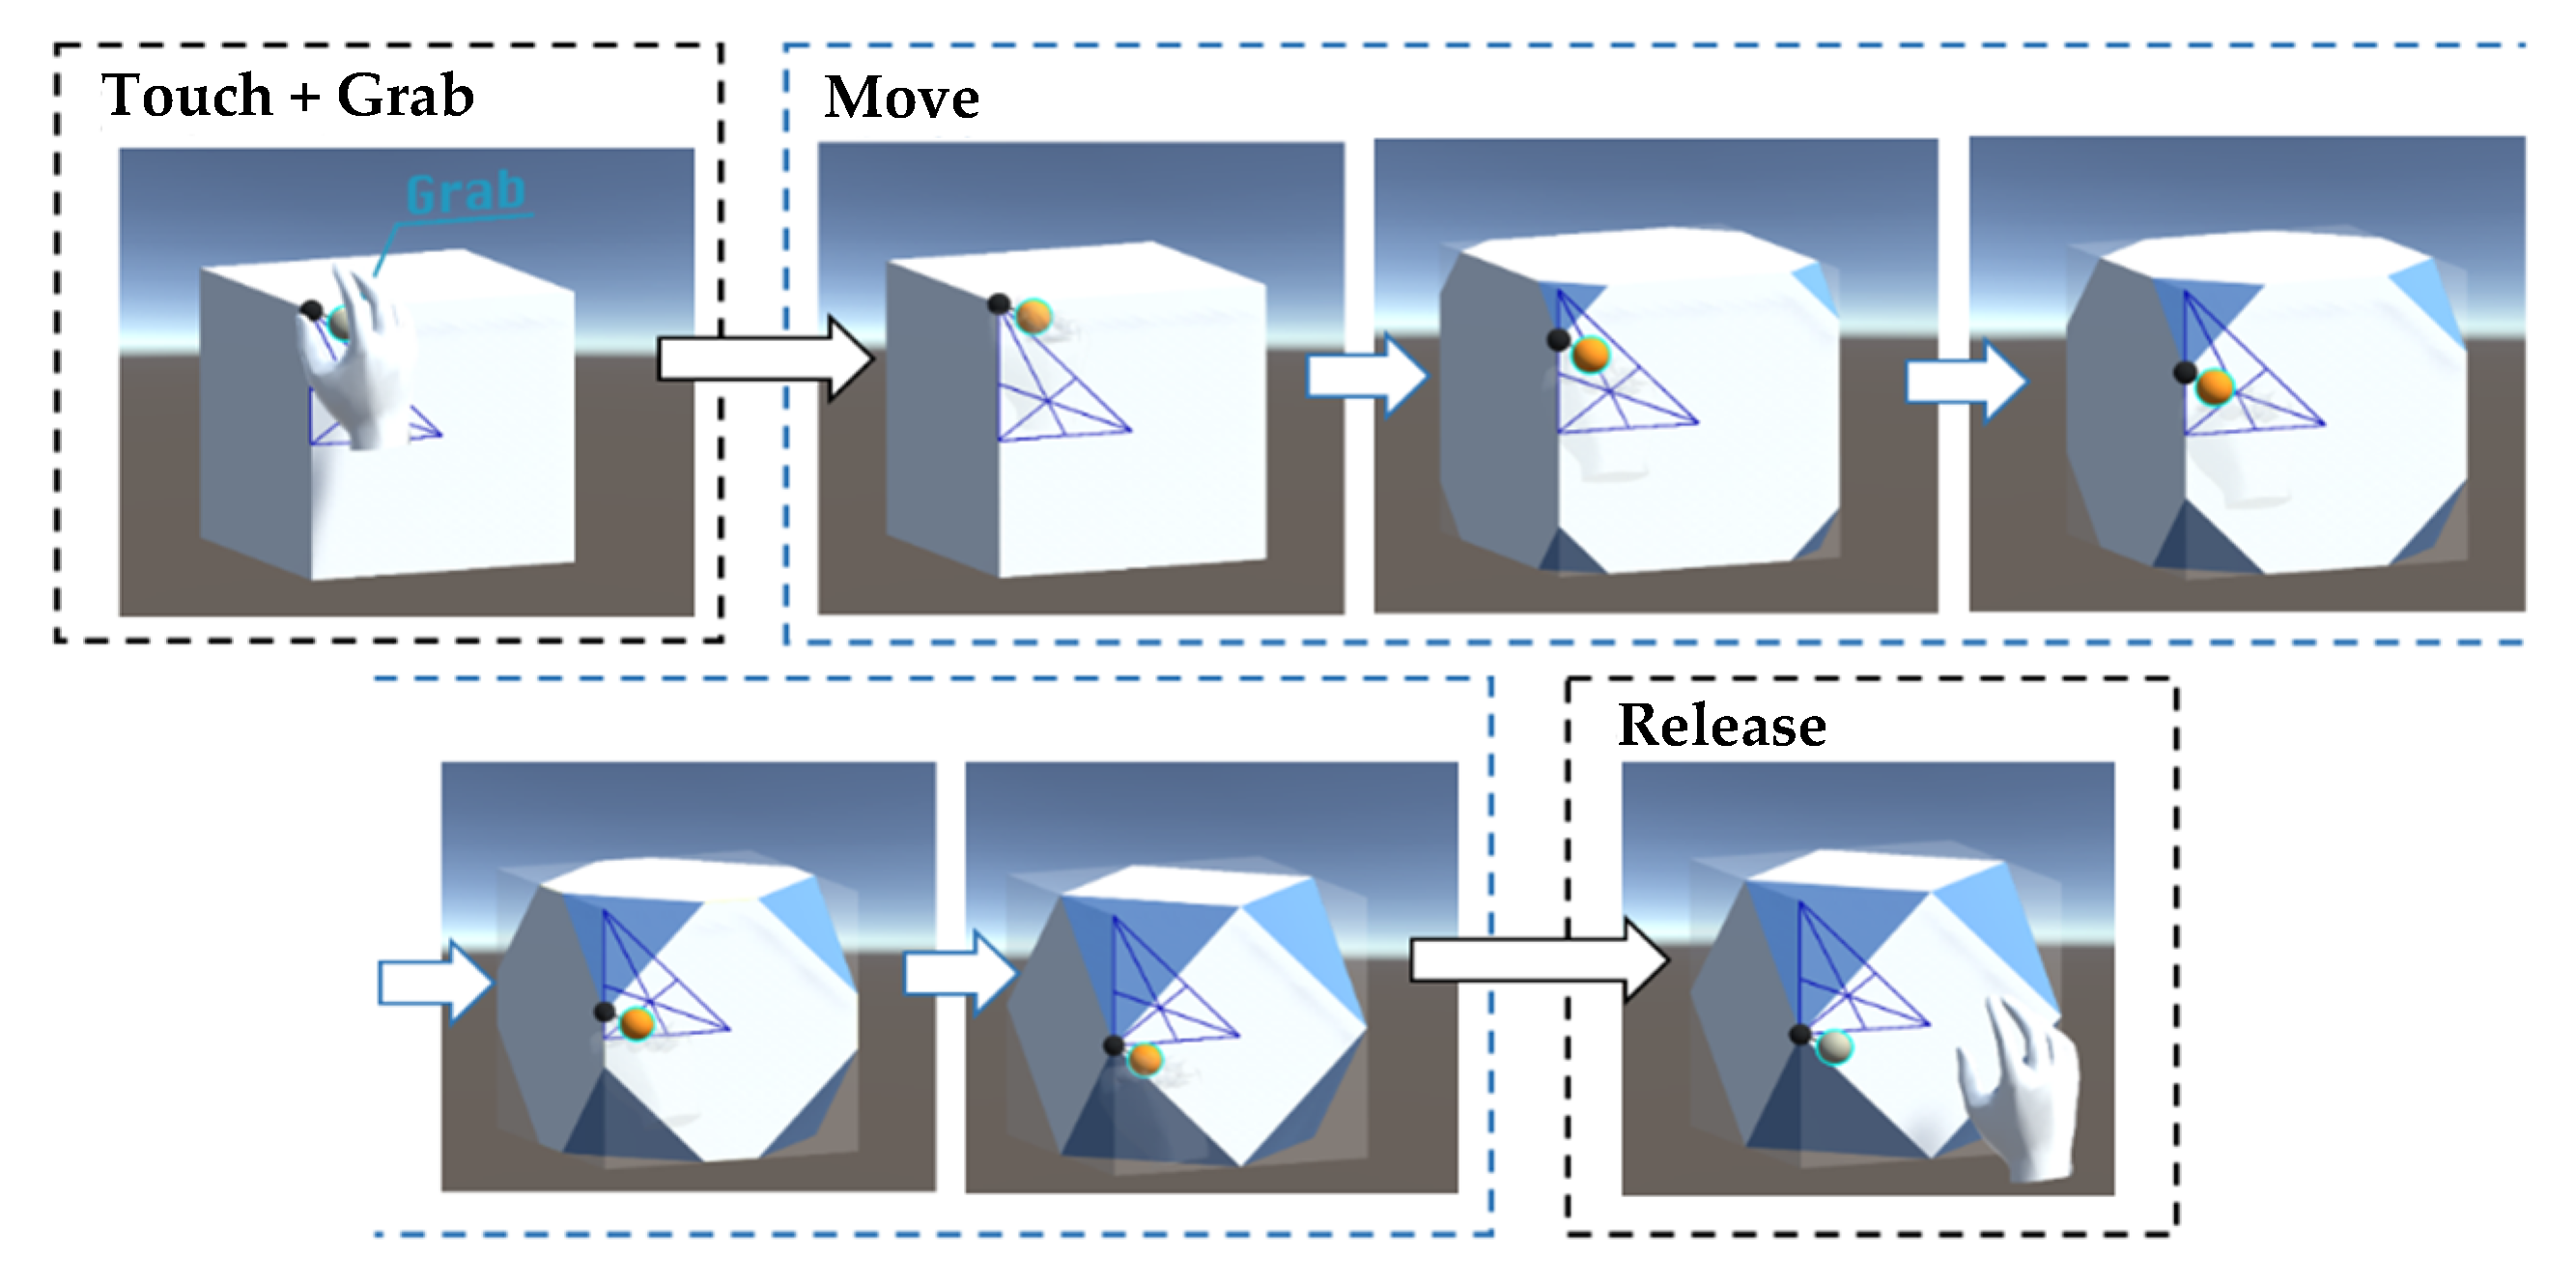
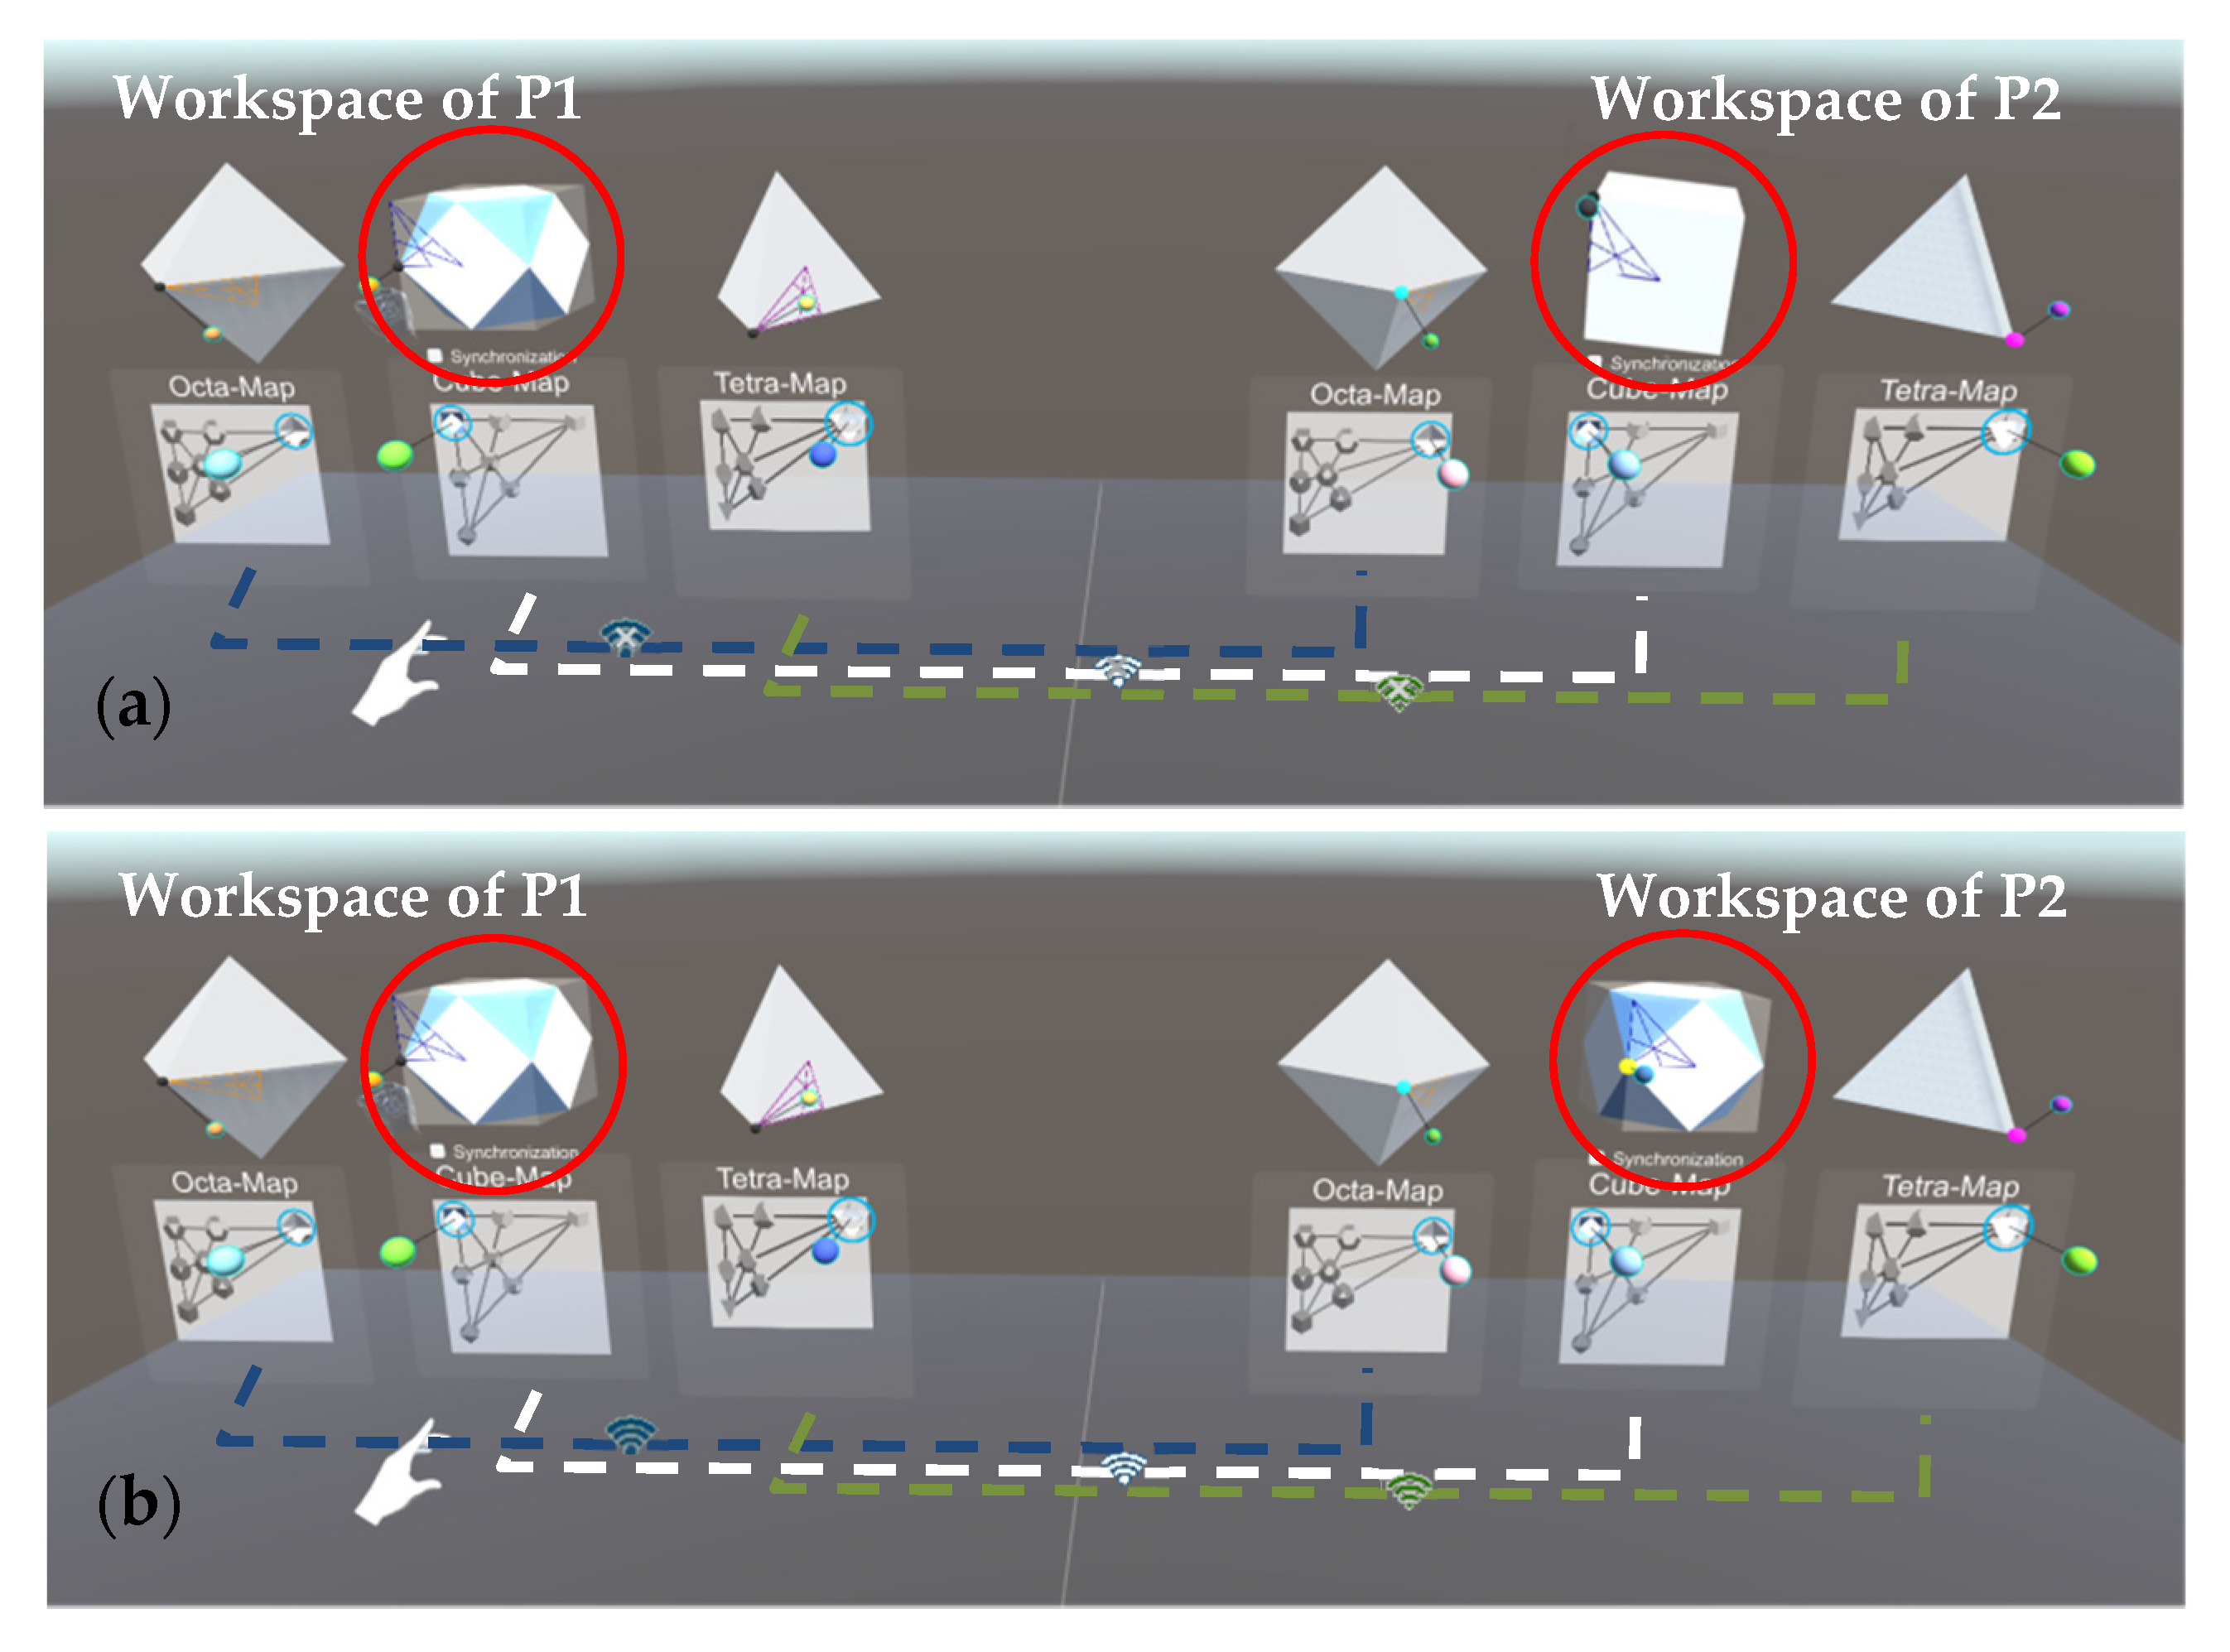
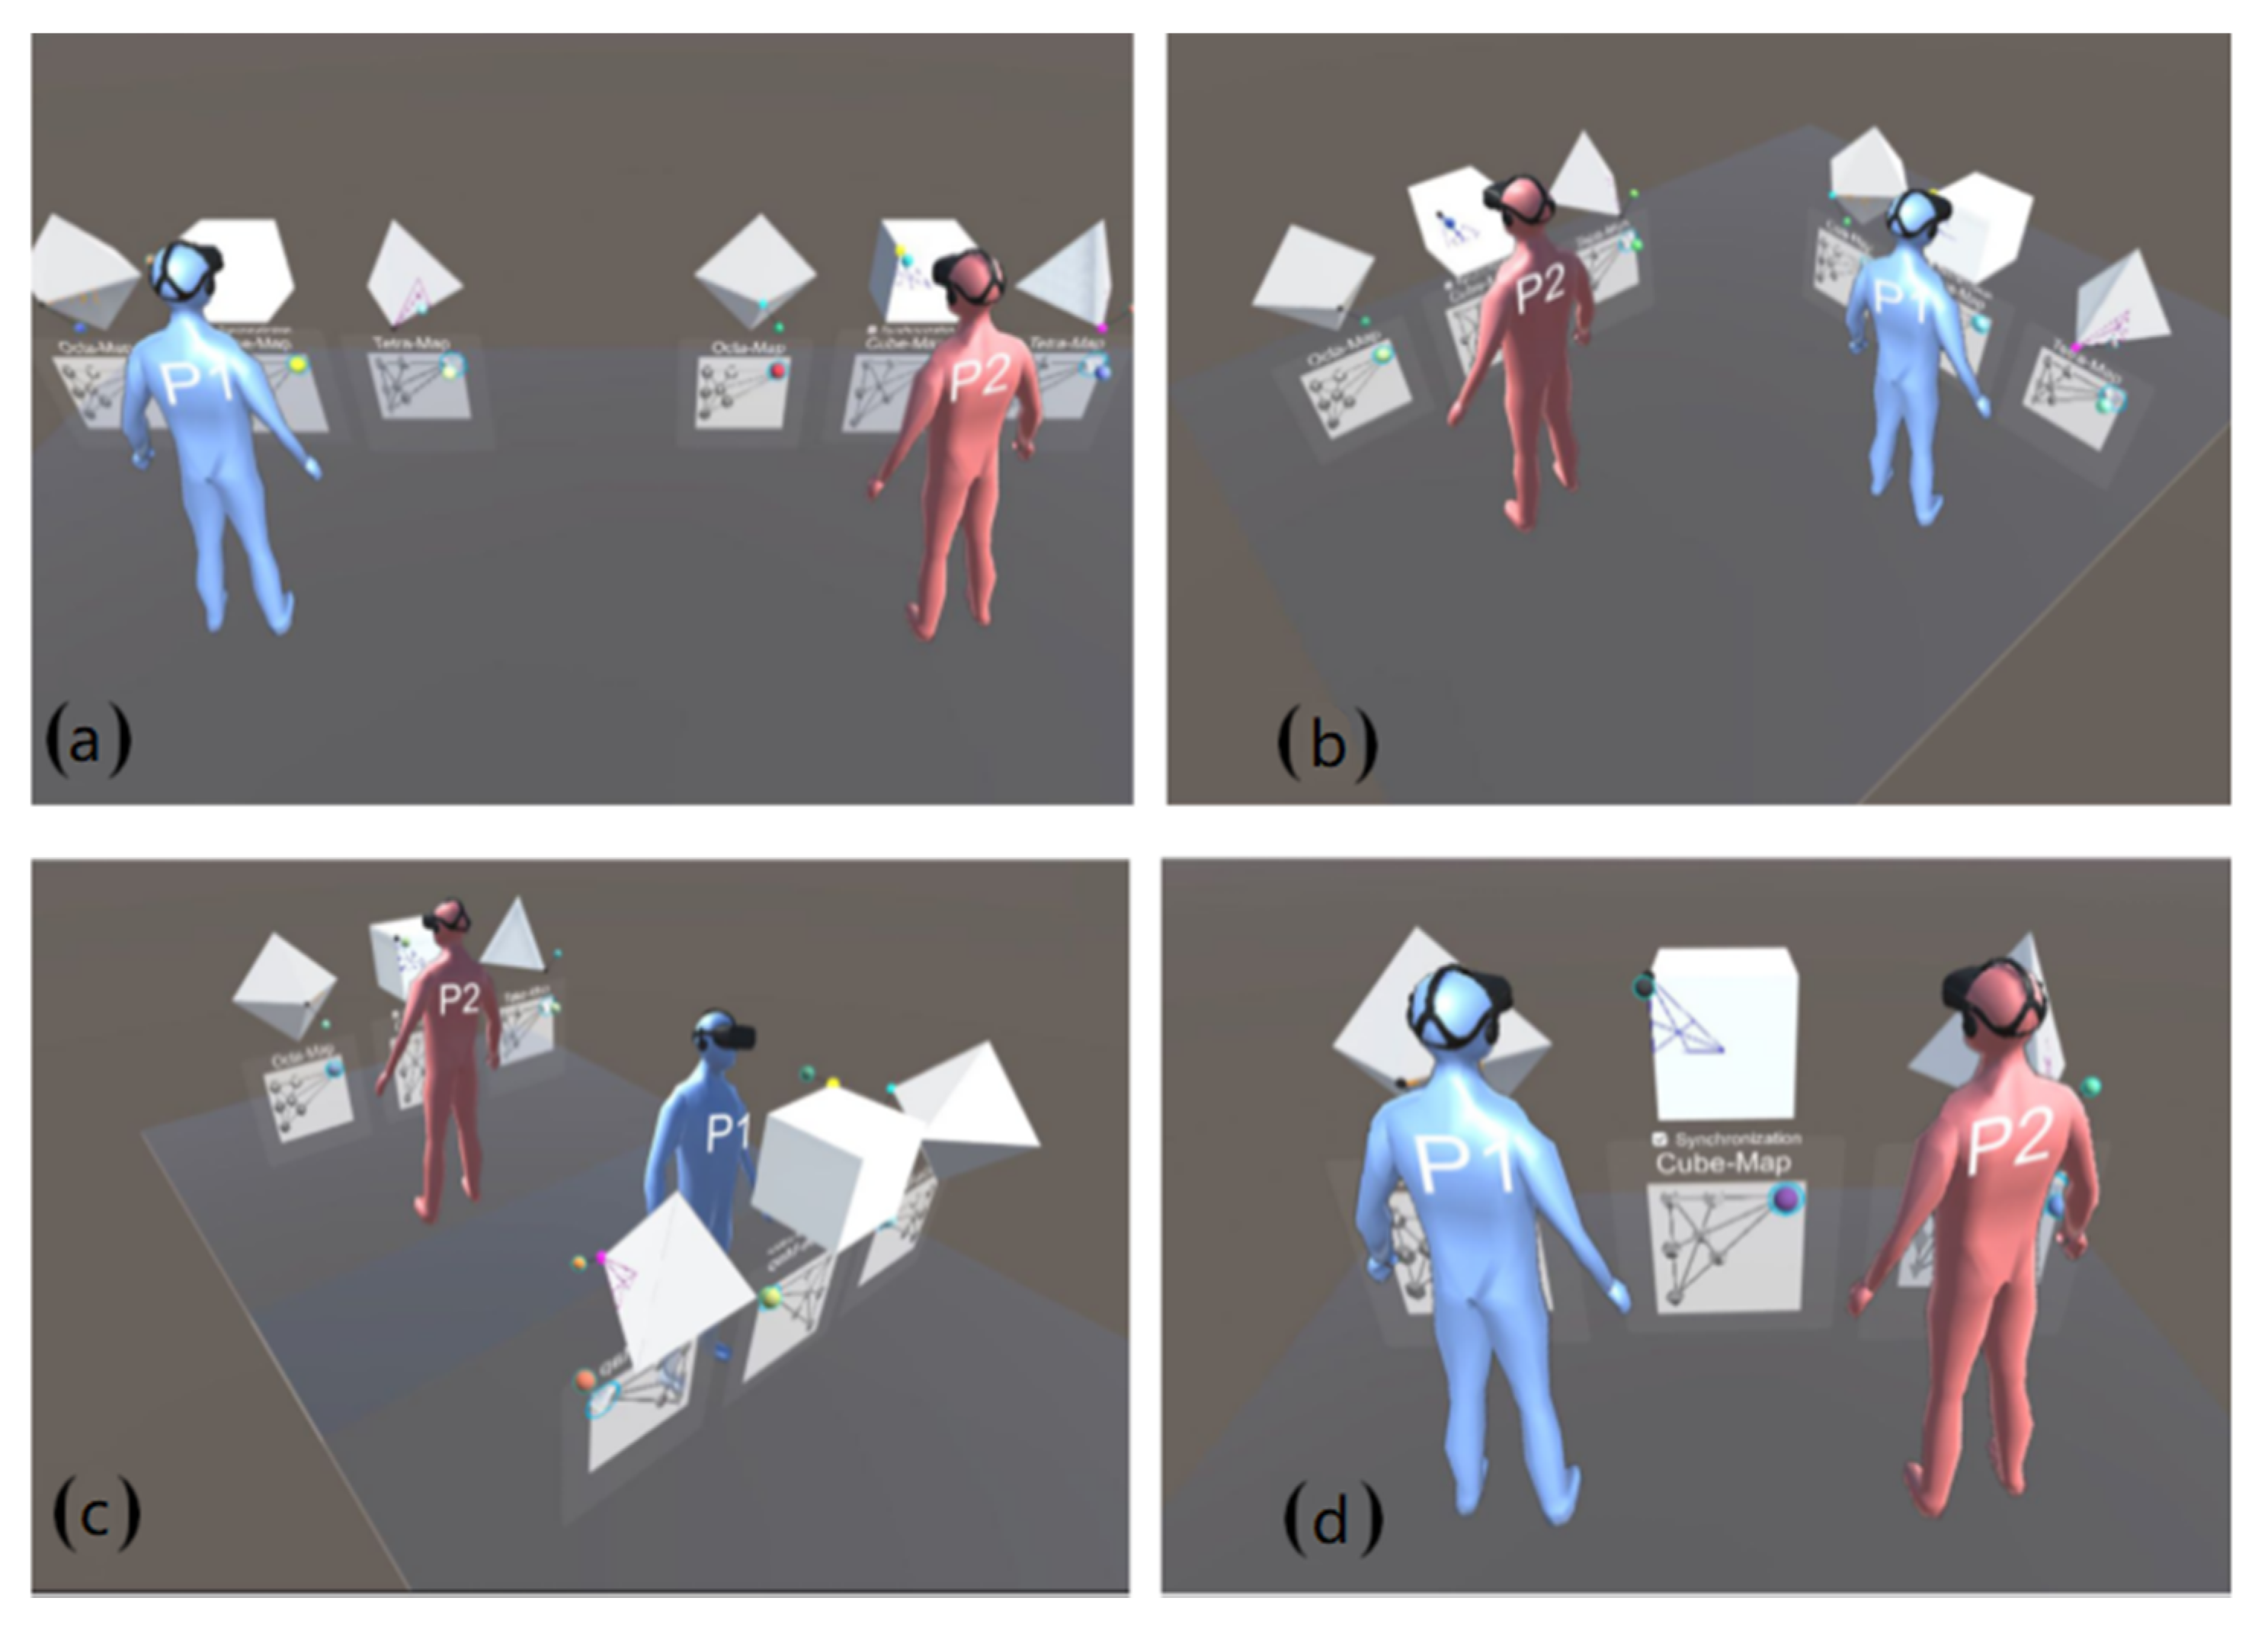
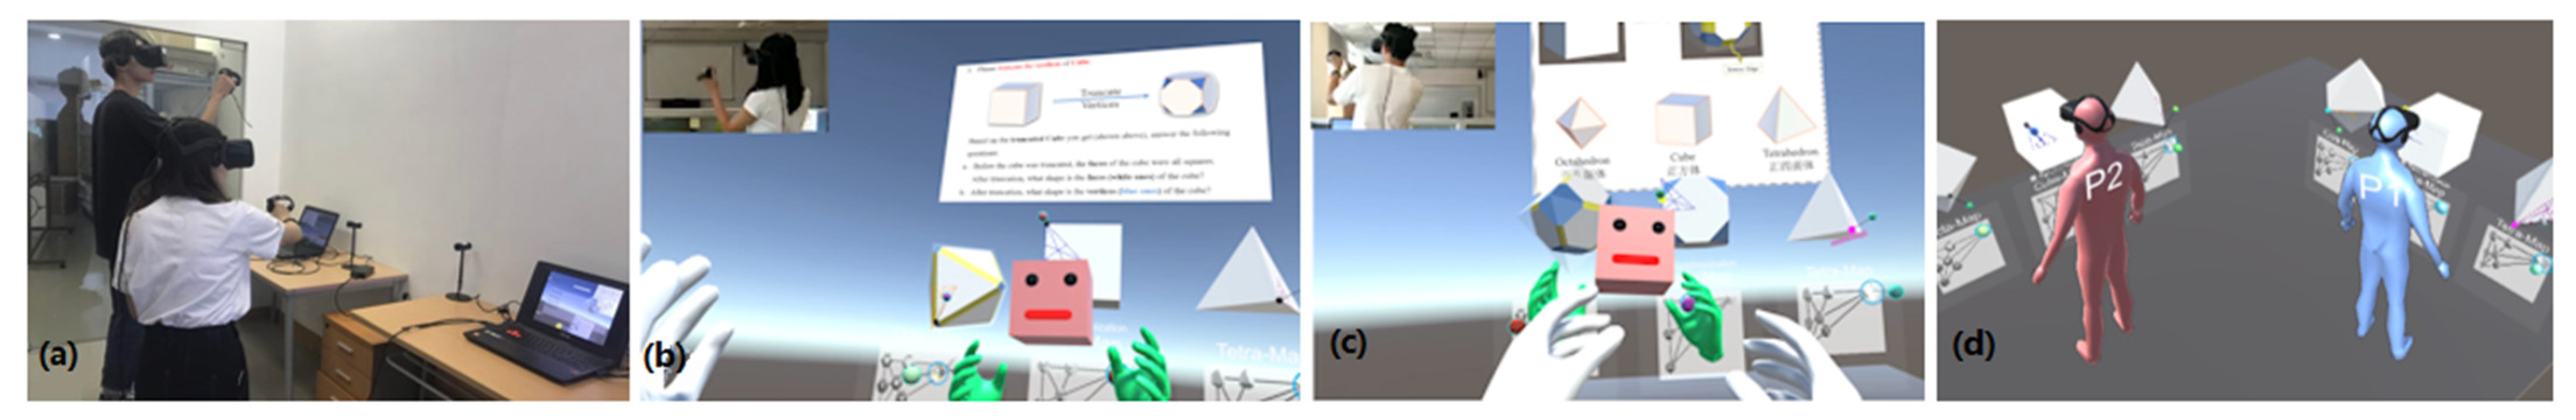
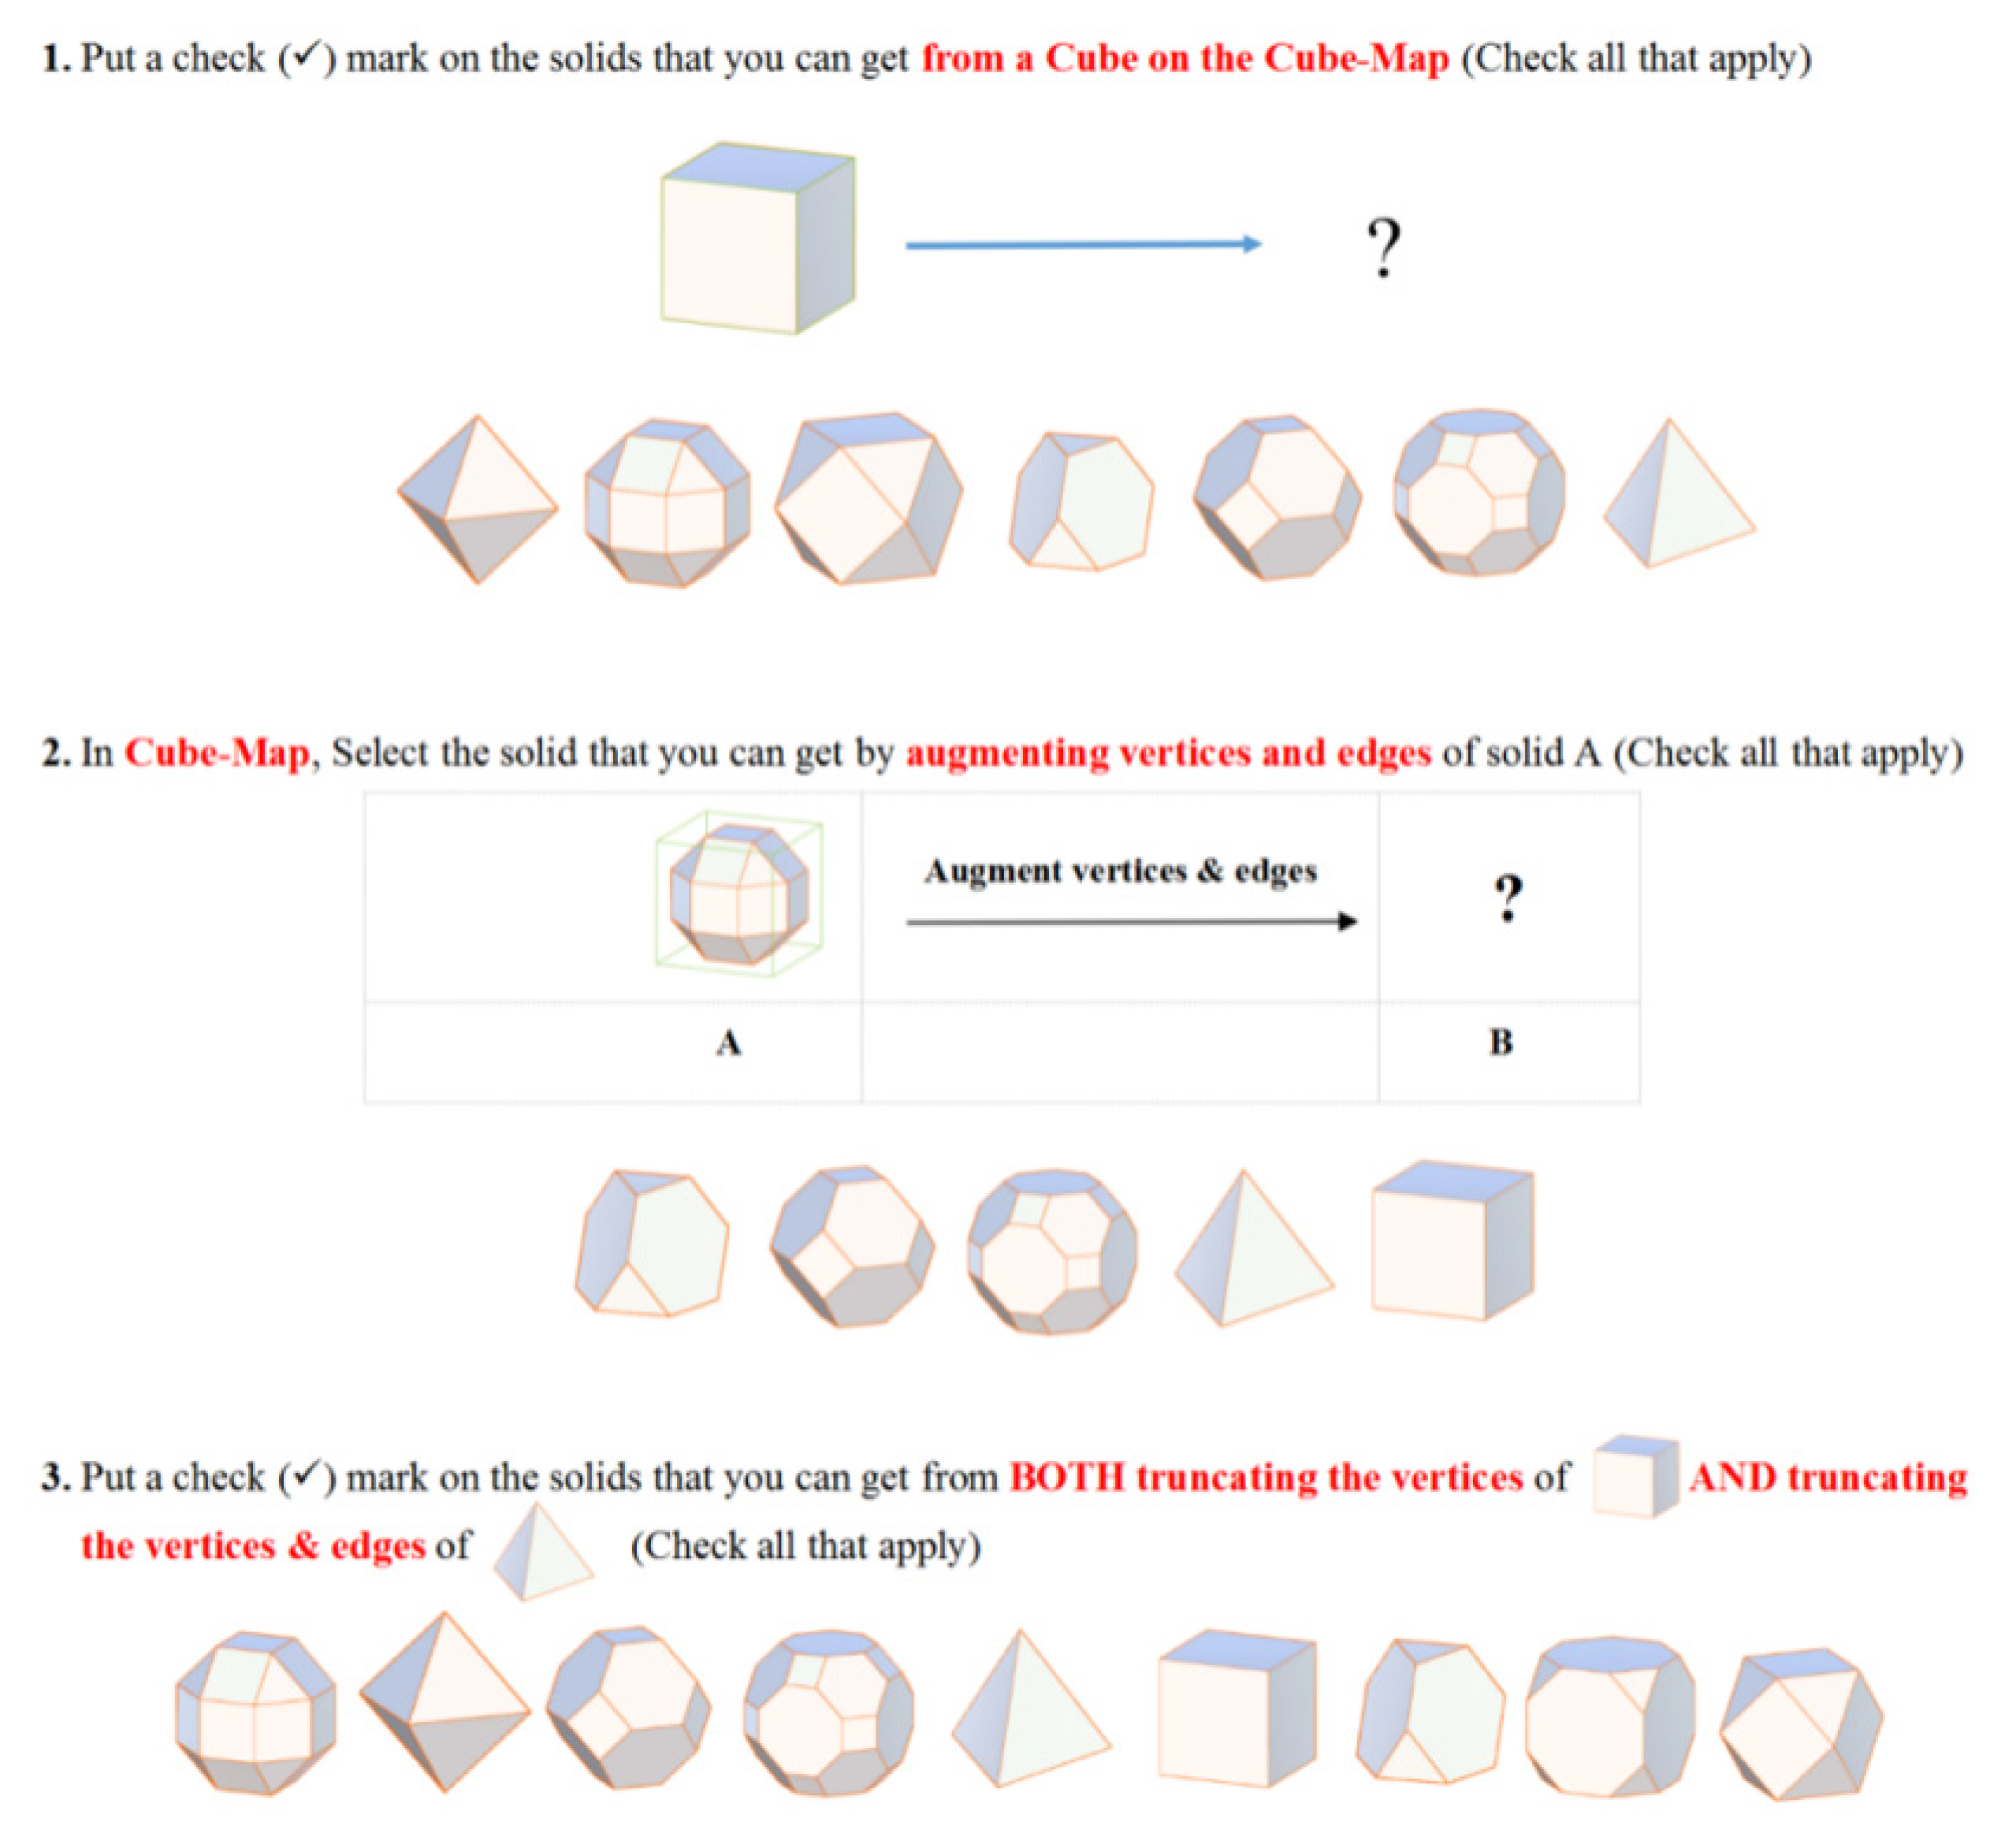
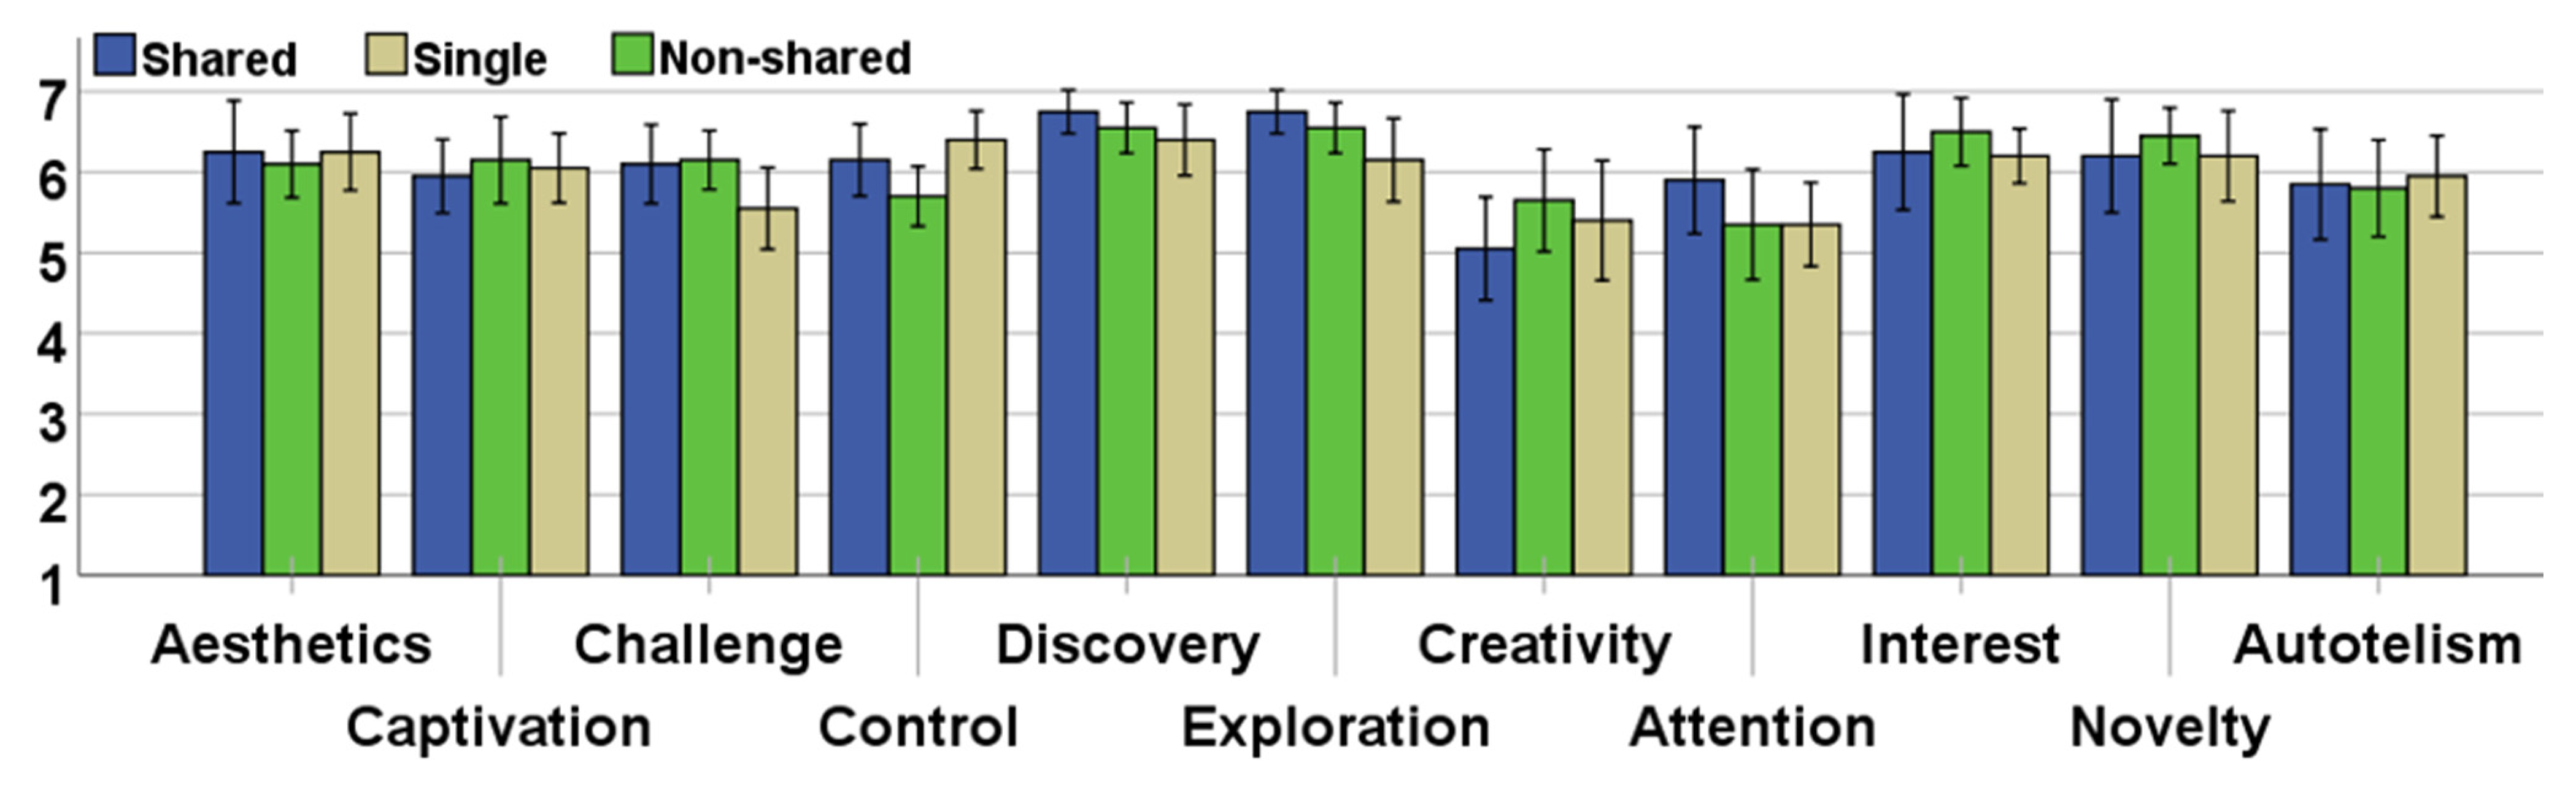
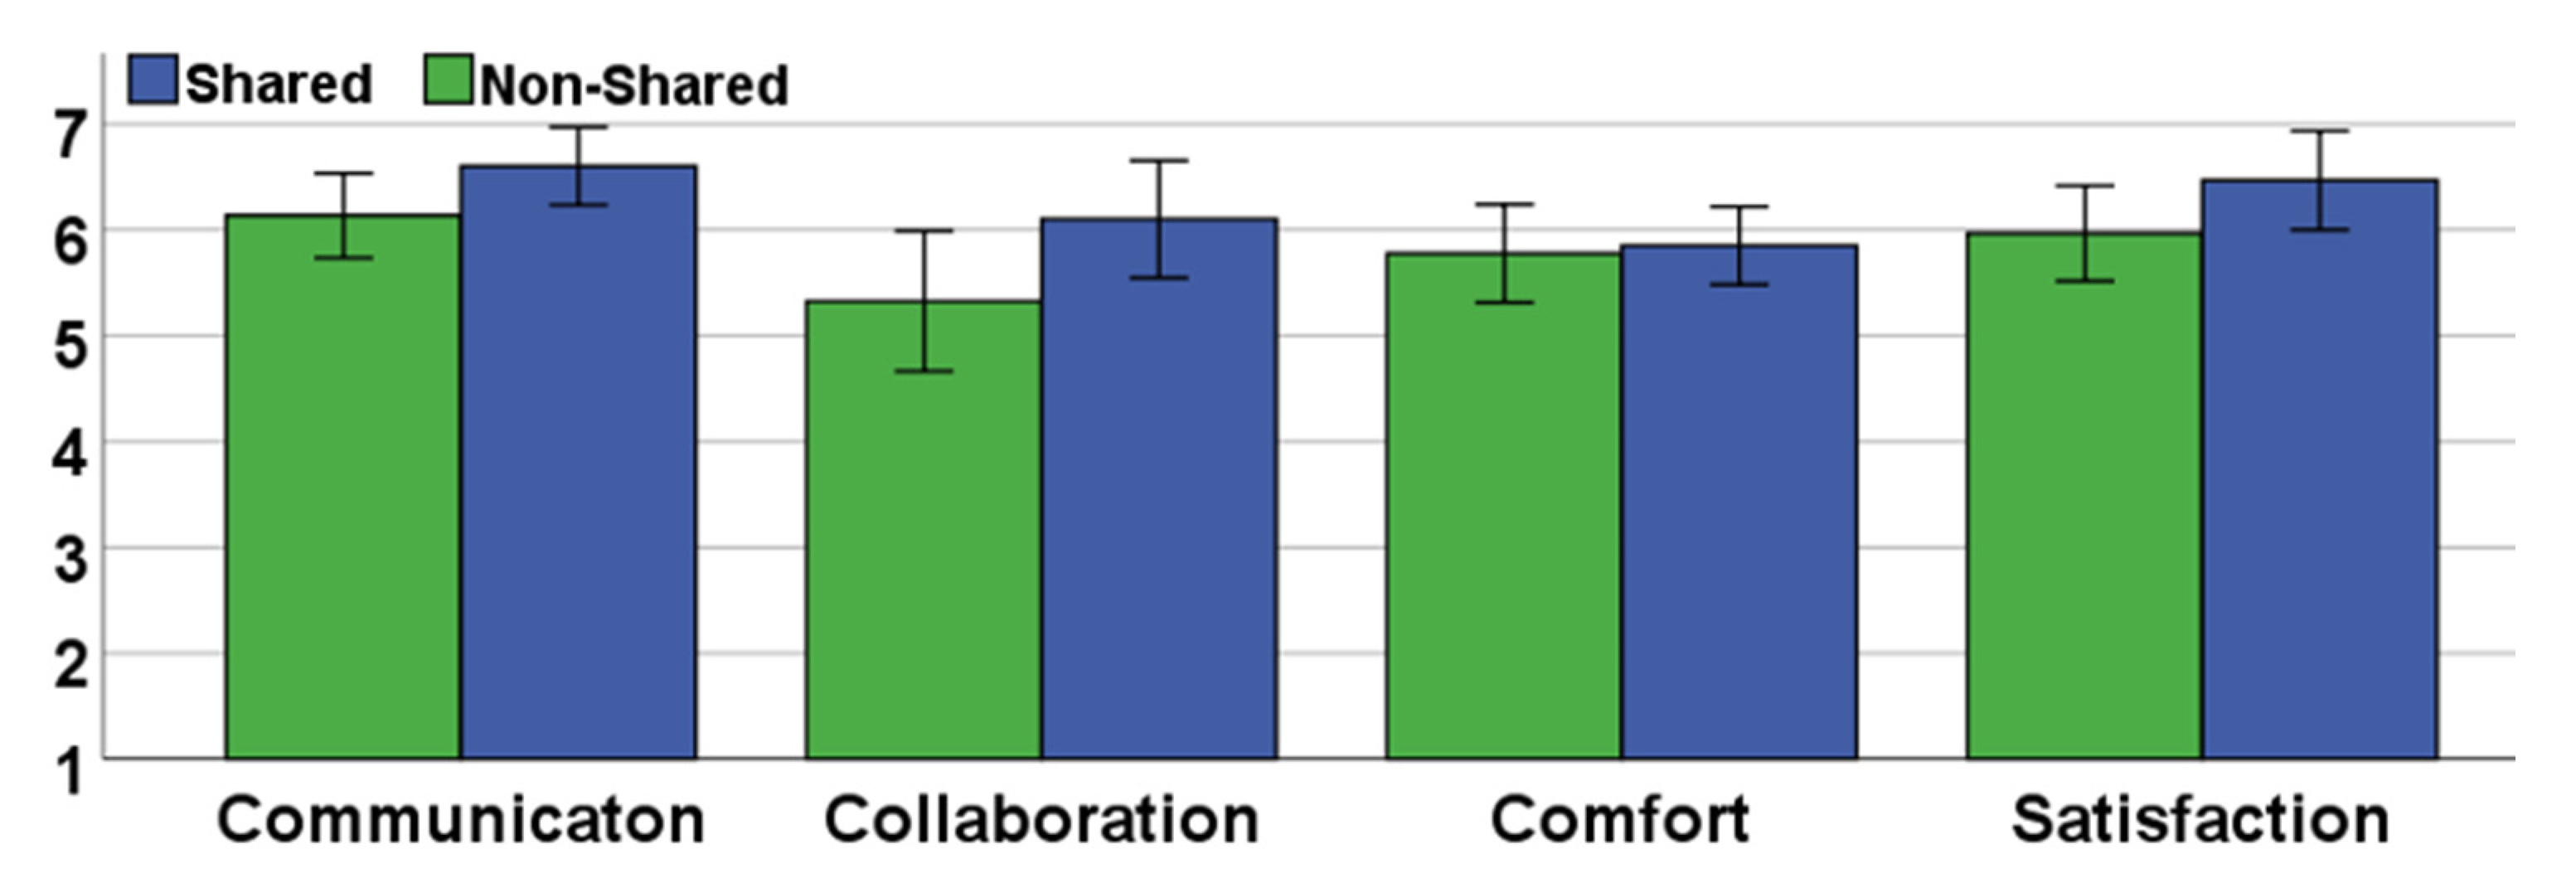
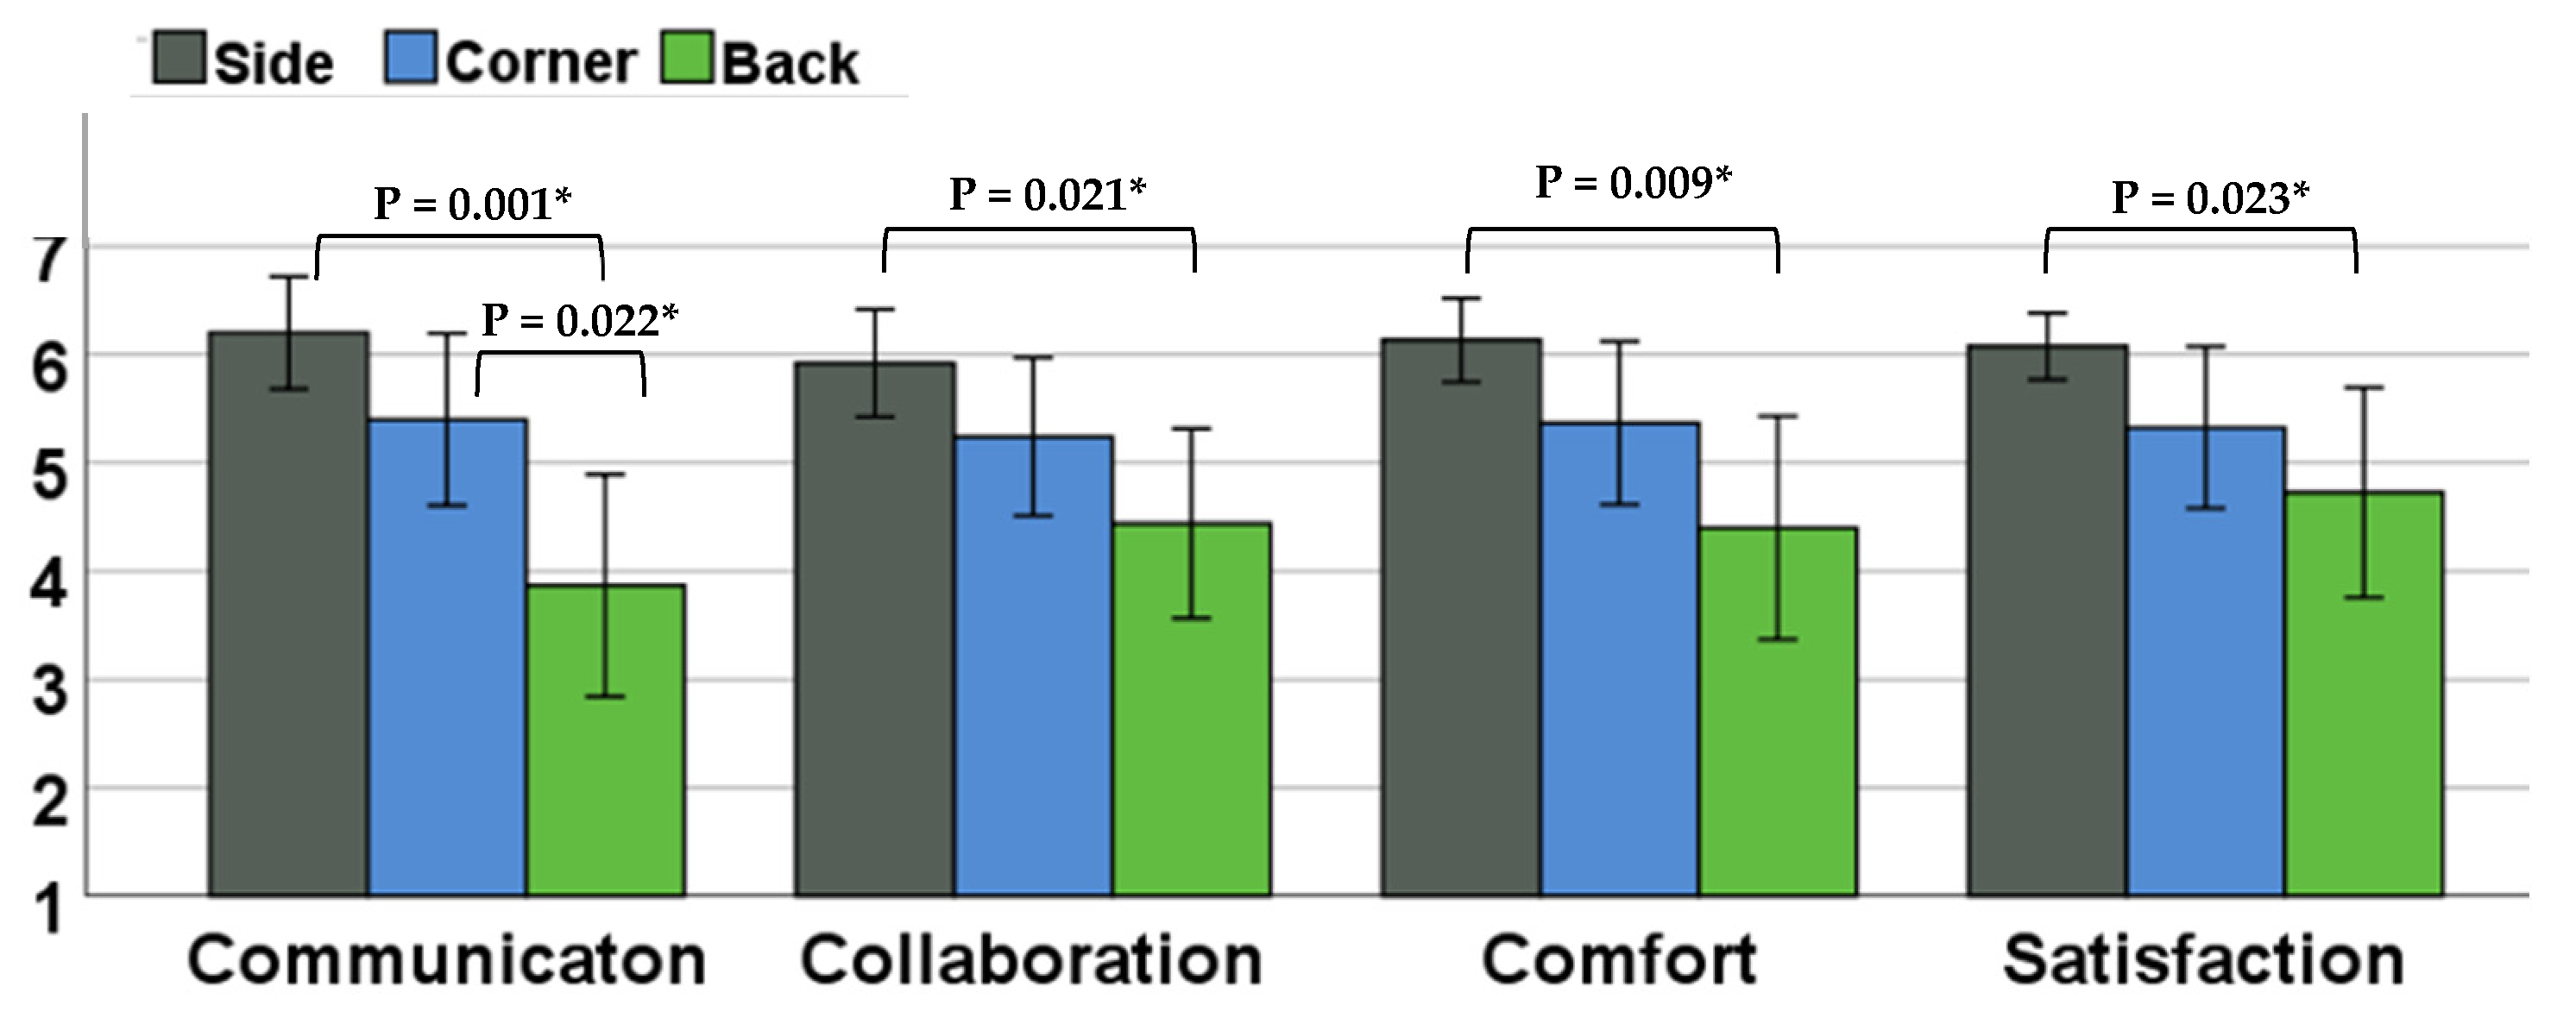
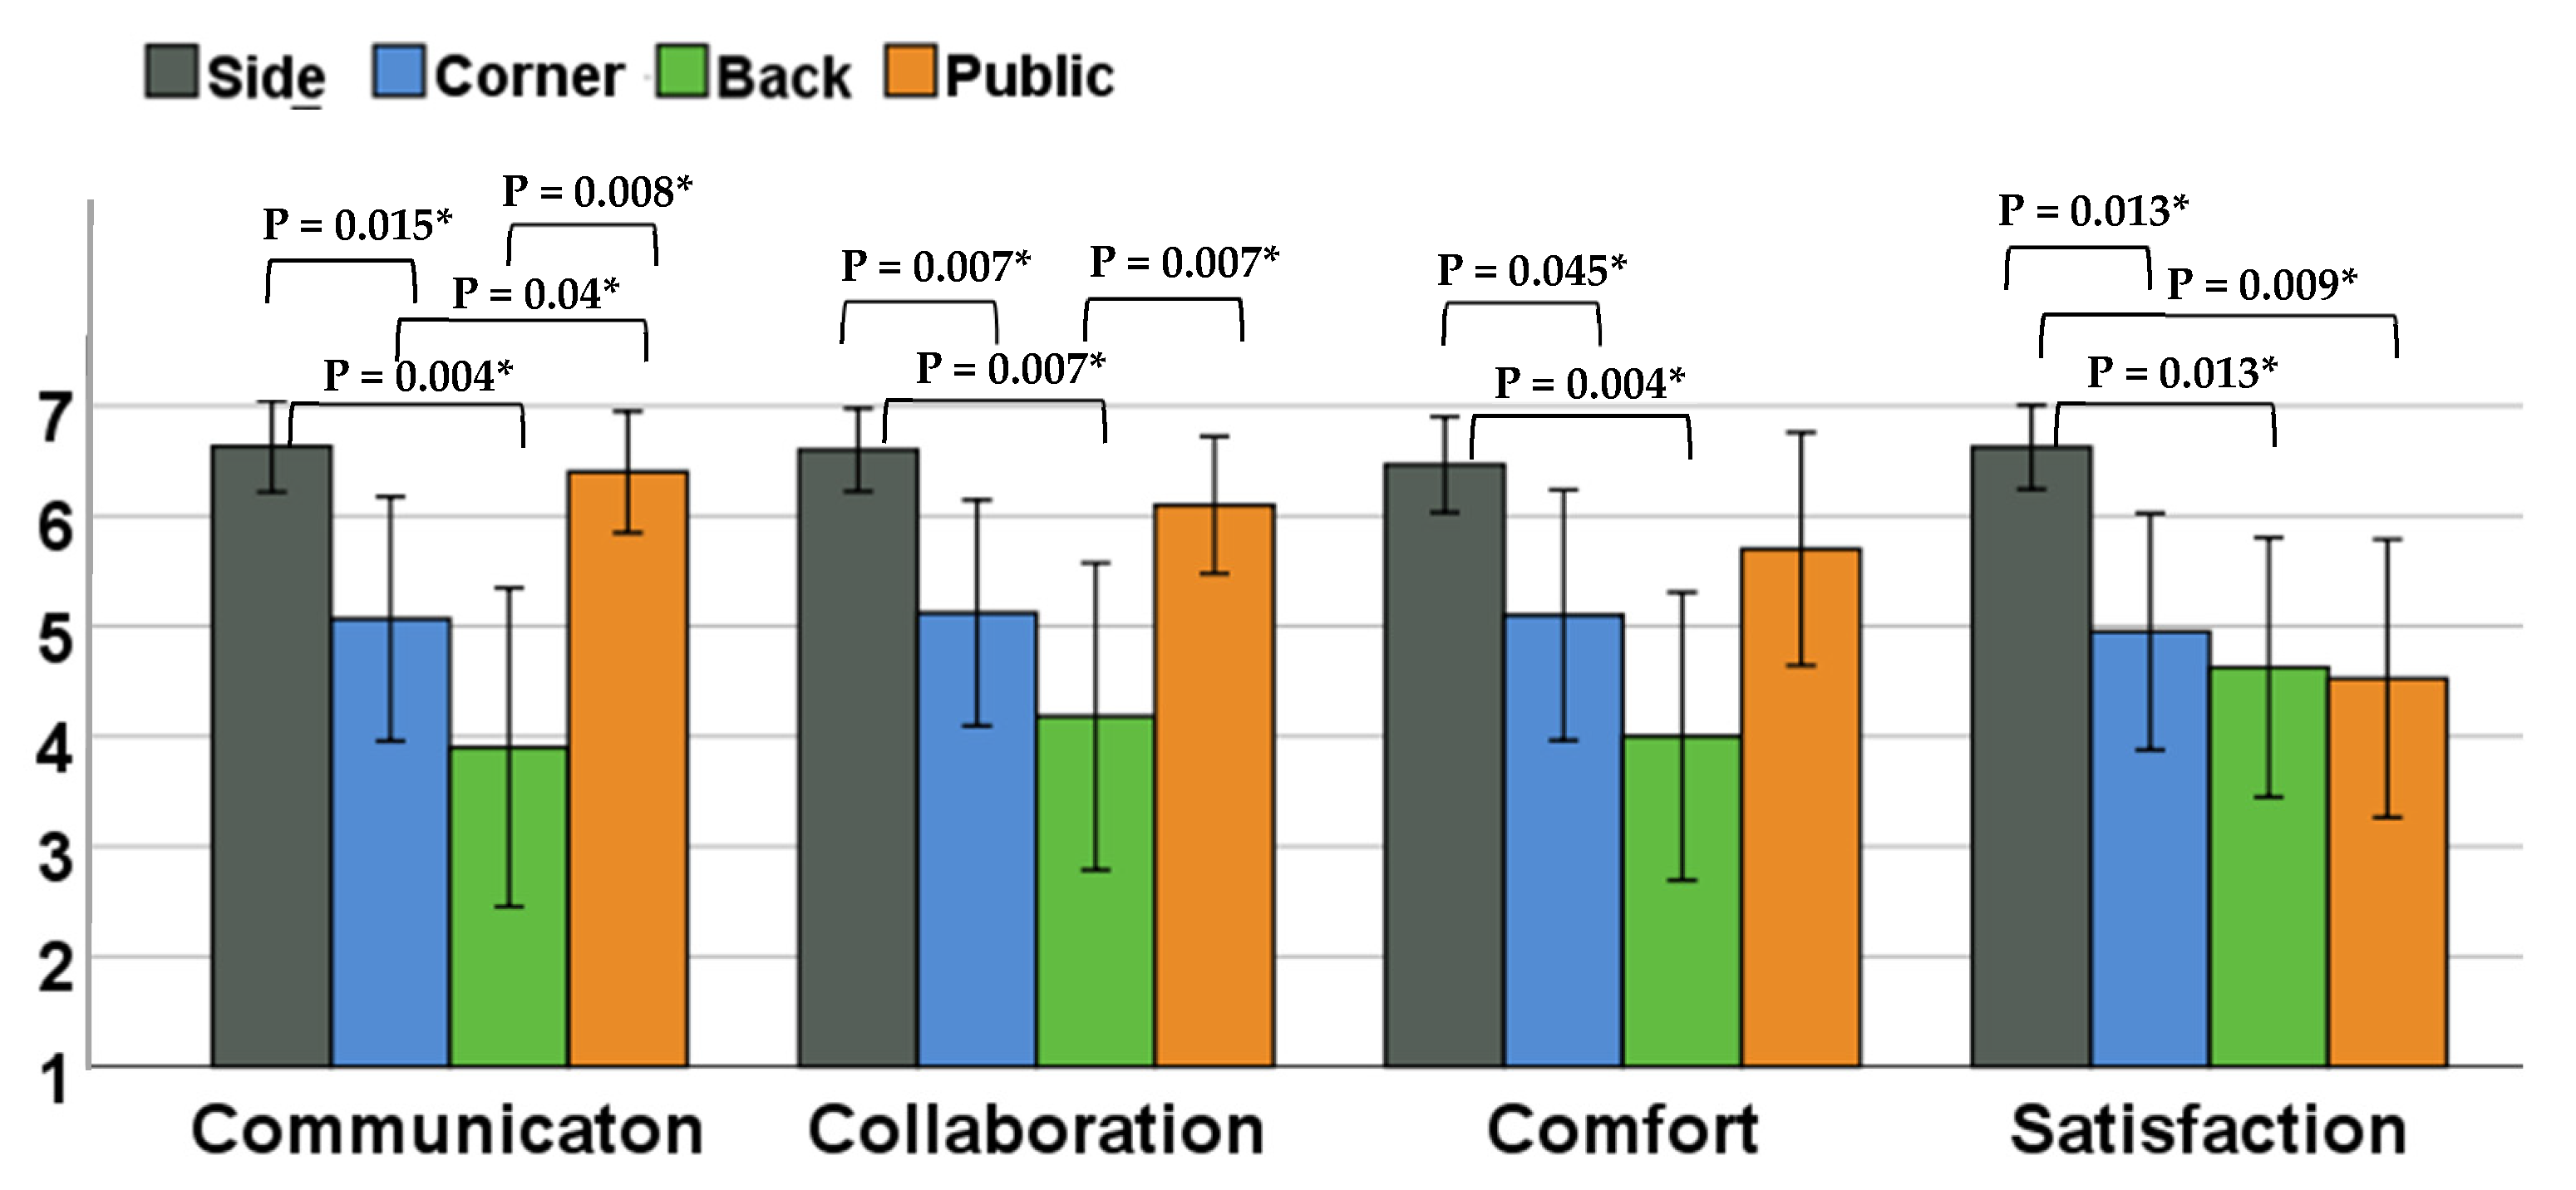