
A LIME-Based Explainable Machine Learning Model for Predicting the Severity Level of COVID-19 Diagnosed Patients


Abstract
:1. Introduction
- We introduce MLP and decision tree machine learning models to predict the level of severity of illness in patients diagnosed with COVID-19. Our experimental results indicate that our models can achieve up to 80% prediction accuracy.
- Applying the proposed machine learning models can assist medical staff in performing fast, early, and effective triage, thereby taking the necessary measures to prevent patient deterioration and conserve strained medical resources.
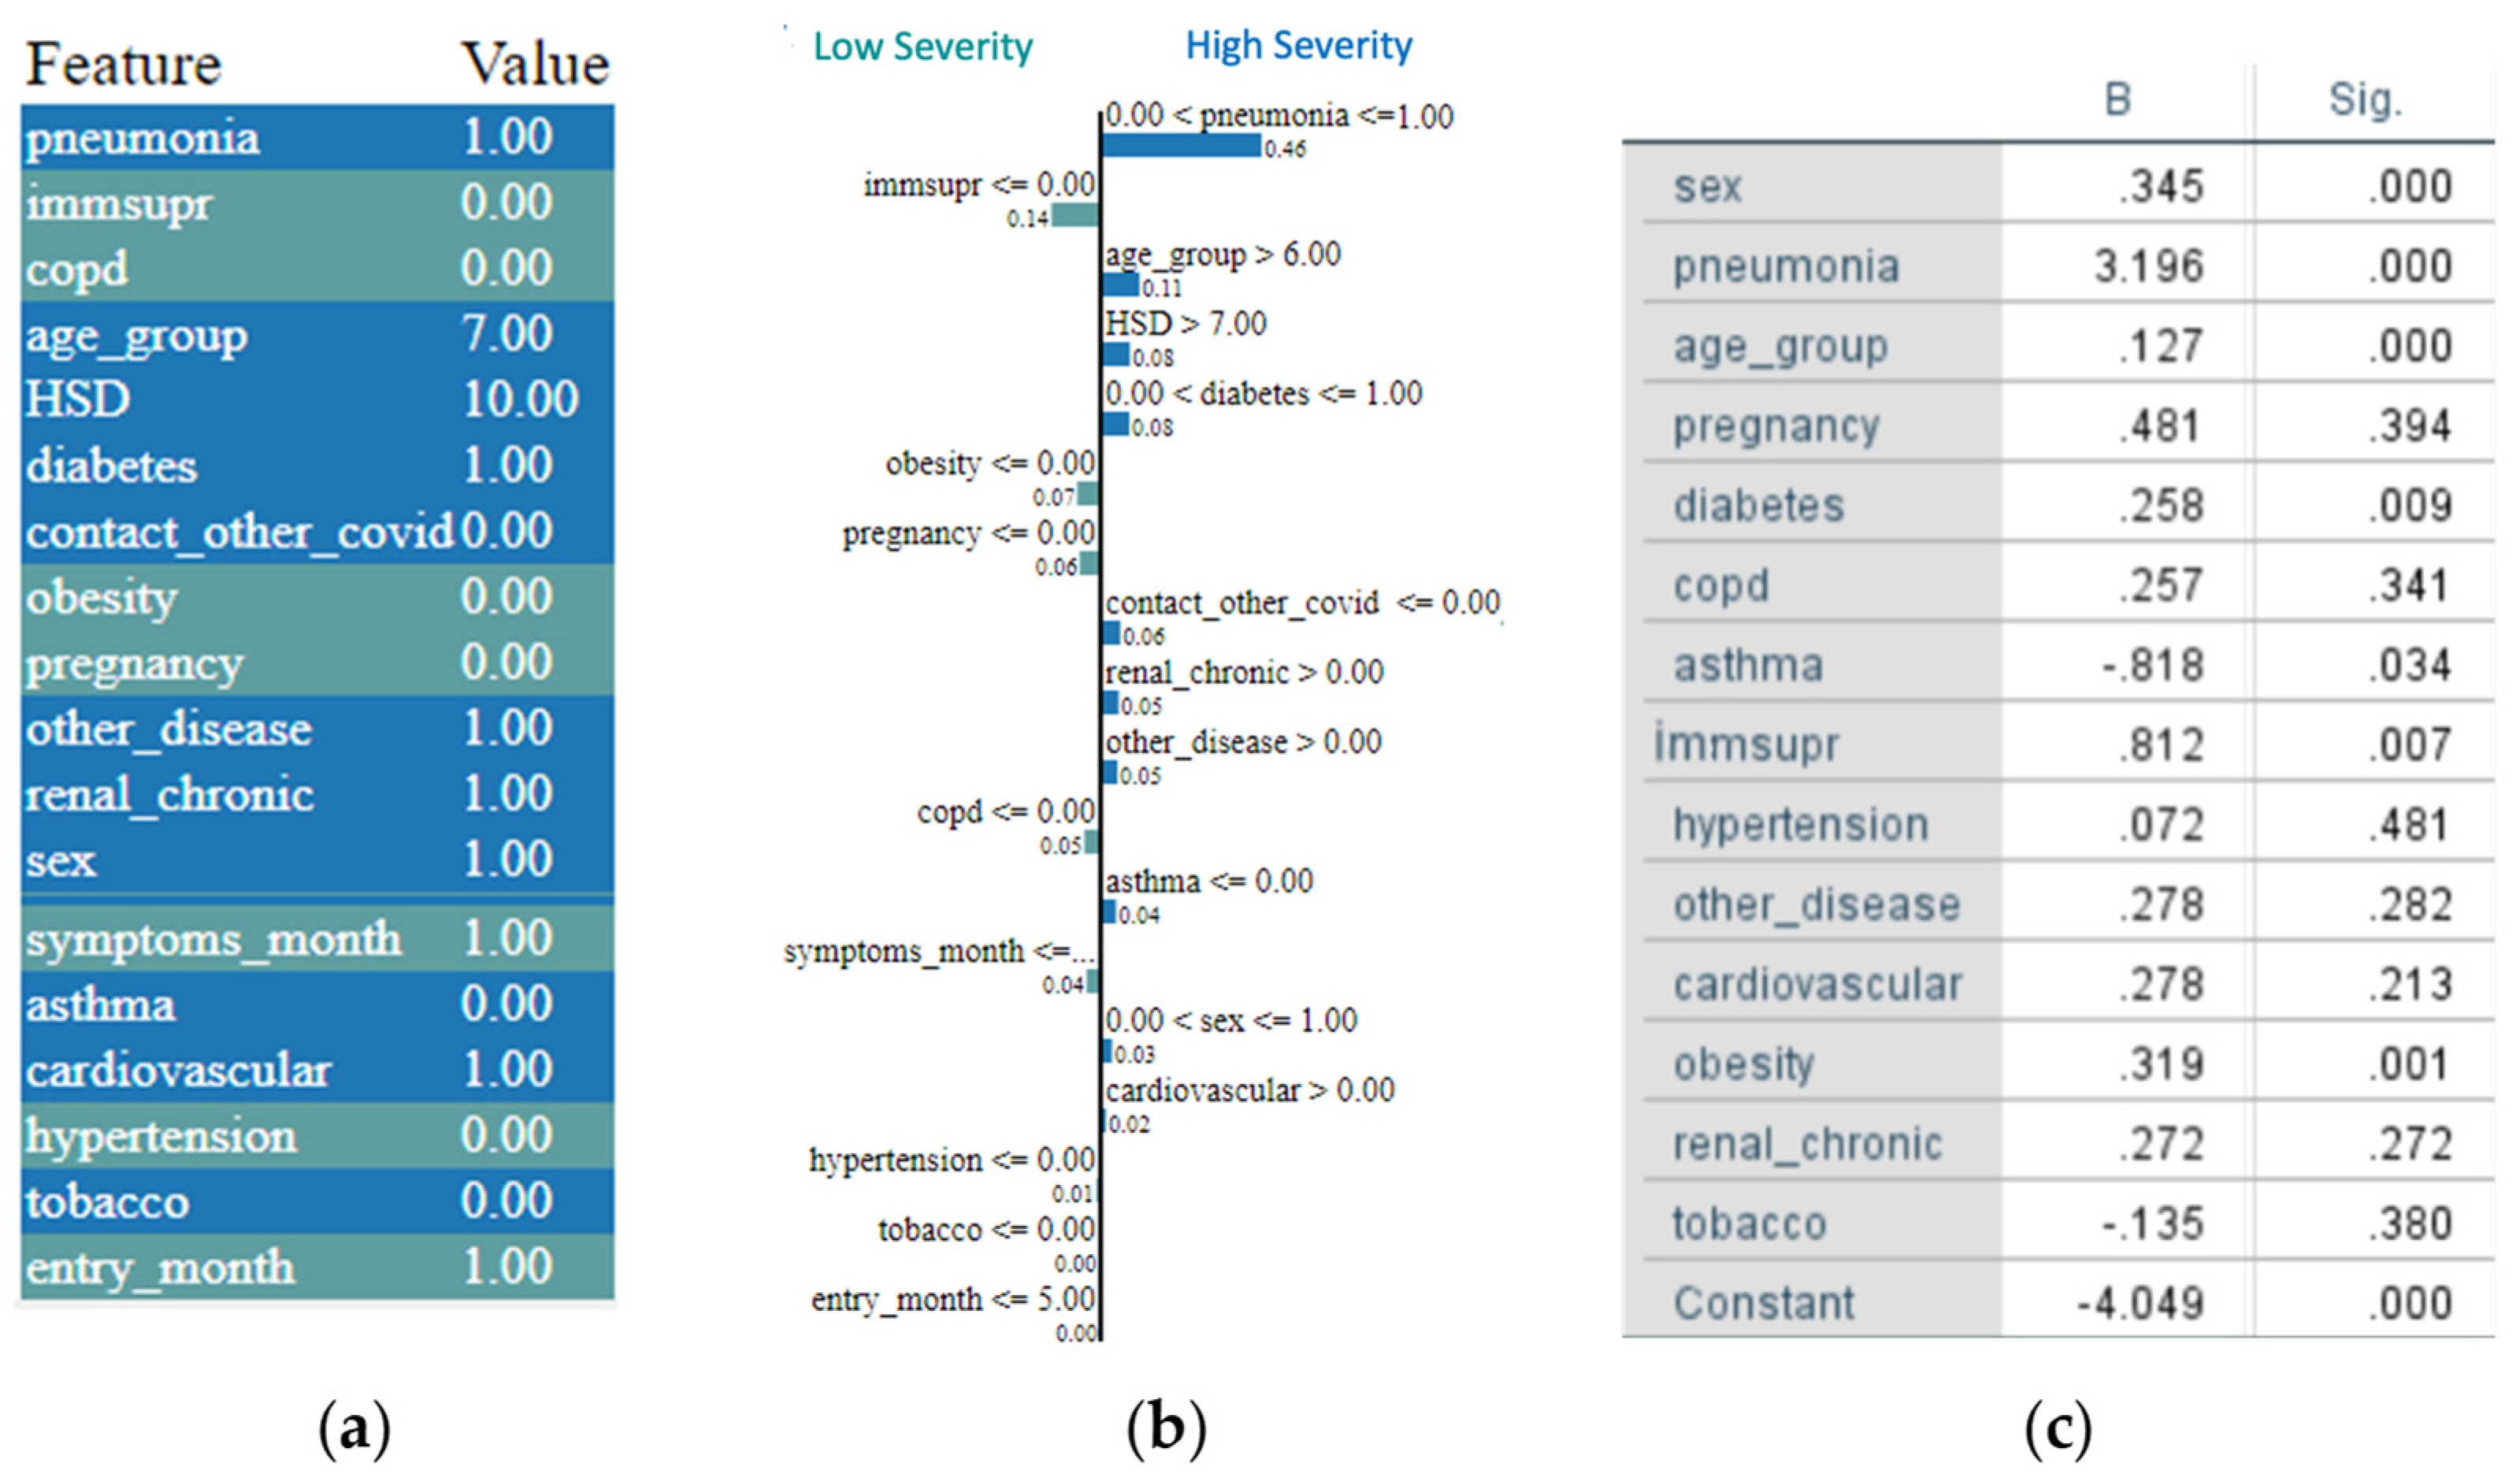
- We integrate a LIME-based explainability model with the machine learning model and demonstrate how such integrated model can be used to provide further insights into an individual patient’s medical condition and can identify the factors that most contribute to the patient’s illness severity.
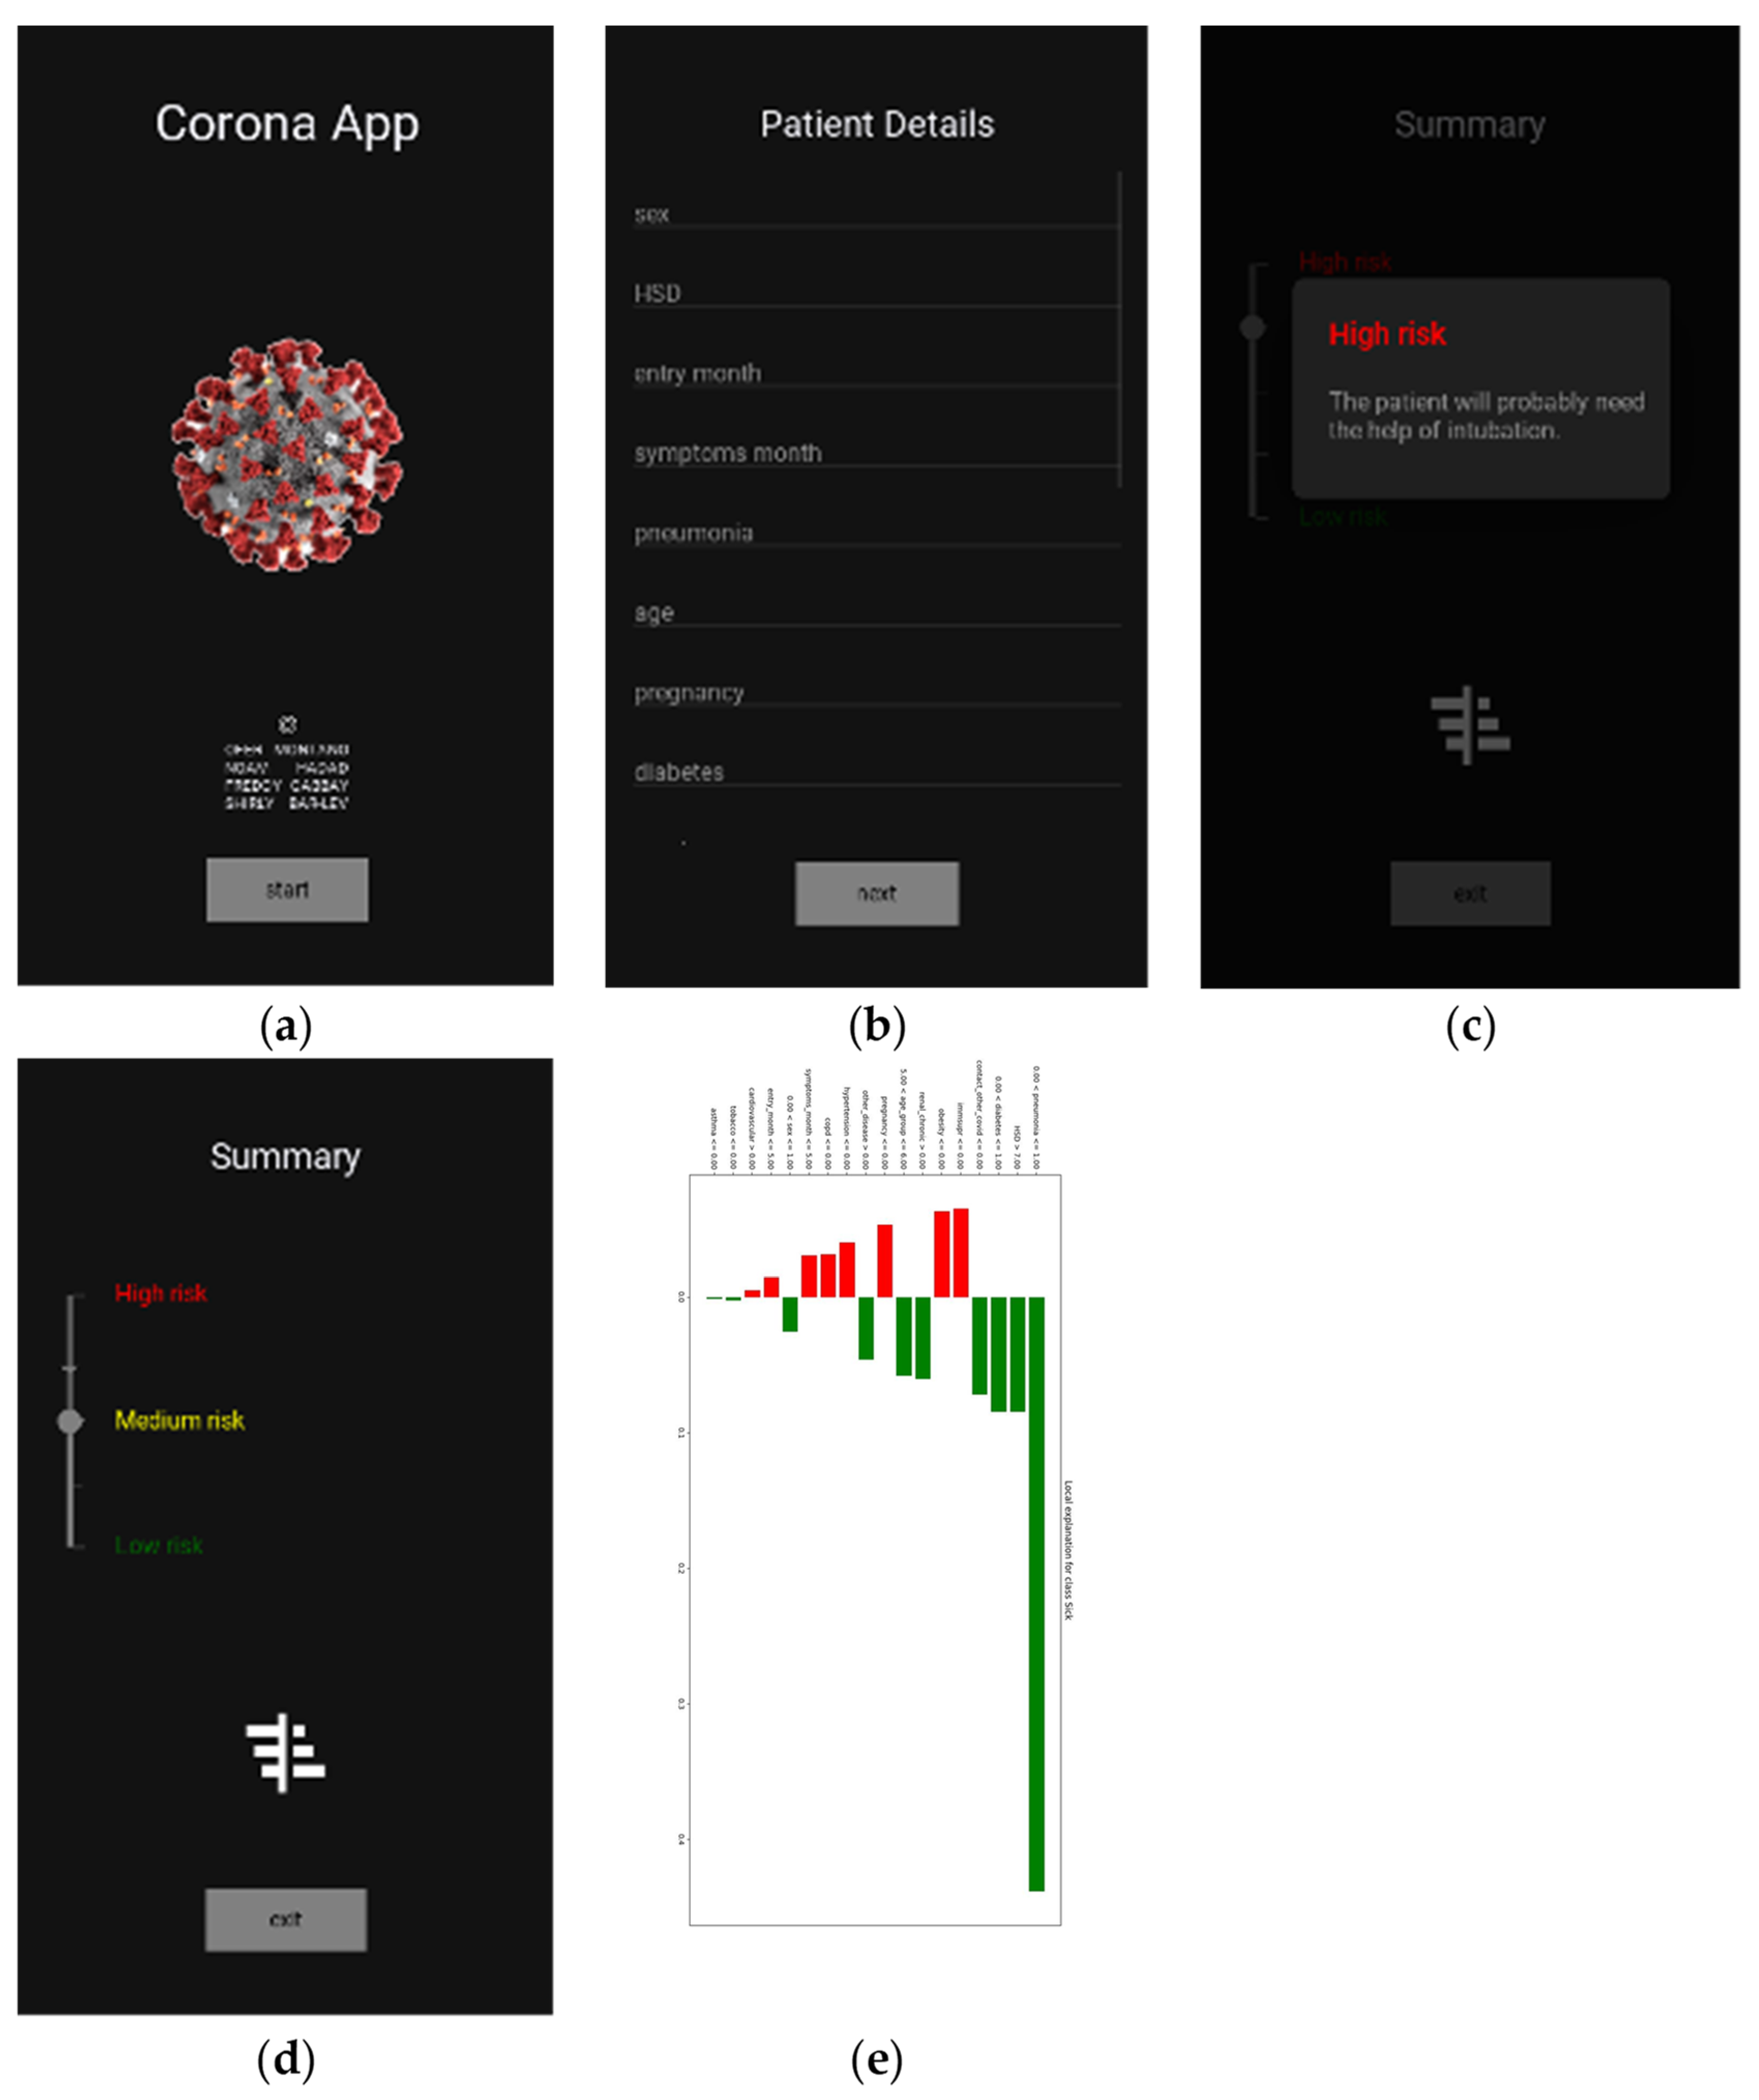
- Finally, integration into a mobile application makes the proposed models accessible and easy-to-use by medical staff everywhere.
2. Prior Works
2.1. COVID-19 Pandemic Behavior Forecasting
2.2. Diagnostic Applications
3. Dataset of Patients Diagnosed with COVID-19
4. Machine Learning Model
4.1. Machine Learning Models
4.2. Random Forest Model
4.3. Experimental Results
5. A LIME-Based Explainability Model
6. Application Design
7. Conclusions
- An exploration using another high-quality dataset is suggested to further understand the models’ performance and limitations.
- We also encourage a further examination of transfer-learning methods, which can adapt the learning process from one dataset to other datasets.
- Due to the structure of the database, the model is unable to predict deterioration or amelioration (i.e., a transition from one level of severity to another) based on demographic variables, medical history, and type of intervention. This is beyond the scope of this paper but should be attempted in future studies.
- Future studies are also encouraged to develop models that can generate a timeline depicting the progression of illness.
Supplementary Materials
Author Contributions
Funding
Institutional Review Board Statement
Informed Consent Statement
Conflicts of Interest
References
- Heldt, F.S.; Vizcaychipi, M.P.; Peacock, S.; Cinelli, M.; McLachlan, L.; Andreotti, F.; Jovanović, S.; Dürichen, R.; Lipunova, N.; Fletcher, R.A.; et al. Early risk assessment for COVID-19 patients from emergency department data using machine learning. Sci. Rep. 2021, 11, 4200. [Google Scholar] [CrossRef]
- Shamout, F.E.; Shen, Y.; Wu, N.; Kaku, A.; Park, J.; Makino, T.; Jastrzębski, S.; Witowski, J.; Wang, D.; Zhang, B.; et al. An artificial intelligence system for predicting the deterioration of COVID-19 patients in the emergency department. NPJ Digit. Med. 2021, 4, 80. [Google Scholar] [CrossRef]
- Zheng, S.; Fan, J.; Yu, F.; Feng, B.; Lou, B.; Zou, Q.; Xie, G.; Lin, S.; Wang, R.; Yang, X.; et al. Viral load dynamics and disease severity in patients infected with SARS-CoV-2 in Zhejiang province, China, January-March 2020: Retrospective cohort study. BMJ 2020, 369, m1443. [Google Scholar]
- Aggarwal, C.C. Neural Networks and Deep Learning: A Textbook; Springer Nature: Cham, Switzerland, 2019; ISBN 9783030068561. [Google Scholar]
- Forman, G.; Scholz, M. Apples-to-apples in cross-validation studies: Pitfalls in classifier performance measurement. ACM SIGKDD Explor. Newsl. 2010, 12, 49–57. [Google Scholar] [CrossRef]
- Goodfellow, I.; Bengio, Y.; Courville, A. Deep Learning; MIT Press: Cambridge, MA, USA, 2016. [Google Scholar]
- Thrun, M.C.; Gehlert, T.; Ultsch, A. Analyzing the Fine Structure of Distributions. PLoS ONE 2020, 15, e0238835. [Google Scholar] [CrossRef] [PubMed]
- Ultsch, A.; Hoffman, J.; Röhnert, M.; Von Bonin, M.; Oelschlägel, U.; Brendel, C.; Thrun, M.C. An Explainable AI System for the Diagnosis of High Dimensional Biomedical Data. arXiv 2021, arXiv:2107.01820. [Google Scholar]
- Yang, R.; Jiang, Y.; Mathews, S.; Housworth, E.A.; Hahn, M.W.; Radivojac, P. A new class of metrics for learning on real-valued and structured data. Data Min. Knowl. Discov. 2019, 33, 995–1016. [Google Scholar] [CrossRef] [Green Version]
- Sidey-Gibbons, J.A.M.; Sidey-Gibbons, C.J. Machine learning in medicine: A practical introduction. BMC Med. Res. Methodol. 2019, 19, 64. [Google Scholar] [CrossRef] [Green Version]
- Hasan, M.K.; Alam, M.A.; Das, D.; Hossain, E.; Hasan, M. Diabetes Prediction Using Ensembling of Different Machine Learning Classifiers. IEEE Access 2020, 8, 76516–76531. [Google Scholar] [CrossRef]
- Rahman, A.S.; Shamrat, F.J.M.; Tasnim, Z.; Roy, J.; Hossain, S.A. A comparative study on liver disease prediction using supervised machine learning algorithms. Int. J. Sci. Technol. Res. 2019, 8, 419–422. [Google Scholar]
- Cruz, J.A.; Wishart, D.S. Applications of Machine Learning in Cancer Prediction and Prognosis. Cancer Inform. 2006, 2. [Google Scholar] [CrossRef]
- Bertsimas, D.; Orfanoudaki, A.; Weiner, R.B. Personalized Treatment for Coronary Artery Disease Patients: A Machine Learning Approach. arXiv 2019, arXiv:1910.08483. [Google Scholar] [CrossRef] [PubMed]
- Vamathevan, J.; Clark, D.; Czodrowski, P.; Dunham, I.; Ferran, E.; Lee, G.; Li, B.; Madabhushi, A.; Shah, P.; Spitzer, M.; et al. Applications of machine learning in drug discovery and development. Nat. Rev. Drug Discov. 2019, 18, 463–477. [Google Scholar] [CrossRef]
- Kohli, M.; Prevedello, L.M.; Filice, R.W.; Geis, J.R. Implementing machine learning in radiology practice and research. Am. J. Roentgenol. 2017, 208, 754–760. [Google Scholar]
- Song, Y.; Zheng, S.; Li, L.; Zhang, X.; Zhang, X.; Huang, Z.; Chen, J.; Wang, R.; Zhao, H.; Zha, Y.; et al. Deep learning Enables Accurate Diagnosis of Novel Coronavirus (COVID-19) with CT images. medRxiv 2021. [Google Scholar] [CrossRef] [Green Version]
- Pinter, G.; Felde, I.; Mosavi, A.; Ghamisi, P.; Gloaguen, R. COVID-19 pandemic prediction for Hungary; A hybrid machine learning approach. Mathematics 2020, 8, 890. [Google Scholar] [CrossRef]
- Zoabi, Y.; Deri-Rozov, S.; Shomron, N. Machine learning-based prediction of COVID-19 diagnosis based on symptoms. NPJ Digit. Med. 2021, 4, 3. [Google Scholar]
- Breiman, L. Random Forests. Mach. Learn. 2001, 45, 5–32. [Google Scholar] [CrossRef] [Green Version]
- Mexican Federal Health Secretary, General Director of Epidemiology. Datos Abiertos. Base De Datos Abiertos Históricos Abr-Dic. 2020. Available online: https://www.gob.mx/salud/documentos/datos-abiertos-152127 (accessed on 11 October 2021).
- Lundberg, S.; Lee, S.-I. A unified approach to interpreting model predictions. In Proceedings of the 31st International Conference on Neural Information Processing Systems, Long Beach, CA, USA, 4–9 December 2017; pp. 4768–4777. [Google Scholar]
- Punn, N.S.; Sonbhadra, S.K.; Agarwal, S. COVID-19 epidemic analysis using machine learning and deep learning algorithms. bioRxiv 2020. [Google Scholar] [CrossRef] [Green Version]
- Benvenuto, D.; Giovanetti, M.; Vassallo, L.; Angeletti, S.; Ciccozzi, M. Application of the ARIMA model on the COVID-2019 epidemic dataset. Data Brief 2020, 29, 105340. [Google Scholar] [CrossRef] [PubMed]
- Deb, S.; Majumdar, M. A time series method to analyze incidence pattern and estimate reproduction number of COVID-19. arXiv 2020, arXiv:2003.10655. [Google Scholar]
- Sujath, R.; Chatterjee, J.M.; Hassanien, A.E. A machine learning forecasting model for COVID-19 pandemic in India. Stoch. Environ. Res. Risk Assess. 2020, 34, 959–972. [Google Scholar]
- Chan, J.F.-W.; Yuan, S.; Kok, K.-H.; To, K.K.-W.; Chu, H.; Yang, J.; Xing, F.; Liu, J.; Yip, C.C.-Y.; Poon, R.W.-S.; et al. A familial cluster of pneumonia associated with the 2019 novel coronavirus indicating person-to-person transmission: A study of a family cluster. Lancet 2020, 395, 514–523. [Google Scholar] [CrossRef] [Green Version]
- Yin, S.; Zhang, N.; Dong, H. Preventing COVID-19 from the perspective of industrial information integration: Evaluation and continuous improvement of information networks for sustainable epidemic prevention. J. Ind. Inf. Integr. 2020, 19, 100157. [Google Scholar]
- Zu, Z.Y.; Jiang, M.D.; Xu, P.P.; Chen, W.; Ni, Q.Q.; Lu, G.M.; Zhang, L.J. Coronavirus disease 2019 (COVID-19): A perspective from China. Radiology 2020, 296, E15–E25. [Google Scholar] [CrossRef] [Green Version]
- Wang, L.; Wong, A. COVID-Net: A tailored deep convolutional neural network design for detection of COVID-19 cases from chest X-ray images. arXiv 2020, arXiv:2003.09871. [Google Scholar] [CrossRef] [PubMed]
- Kumar, V. Healthcare Centers are Turning to AI to Combat COVID-19. Analytics Insight. 2020. Available online: https://www.analyticsinsight.net/healthcare-centers-turning-ai-combat-covid-19 (accessed on 11 October 2021).
- Laguarta, J.; Hueto, F.; Subirana, B. COVID-19 artificial intelligence diagnosis using only cough recordings. IEEE Open J. Eng. Med. Biol. 2020, 1, 275–281. [Google Scholar] [CrossRef]
- Maghdid, H.S.; Ghafoor, K.Z.; Sadiq, A.S.; Curran, K.; Rawat, D.B.; Rabie, K. A novel AI-enabled framework to diagnose Coronavirus COVID 19 using smartphone embedded sensors: Design study. arXiv 2020, arXiv:2003.07434 [cs.HC]. [Google Scholar]
- de Moraes Batista, A.F.; Miraglia, J.L.; Rizzi Donato, T.H.; Porto Chiavegatto Filho, A.D. COVID-19 diagnosis prediction in emergency care patients: A machine learning approach. bioRxiv 2020. [Google Scholar] [CrossRef] [Green Version]
- Jiang, X.; Coffee, M.; Bari, A.; Wang, J.; Jiang, X.; Huang, J.; Shi, J.; Dai, J.; Cai, J.; Zhang, T.; et al. Towards an artificial intelligence framework for data-driven prediction of Coronavirus clinical severity. Comput. Mater. Contin. 2020, 62, 537–551. [Google Scholar]
- Kingma, D.P.; Ba, J. Adam: A method for stochastic optimization. arXiv 2014, arXiv:1412.6980. [Google Scholar]
- Ribeiro, M.T.; Singh, S.; Guestrin, C. Why should I trust you?: Explaining the predictions of any classifier. In Proceedings of the 22nd ACM SIGKDD International Conference on Knowledge Discovery and Data Mining, San Francisco, CA, USA, 13–17 August 2016; ACM: New York, NY, USA, 2016. [Google Scholar]
- Visani, G.; Bagli, E.; Chesani, F.; Poluzzi, A.; Capuzzo, D. Statistical stability indices for LIME: Obtaining reliable explanations for Machine Learning models. arXiv 2020, arXiv:2001.11757. [Google Scholar]
- Gad, A.F.M. Building Android Apps in Python Using Kivy with Android Studio: With Pyjnius, Plyer, and Buildozer, 1st ed.; APress: Berlin, Germany, 2019; ISBN 9781484250303. [Google Scholar]
- Gulli, A.; Pal, S. Deep Learning with Keras; Packt Publishing: Birmingham, UK, 2017; ISBN 9781787128422. [Google Scholar]


| Field Number | Feature Field | Feature Field Values |
|---|---|---|
| 1 | Patient sex | Female/Male |
| 2 | Patient has cardiovascular disease | Yes/No |
| 3 | Lag of symptoms | The lag in days from appearance of symptoms to hospital admission |
| 4 | Entry date | Hospital admission date |
| 5 | Date of symptoms | Date of first symptoms |
| 6 | Patient has other background diseases | Yes/No |
| 7 | Patient is obese | Yes/No |
| 8 | Patient had pneumonia | Yes/No |
| 9 | Patient has asthma | Yes/No |
| 10 | Patient has chronic renal failure | Yes/No |
| 11 | Patient has a history of smoking | Yes/No |
| 12 | Patient exposed to other COVID-19 patients | Yes/No |
| 13 | Patient age | Age |
| 14 | Patient is pregnant | Yes/No |
| 15 | Patient has diabetes | Yes/No |
| 16 | Patient has Chronic obstructive pulmonary disease (COPD) | Yes/No |
| 17 | Patient has immune system suppression | Yes/No |
| 18 | Patient has hypertension | Yes/No |
| Filed Number | Field | Field Values |
|---|---|---|
| 1 | Patient type | Outpatient/inpatient |
| 2 | Patient intubated | Yes/No |
| 3 | Patient admitted to ICU | Yes/No |
| 4 | Patient died | Yes/No |
| Severity Level | MLP Model A | MLP Model B |
|---|---|---|
| High | ICU admission, intubation, or death (2800 records) | Intubation or death (1500 records) |
| Medium | n/a | Hospitalized or ICU admission (1500 records) |
| Low | Hospitalized (mild symptoms) or discharged (2800 records) | Discharged (1500 records) |
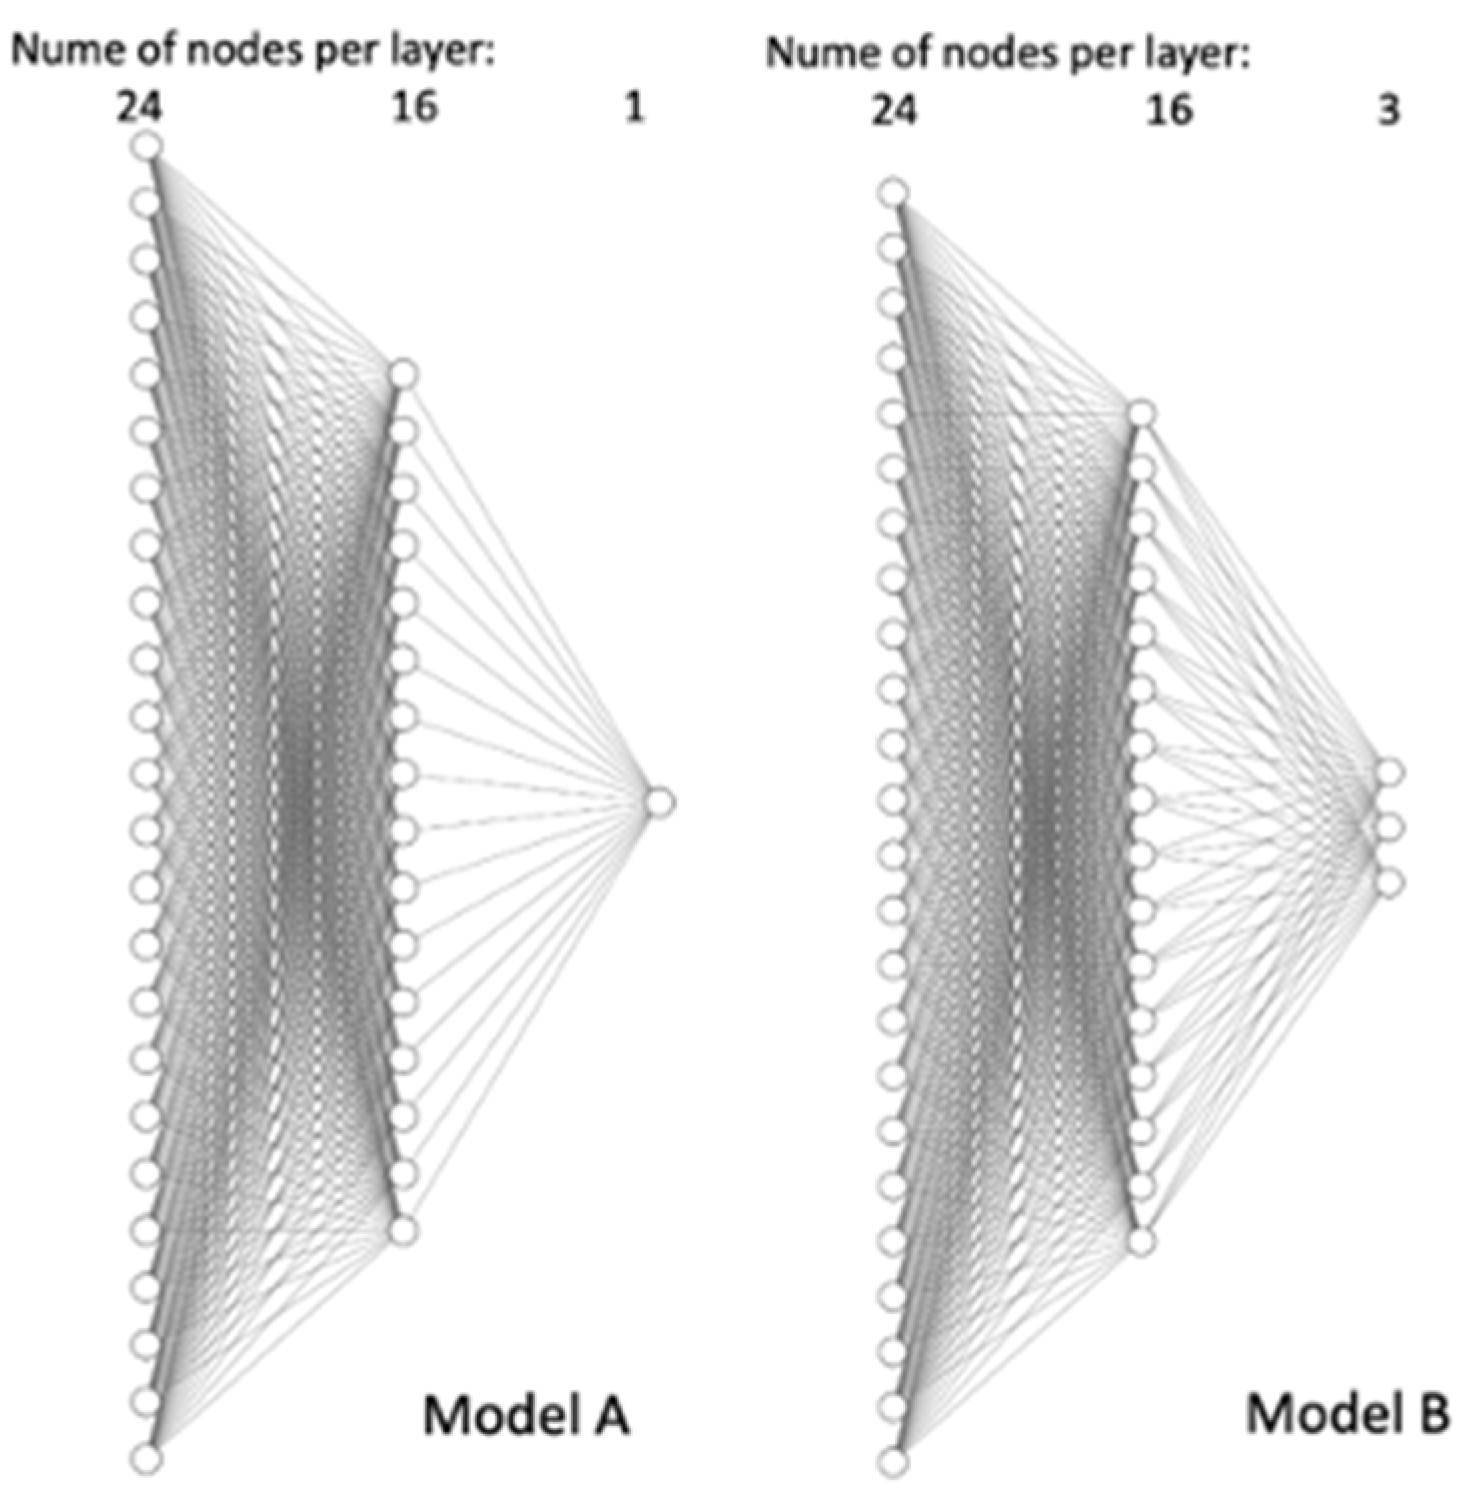
| Hyperparameter | Value |
|---|---|
| Number of layers | 3 |
| Number of nodes | Input layer: 24 Hidden layer:16 Output layer: Model A: 1 Model B: 3 |
| Learning rate | 0.002 |
| Optimizer | Adam |
| Batch size | 20 |
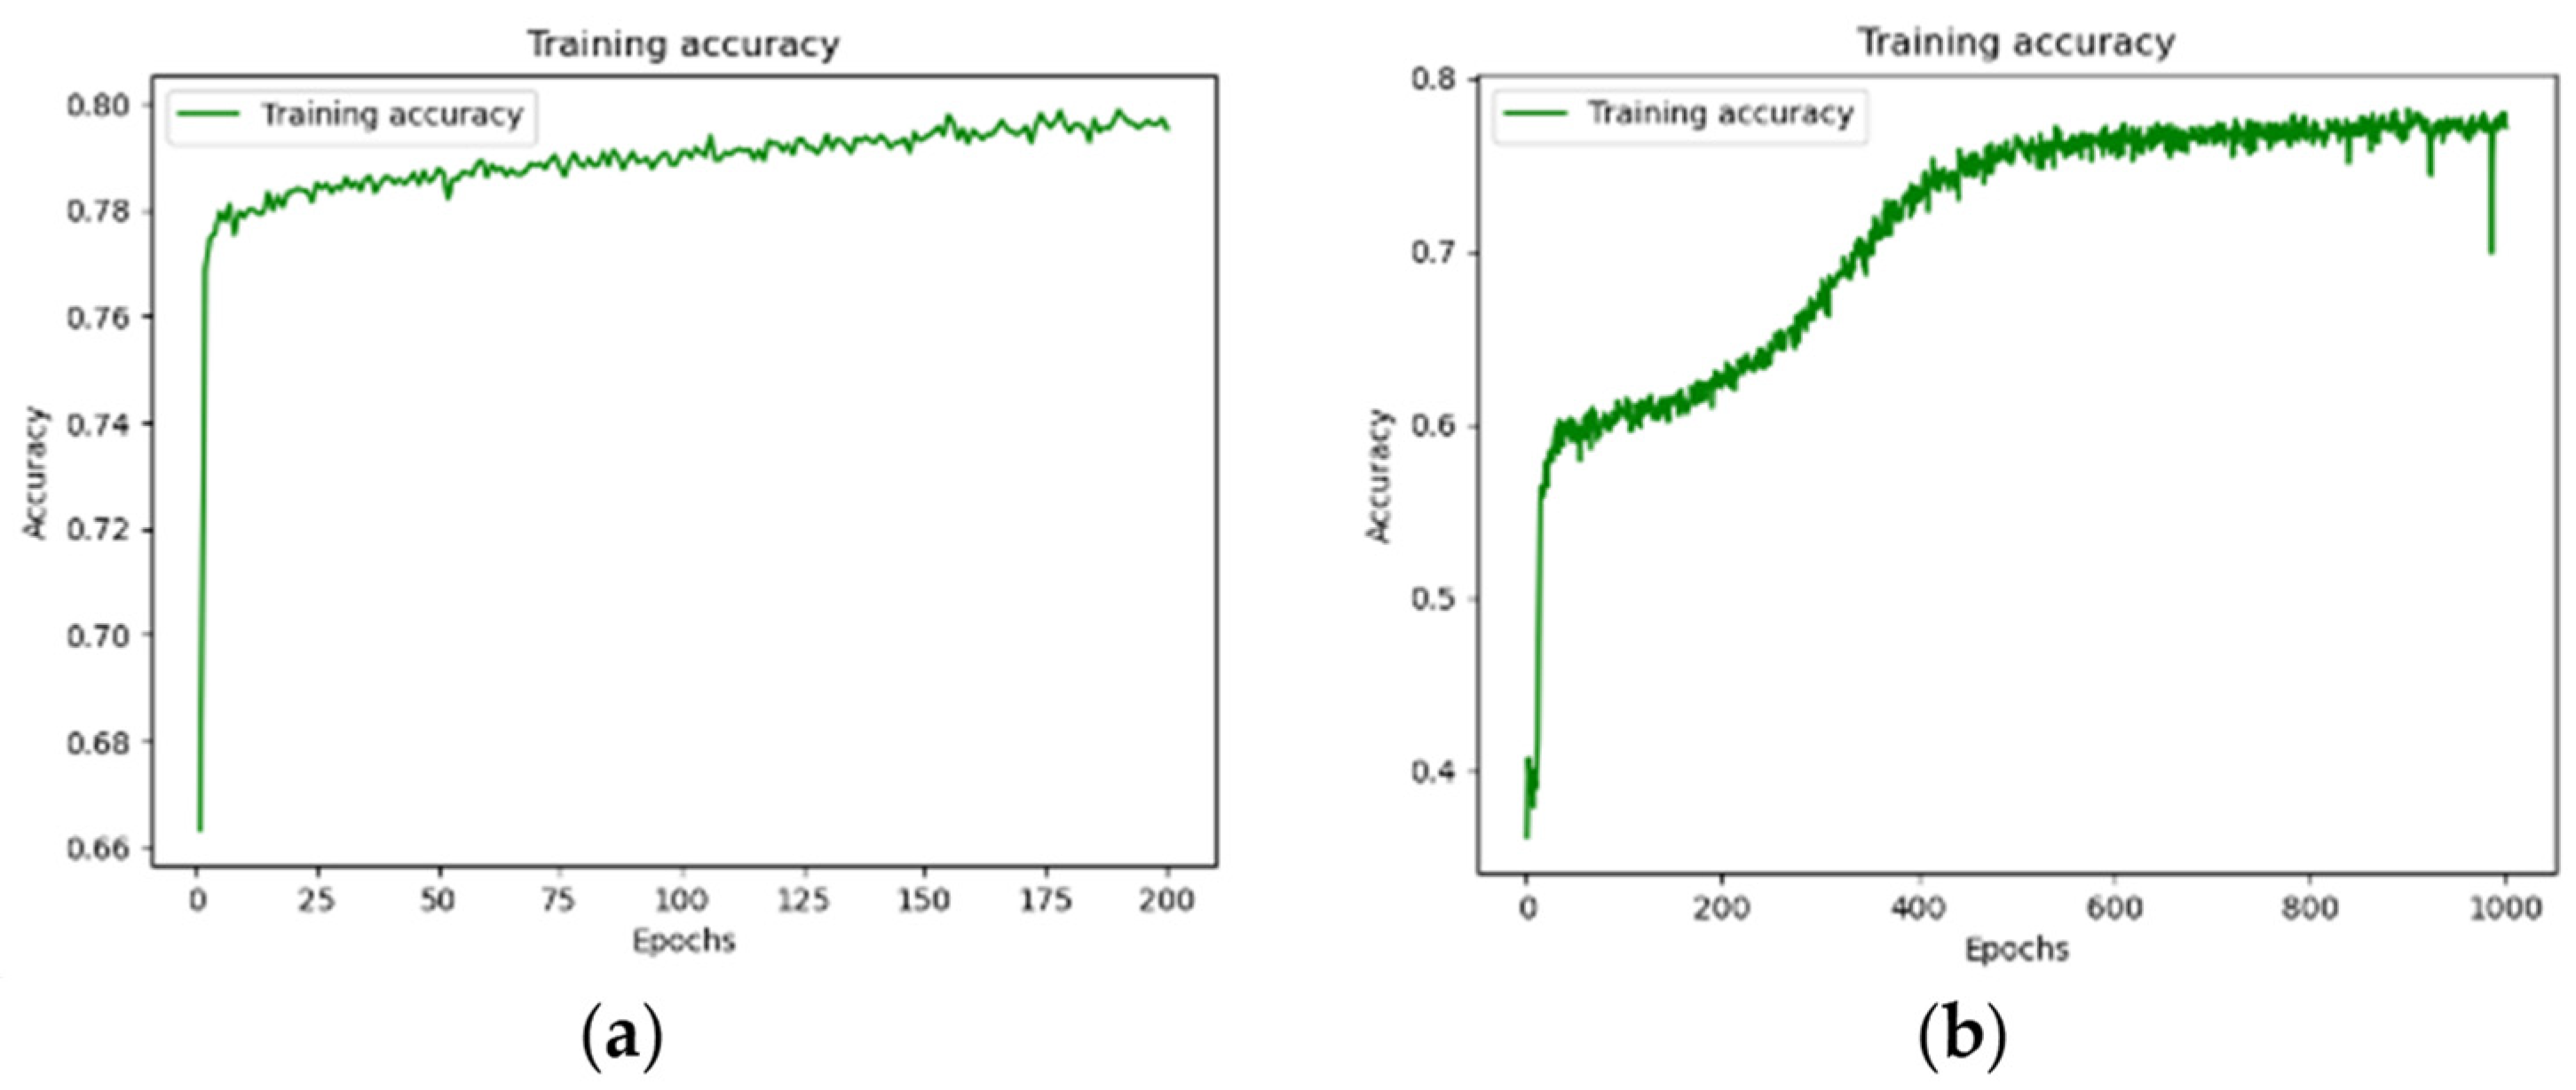
| Number of batches | Model A: 200 Model B: 1000 |
| Hyperparameter | Value |
|---|---|
| Bootstrap | True |
| Minimum samples leaf | 3 |
| Number of trees in the forest | 50 |
| Minimum number of samples required to split | 10 |
| Number of features considered when looking for the best split | SQRT |
| Maximum depth of a tree | 6 |
| Limited leaf nodes | False |
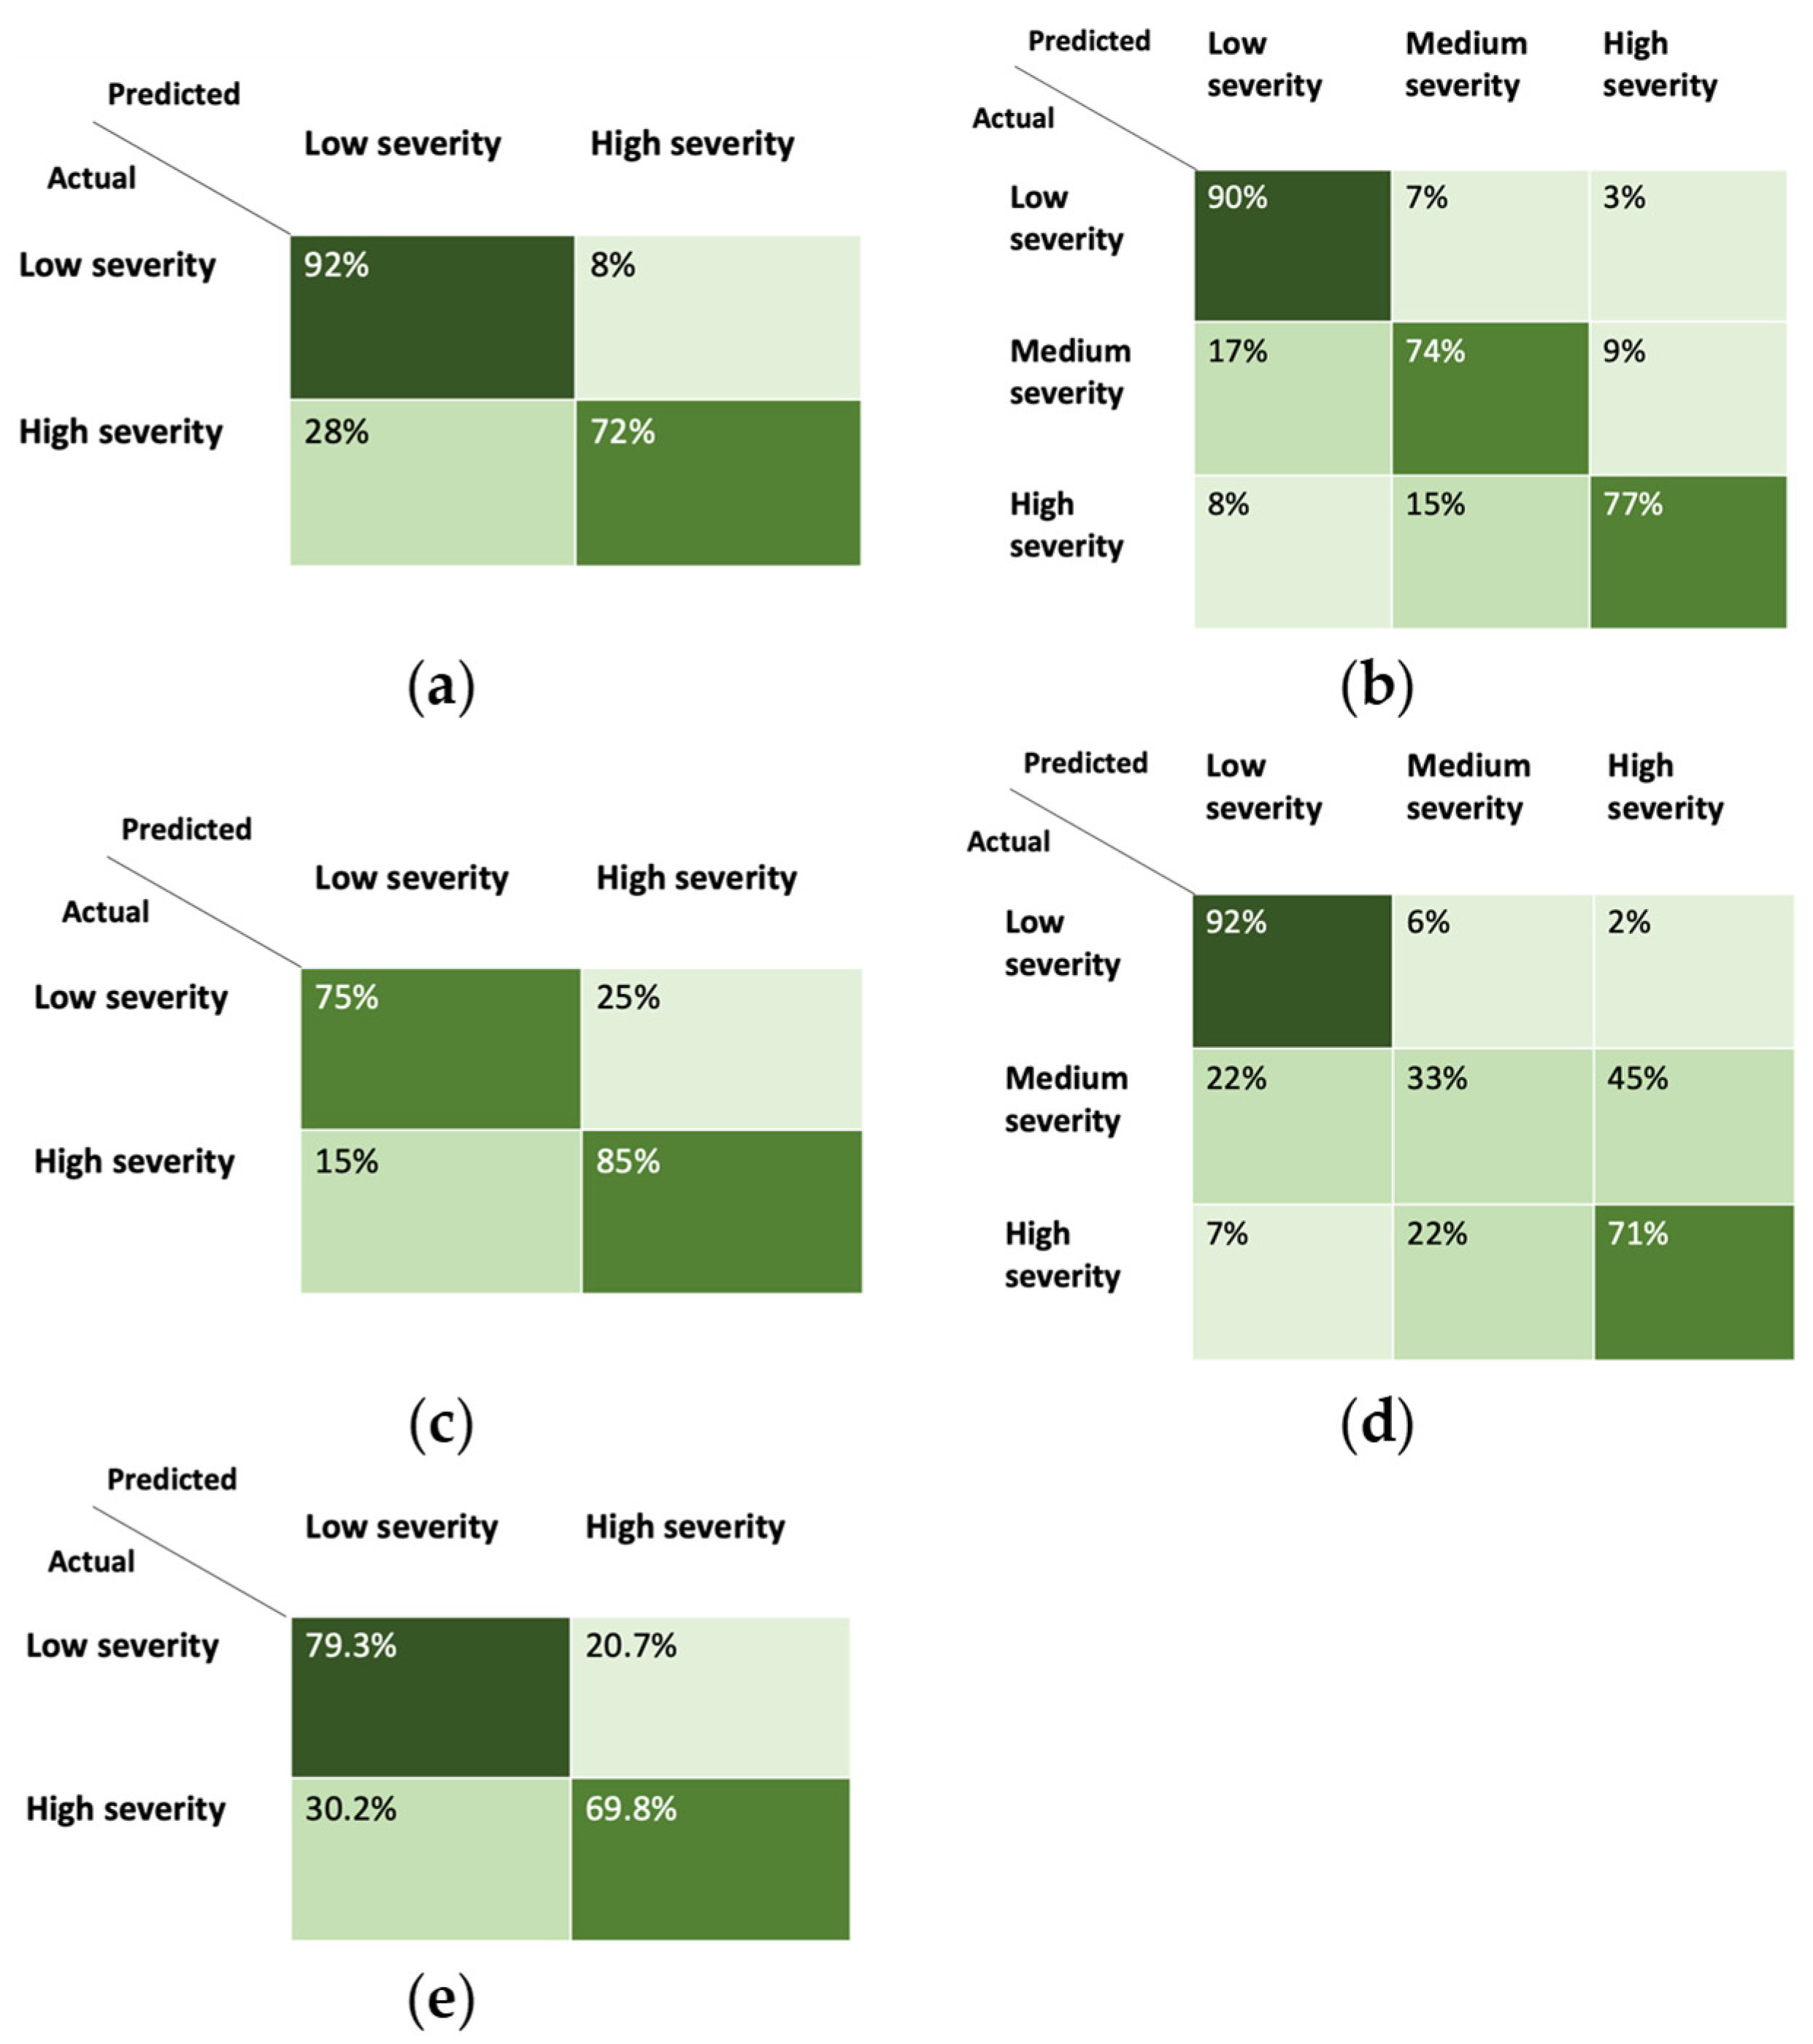
| Model | Prediction Accuracy |
|---|---|
| MLP Model A | 80.0% |
| MLP Model B | 78.0% |
| RF Model A | 80.0% |
| RF Model B | 65.0% |
| Binary regression | 76.7% |
Publisher’s Note: MDPI stays neutral with regard to jurisdictional claims in published maps and institutional affiliations. |
© 2021 by the authors. Licensee MDPI, Basel, Switzerland. This article is an open access article distributed under the terms and conditions of the Creative Commons Attribution (CC BY) license (https://creativecommons.org/licenses/by/4.0/).
Share and Cite
Gabbay, F.; Bar-Lev, S.; Montano, O.; Hadad, N. A LIME-Based Explainable Machine Learning Model for Predicting the Severity Level of COVID-19 Diagnosed Patients. Appl. Sci. 2021, 11, 10417. https://doi.org/10.3390/app112110417
Gabbay F, Bar-Lev S, Montano O, Hadad N. A LIME-Based Explainable Machine Learning Model for Predicting the Severity Level of COVID-19 Diagnosed Patients. Applied Sciences. 2021; 11(21):10417. https://doi.org/10.3390/app112110417
Chicago/Turabian StyleGabbay, Freddy, Shirly Bar-Lev, Ofer Montano, and Noam Hadad. 2021. "A LIME-Based Explainable Machine Learning Model for Predicting the Severity Level of COVID-19 Diagnosed Patients" Applied Sciences 11, no. 21: 10417. https://doi.org/10.3390/app112110417