Article

Deep Learning-Based Method to Recognize Line Objects and Flow Arrows from Image-Format Piping and Instrumentation Diagrams for Digitization

1
School of Mechanical Engineering, Korea University, 145 Anam-ro, Seongbuk-gu, Seoul 02841, Korea
2
Department of Precision Mechanical Engineering, Kyungpook National University, 2559, Gyeongsang-daero, Sangju-si 37224, Gyeongsangbuk-do, Korea
*
Author to whom correspondence should be addressed.
Appl. Sci. 2021, 11(21), 10054; https://doi.org/10.3390/app112110054
Submission received: 9 September 2021 / Revised: 4 October 2021 / Accepted: 25 October 2021 / Published: 27 October 2021
(This article belongs to the Topic Machine and Deep Learning)

Abstract

:
As part of research on technology for automatic conversion of image-format piping and instrumentation diagram (P&ID) into digital P&ID, the present study proposes a method for recognizing various types of lines and flow arrows in image-format P&ID. The proposed method consists of three steps. In the first step of preprocessing, the outer border and title box in the diagram are removed. In the second step of detection, continuous lines are detected, and then line signs and flow arrows indicating the flow direction are detected. In the third step of post-processing, using the results of line sign detection, continuous lines that require changing of the line type are determined, and the line types are adjusted accordingly. Then, the recognized lines are merged with flow arrows. For verification of the proposed method, a prototype system was used to conduct an experiment of line recognition. For the nine test P&IDs, the average precision and recall were 96.14% and 89.59%, respectively, showing high recognition performance.

1. Introduction

Image recognition is a technology that has been studied for a long time in the field of computer vision, as a technology for identifying information in an image. With the recent developments of artificial intelligence, deep learning-based image recognition is being applied in various industries, such as autonomous driving [1], medical diagnoses [2], facial recognition [3], and smart farms [4]. In addition, various studies using deep learning have been conducted in the engineering field, such as drawing digitization [5], manufacturability verification [6], and fault diagnosis [7].
Piping and instrumentation diagrams (P&IDs) are developed based on process flow diagram (PFD) information. A P&ID includes piping, instrumentation, equipment, and fittings, which are components of each process, and the relationship between these components and the flow of fluids are depicted in detail in the diagram. P&ID is a crucial means of storing results in the basic design stage and is used as master data in the subsequent stages of detailed design, construction, and operation. Therefore, when the need arises, the engineering information stored in P&IDs must be quickly and accurately searched.
Presently, most engineering, procurement, and construction (EPC) companies use digital P&IDs. However, even in the case of a newly constructed plant, the P&IDs created in the front end engineering and design (FEED) stage or those provided by the equipment and material manufacturers are in an image format in many cases due to contractual relationships or issues of intellectual property security. Enterprises that operate plants also apply digital P&IDs, but in the case of aging plants that have been in operation for a long time, a large amount of P&IDs are stored in image format, making digitization for these image-format P&IDs necessary. In addition, these companies often undergo continuous improvements and expansion of plants in the process of plant operation, and in these cases, P&IDs are provided in image formats from external contractor companies.
In this regard, conversion of P&IDs from image formats into digital P&IDs is essential. In the digitization of P&IDs, high-level objects in the image format diagram are identified, the relationship between these objects is formed, and the engineering attributes required for objects are input to create a digital diagram. The processes needed for the digitization of P&ID can be categorized into a step of recognizing information objects constituting a diagram in the image, identifying the relationship between the recognized objects, and creating a digital P&ID from the obtained information. At present, these processes are performed manually in most cases, which makes the process time-consuming and causes the problem of varying quality, depending on the person who manually performs the above operations.
As part of the abovementioned research, the present study proposes a method for recognizing various types of line objects and flow arrows included in P&IDs. Lines used in the P&ID include continuous lines and lines incorporating line signs. A flow arrow is a symbol indicating the flow direction of a pipeline. In P&IDs, a flow arrow is included in the line object and shows the direction of a fluid passing through the line object.
The proposed method consists of three steps. In the first step, the outer border and title box in the diagram are removed. In the second step, continuous lines are detected, and then line signs and flow arrows indicating the flow direction are detected. In the third step, using the results from the line sign detection, continuous lines that require changing of the line type are determined, and the line types are adjusted accordingly. Next, the recognized lines are merged with flow arrows.
This research has the following academic contributions. First, unlike previous studies that mainly identified continuous lines in image-format P&IDs, various types of lines were recognized by combining techniques of image processing and deep learning. Second, the flow arrows were recognized and merged as the sub-element of the recognized line. Third, the format of the training data required for deep learning-based recognition of line signs and flow arrows was defined, and the dataset was constructed.
The structure of this paper is organized as follows. Section 2 reviews related works. Section 3 proposes a method for recognizing line objects after the definition of line objects to be addressed. Section 4 describes the results of constructing a dataset required for training a deep neural network to apply line object recognition. Section 5 presents the detailed element techniques used for each step of recognizing line objects and flow arrows. Section 6 presents the implementation and experimental results. Finally, Section 7 concludes this study.

2. Related Work

Object detection is a technique in which object classification and object localization are performed for multiple objects in an input image. In the case of conducting object classification with image processing technique [8,9], features are extracted from the image through the techniques such as histogram of oriented gradient (HOG) [10], scale invariant feature transform (SIFT) [11], local binary pattern (LBP) [12], and modified census transform (MCT) [13]. Then, from the distribution of the extracted features, the target object for recognition is classified using a classifier, such as a support vector machine (SVM) [14] and Adaboost [15]. In the process of performing object detection, feature sets in a specific region are selected from the set of extracted features, and classification is performed using the selected feature sets.
There has been recent development of a variety of object detection methods based on convolutional neural networks (CNNs) [16]. The deep learning-based object detection method can be divided into a one-stage detector and a two-stage detector. In the two-stage detector, regional proposal and classification are performed in sequence. Here, the regional proposal searches the region where the candidate object is located in the image using methods such as a sliding window [17]. Representative examples of two-stage detectors include R-CNN [18], fast R-CNN [19], and faster R-CNN [20]. On the other hand, the one-stage detector is a method in which the regional proposal and classification are performed simultaneously. Representative examples of one-stage detectors include YOLO [21], SSD [22], and RetinaNet [23]. In general, one-stage detectors have a fast inference speed but low detection accuracy and two-stage detectors have a slow inference speed but high detection accuracy. Recently, more advanced deep neural networks have emerged with comparable detection accuracy to a two-stage detector and a comparable inference speed to a one-stage detector, such as RetinaNet and M2Det [24].
The Hough transform [25] is a method commonly used for recognizing lines in an image, and the main application area is lane detection [26]. When performing lane detection using the Hough transform, the input image is converted into a binary image. Next, after extracting the edge by applying the canny edge detector, the lane is detected using the Hough transform. However, if the Hough transform is applied to the image in a diagram, a problem arises in which one line is recognized as multiple lines due to the thickness of the line. In order to address this problem, line thinning [27] has been employed. Line thinning indicates converting a binary image with a thickness into an image with a thickness of 1 pixel. OpenCV implements two types of Hough line transform. First, a function detects straight lines by performing the Hough transform on all pixels in an image. Second, a function detects a line segment by performing a probabilistic Hough transform on some pixels instead of all pixels.
Recently, active research has been underway on lane detection in video clips using deep learning [28]. Point instance network (PINet) [29] is a representative example of deep learning-based lane detection technology. In PINet, the existence of lanes in each receptive field and offset are estimated from the images, and training on the lane classification is performed so that lanes on the same line have similar features. The datasets used for training lane detection are TuSimple [30] and CULane [31].
The main components of a P&ID include symbols, the connection between the symbols represented by a line, and the attributes assigned to the symbols and the lines through texts or signs [32]. Here, symbols and lines have engineering meanings for the relevant applications. To date, several studies [33,34,35] have reported the recognition of various types of diagrams, such as electrical diagrams, engineering diagrams, logic diagrams, and piping and instrumentation diagrams (P&ID). With recent developments in deep learning algorithms, there has been active research on the application of CNN-based deep learning methods in the process of diagram recognition [36,37,38,39,40]. In [36] recognition of a simple logic diagram with general application targets was done. In the work in [37], although P&ID was a recognition target, preprocessing of the diagrams was not considered, and the recognition of lines and tables was not investigated. In [38], a method for recognizing symbols, lines, and texts included in P&IDs was proposed. However, for line recognition, the target was limited to continuous lines. In [39], R-CNN was employed to recognize symbols in P&IDs, but there was no discussion on the recognition of texts or lines. In [40], a method for the recognition of various types of symbols and texts was presented for high-density P&IDs. Similar studies related to line recognition in P&ID include [25,38]. However, in both studies, only continuous lines in vertical and horizontal directions were recognized by performing pixel processing-based line recognition. Accordingly, the diagonal continuous line, and types of lines other than continuous lines could not be recognized. In addition, the flow arrow could not be processed.

3. Method of Recognizing Line Objects

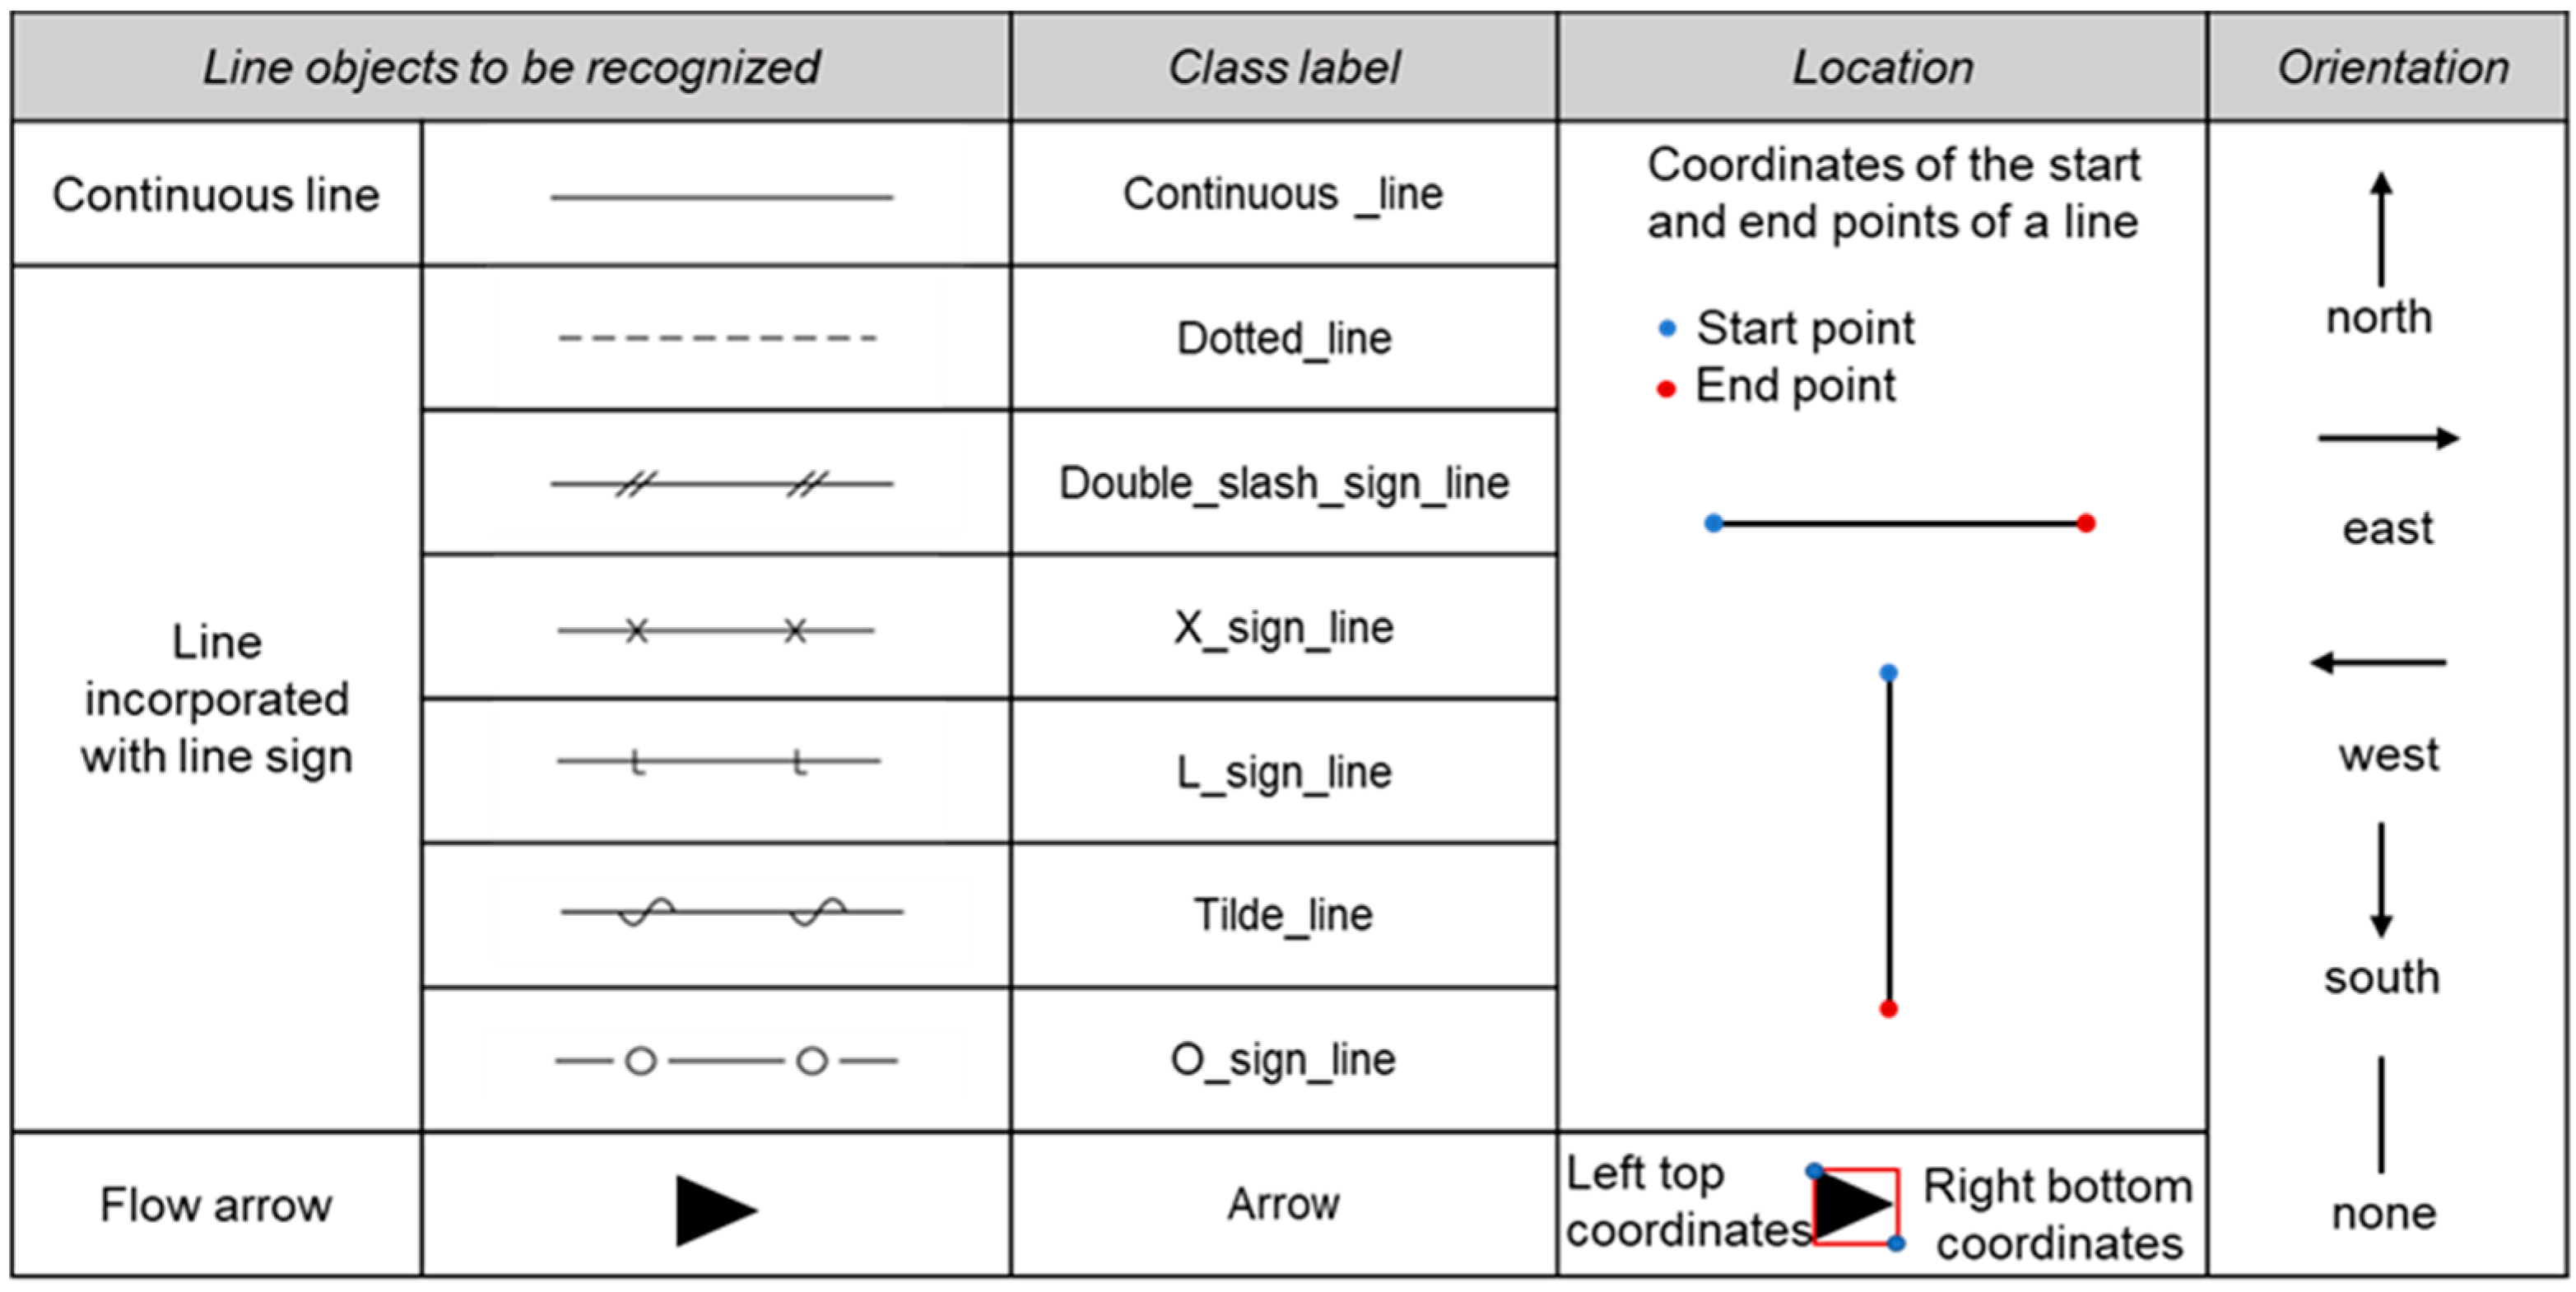
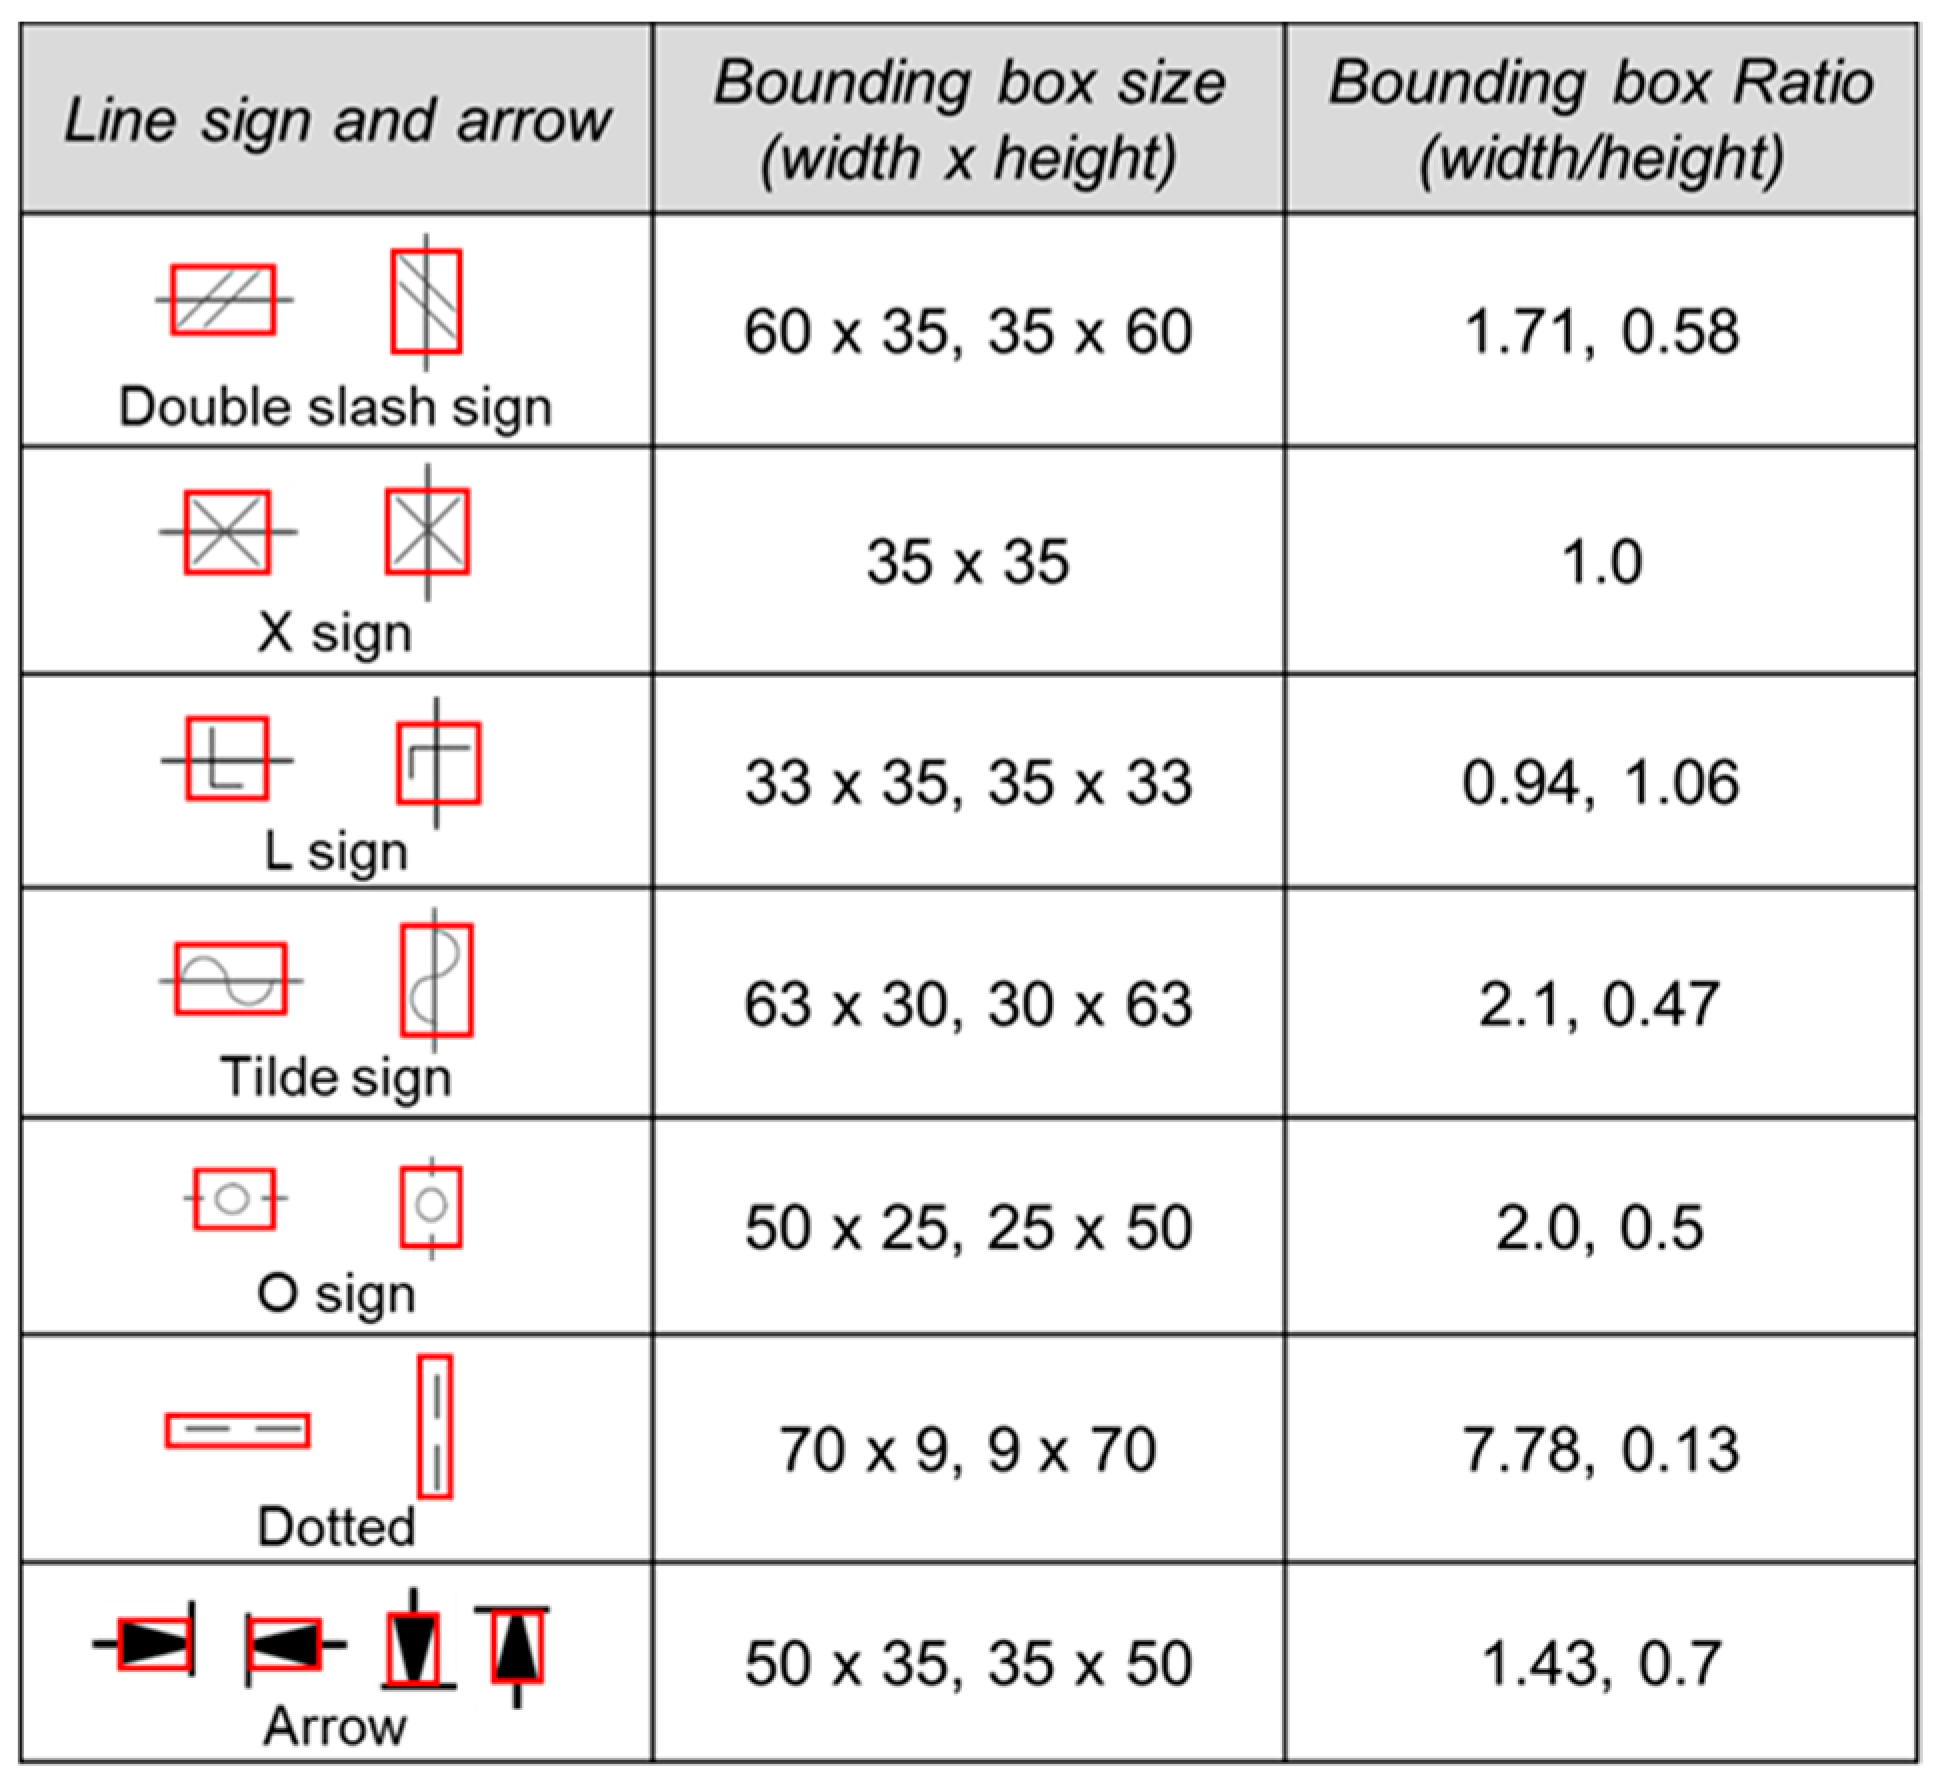
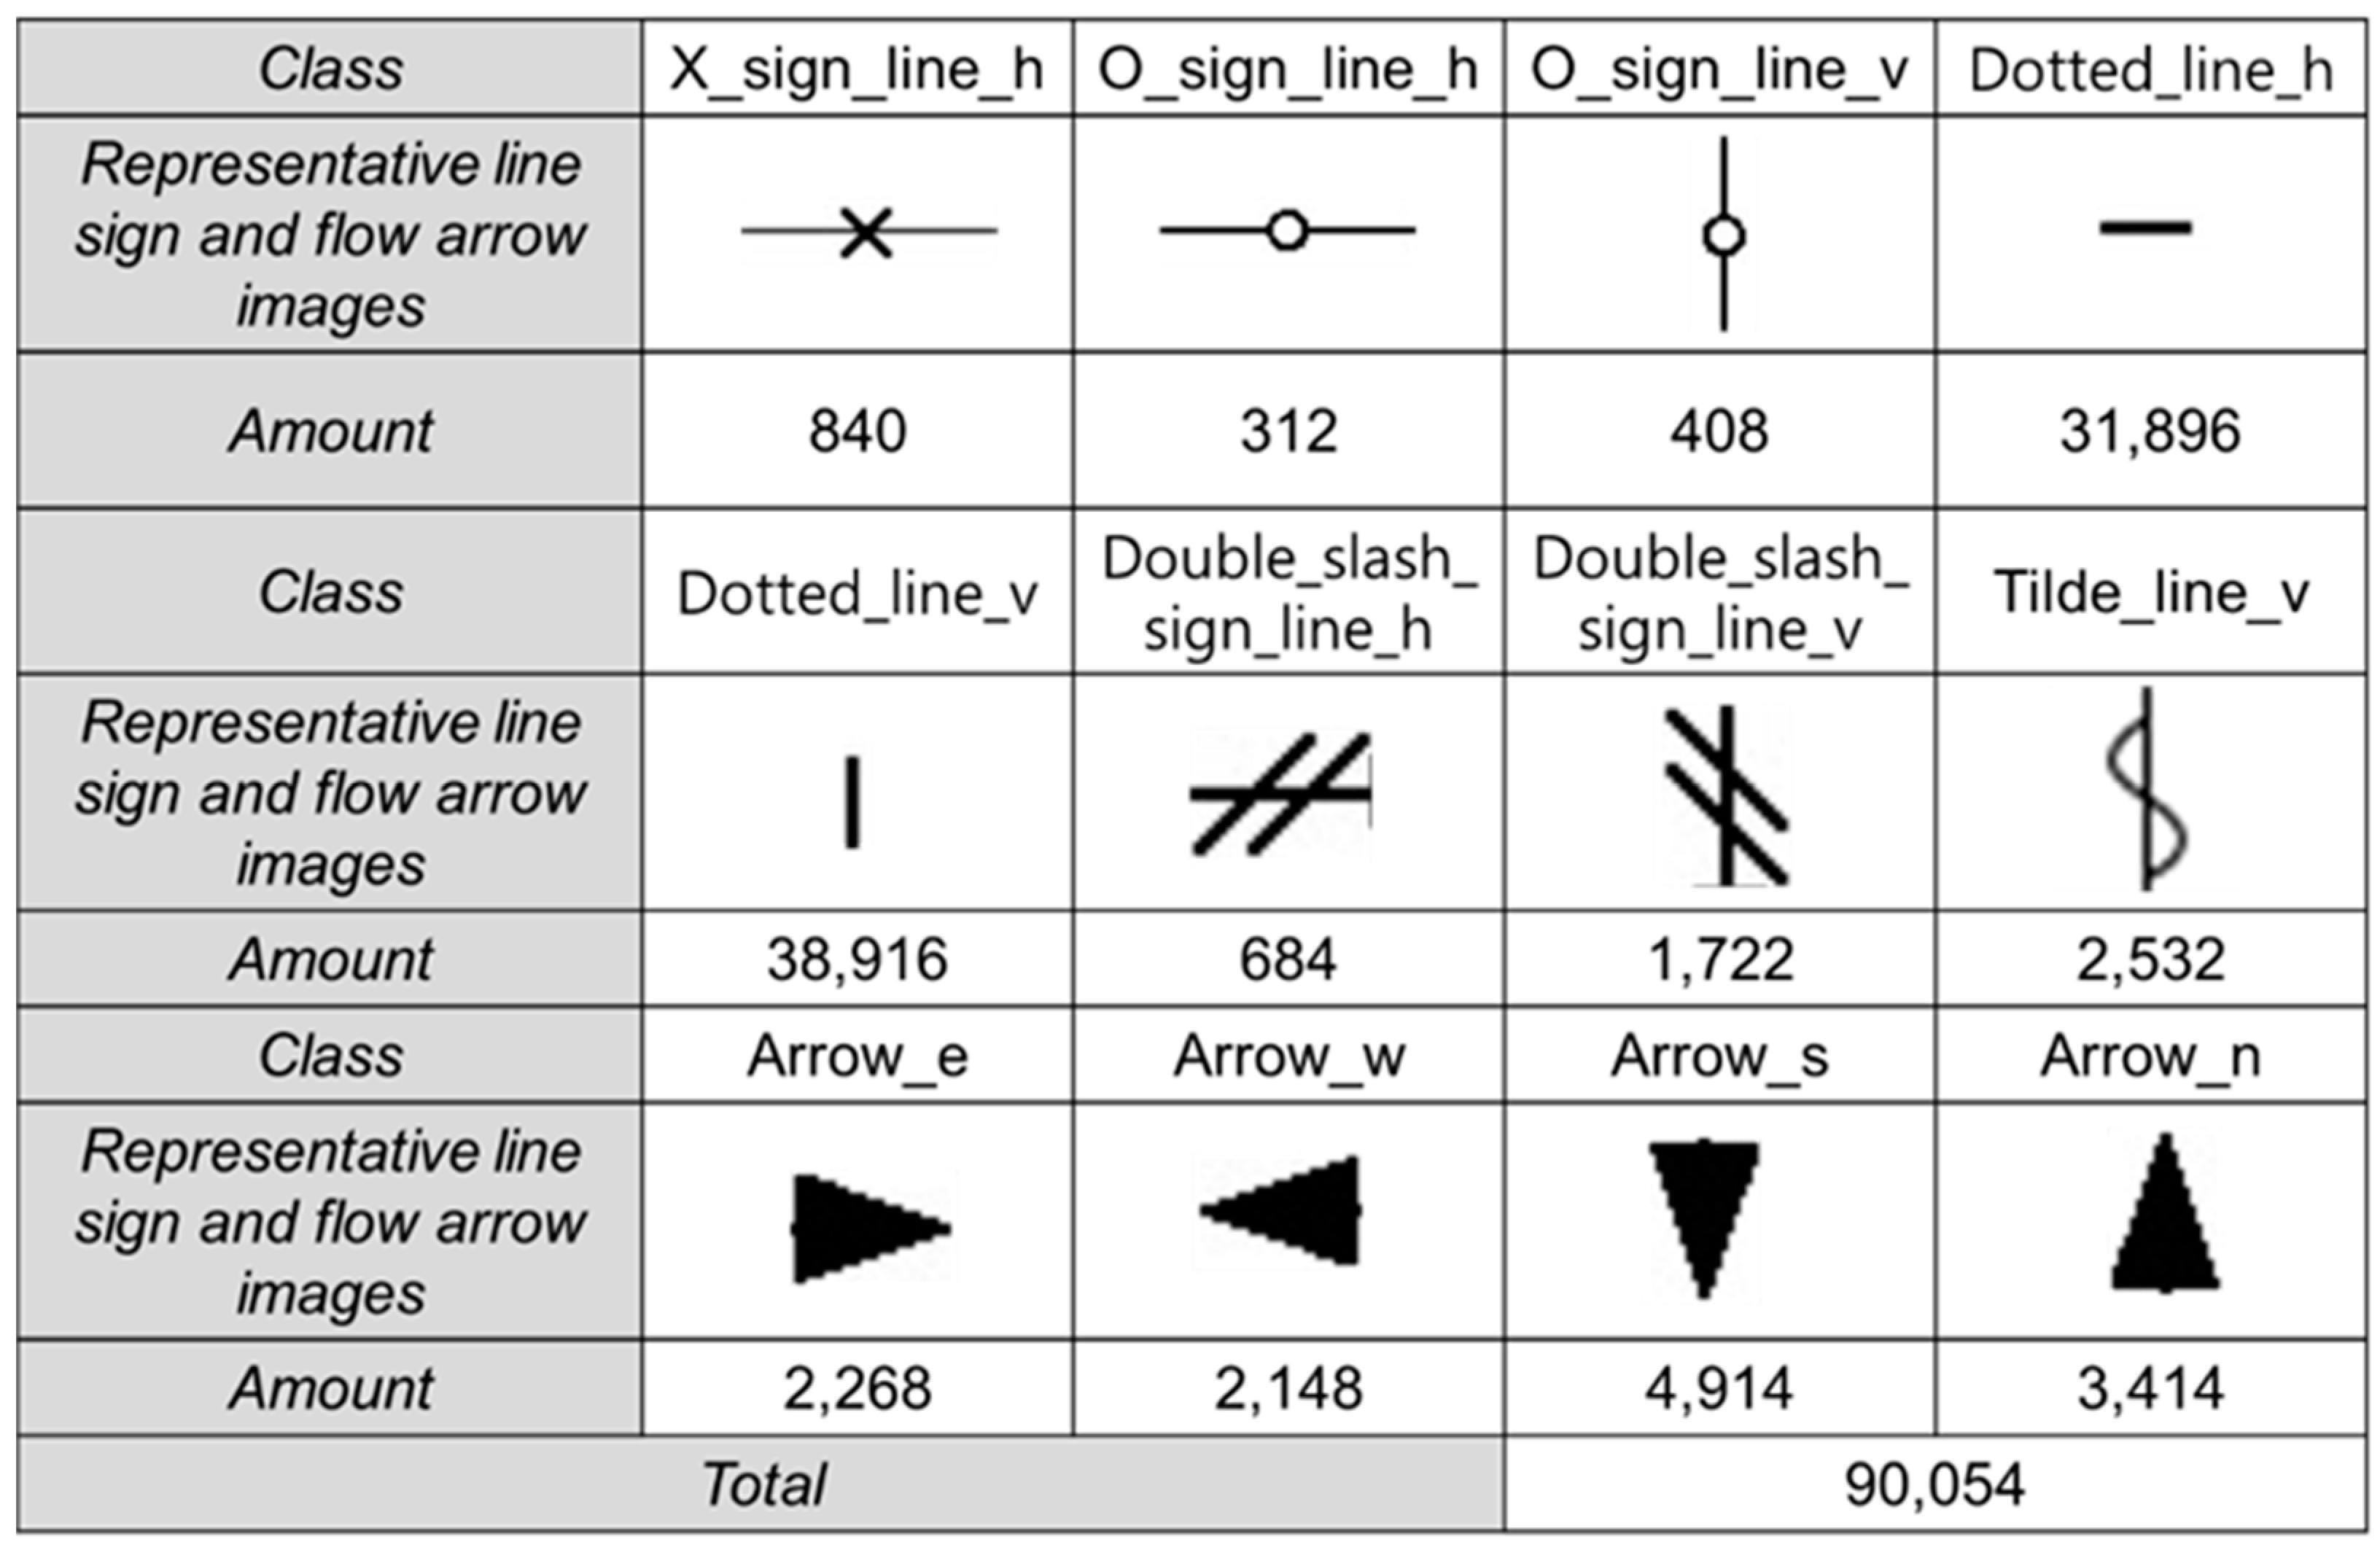
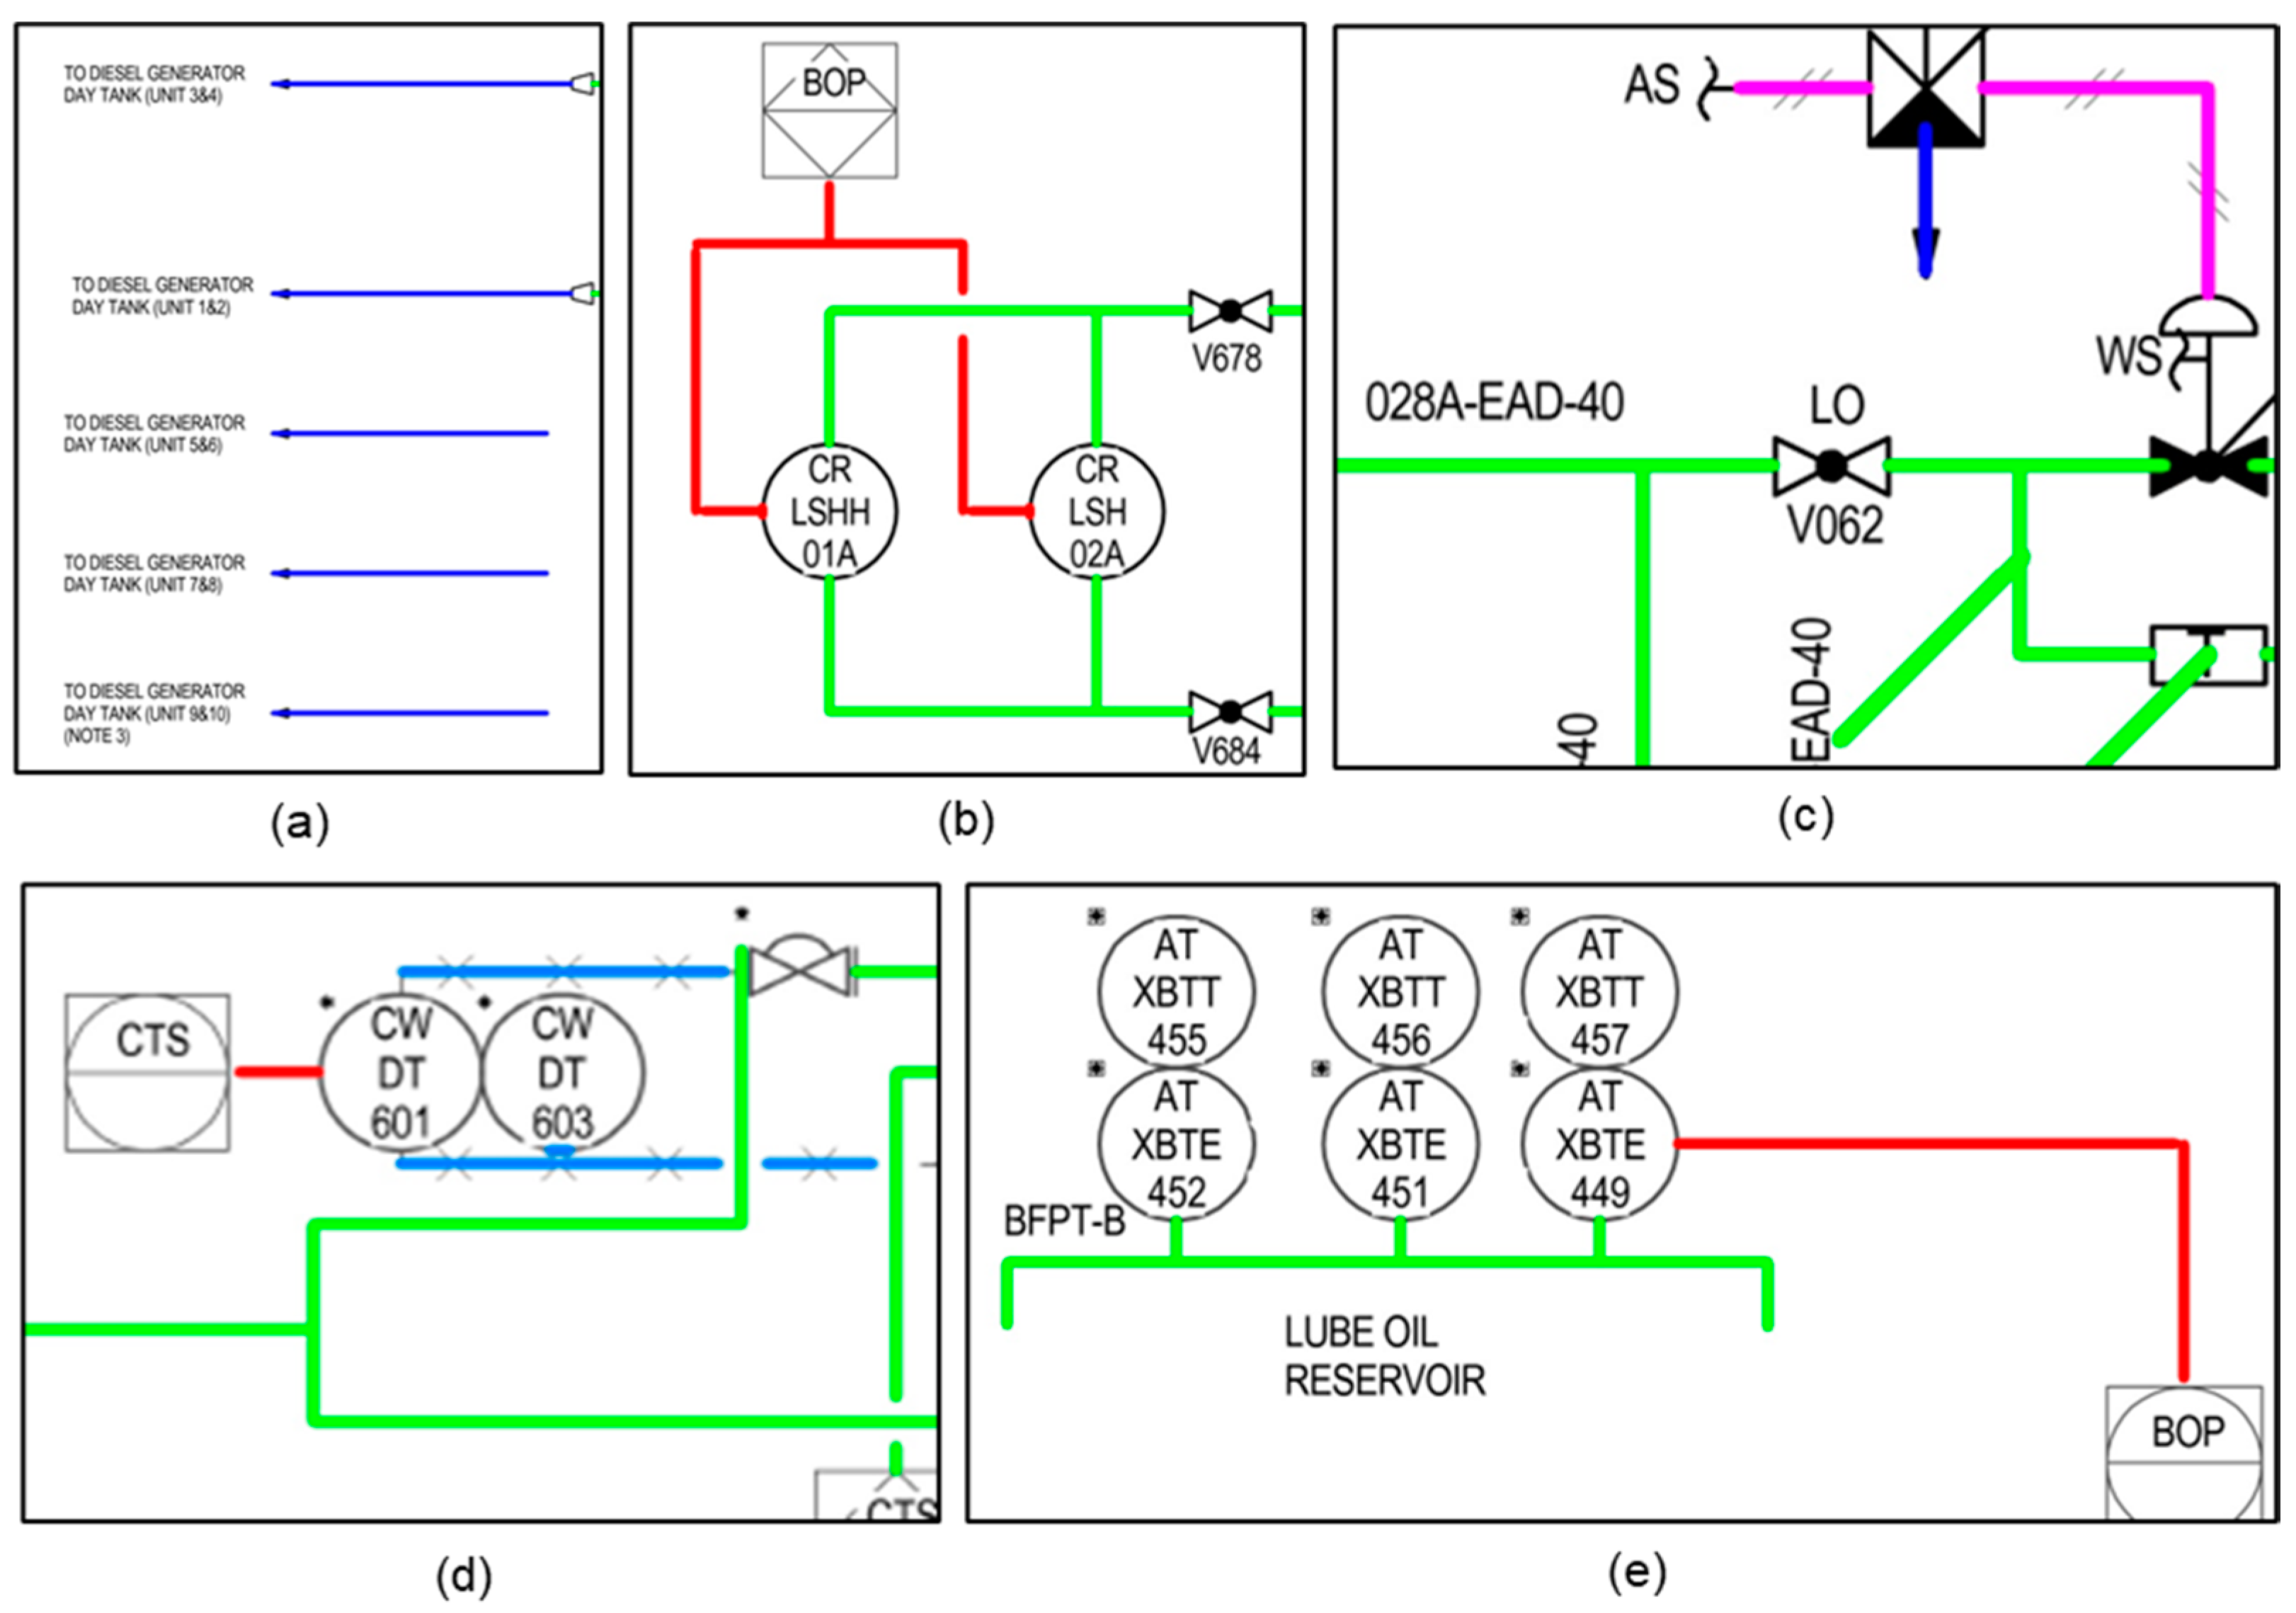
3.1. Line Objects to Be Recognized in P&ID

The type of line objects to be recognized in P&IDs are a continuous line, a line incorporated with a line sign, and a flow arrow, as shown in Figure 1. A continuous line usually represents piping in P&IDs. The lines representing piping serve as a link between the flow of a fluid and the process in the P&ID. In addition to the continuous line, a line incorporated with a line sign typically represents a signal line. The signal lines transmit electrical, pneumatic, or data signals. Finally, the flow arrows serve to indicate the flow direction of a fluid in the direction of the arrow.
Information identified through the recognition of line objects includes class, location, and flow arrow. The class represents the classification of line type. The location is the coordinates of the start point and the end point of the line object. In representing the location, a start point is at the left side in the case of a horizontal line and at the top in the case of a vertical line. Flow arrows identify the directions, and with reference to the diagram, they are expressed in four orientations: east, west, south, and north.

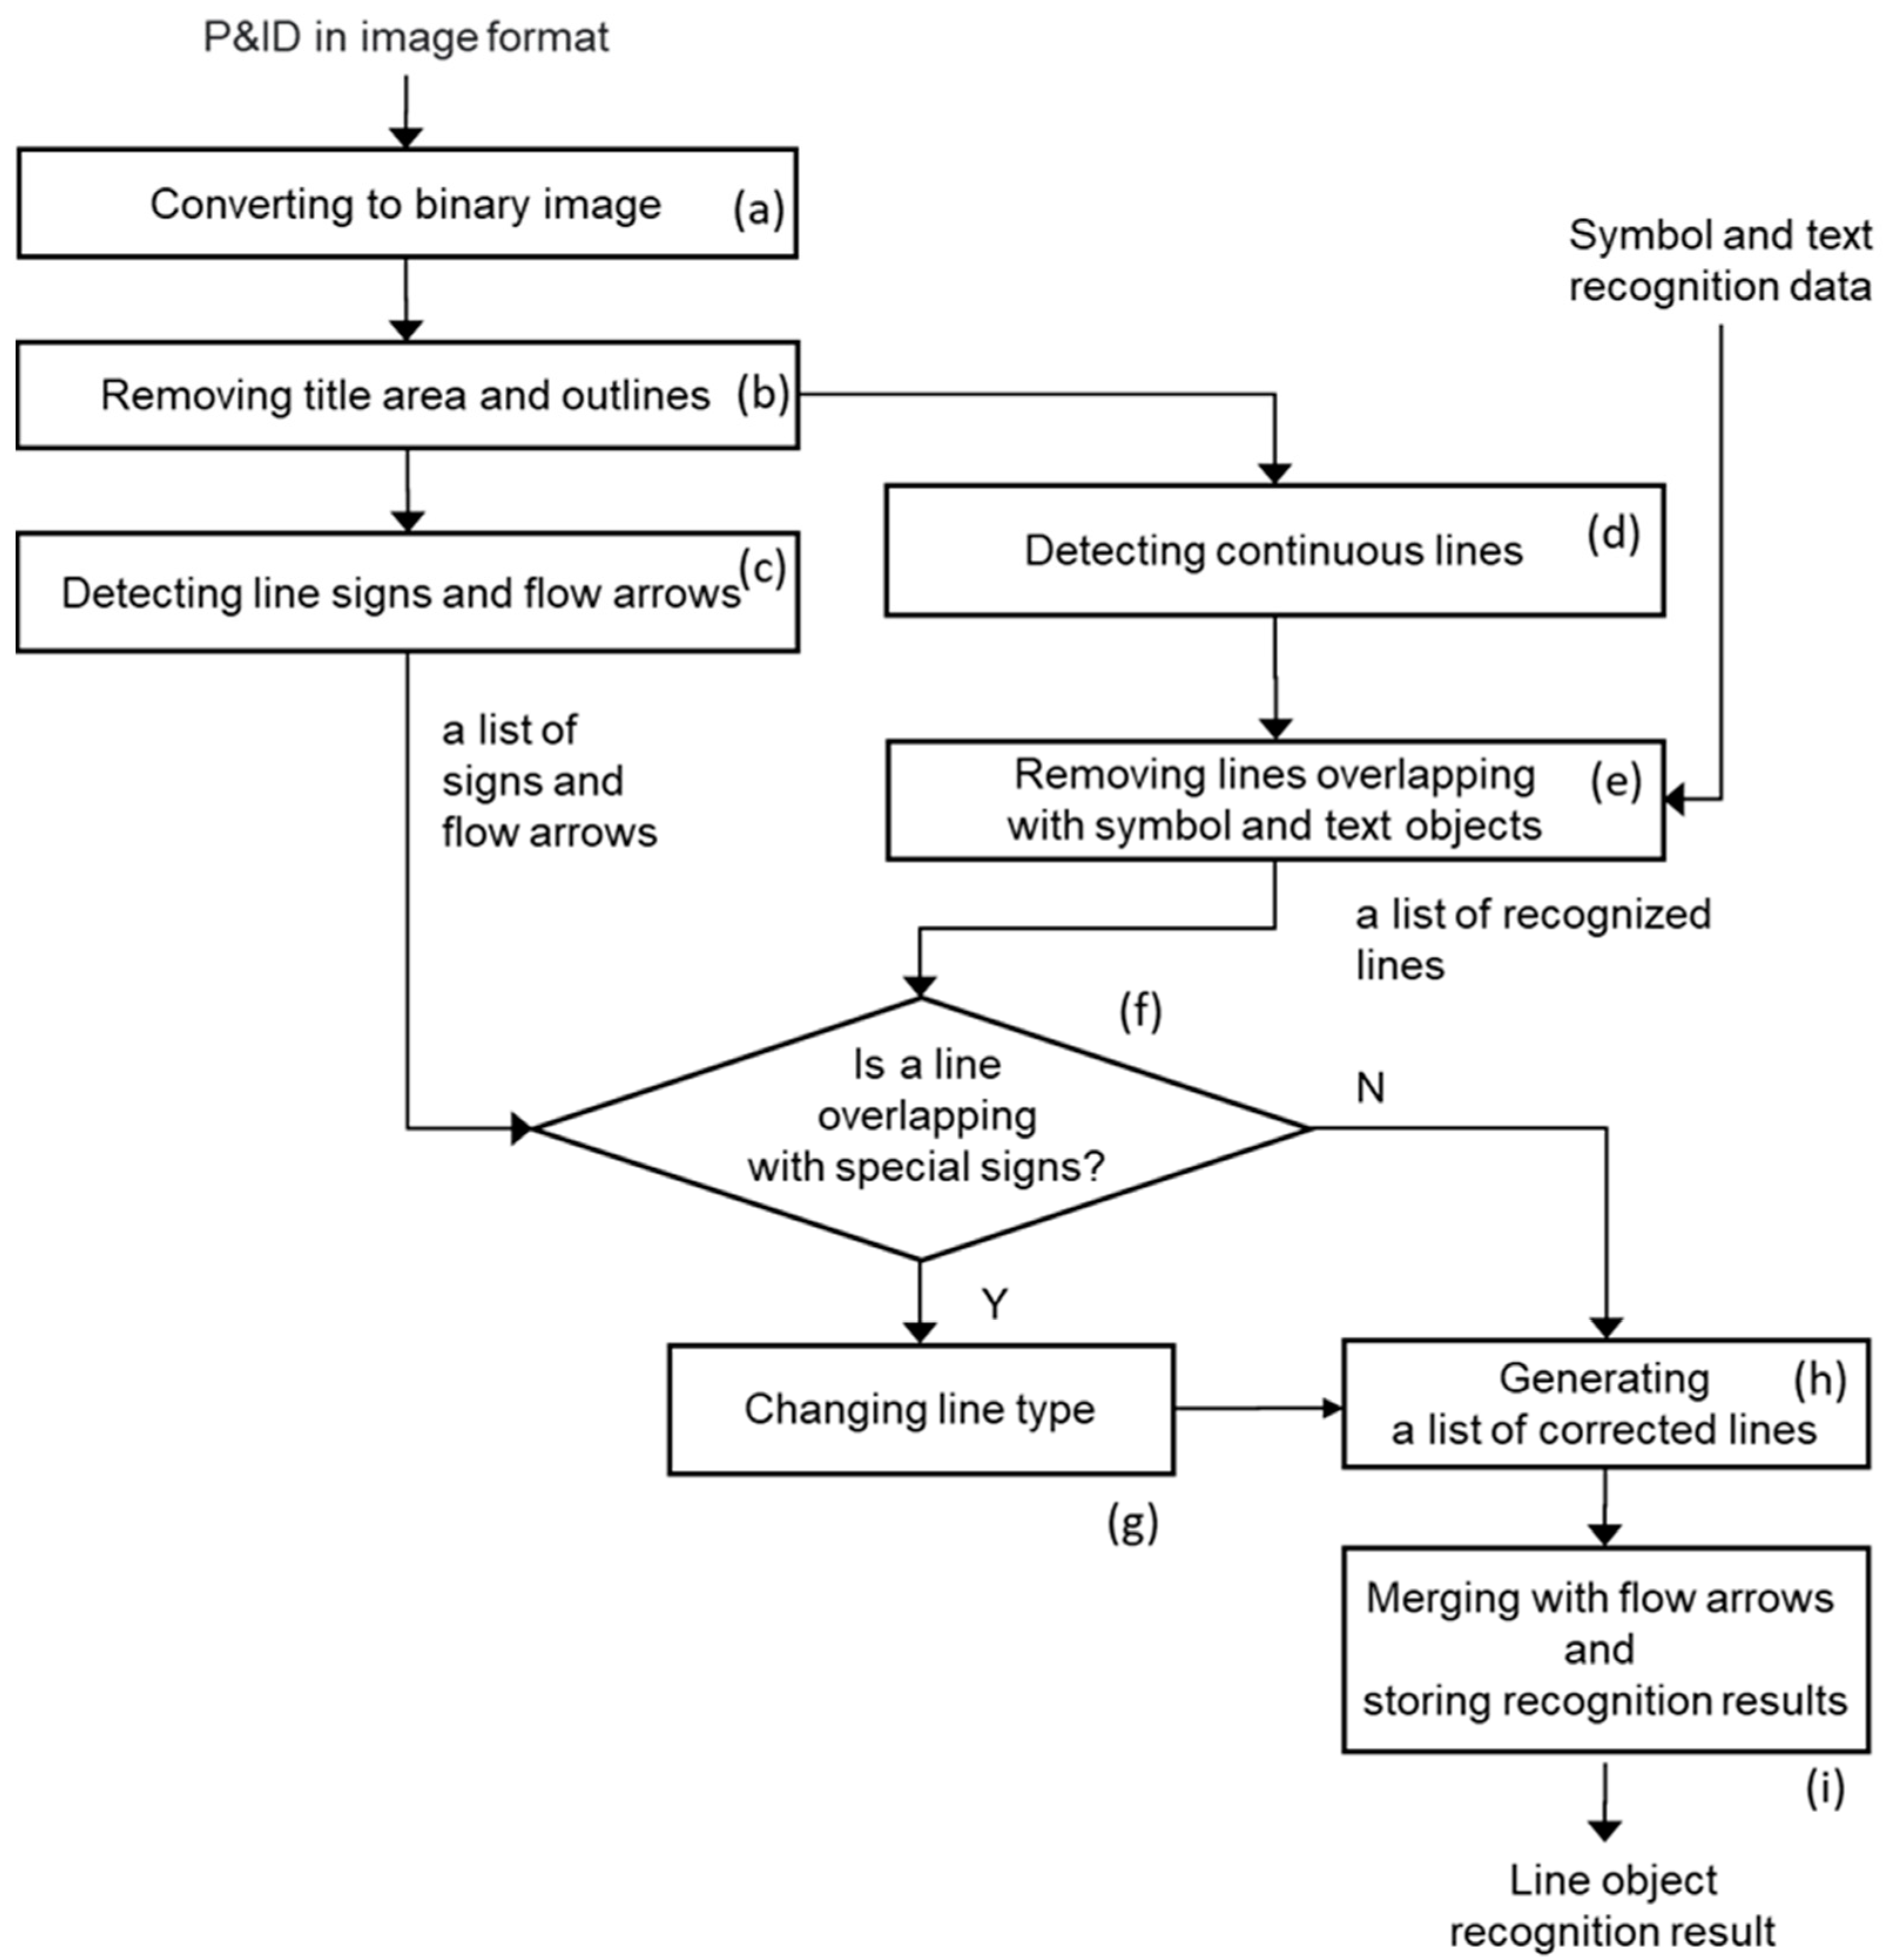
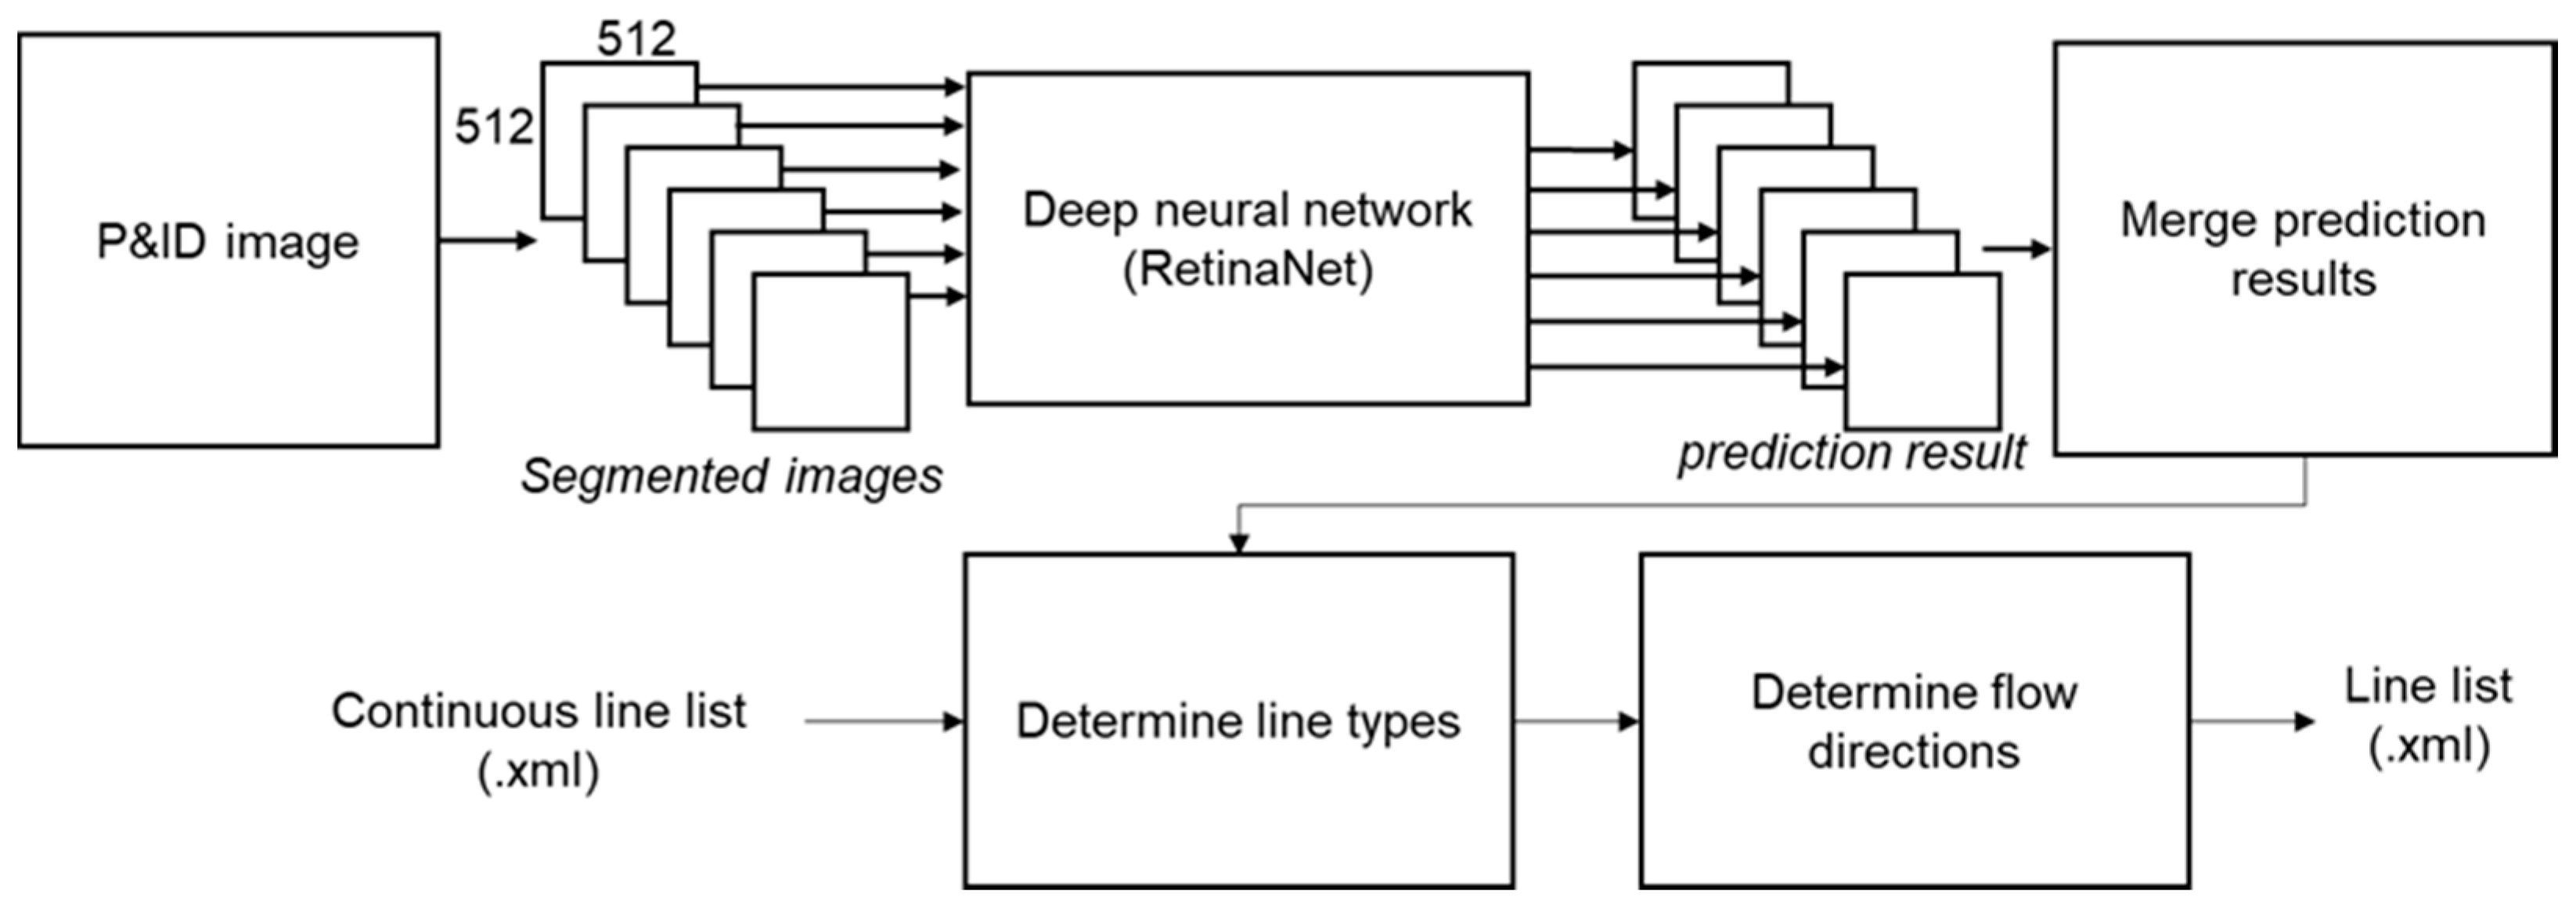
3.2. Method of Recognizing Line Objects

Figure 2b shows the result of recognized continuous lines from the image format P&ID (Figure 2a) when pixel processing-based method adopted in [35,38] are applied. As shown in Figure 2b, the objects that only correspond to continuous lines are correctly recognized. However, in other types of objects, occurred problems are shown as error case 1, 2, and 3 of Figure 2. Error case 1 in Figure 2 shows a situation in which a line incorporated with a symbol or text is recognized as a continuous line. Error case 2 in Figure 2 illustrates a problem when the line type was not recognized to fit the line sign embedded in the continuous line. The error case 3 in Figure 2 shows a problem that the information of the flow arrow detection is not merged with the line object.
A way to solve these problems is to develop a method for robustly recognizing continuous lines and determining the line type after detecting line signals and flow arrow, or to develop a new method for directly recognizing different types of lines. Image processing techniques including pixel processing show high performance in recognizing continuous lines. However, it is not efficient for detecting line signs and flow arrows. On the other hand, deep artificial neural networks [21,22,23,24] show high performance in detecting objects of a set of anchor sizes and ratios. Therefore, it is suitable for detecting line signs and flow arrows. However, it is difficult to detect a continuous line in which a line sign is embedded and a change in length is very large. Considering this, it is feasible and effective to apply the first method.
Following the first approach to the problems, we propose a method for the recognition of multiple types of lines included in P&IDs by utilizing object detection techniques based on deep neural networks and image processing, which is a methodology clearly differentiated from previous related works. The following techniques are applied for each error case. In error case 1 of Figure 2, after detecting the continuous lines first, the lines overlapping with the symbol and text objects are removed using the symbol and text recognition data. In error case 2 in Figure 2, the line signs and flow arrows are detected using a deep neural network that shows a high level of performance in object detection from image. Then, the continuous lines overlapping with the detected line signs are identified, and the line types are changed according to the detected line signs. In error case 3 in Figure 2, after the recognition of line objects, the detected flow arrows are merged with the overlapping line objects.
Figure 3 shows the procedure of line object recognition of P&ID in consideration of the methods described above. The recognition process consists of a preprocessing step (Figure 3a,b), a line detection step (Figure 3c–e), and a post-processing step (Figure 3f–i). When the image-format P&ID is input, it is first converted into a binary image (Figure 3a). Then, by identifying the outer border and title box of P&ID and removing them, a diagram composed of high-level objects is extracted (Figure 3b). The line signs and flow arrows embedded in the line object are detected using a deep neural network (Figure 3c). At the same time, continuous lines are detected by applying image processing techniques, including line thinning [27], pixel processing, Hough transform, and bitwise AND(&) operation (Figure 3d). At this time, among the recognized continuous lines, only the pure continuous lines are left by removing the continuous lines that overlap with the symbols and texts (Figure 3e). By checking whether the pure continuous lines and the recognized line signs overlap each other (Figure 3f), the type of the overlapping lines is changed to match the line signs (Figure 3g). After checking the line type changes for all continuous lines, a list of corrected lines is generated (Figure 3h). Finally, after merging the flow direction information for the lines overlapping with flow arrows, the line object recognition result is presented as an output (Figure 3i).
From the procedure of line object recognition in P&ID, the step of removing the P&ID title and outer border is described in Section 5.1, the continuous line detection in Section 5.2, detecting line signs and flow arrows to determine the type of line and merging the flow arrow recognition information in Section 5.3, and data format in which line recognition results are stored are described in Section 5.4, in more detail. In addition, the constructed dataset required for training a deep neural network will be described in detail in Section 4.

4. Training Dataset Construction for Line Recognition

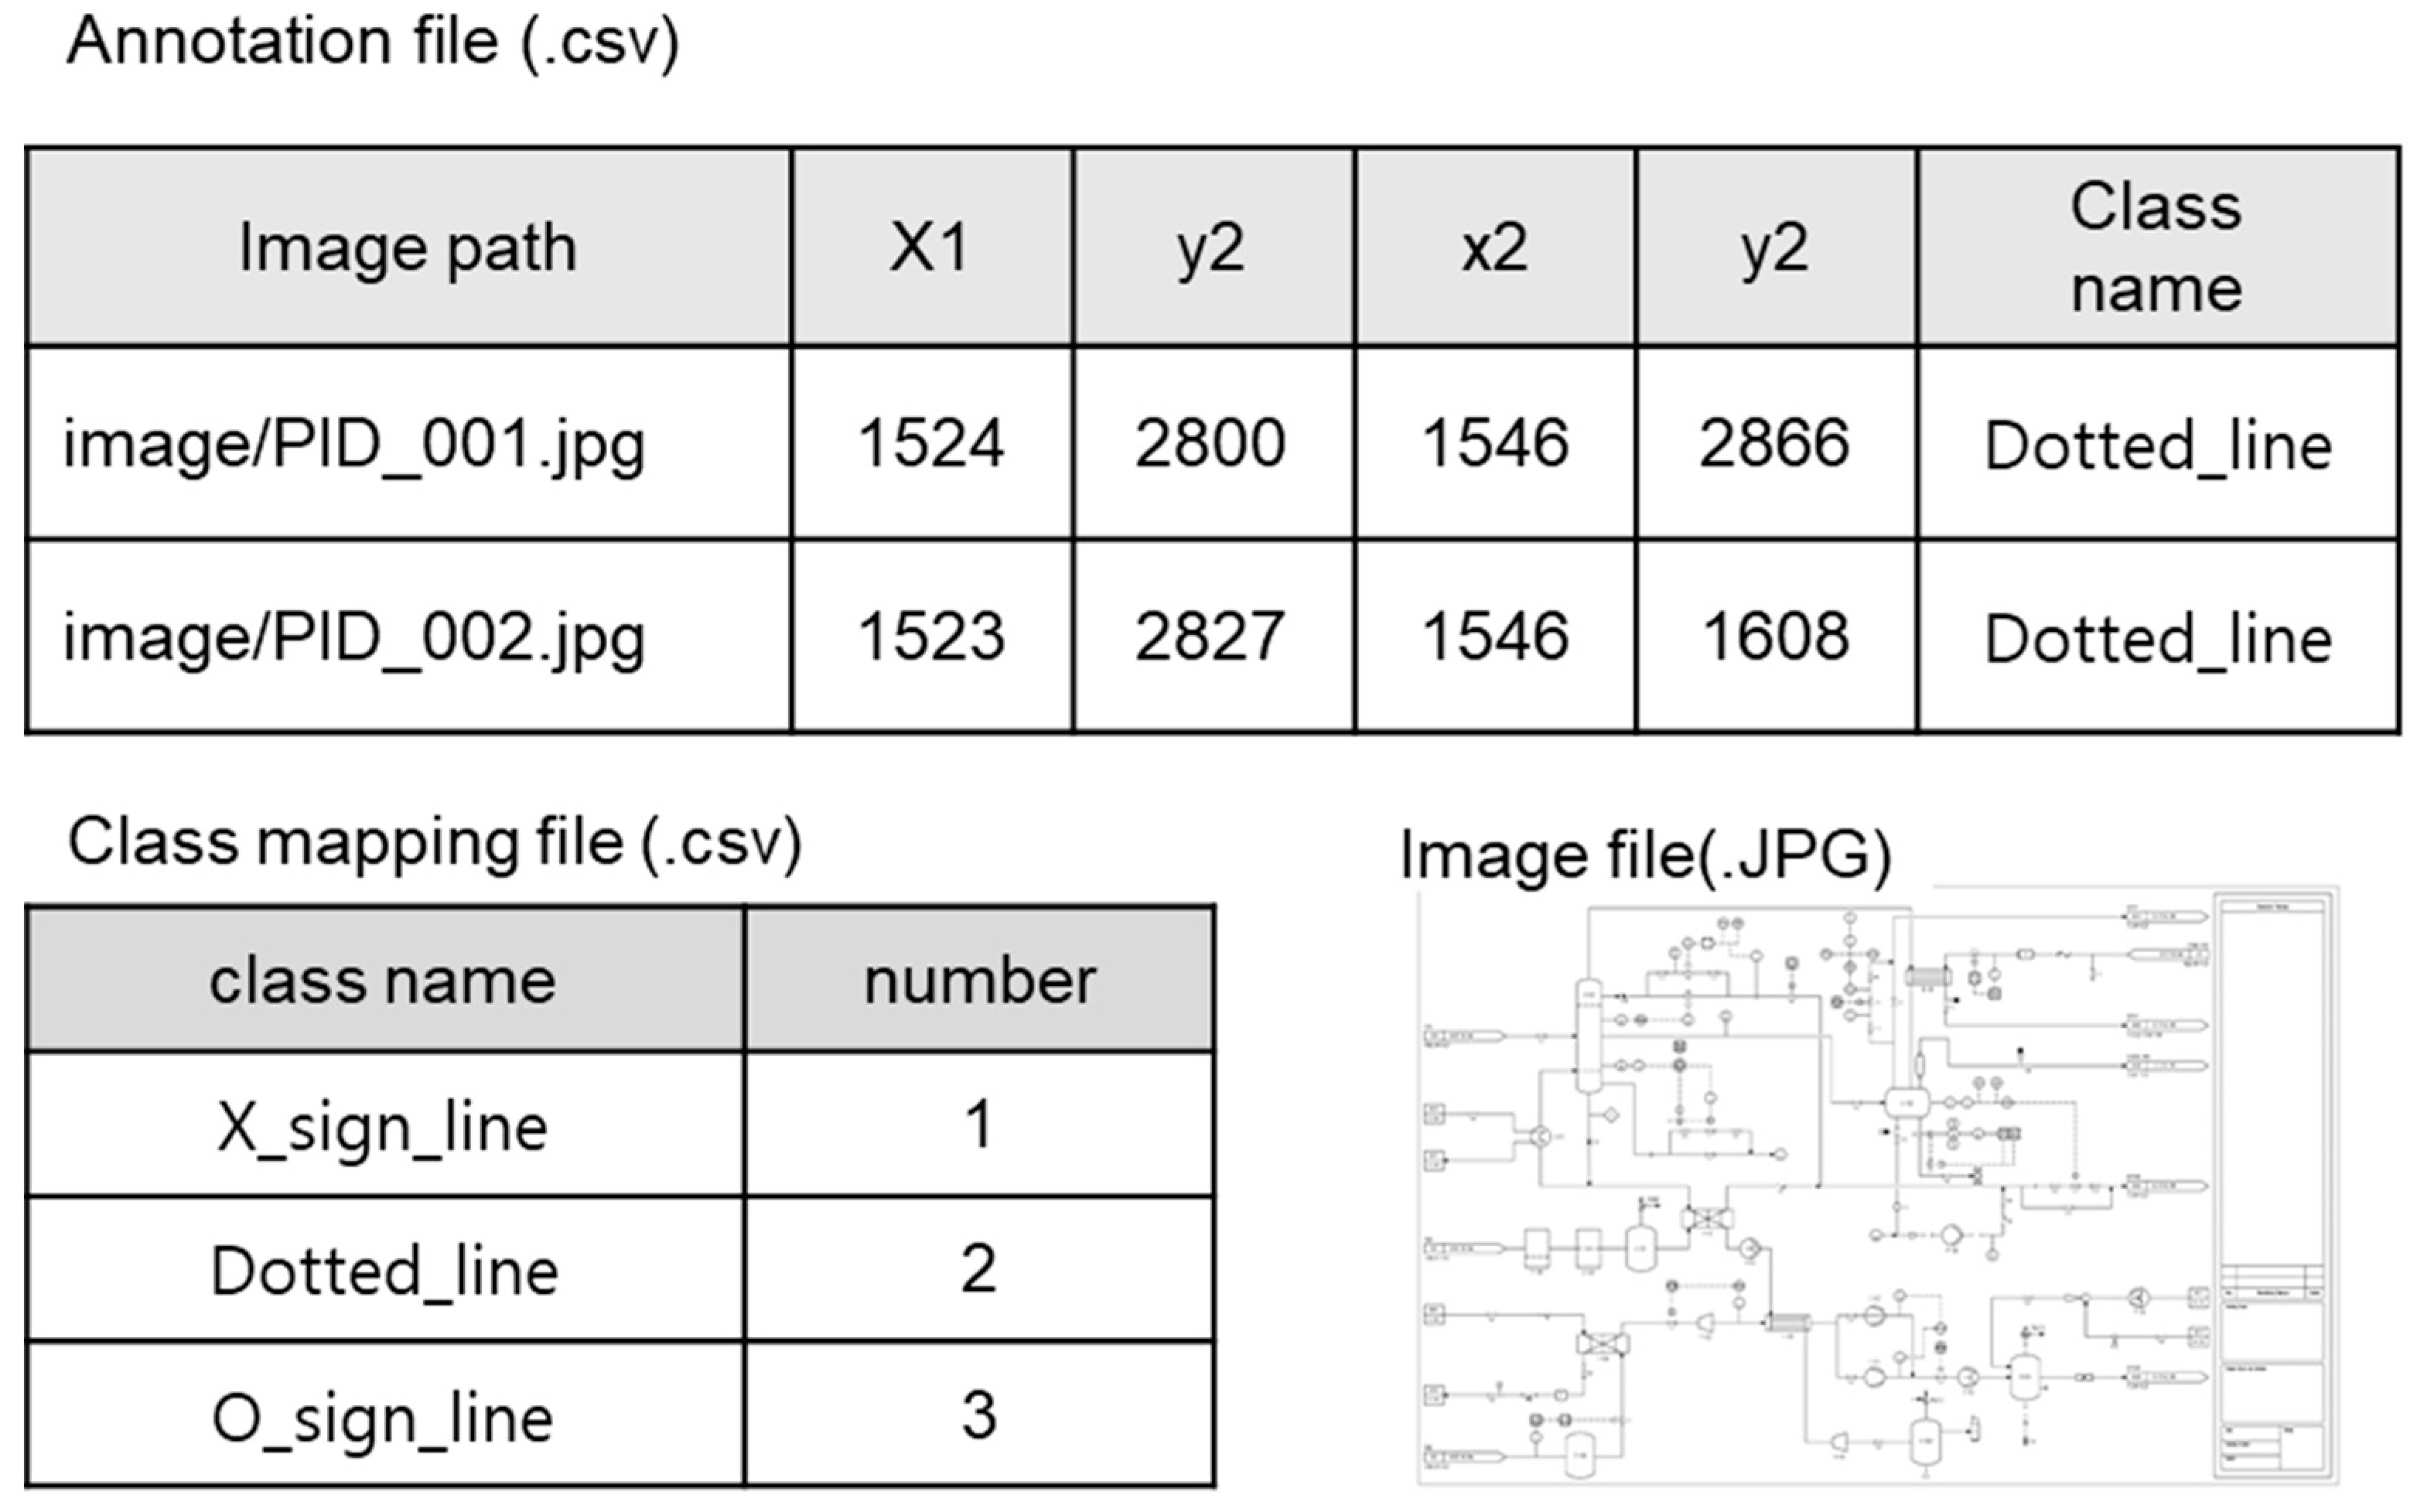
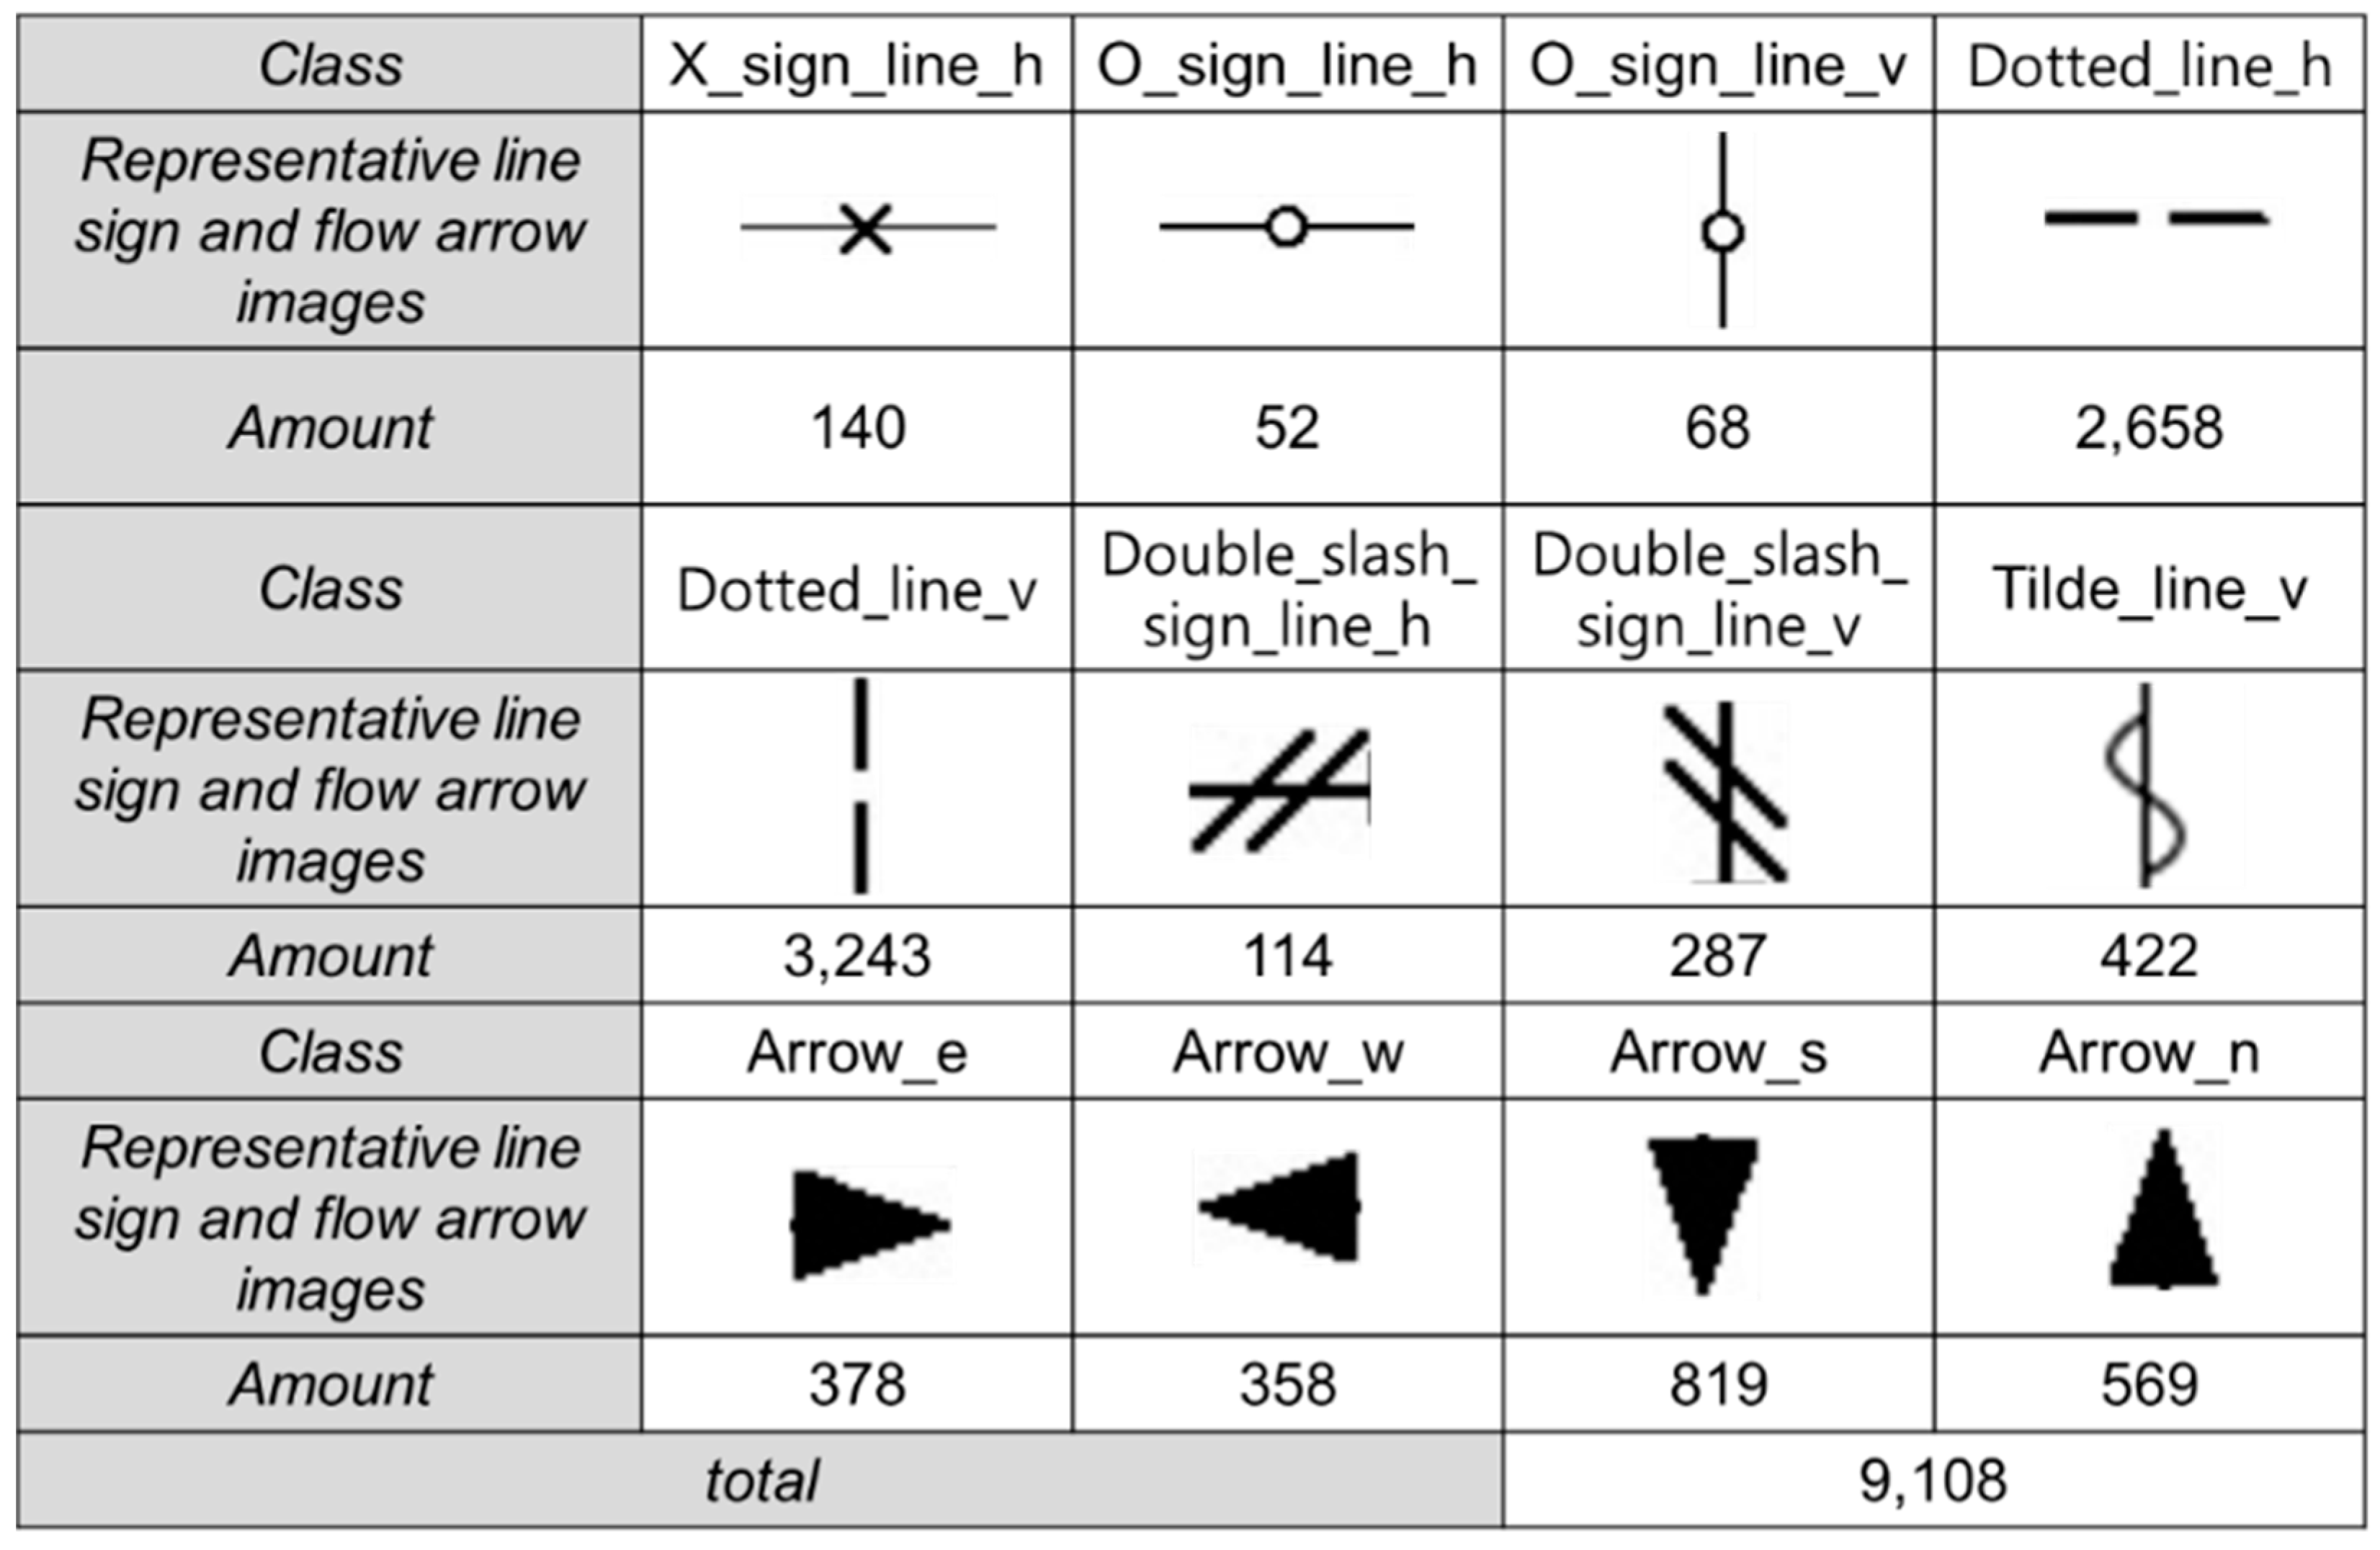
4.1. Preparation of Initial Training Dataset

For the training of a deep neural network that detects line signs and flow arrows in P&ID, training data need to be prepared, as shown in Figure 4. For training data, annotation files and class mapping data are required, along with image files. In the annotation file, the image path, class name, and region of the object are stored. In the class mapping file, the results of mapping the class name to be detected to a number are stored.
When creating annotation files for line signs and flow arrows, bounding boxes corresponding to the area of the object are created. In the process of bounding box creation, for flow arrows, the size of the bounding box can be set to a constant value. However, in the case of line objects with line signs such as ‘--’, ‘x’, ‘L’ in Figure 1, it is necessary to consider appropriate size of the bounding box for each line signs. At first, the bounding box of the line object, including the line sign, was divided, as shown in Figure 5. In the case of dotted lines, the bounding box was set to include two short lines. In addition, since the box ratio varies depending on the orientation of the line object (horizontal and vertical), different labels were assigned accordingly. In this case, the label with the largest difference in bounding box ratio for the horizontal and vertical orientation is the dotted sign, which has 7.78 and 0.13, respectively. In the legend used for P&ID, the symbol differs in shape and size from company to company, but line sign and flow arrow are mostly similar in shape and size. Therefore, the bounding box ratio for the line sign and flow arrow in Figure 5 can be applied to other P&IDs in addition to the P&IDs used in this study.
Using the method described above, an initial dataset consisting of 9108 data was constructed, as shown in Figure 6, from 82 sheets of remodeled P&IDs by referring to the P&IDs from a local Korean company.

4.2. Augmentation of the Training Dataset

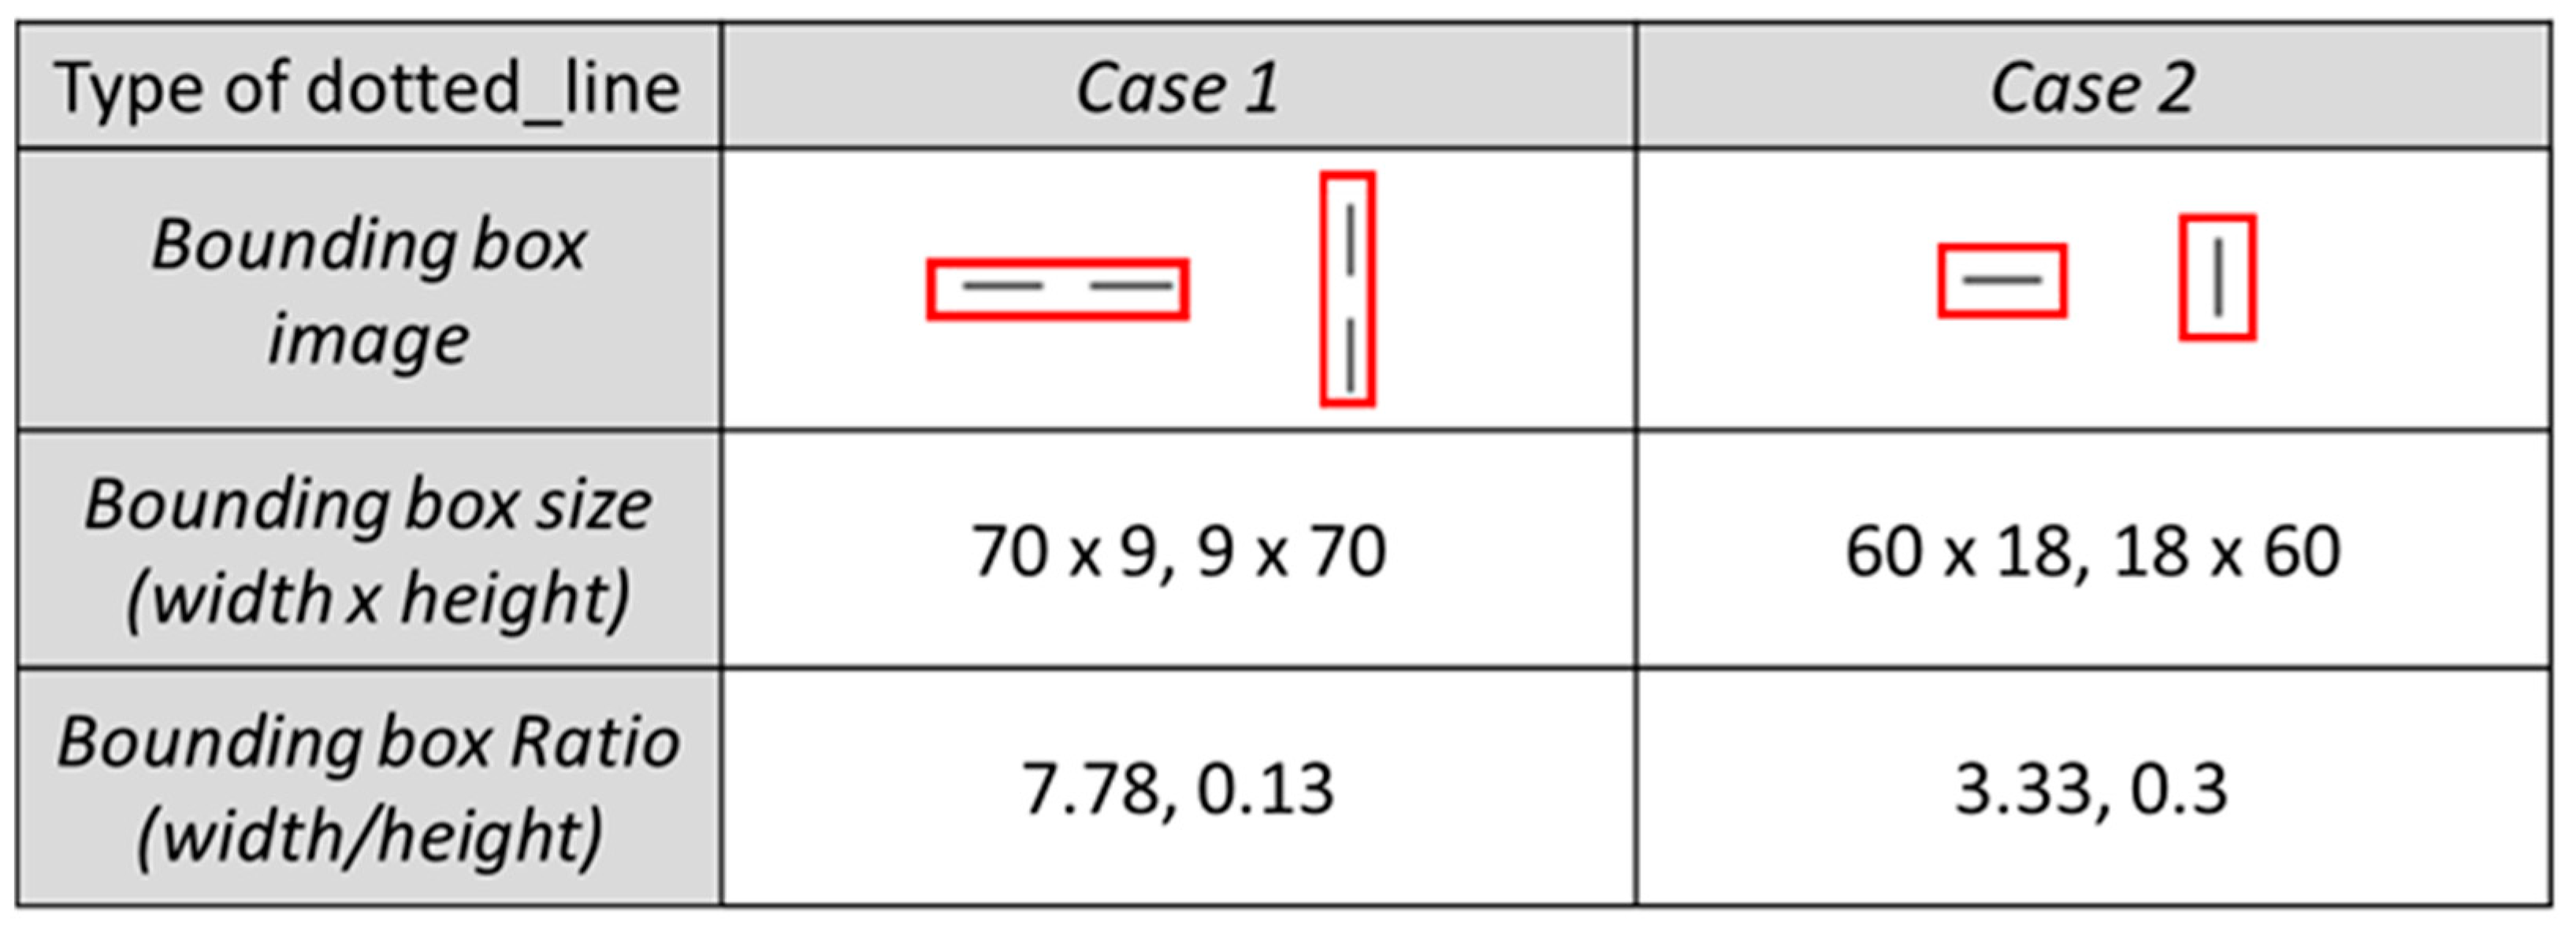
4.2.1. Change of Bounding Box Size for the Dotted Line

Pre-training was conducted with the prepared dataset (as above). RetinaNet was used in this study for the deep neural network used for object detection. The hyperparameter values of RetinaNet were set as the default values of [23] during pre-training. The epoch was set to 50, and the step was set to 10,000. After pre-training, the regression loss was 0.0381 and the classification loss was 0.05. As a result of performing a line sign detection test with the trained deep neural network, most of the line signs and flow arrows were successfully detected with high accuracy, but dotted lines showed a low level of detection performance. The reason for the low level of performance in the detection of dotted lines is that compared to the bounding box ratio of other classes, dotted_line_h and dotted_line_v had very large ratio values, so it was necessary to adjust the anchor ratios and scale values for the detection of dotted_line. As a result of running the anchor optimizer [41] on the initial training dataset in Figure 6 to find the appropriate anchor ratios and scale values, the anchor ratios of 0.25, 1.0, 4.0 and anchor scales of 0.549, 0.866, and 0.931 were obtained. However, when the training was performed according to these values, a problem occurred that 5688 training data out of the total 9108 training data were not correctly matched with the anchor.
To address this problem the size of the bounding box of the dotted line was changed. Initially, the bounding box of the dotted line was set to include two short lines, as in Case 1 of Figure 7. However, after the change, the bounding box size was set to have only one short line, as in Case 2. As a result, the dimension of the bounding box was changed to 60 × 18 and 18 × 60, and the ratio was changed to 3.33 and 0.3. As a result of applying the anchor optimizer to the training dataset with Case 2 used for the dotted lines, the number of training data that did not match the anchor was reduced to 16. In addition, because the amount of dotted line data was doubled due to the change of the bounding box size of the dotted lines, the total number of training data points was increased to 15,009.

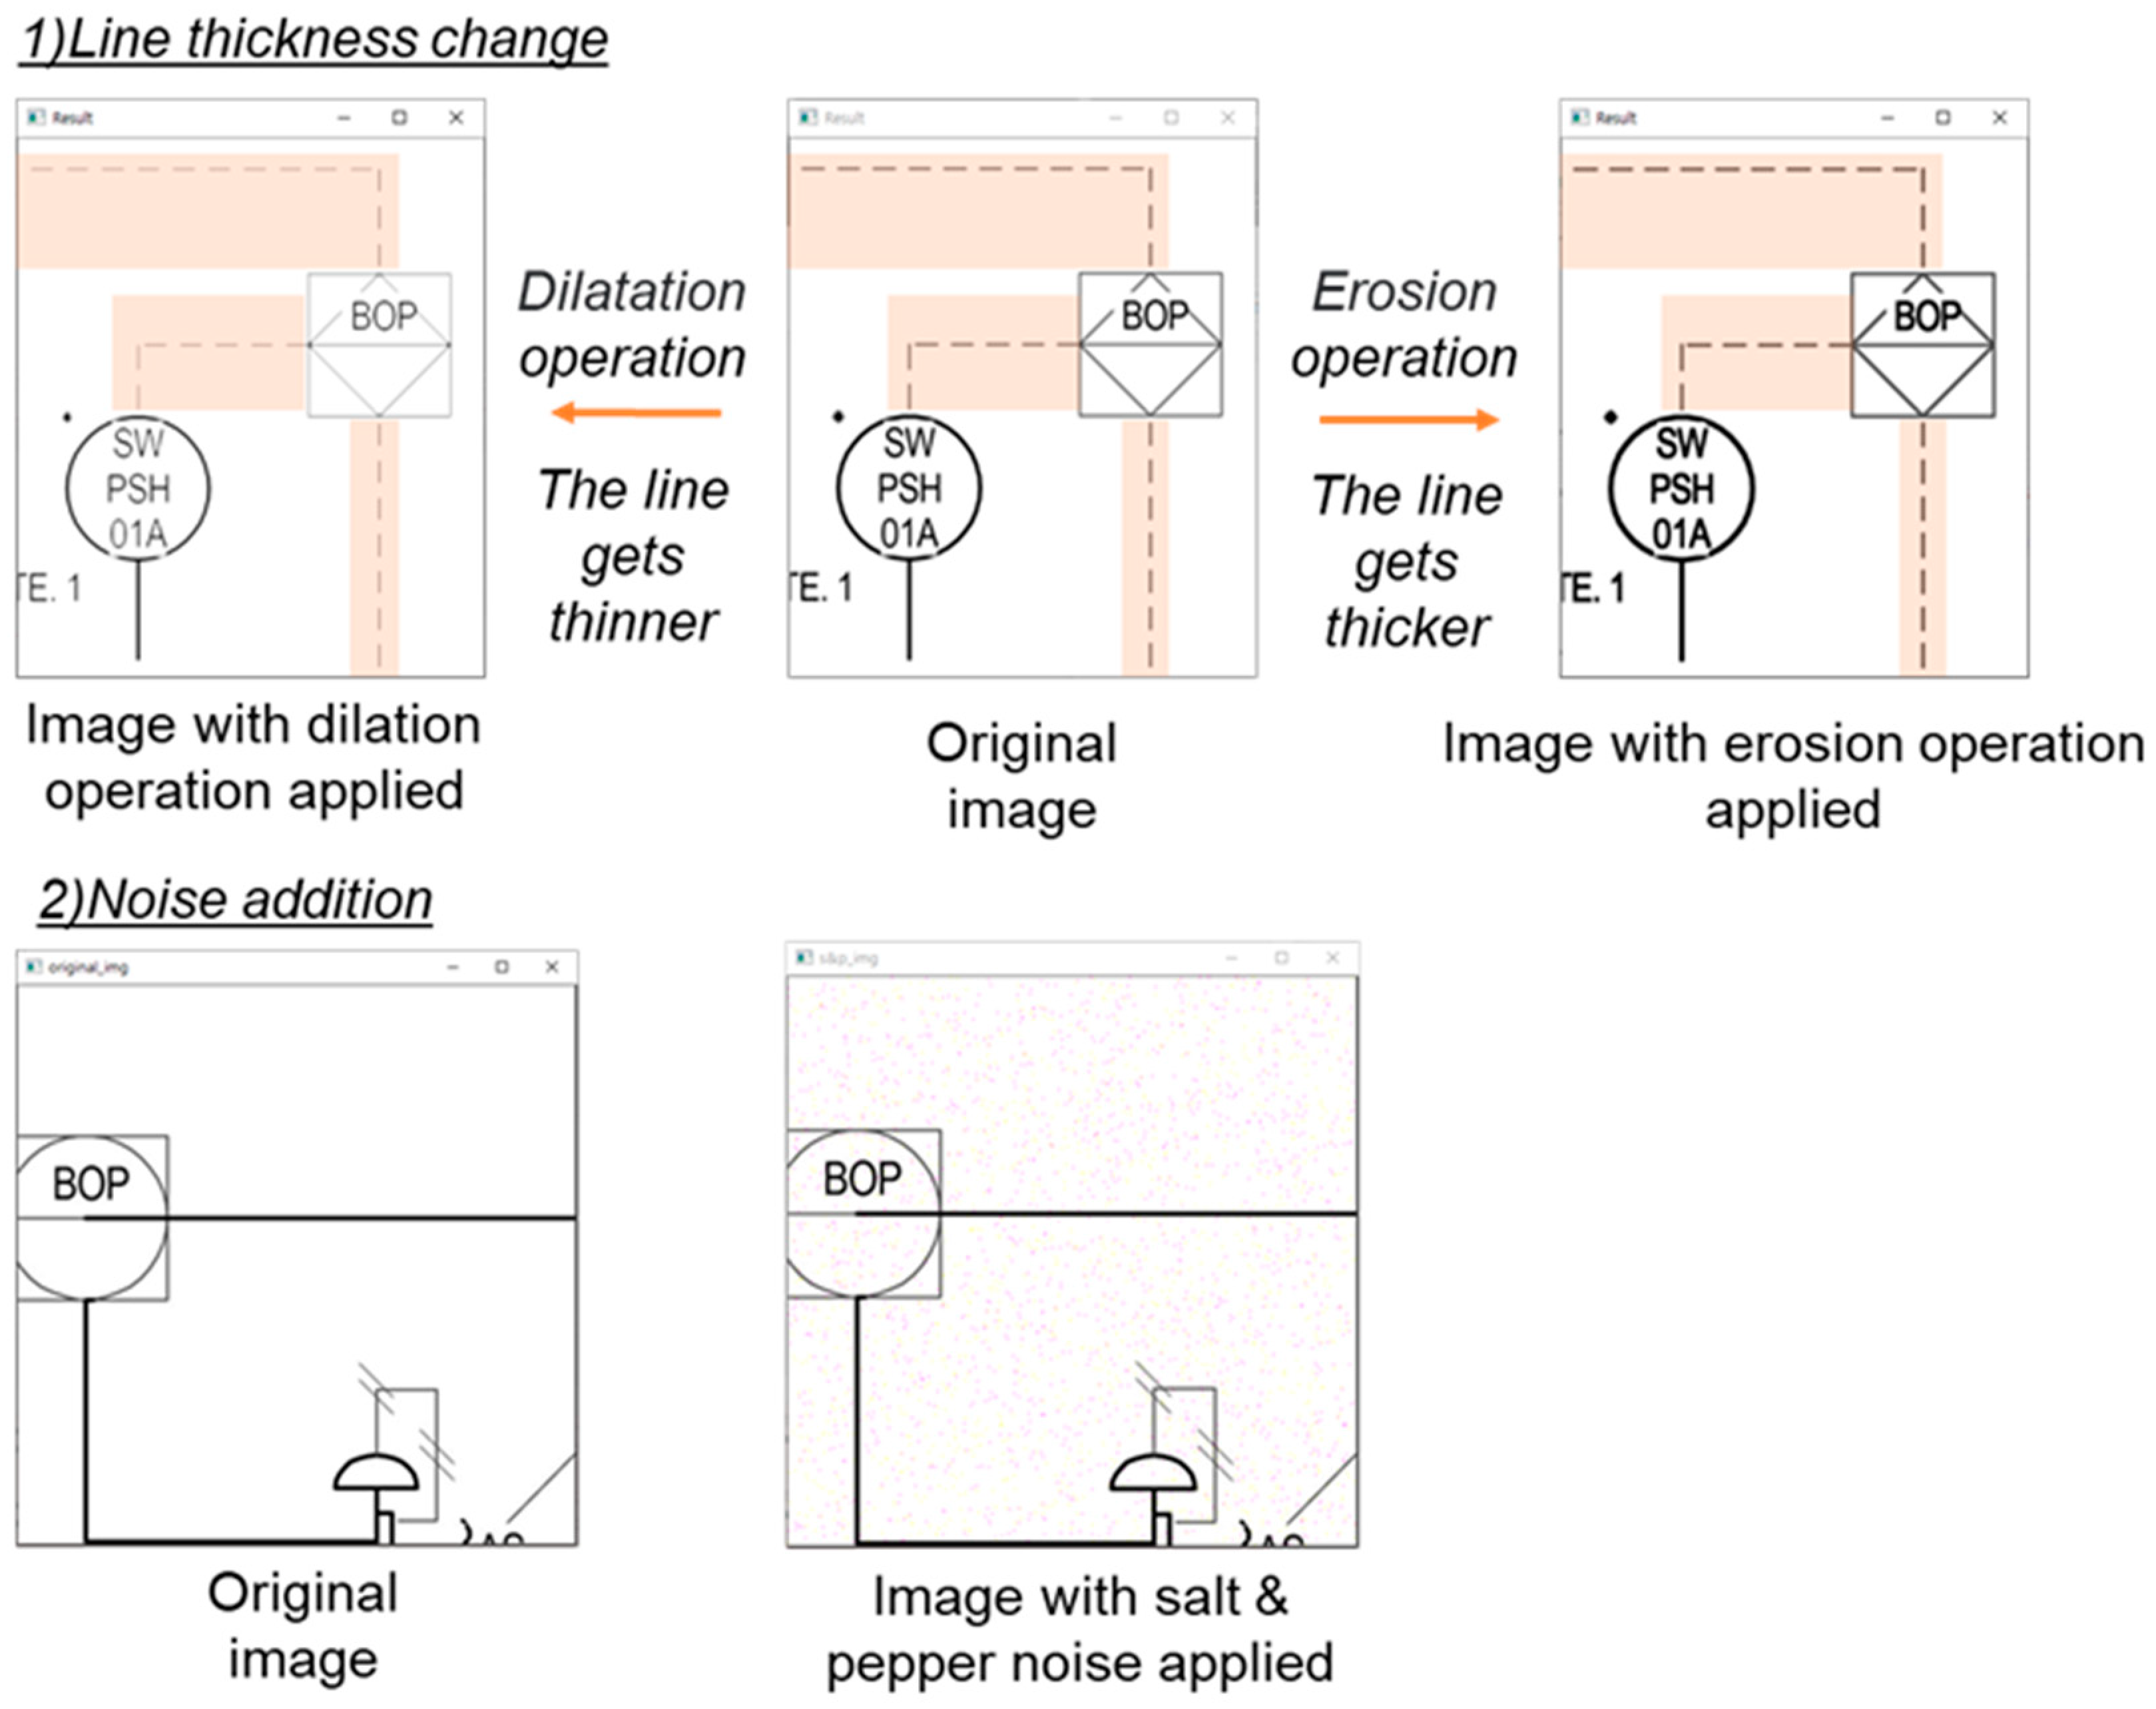
4.2.2. Data Augmentation

Performing deep neural network training with a small number of image data may lead to a problem of overfitting. Overfitting refers to a phenomenon in which an accurate prediction cannot be made for the new input data not used for training due to overtraining with the training data. To resolve this overfitting problem, the amount of training data was increased using the image augmentation technique, as shown in Figure 8.
As the first augmentation method, the thickness of the lines in the diagram was adjusted using morphology operation in order to address the problem of detection failure when the thickness of the lines is changed in the diagram. Basic morphology operations include an erosion operation and a dilatation operation. If the dilatation operation of the 2 × 2 kernel is applied, as shown in (1) of Figure 8, the line thickness in the diagram becomes thinner. On the contrary, if the erosion operation of the 2 × 2 kernel is applied, the line thickness in the diagram becomes thicker. The second augmentation method generates images with noise application, as shown in (2) of Figure 8. In order to address the problem where the line sign object in the image is not detected due to the noise in the diagram image, the training data was augmented by the application of noise. Among various types of noise, salt and pepper noise was applied to generate images. Salt and pepper noise refers to the case where the noise is generated by changing the pixel value to 0 or 255 in the original image with a set probability. That is, black noise is generated in each pixel of the original image with a specified probability.
The final training dataset generated by applying the above image augmentation methods is shown in Figure 9. In the case of the dotted lines, the number of data was doubled because the process of generating the training data was changed to Case 2 in Figure 7 (total number of training data: 15,009). Here, by changing the line thickness and adding noise to all data, the amount of data for each label increased by six times. As a result, after data augmentation, the number of training data was increased to 90,054.

5. Element Technologies for Line Recognition

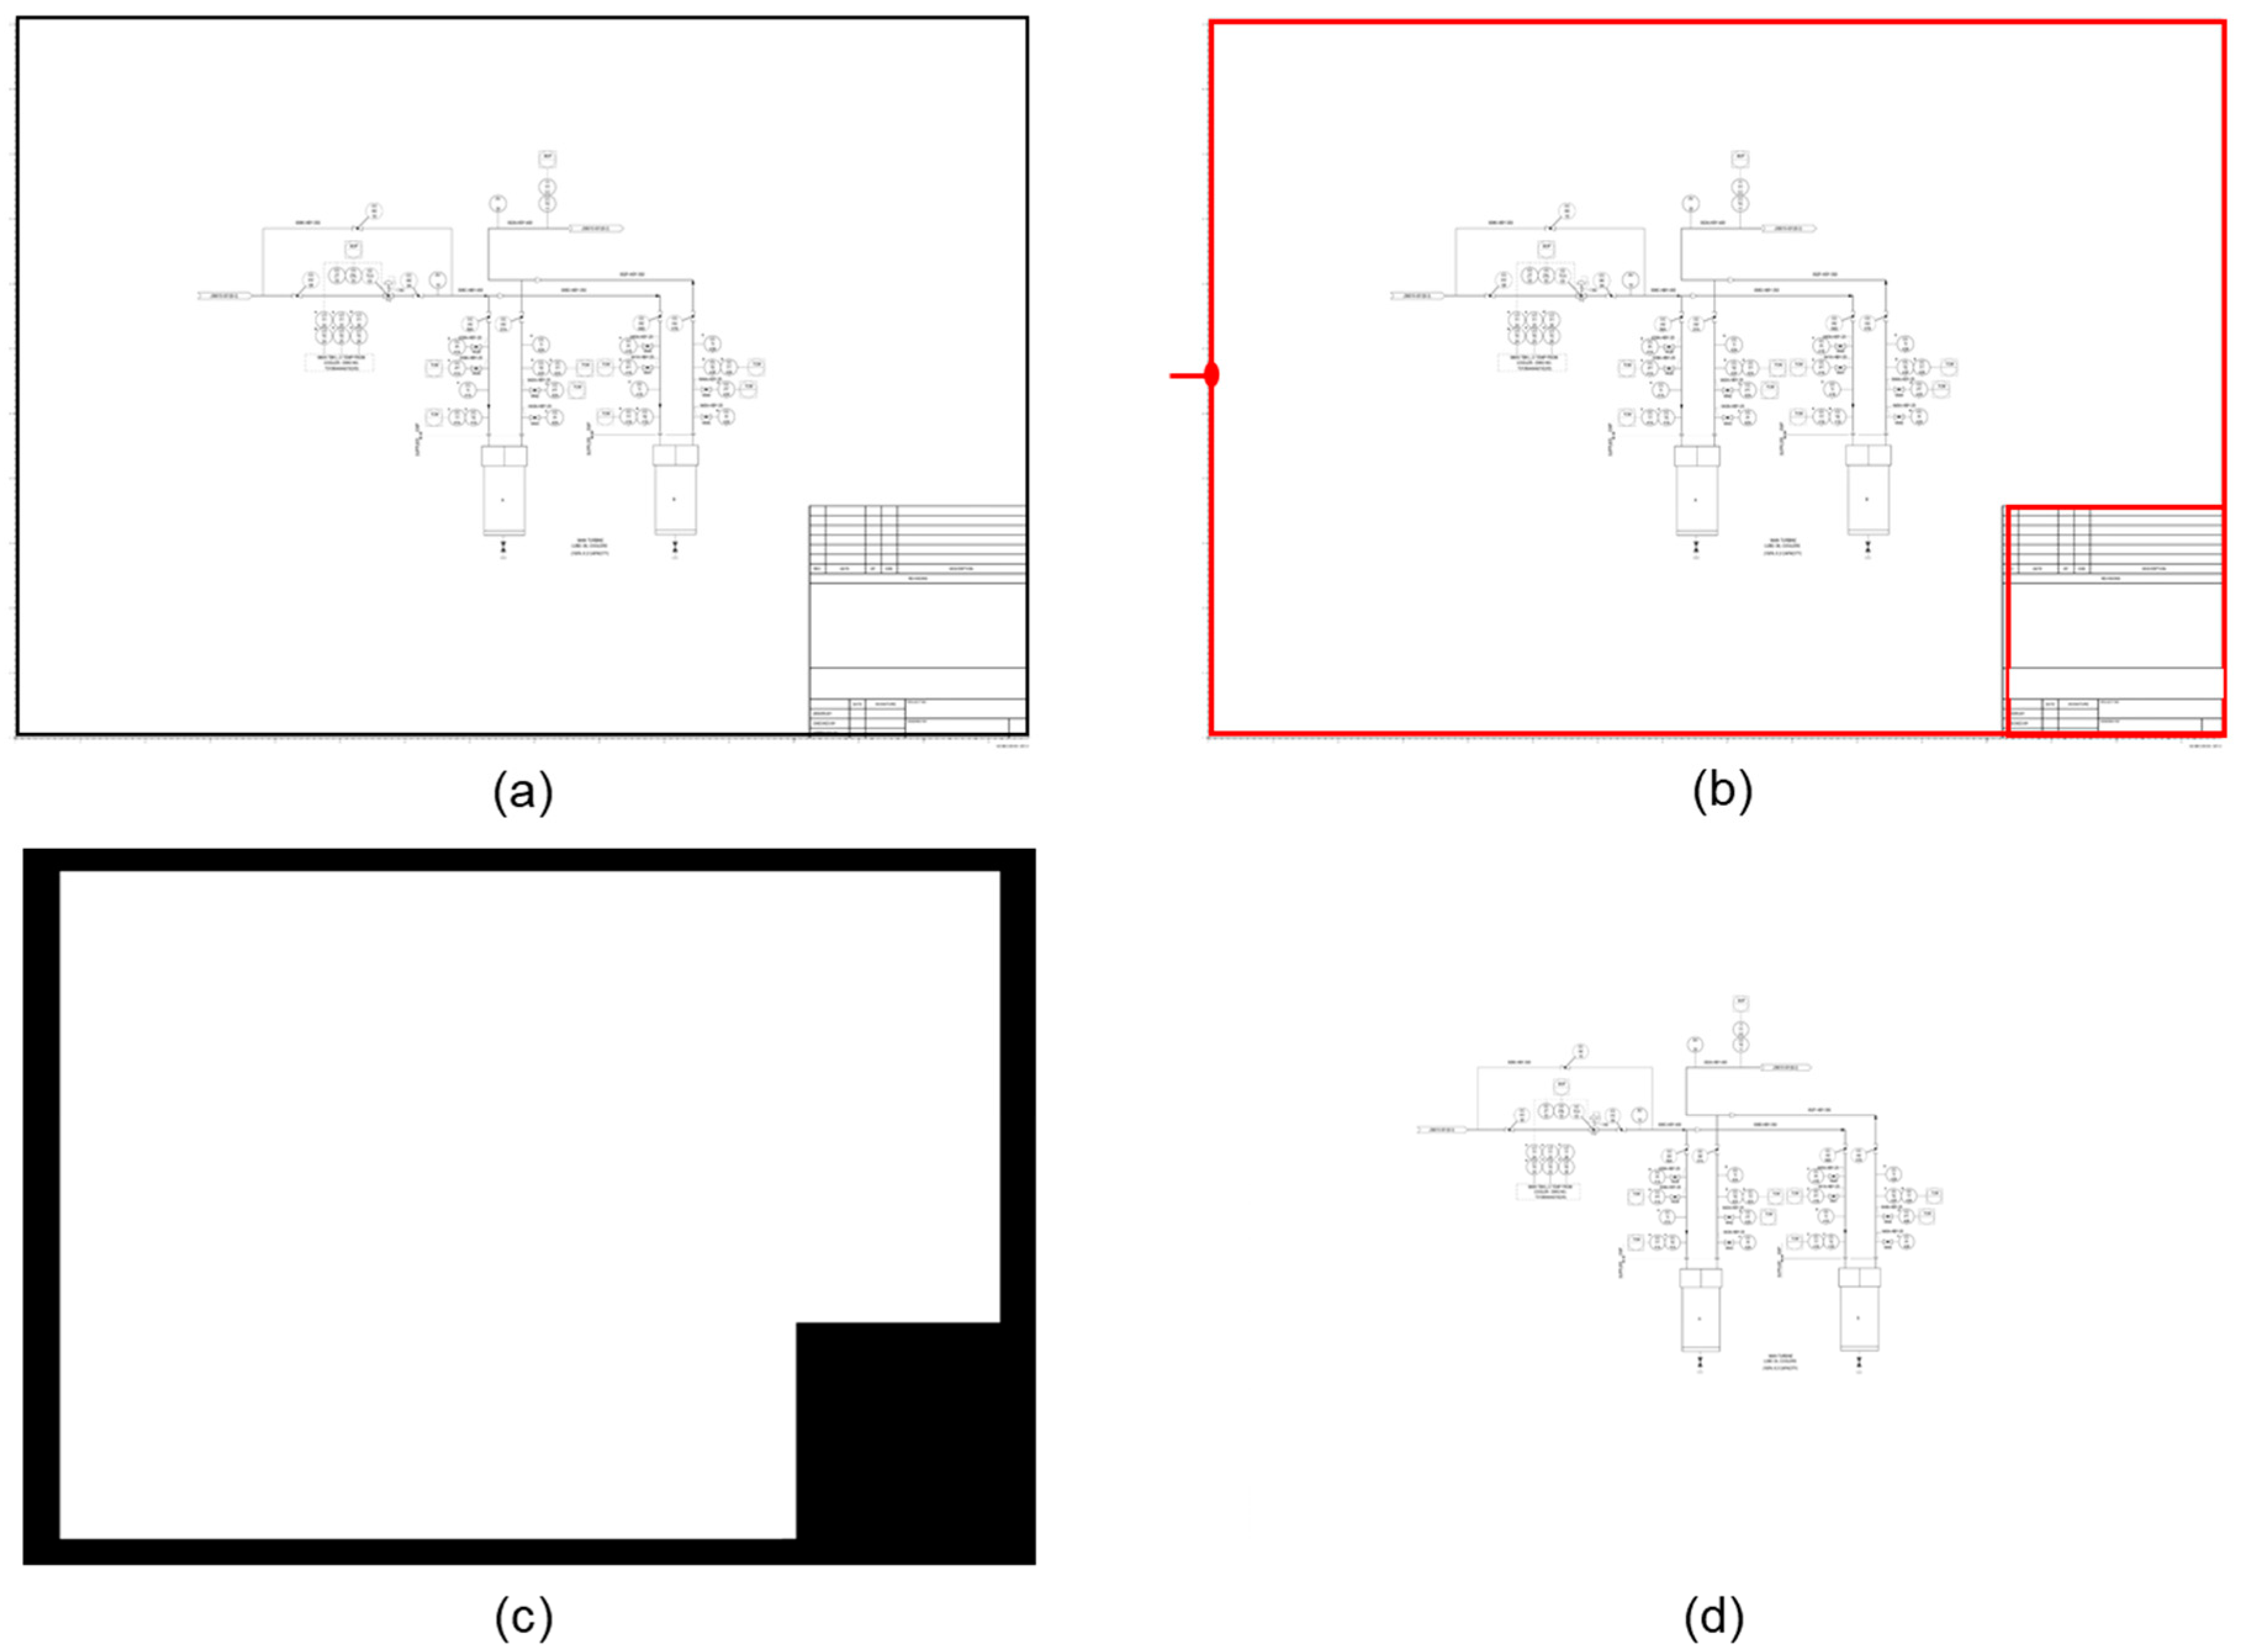
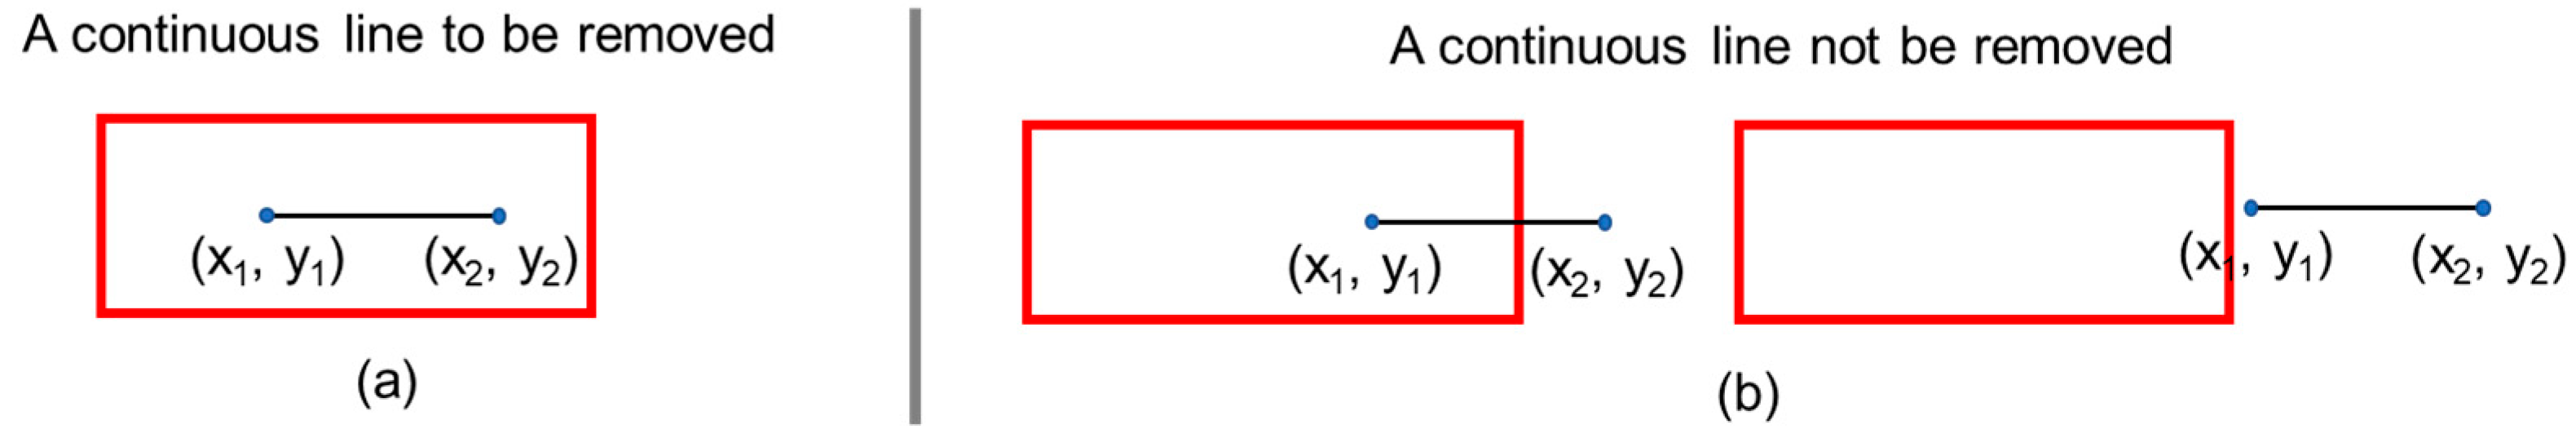
5.1. Removal of P&ID Title and Outer Border

Figure 10 shows the method of removing the title and outer border in P&ID. First, the original diagram image is converted into a binary image. Then, a search is performed from the left-center to the right of the diagram to find the first pixel having a value greater than or equal to a threshold. Then, all pixels connected to this pixel are searched. The searched pixels compose the title and outer border of the diagram. Finally, for the searched pixels, erosion operation and then dilation operation is performed in turn among the morphology operations to detect titles and outline areas. The detected title and outer borders are removed accordingly.

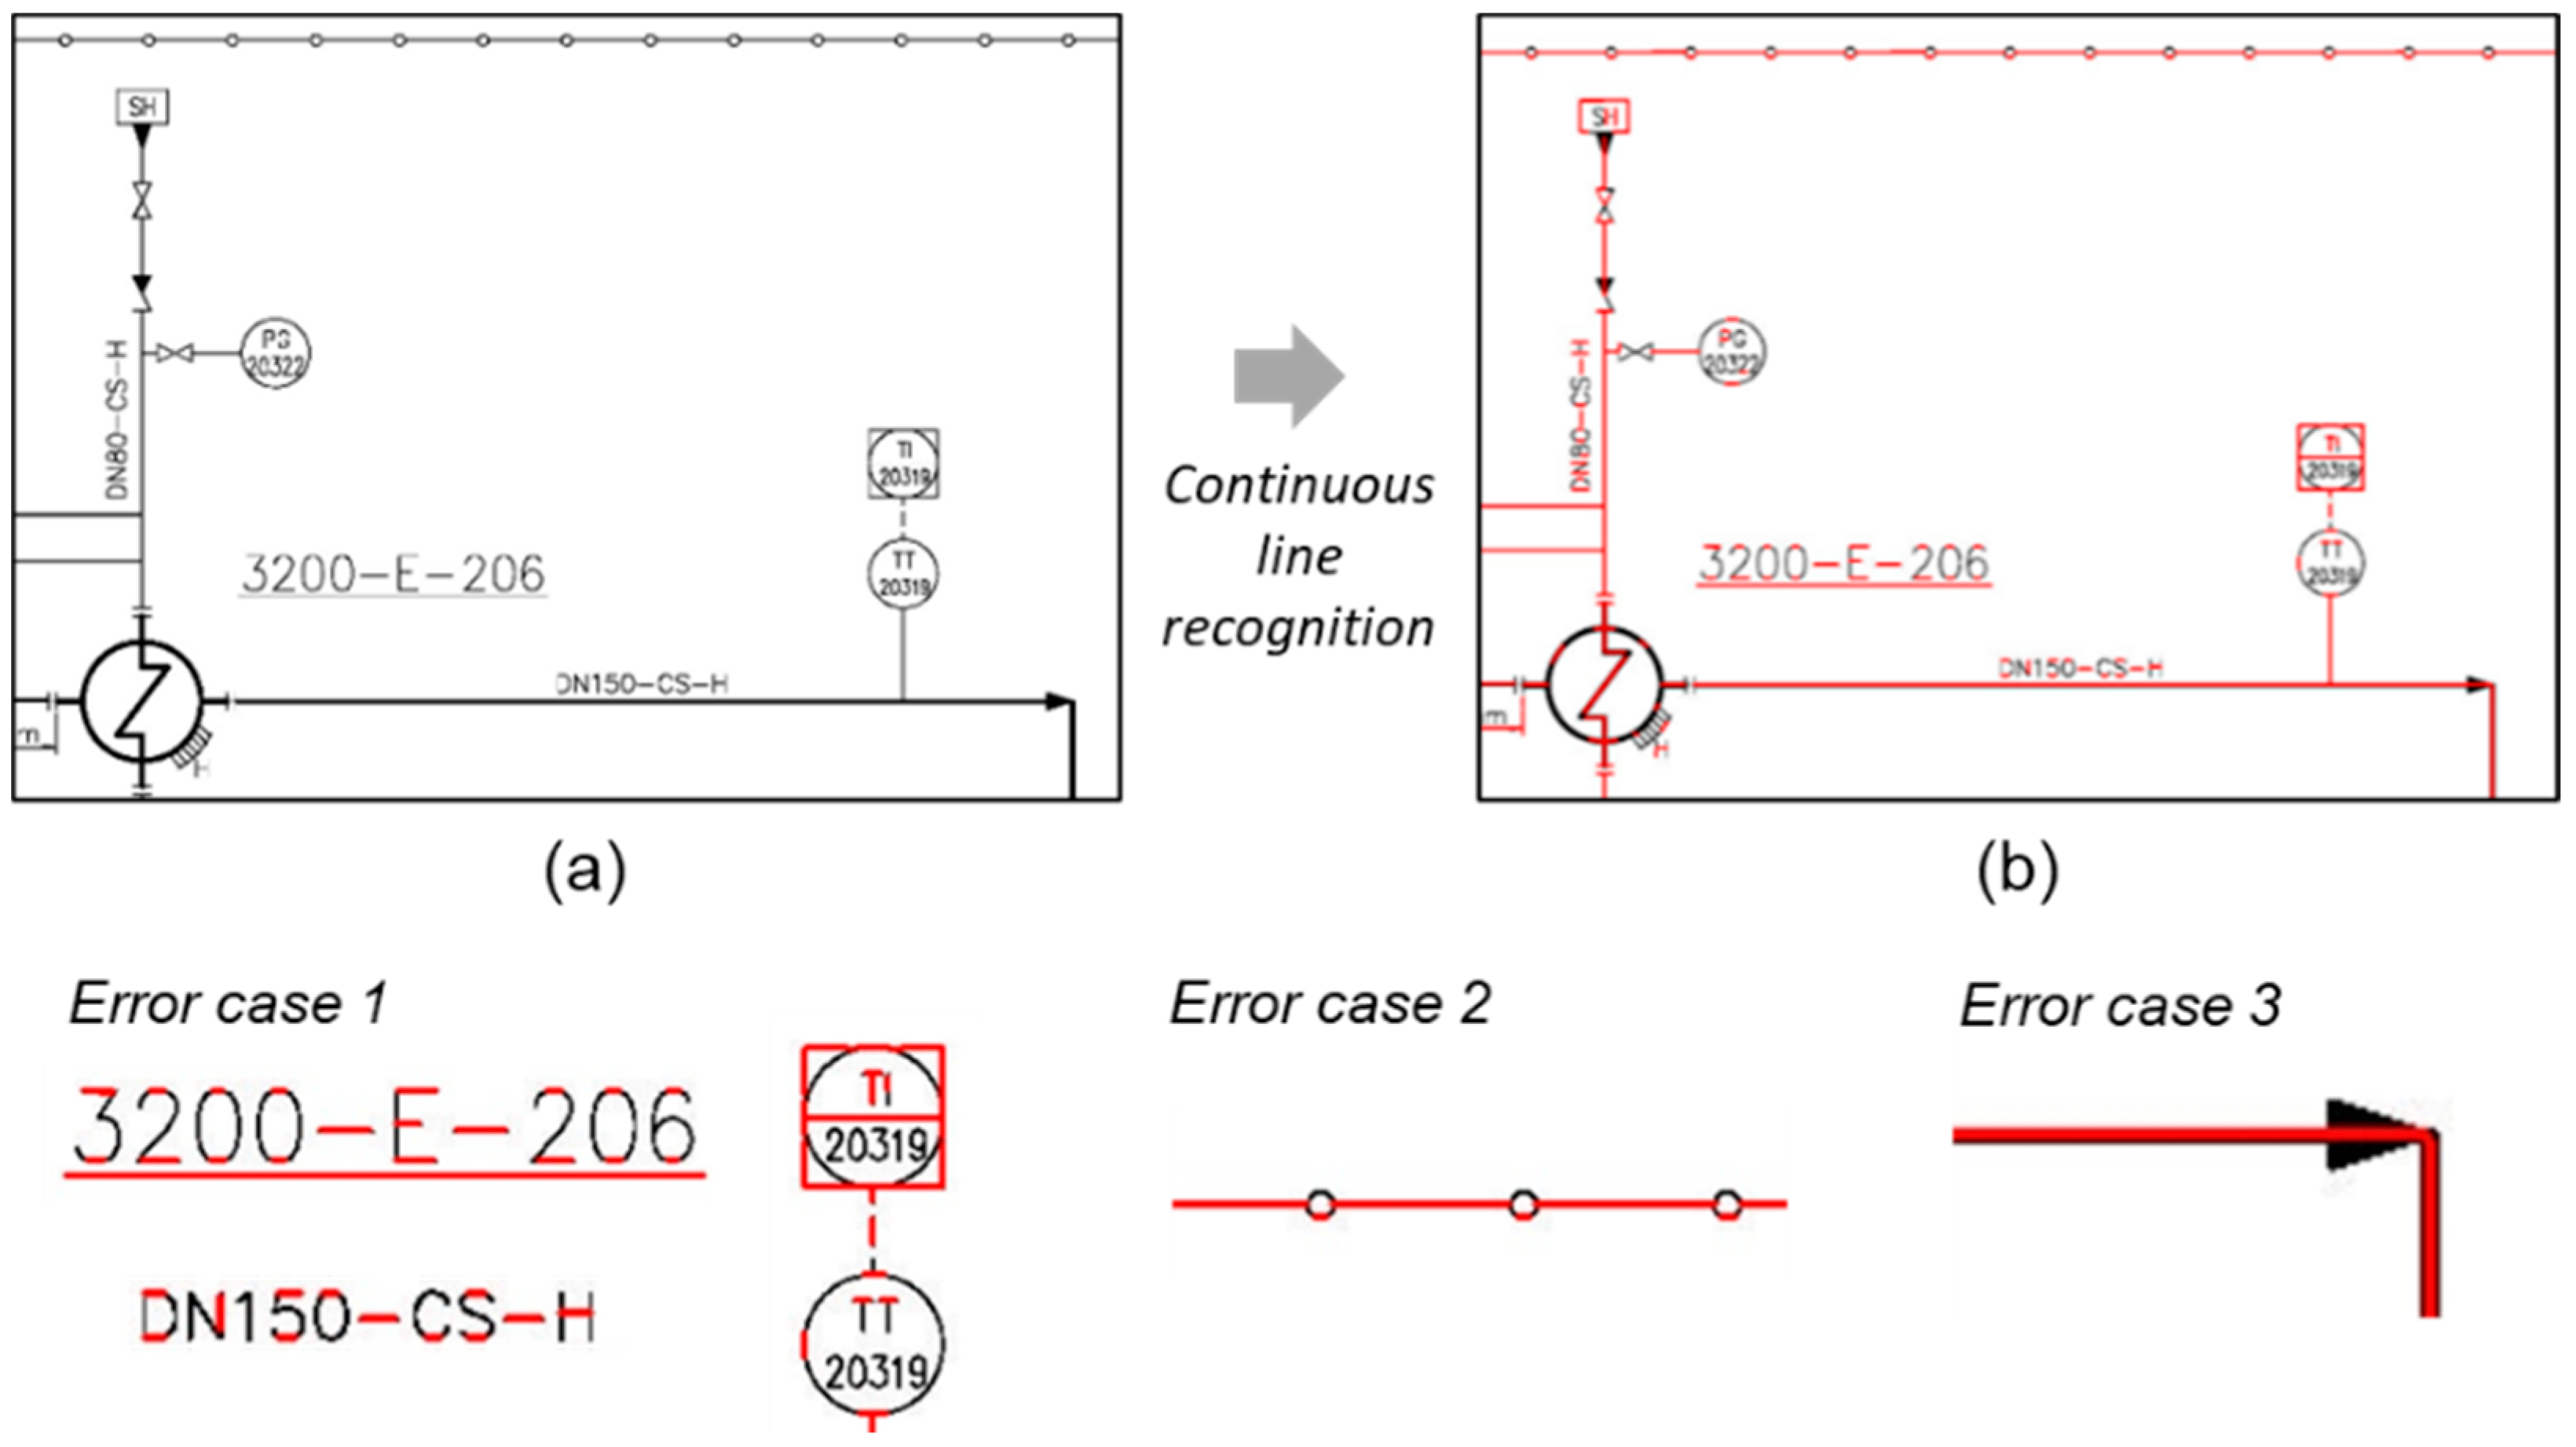
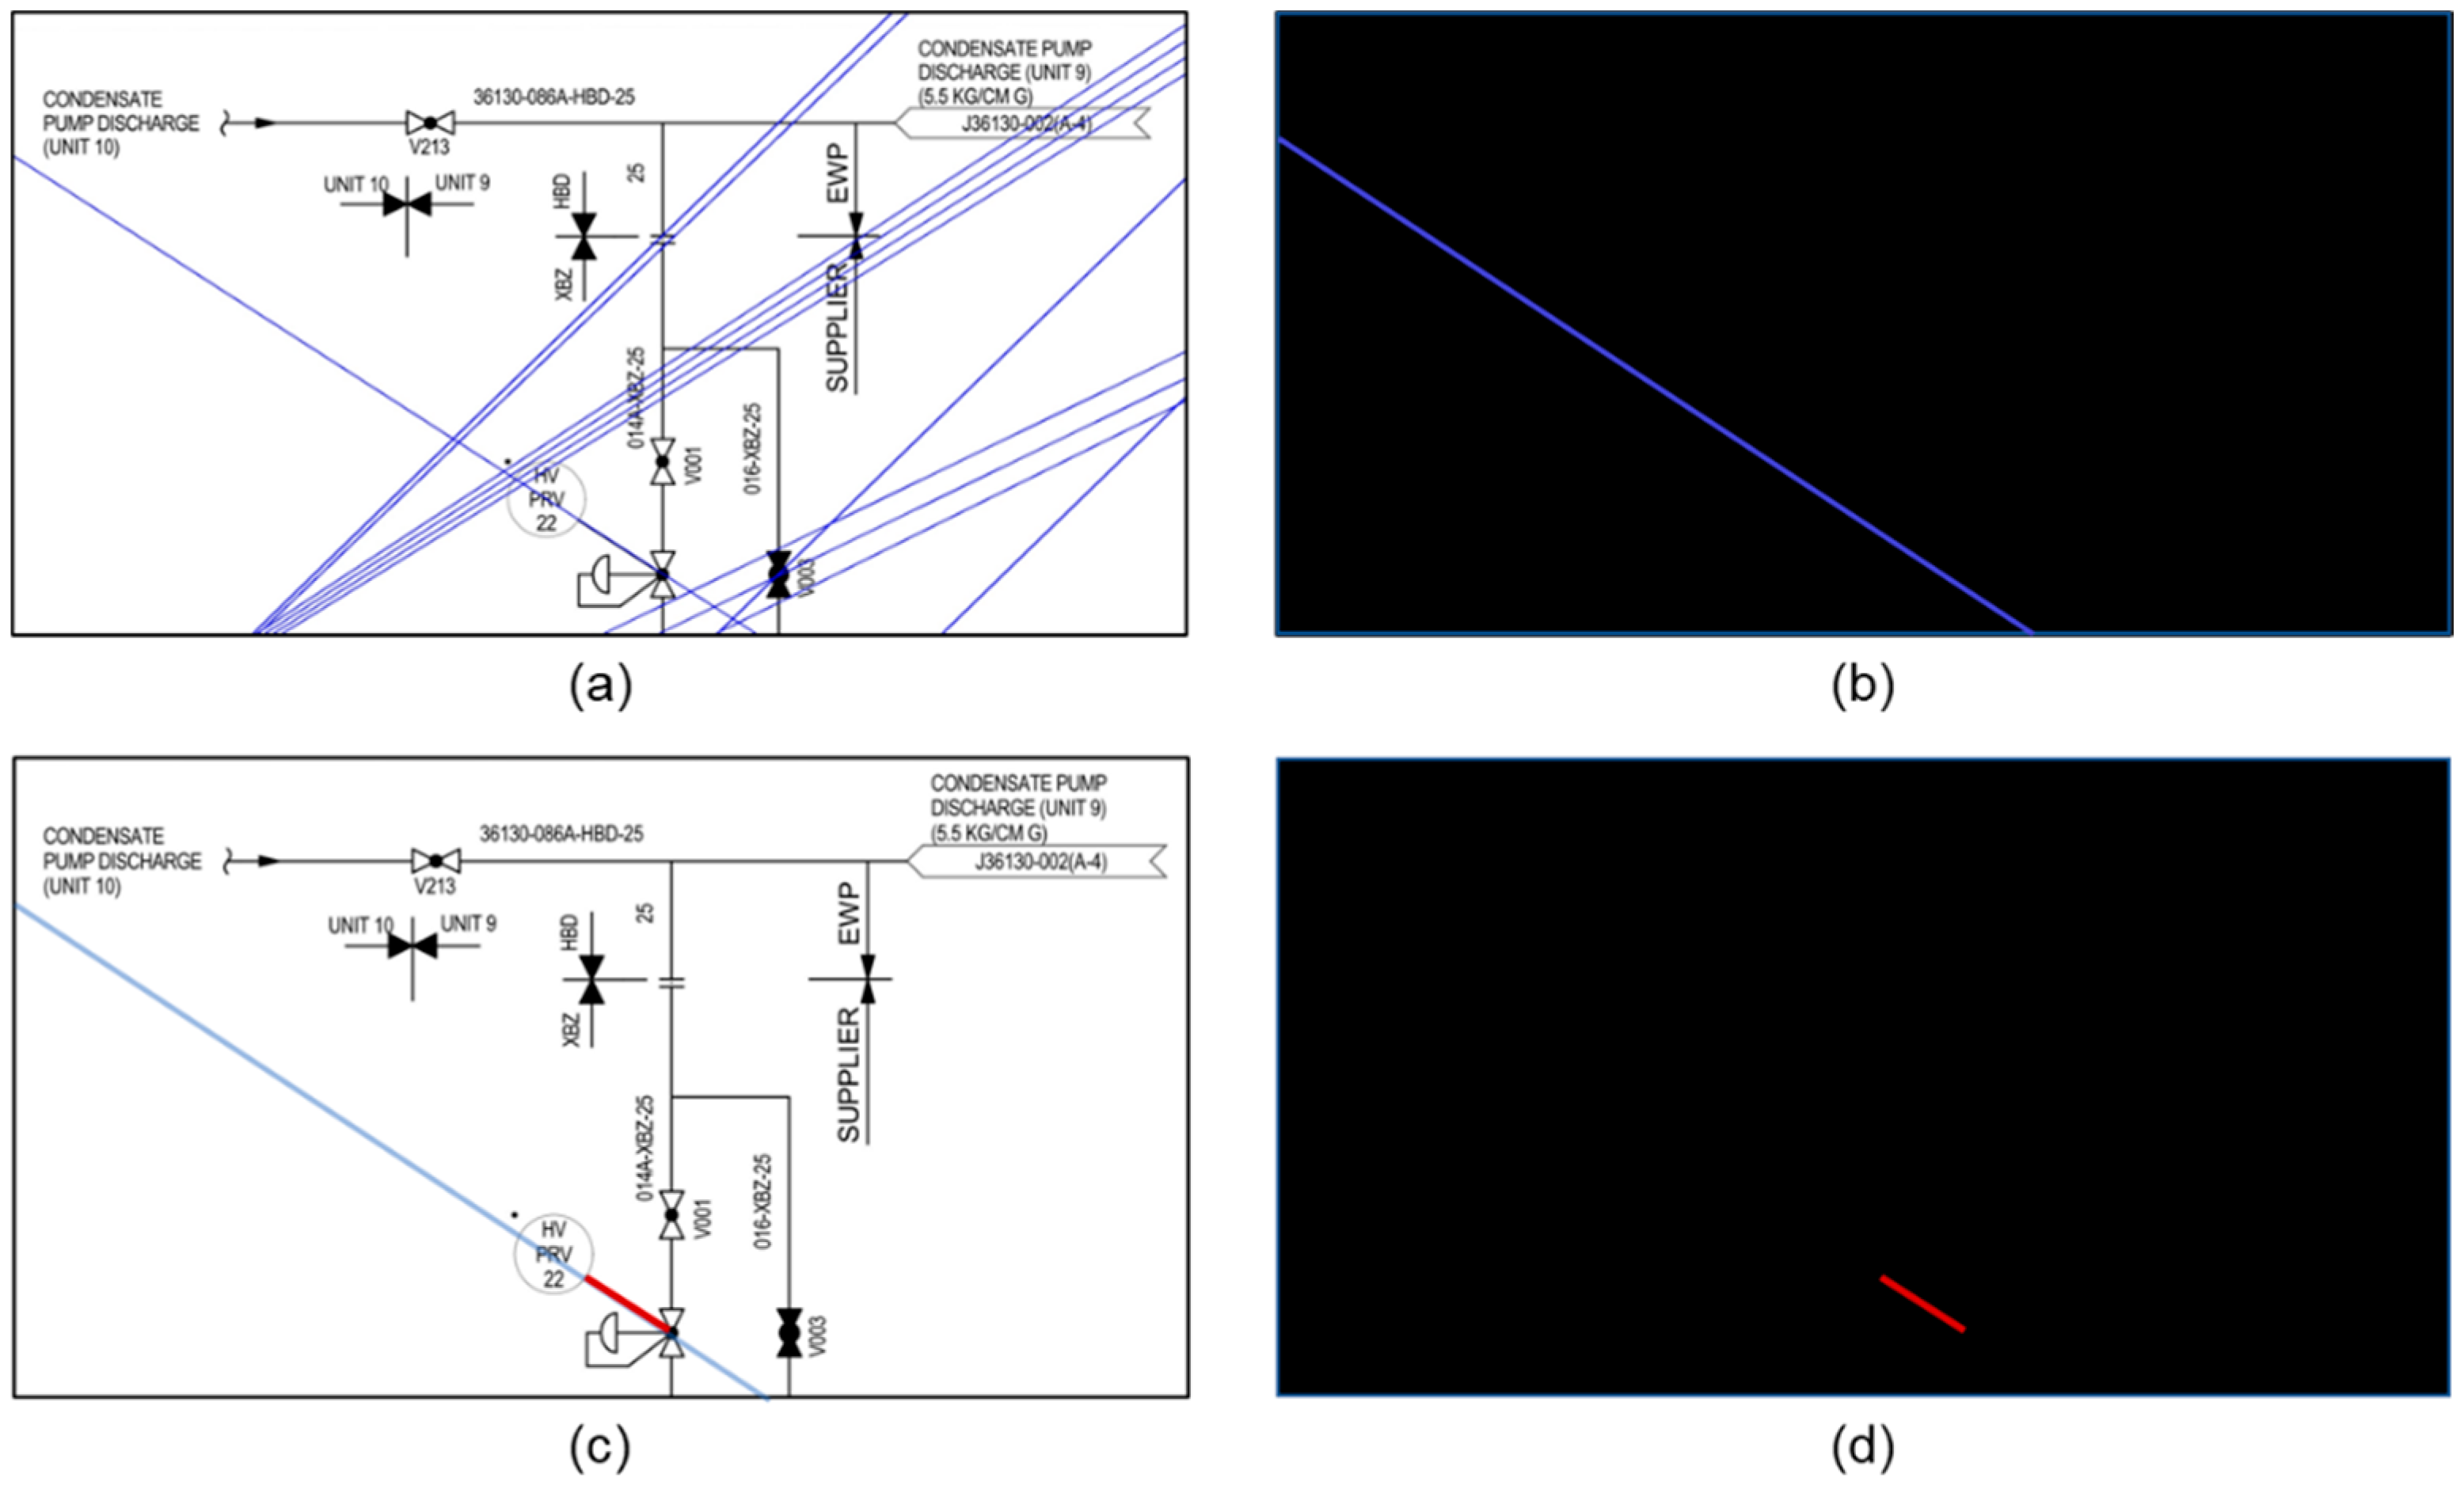
5.2. Detection of Continuous Lines in a Diagram

The continuous lines in a diagram have various thicknesses. When detecting continuous lines using the Hough transform [25], a line with 2-pixel-or-more thickness may be detected as multiple lines. In order to prevent this problem, the line thinning process, as shown in Figure 11, is necessary so that the thickness of all lines in the diagram is set to 1 pixel. When the line after line thinning is called a skeleton line, the skeleton line should have the following features. First, the thickness of the skeleton line should be 1 pixel. Additionally, the skeleton line should be located at the center of the line. In addition, the skeleton line must maintain the connectivity of the original image. For this purpose, the length of the skeleton line must not be reduced compared to the length of the original line. In this study, the algorithm of Zhang and Suen [27] was applied for line thinning.
Horizontal and vertical continuous lines are searched using pixel processing techniques. For vertical lines, black pixels are searched while moving from the top to the bottom of the image. If the coordinate of the current kernel location is (x, y), the pixel value of (x, y + 1) is investigated repeatedly until the black pixel is no longer detected. For horizontal lines, black pixels are searched while moving from the leftmost to the right of the image. The pixel value of (x + 1, y) is investigated repeatedly until no black pixel is detected. When the detection process of the horizontal and vertical lines is completed, the start and end points of the line are defined by recording the coordinates of the last pixel.
The above pixel processing technique is effective when searching horizontal and vertical continuous lines. However, it is not easy for diagonal lines to apply this method, so a different method is applied. The method of diagonal line detection is illustrated in Figure 12. First, all continuous lines in the diagram are searched using the Hough transform. Then, horizontal and vertical lines are removed from the searched lines to construct a candidate set of diagonal lines. One line of the candidate set is drawn on an empty image. Then, the bitwise AND(&) operation is performed between the diagonal line drawn on the empty image and the original image so that the diagonal line overlapping with a line of the original image is found. Finally, the start and end points of the detected diagonal lines are measured.
Since the results of continuous line detection include lines incorporated with the symbol or text, these must be removed after the detection of continuous lines. For this, after detecting continuous lines, the continuous lines located in the bounding box of symbols and texts are removed using the symbol and text recognition data. Figure 13 shows the method of eliminating continuous lines overlapping with the symbol and text area. In this figure, the rectangle represents the bounding box of a symbol or text. As shown in Figure 13a, if both points of a continuous line are within the bounding box, this continuous line is removed. On the other hand, continuous lines with only one point within the bounding box or both points outside the bounding box are not removed.

5.3. Detecting Line Signs and Flow Arrows in a Diagram and Determining Line Types

When detection of continuous lines is completed, line signs and flow arrows are identified, and then some continuous lines undergo changes in the line type, and flow direction information is added to some lines. Figure 14 illustrates this procedure. First, a high-resolution (9933 × 7016) diagram image is received as input, and this is segmented into several small images. From the segmented images, line signs and flow arrows are detected using a deep neural network. After completing the detection, the line sign and flow arrow detection results performed on multiple-segmented images are merged into one. Also, if a line sign is situated on a specific continuous line, the type of the continuous line is changed to match the line sign. Also, if a flow arrow is located on a particular line, flow direction information is added to the corresponding line.

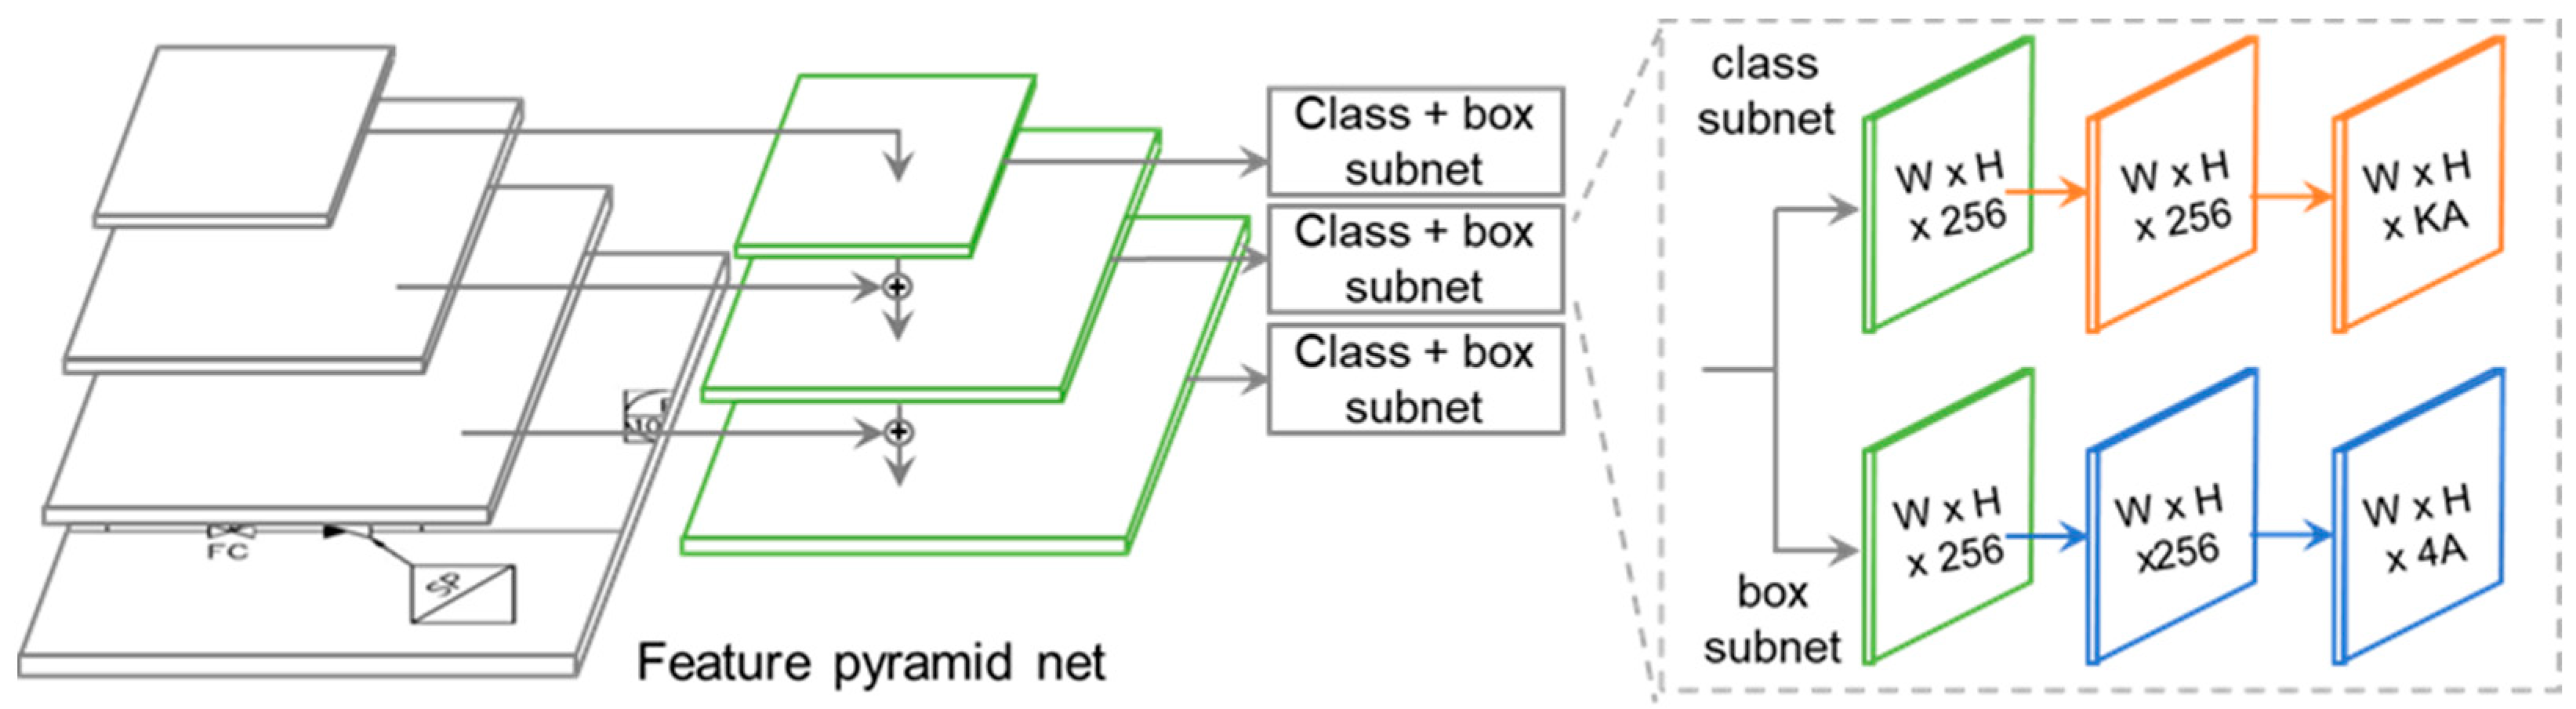
5.3.1. Deep Neural Network for Line Sign Recognition in a Diagram

In this study, RetinaNet [23] was applied to detect line signs and flow arrows. RetinaNet has the feature pyramid net architecture, as shown in Figure 15. Unlike the existing detection algorithms in which cross-entropy loss is used for classifier loss calculation, RetinaNet uses a focal loss, which is a modification of the cross-entropy loss. Focal loss is a loss function developed to resolve the problem of class imbalance between the foreground where the target object is located and the background where the target object is not located. A case in which the number of data that each class has in a dataset is different is referred to as class imbalance. Since the dataset constructed in this study shows the imbalance in which the number of data for certain line signs such as double slash sign lines is very small compared to other line signs, RetinaNet using focal loss is an appropriate deep neural network for this case.
Anchor refers to a bounding box with a predetermined size and ratio that is used to detect various types of objects in an image. The anchor facilitates relatively fast convergence of the loss function during training and affects the accuracy of object detection. If the inappropriate size of an anchor is set, it leads to a difference from the bounding box of the object to be detected, resulting in poor learning performance. Therefore, to achieve enhanced learning performance, selecting appropriate anchor parameters is important. The basic anchor sizes used in [23] are322, 642, 1282, 2562, 5122, the basic anchor ratios are 0.5, 1, 2, and the basic anchor scales are 1, 1.269, 1.587. However, in the case of the horizontal O sign line, the size is 50 × 25, and the vertical length is smaller than the minimum anchor size of 32. In the case of the horizontal dotted line symbol, the ratio is 3.33, showing the difference from the basic anchor ratio. In this study, we have set the optimal anchor parameters for the training dataset using the anchor optimizer. The selected optimal anchor parameters are 322, 642, 1282, 2562, 5122 in size, 0.289, 0.581, 1.0, 1.721, 3.457 in ratio, and 0.949, 1.182, and 1.543 in scale, respectively.

5.3.2. Changing of Line Types and Merging of Lines of the Same Types

It is necessary to determine whether the line signs and the continuous lines overlap to change the line type. The procedure to assess the overlapping of the line signs with the continuous lines is as follows. In the first step, the distance from the center of the bounding box of the line sign is calculated for a specific continuous line. If the computed distance is shorter than the width and height of the bounding box, proceed to the next step. In the second step, it is examined whether this continuous line crosses the bounding box of the line sign or a part of the continuous line is contained in the bounding box. If this is the case, it is judged that this continuous line overlaps with the line sign, and the type of continuous line is changed according to the line sign.
After changing the line type, post-processing is performed through which multiple lines that have the same type and are connected to each other are merged into one line. For example, after changing the line type, there are cases in which multiple dotted lines exist, as shown in Figure 16a. If these dotted lines are located on the same infinite line and connected to each other, they are merged into one dotted line.

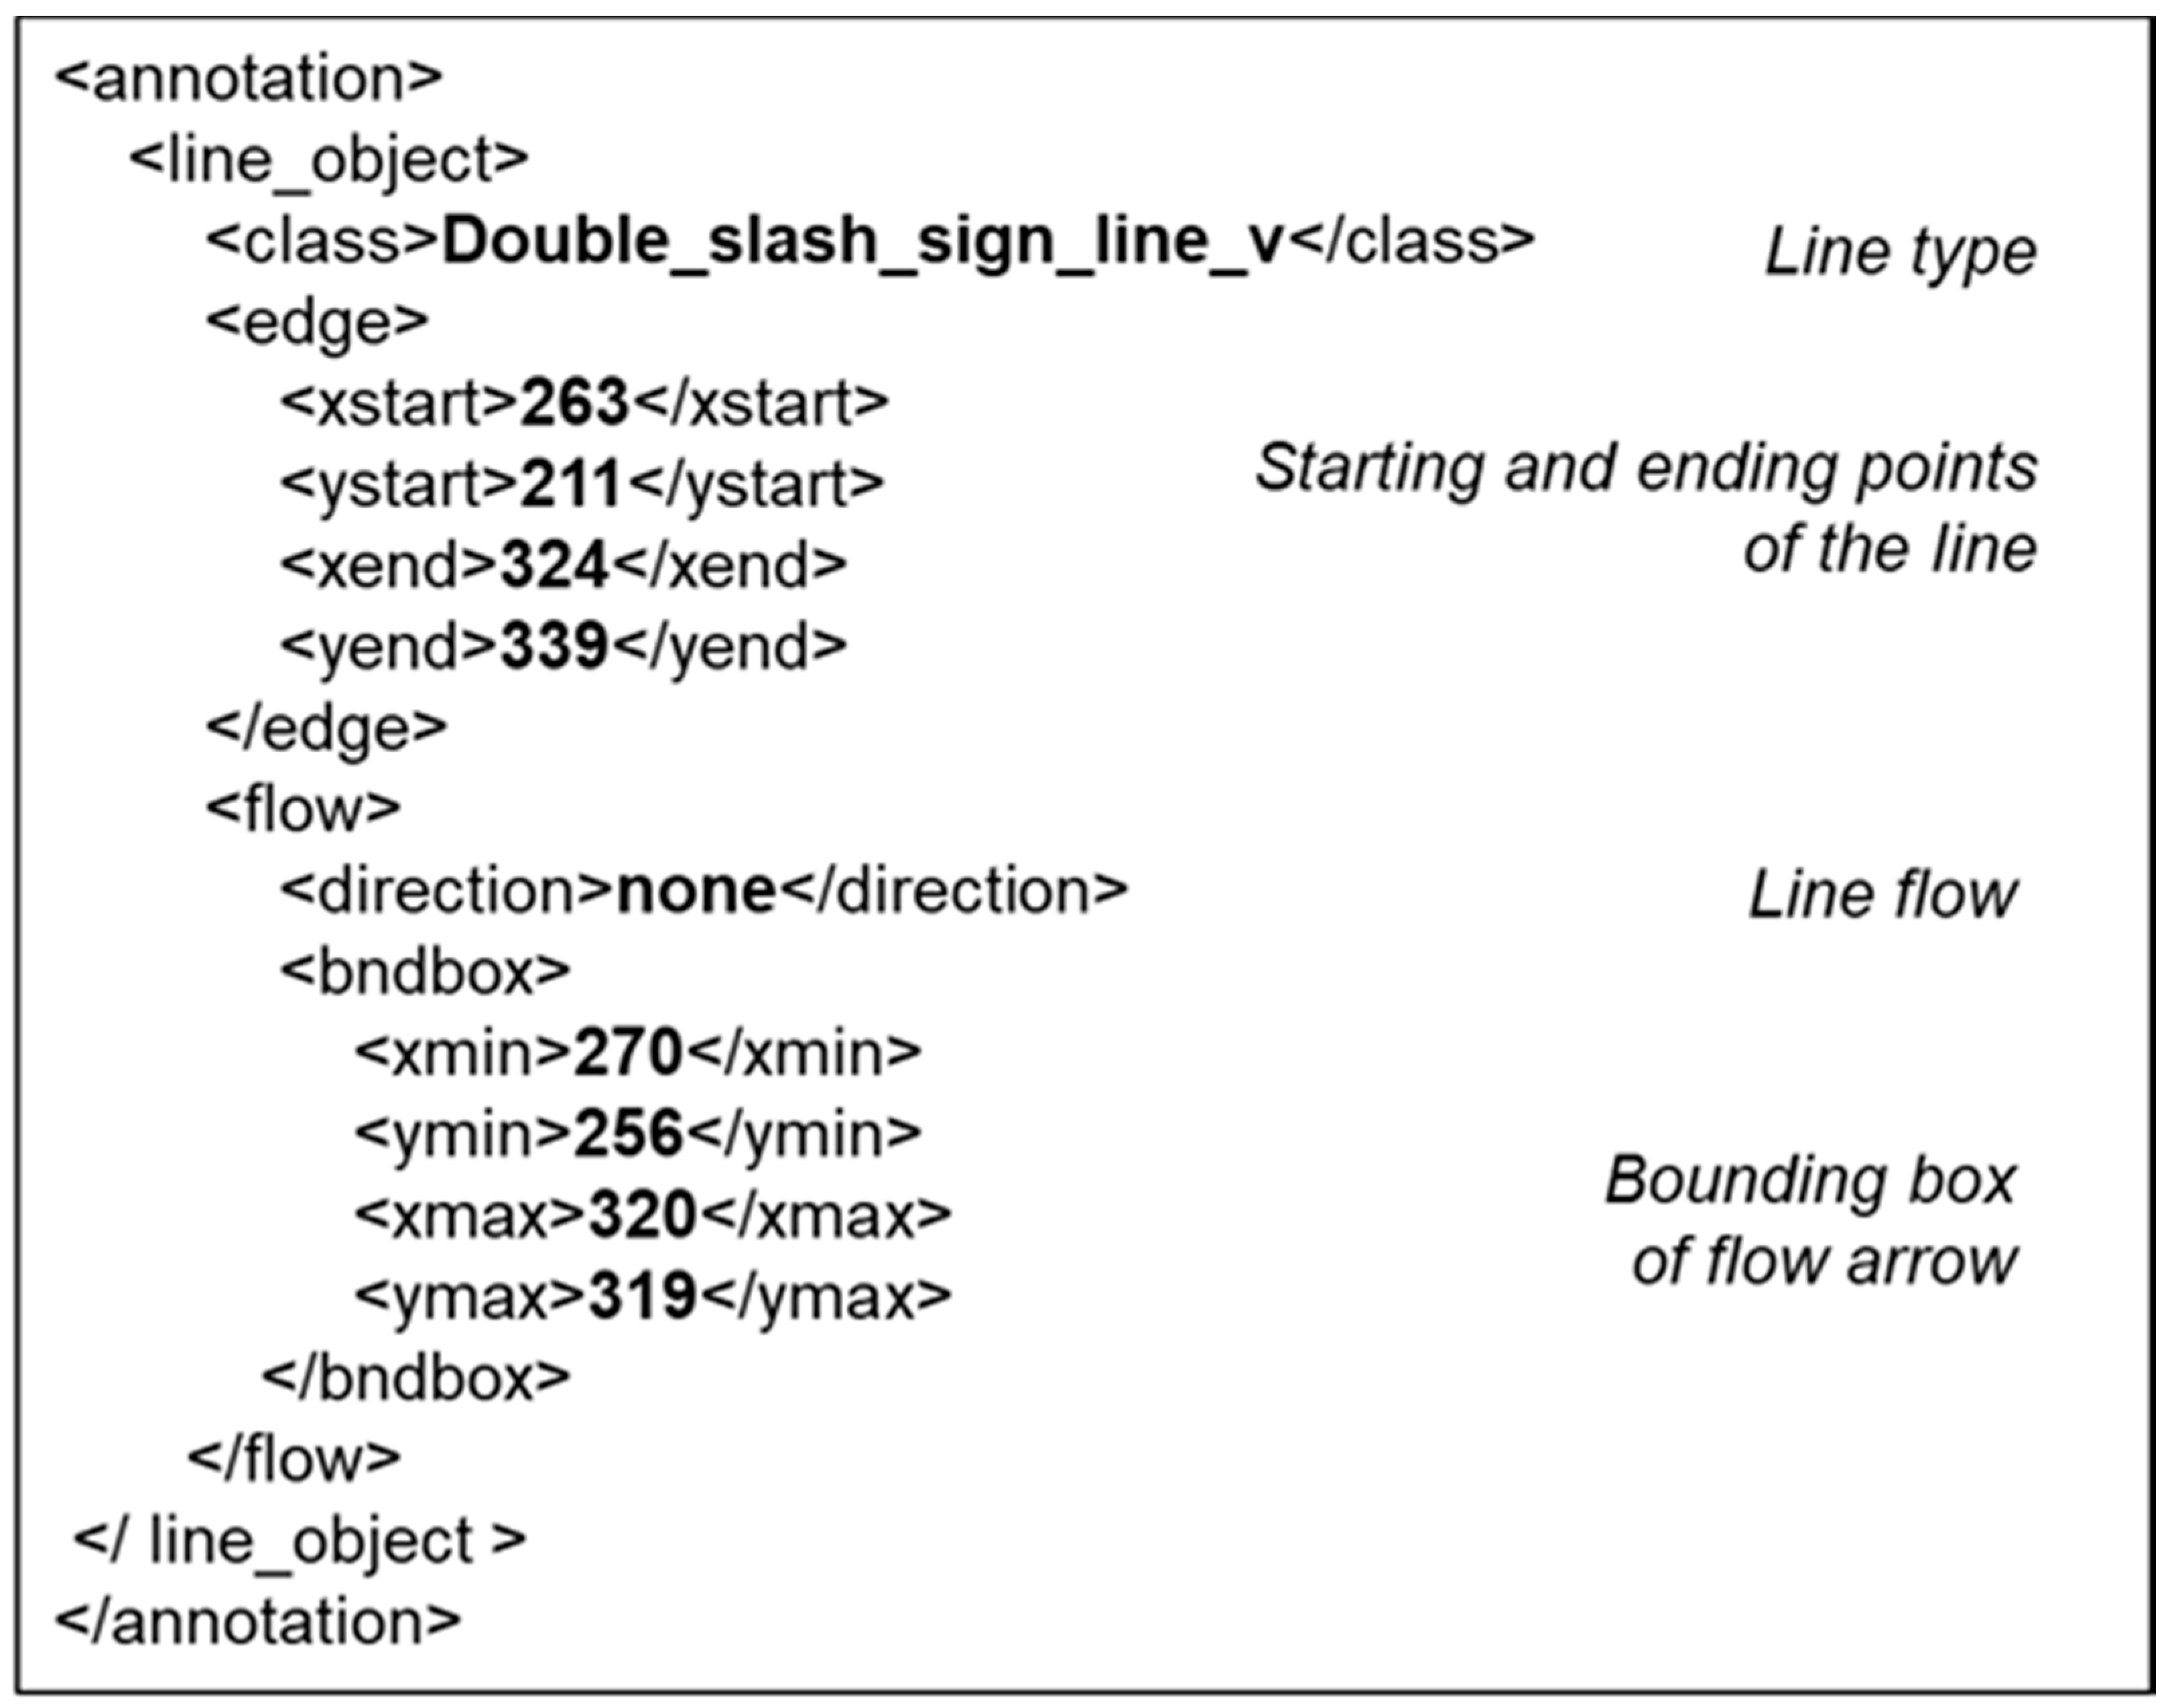
5.4. Storing Line Recognition Results

When the procedure of line recognition is completed, the results are saved in a file in extensible markup language (XML) format, as shown in Figure 17. The file structure is as follows. <class> indicates the type of line. <edge> represents the coordinates of the start and end points of the line. The coordinates of the start point are expressed as <xstart>, <ystart>, and the coordinates of the end point are expressed as <xend>, <yend>. <flow> stores the flow arrow information. <direction> indicates the direction of the flow arrow. Finally, <bndbox> means the bounding box of the flow arrow.

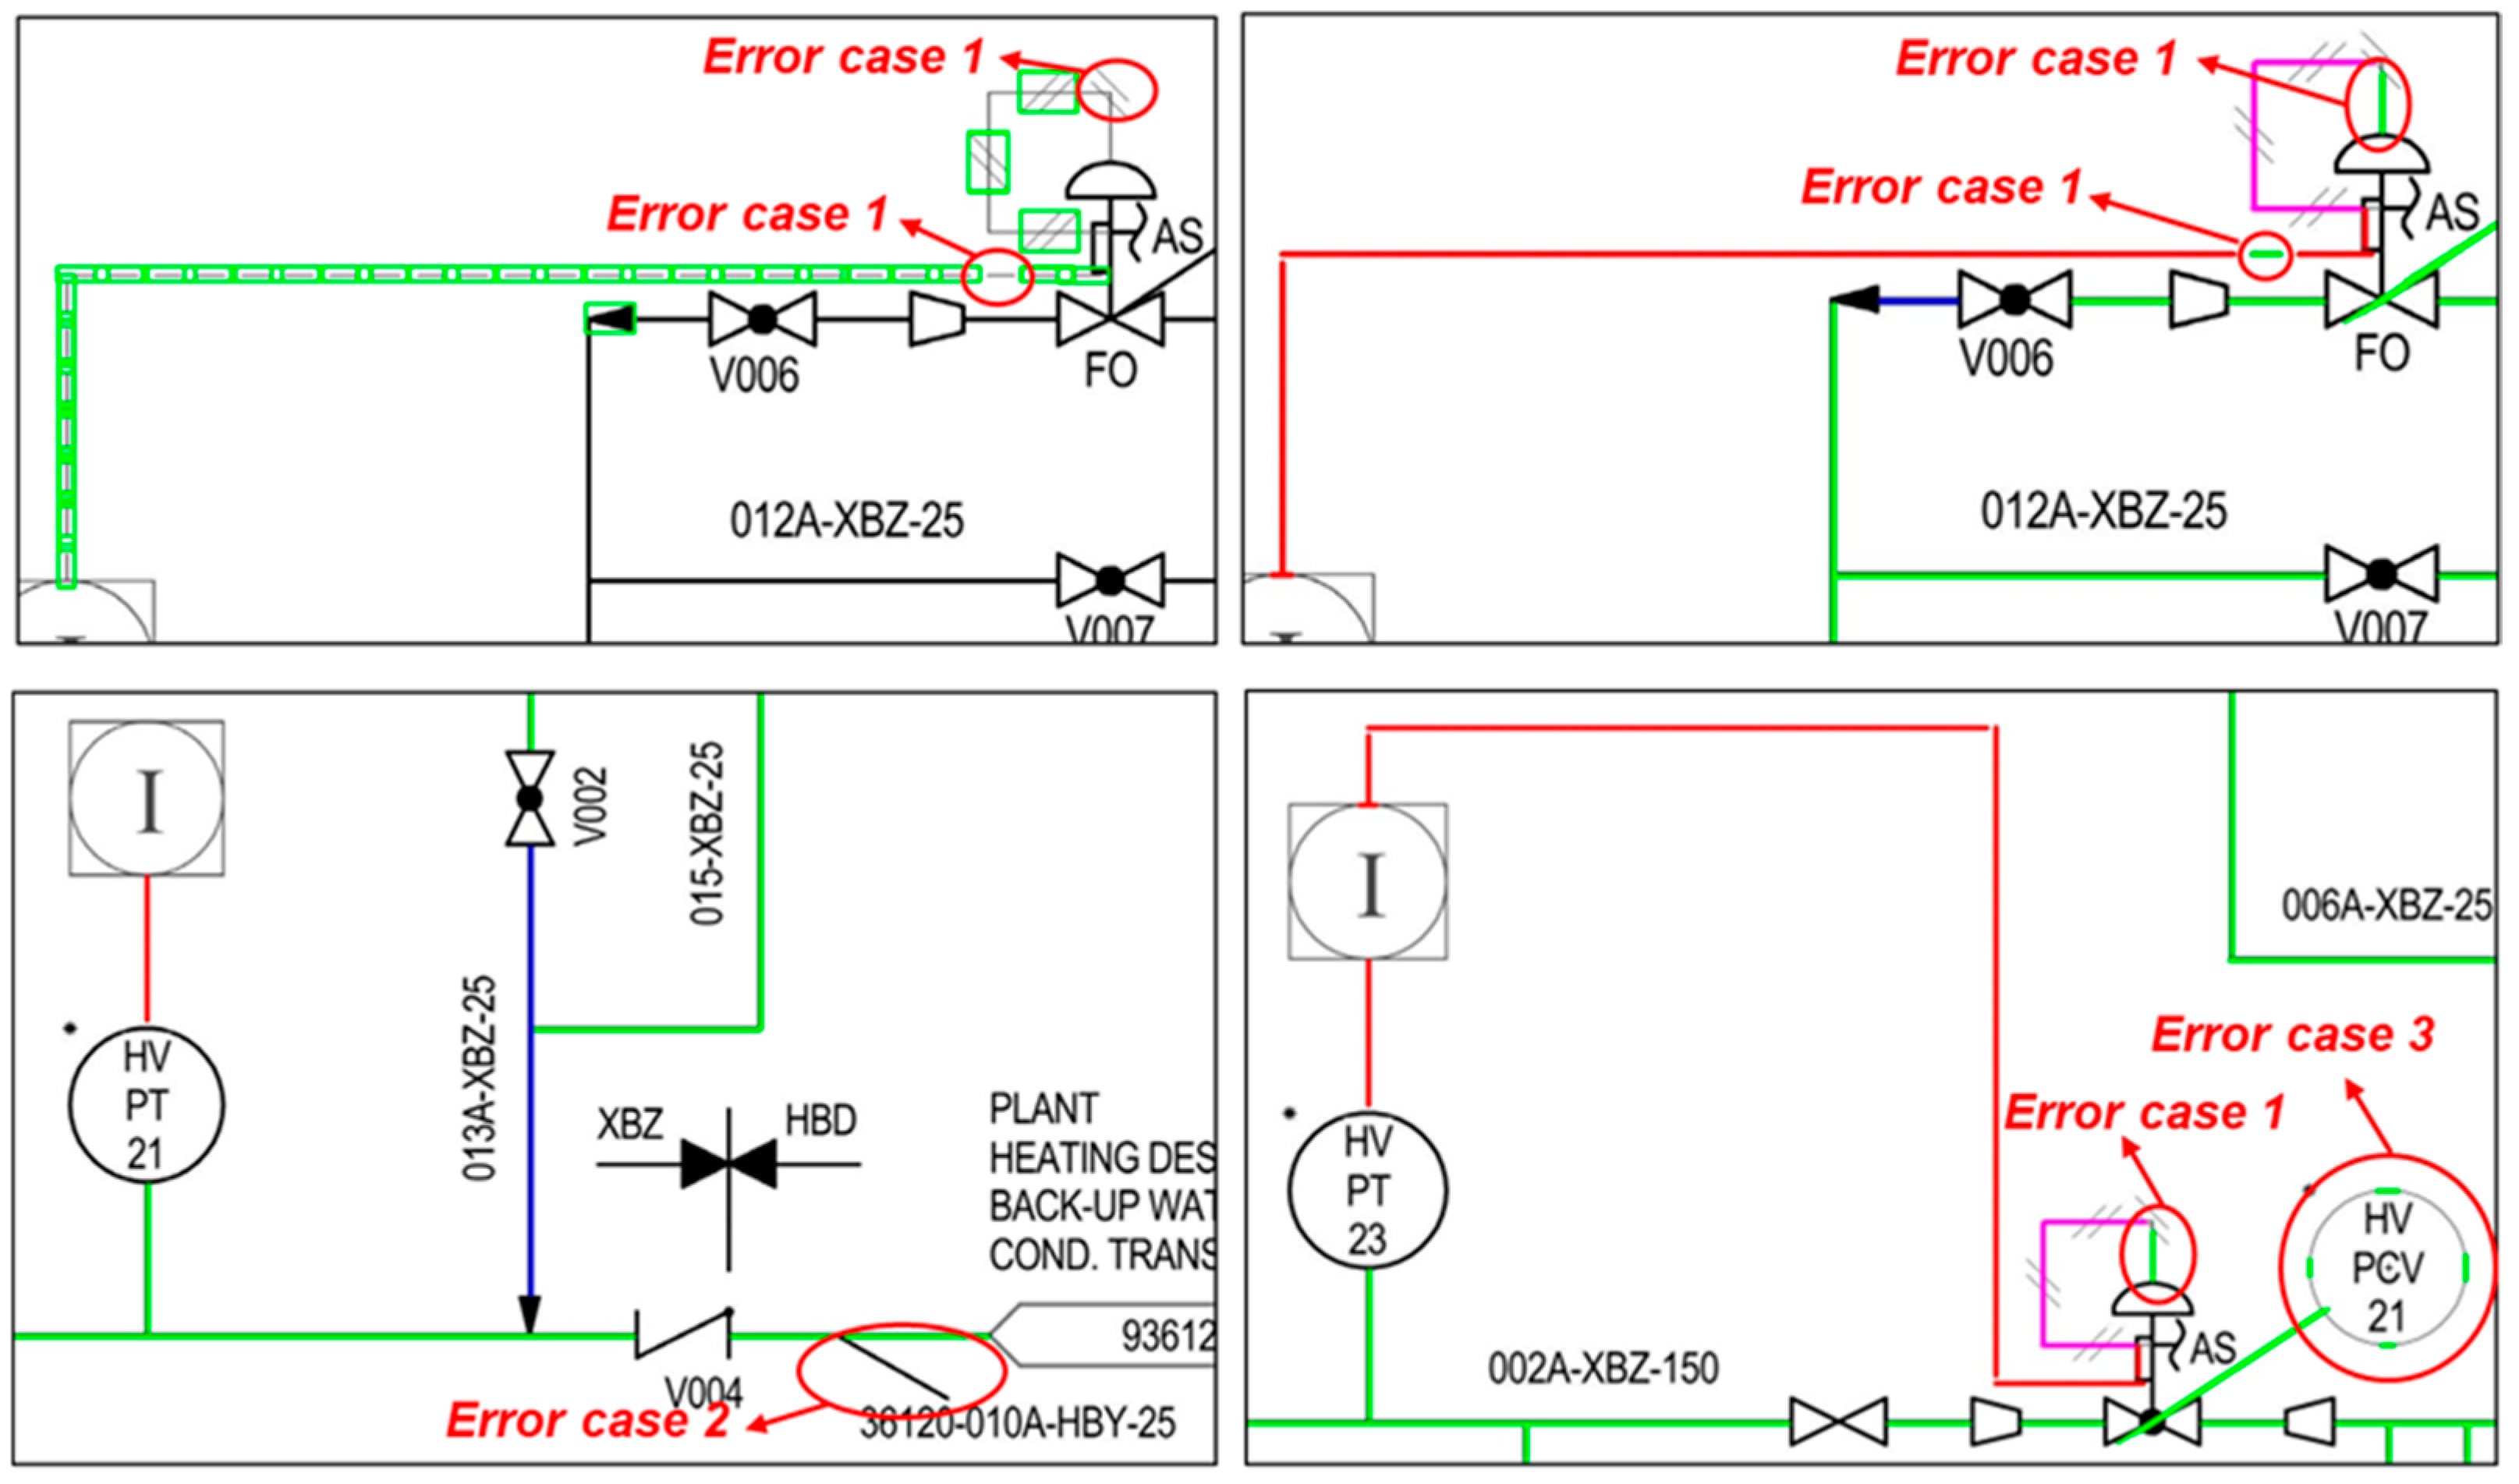
6. Implementation and Experiment

6.1. Experimental Setup

In accordance with the method proposed in this research, a system prototype was implemented that recognizes lines in image-format P&IDs. The prototype system was implemented in Python 3.7 on Windows 10 OS. A deep neural network for the detection of line signs and flow arrows was implemented using Keras 2.4 and Tensorflow 2.3.0 libraries. For the hardware, a computer with an AMD RYZEN 7 2700X CPU, 64GB RAM, and two Nvidia GeForce RTX 2080Ti graphics cards were used.
The P&IDs used in the experiment are 82 P&IDs remodeled based on the data provided by the ‘K’ company. The resolution of the diagram was 9933 × 7016. For detection of line signs and flow arrows, nine sheets out of the 82 sheets of diagrams are used as a test set for performance evaluation. Of the remaining 73 sheets of diagrams, 90% were used as the training dataset, and 10% were used as the validation dataset. Figure 18 shows the P&IDs included in the test set. Recognition results of lines in the areas indicated as (a)–(e) are shown in Figure 19.
Performance in each training epoch is assessed based on the validation dataset. In the learning training, the epoch was set to 50, and the step was set to 2500. After performing the training under the set epoch and step, a sufficient level of convergence was confirmed with the regression loss at 0.118 and the classification loss at 0.0374. Table 1 shows the network parameters set during training with the deep neural network. When line signs and flow arrows are detected through the deep neural network, class, bounding box, and prediction confidence are calculated. Usually, multiple candidates bounding boxes are detected for one object. A greedy non-maximum suppression (NMS) algorithm extracted the bounding box with the highest confidence among the candidate bounding boxes. The greedy NMS algorithm calculates the intersection over union (IOU) between boxes detected as the same object, selects boxes with an IOU threshold above a specific value, leaves only the box with the highest confidence, and deletes the rest. A threshold score of 0.5 and an IOU threshold of 0.5 was applied in this experiment.
In the proposed line recognition method, the results of recognizing symbols and texts included in P&ID are used as input. Therefore, using the method in [40], the symbols and texts included in the test P&IDs were recognized prior to the experiment.

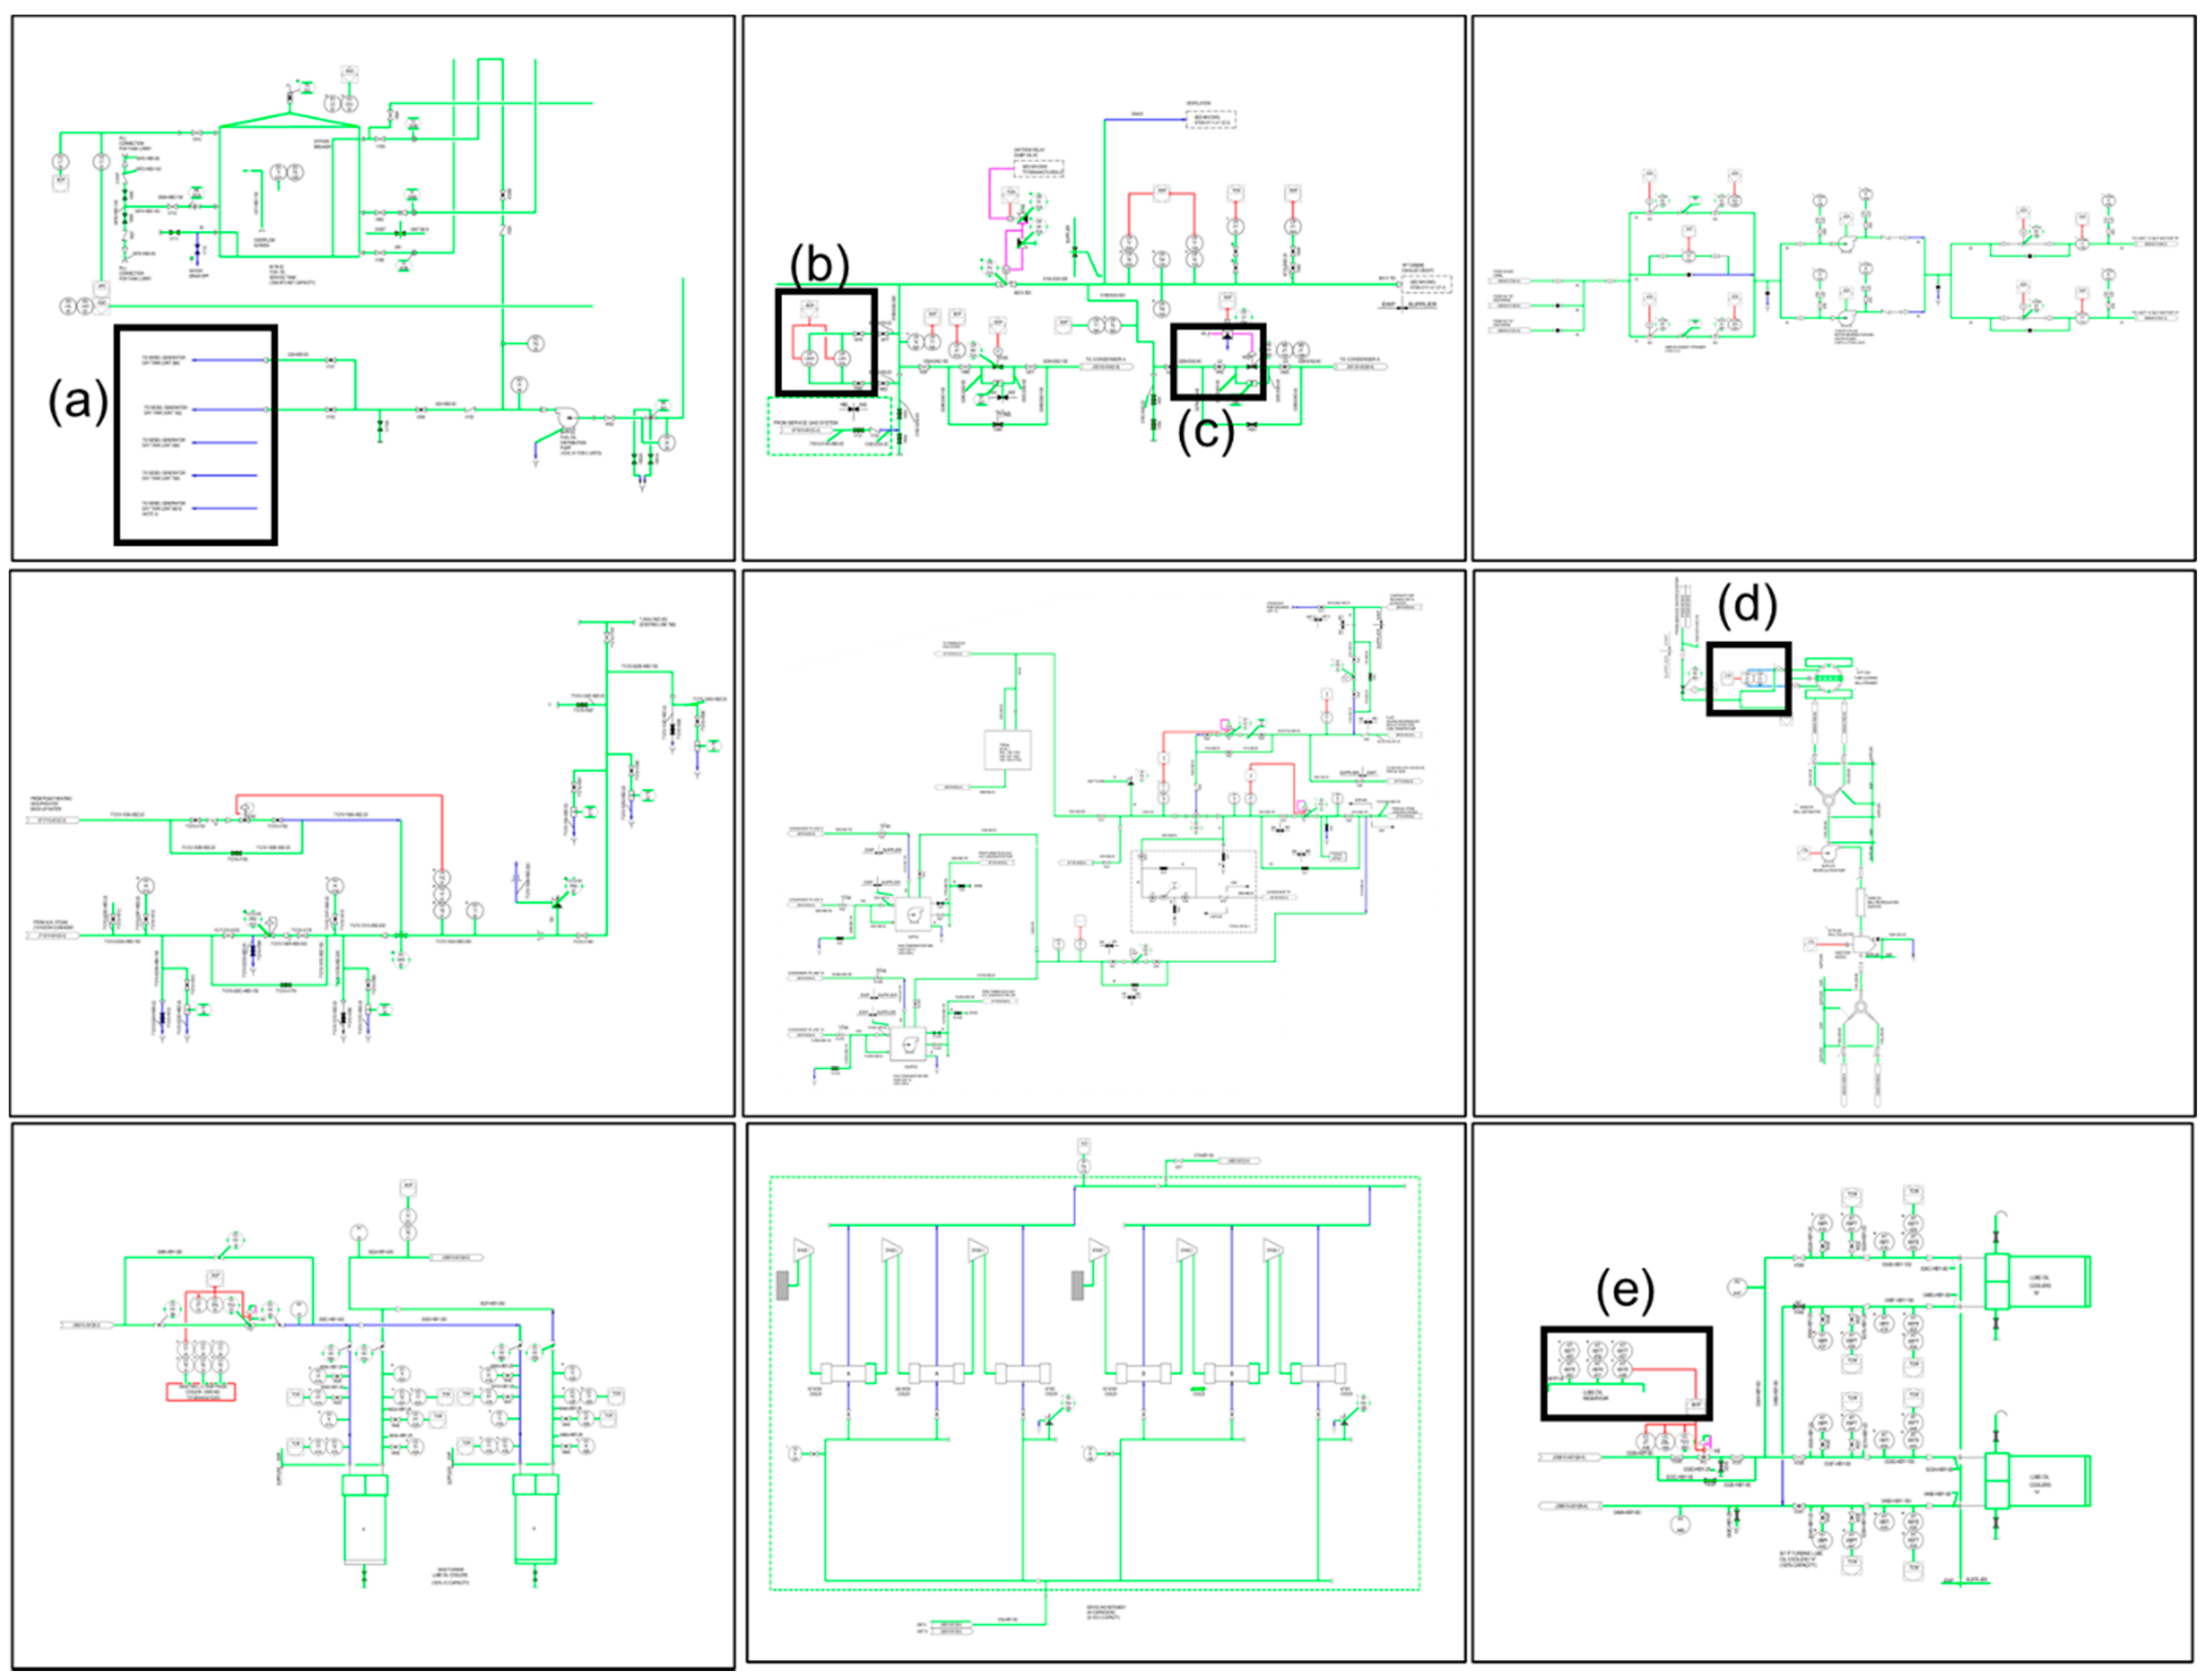
6.2. Experimental Results

Table 2 shows the results of recognition performance for each test P&ID. Approximately 50 min were taken for each case to perform the detection of continuous lines, and about 300 s to complete the detection of line signs and flow arrows, respectively. Most of the time taken for continuous line recognition was spent on the line thinning process (about 90% of the recognition time). The recognition performance for each test P&ID was assessed in terms of precision and recall. Precision is the percentage of true positives from the results the network detected. That is, it is the ratio of correctly recognized line objects among the finally recognized line objects. Recall refers to the percentage of the network predicted as true positives out of the true positives in the input. That is, it indicates the number of correctly predicted line objects among line objects existed in the image. Table 2 outlines the results of measuring precision and recall for the nine sheets of test P&IDs. The average values of the precision and recall for the test P&IDs were 96.14% and 89.59%, respectively.
Table 3 shows the performance evaluation results for each type of line sign and flow arrow included in the test P&IDs. As a result, the recall of Dotted_line_h, which makes up a large part of the training dataset was lower than that of other line signs and flow arrows (except Double_slash_sign_line_v and Arrow_s). And among the fewer object types in the dataset, the recall of Double_slash_sign_line_v and Arrow_s was low; their recall was lower than that of Dotted_line_h. Through this, it can be determined that the detection performance of each object type using the deep artificial neural network is affected not only by the number of training data but also by the detection difficulty of the object shape.
The line recognition results for nine test P&IDs are depicted in Figure 19. In Figure 19, different colors are used for the display of different line types. The lines including continuous_line, dotted_line, double_slash_sign_line, x_sign_line, and flow arrow are presented in light green, red, pink, light blue, and dark blue, respectively. Figure 19a shows the result of recognizing lines incorporated with flow arrows. Figure 19b shows the recognition results of continuous_line and dotted_line. Figure 19c shows the recognition result of continuous_line, dotted_line, double_slash_sign_line, and lines with flow arrows. Figure 19d shows the recognition result of continuous_line, dotted_line, and x_sign_line. Figure 19e shows the recognition result of continuous_line and dotted_line.
The following is the outline of example cases where the line recognition was not performed correctly. First, there was a case where the line sign was not recognized (error case 1 in Figure 20). If the line sign was not identified, the line type could not be correctly determined. Second, there was a case where the diagonal line was not recognized (error case 2 in Figure 20). Third, a continuous line included in an object other than a line in the diagram was detected (error case 3 in Figure 20). It is considered that the problem of not recognizing the line signs or flow arrows (error case 1) is to be solved by increasing the number of training data or applying the latest network. The problem of not recognizing a diagonal line (error case 2) requires additional research for searching diagonal lines undetected in this study. Finally, the problem that a line included in an object other than a line is recognized (test case 3) is related to the results of symbol and text recognition. If there is no recognition information of a specific object in the process of removing the continuous lines overlapping with the symbol and text area, error case 3 occurs. Therefore, it is thought that error case 3 can be prevented by improving the recognition accuracy of symbols and texts.

7. Conclusions

A novel method for recognizing various types of lines in image-format P&ID was proposed. Compared with previous studies [35,38], the academic significance and unique contribution of this research lie in that the proposed method enables the recognition of various types of lines and flow arrows in addition to continuous lines. The proposed method consists of (1) a preprocessing step to remove the title and outer border, (2) a detection step to detect continuous lines, line signs, and flow arrows, and (3) a post-processing step to change line types and merge. For detection of continuous lines, line thinning, and pixel processing techniques were applied to horizontal and vertical lines, and Hough transform was used for diagonal lines. Training data was composed for line signs and flow arrows, parameters optimized for line recognition were defined, and training was performed with RetinaNet. As for the recognition results of the lines for nine test P&IDs, average precision and average recall were 96.14% and 89.59%, respectively, demonstrating high recognition performance.
For the line signs and flow arrows constructed through this study, augmentation of the training data is required because the number of data in some classes is small. Furthermore, in order to improve the recognition performance of various line signs and flow arrows, the latest deep neural network other than RetinaNet is planned to be applied. In addition, the following additional research will be conducted to shorten the line recognition time. First, time required will be shortened by changing the thinning method. Second, a method of recognizing a diagonal continuous line will also be applied to recognizing a horizontal and vertical continuous line. Third, a method to recognize all continuous lines in the diagram by applying a deep artificial neural network will be studied.

Author Contributions

The contribution of the authors for this publication article are as follows: Y.M.: methodology, software, data preparation, writing—original draft preparation, writing—reviewing and editing. J.L.: software, writing—reviewing and editing. S.L.: software, data preparation. D.M.: conceptualization, methodology, supervision, writing—original draft preparation, writing—reviewing and editing. All authors have read and agreed to the published version of the manuscript.

Funding

This research was supported by the AI-based gasoil plant O&M Core Technology Development Program (Project ID: 21ATOG-C161932-01) funded by the Korean government (MOLIT), by the Industrial Technology Innovation Program (Project ID: 20012462, 20006952) funded by the Korean government (MOTIE).

Institutional Review Board Statement

Not applicable.

Informed Consent Statement

Not applicable.

Data Availability Statement

Data sharing not applicable.

Conflicts of Interest

The authors declare no conflict of interest.

References

  1. Fujiyoshi, H.; Hirakawa, T.; Yamashita, T. Deep learning-based image recognition for autonomous driving. IATSS Res. 2019, 43, 244–252. [Google Scholar] [CrossRef]
  2. Tanzi, L.; Vezzetti, E.; Moreno, R.; Aprato, A.; Audisio, A.; Massè, A. Hierarchical fracture classification of proximal femur X-ray images using a multistage deep learning approach. Eur. J. Radiol. 2020, 133, 109373. [Google Scholar] [CrossRef]
  3. Nonis, F.; Barbiero, P.; Cirrincione, G.; Olivetti, E.C.; Marcolin, F.; Vezzetti, E. Understanding Abstraction in Deep CNN: An Application on Facial Emotion Recognition. In Progresses in Artificial Intelligence and Neural Systems; Springer: Singapore, 2021; pp. 281–290. [Google Scholar]
  4. Quiroz, I.A.; Alférez, G.H. Image recognition of Legacy blueberries in a Chilean smart farm through deep learning. Comput. Electron. Agric. 2020, 168, 105044. [Google Scholar] [CrossRef]
  5. Ejiri, M.; Kakumoto, S.; Miyatake, T.; Shimada, S.; Iwamura, K. Automatic recognition of engineering drawings and maps. In Image Analysis Applications; CRC Press: Boca Raton, FL, USA, 2020; pp. 73–126. [Google Scholar]
  6. Scherr, S.; Arendt, F.; Frissen, T.; Oramas, M.J. Detecting intentional self-harm on Instagram: Development, testing, and validation of an automatic image-recognition algorithm to discover cutting-related posts. Soc. Sci. Comput. Rev. 2020, 38, 673–685. [Google Scholar] [CrossRef]
  7. Wu, C.; Jiang, P.; Ding, C.; Feng, F.; Chen, T. Intelligent fault diagnosis of rotating machinery based on one-dimensional convolutional neural network. Comput. Ind. 2019, 108, 53–61. [Google Scholar] [CrossRef]
  8. Boyat, A.K.; Joshi, B.K. A review paper: Noise models in digital image processing. arXiv 2015, arXiv:1505.03489. [Google Scholar] [CrossRef]
  9. Gupta, S.; Girshick, R.; Arbeláez, P.; Malik, J. Learning rich features from RGB-D images for object detection and segmentation. In Proceedings of the European Conference on Computer Vision, Zurich, Switzerland, 5–12 September 2014; pp. 345–360. [Google Scholar]
  10. Dalal, N.; Triggs, B. Histograms of oriented gradients for human detection. In Proceedings of the 2005 IEEE Computer Society Conference on Computer Vision and Pattern Recognition (CVPR’05), San Diego, CA, USA, 20–25 June 2005; Volume 1, pp. 886–893. [Google Scholar]
  11. Lowe, D.G. Object recognition from local scale-invariant features. In Proceedings of the Seventh IEEE International Conference on Computer Vision, Kerkyra, Greece, 20–27 September 1999; Volume 2, pp. 1150–1157. [Google Scholar]
  12. Ojala, T.; Pietikainen, M.; Maenpaa, T. Multiresolution gray-scale and rotation invariant texture classification with local binary patterns. IEEE Trans. Pattern Anal. Mach. Intell. 2002, 24, 971–987. [Google Scholar] [CrossRef]
  13. Froba, B.; Ernst, A. Face detection with the modified census transform. In Proceedings of the Sixth IEEE International Conference on Automatic Face and Gesture Recognition, Seoul, Korea, 19 May 2004; pp. 91–96. [Google Scholar]
  14. Wang, L. (Ed.) Support Vector Machines: Theory and Applications; Springer: New York, NY, USA, 2015; Volume 177, pp. 1–47. [Google Scholar]
  15. Li, X.; Wang, L.; Sung, E. AdaBoost with SVM-based component classifiers. Eng. Appl. Artif. Intell. 2008, 21, 785–795. [Google Scholar] [CrossRef] [Green Version]
  16. Zhiqiang, W.; Jun, L. A review of object detection based on convolutional neural network. In Proceedings of the 2017 36th Chinese Control Conference (CCC), Dalian, China, 26–28 July 2017; pp. 11104–11109. [Google Scholar]
  17. Szegedy, C.; Toshev, A.; Erhan, D. Deep Neural Networks for Object Detection. In Proceedings of the 26th Neural Information Processing Systems Conference (NIPS 2013), Stateline, NV, USA, 5–10 December 2013; pp. 2553–2561. [Google Scholar]
  18. Girshick, R.; Donahue, J.; Darrell, T.; Malik, J. Rich feature hierarchies for accurate object detection and semantic segmentation. In Proceedings of the IEEE Conference on Computer Vision and Pattern Recognition, Columbus, OH, USA, 23–28 June 2014; pp. 580–587. [Google Scholar]
  19. Girshick, R. Fast r-cnn. In Proceedings of the IEEE International Conference on Computer Vision, Santiago, Chile, 7–13 December 2015; pp. 1440–1448. [Google Scholar]
  20. Ren, S.; He, K.; Girshick, R.; Sun, J. Faster r-cnn: Towards real-time object detection with region proposal networks. arXiv 2015, arXiv:1506.01497. [Google Scholar] [CrossRef] [Green Version]
  21. Redmon, J.; Divvala, S.; Girshick, R.; Farhadi, A. You Only Look Once: Unified, Real-Time Object Detection. In Proceedings of the IEEE Conference on Computer Vision and Pattern Recognition (CVPR), Las Vegas, NV, USA, 27–30 June 2016; pp. 779–788. [Google Scholar]
  22. Liu, W.; Anguelov, D.; Erhan, D.; Szegedy, C.; Reed, S.; Fu, C.Y.; Berg, A.C. Ssd: Single shot multibox detector. In Proceedings of the European Conference on Computer Vision, Amsterdam, The Netherlands, 8–16 October 2016; pp. 21–37. [Google Scholar]
  23. Lin, T.Y.; Goyal, P.; Girshick, R.; He, K.; Dollár, P. Focal loss for dense object detection. In Proceedings of the IEEE International Conference on Computer Vision, Venice, Italy, 22–29 October 2017; pp. 2980–2988. [Google Scholar]
  24. Zhao, Q.; Sheng, T.; Wang, Y.; Tang, Z.; Chen, Y.; Cai, L.; Ling, H. M2det: A single-shot object detector based on multi-level feature pyramid network. In Proceedings of the AAAI Conference on Artificial Intelligence, Honolulu, HI, USA, 27 January–1 February 2019; Volume 33, pp. 9259–9266. [Google Scholar]
  25. Illingworth, J.; Kittler, J. A survey of the Hough transform. Comput. Vis. Graph. Image Process. 1988, 44, 87–116. [Google Scholar] [CrossRef]
  26. Narote, S.P.; Bhujbal, P.N.; Narote, A.S.; Dhane, D.M. A review of recent advances in lane detection and departure warning system. Pattern Recognit. 2018, 73, 216–234. [Google Scholar] [CrossRef]
  27. Zhang, T.Y.; Suen, C.Y. A fast parallel algorithm for thinning digital patterns. Commun. ACM 1984, 27, 236–239. [Google Scholar] [CrossRef]
  28. Tang, J.; Li, S.; Liu, P. A Review of Lane Detection Methods based on Deep Learning. Pattern Recognit. 2020, 111, 107623. [Google Scholar] [CrossRef]
  29. Ko, Y.; Jun, J.; Ko, D.; Jeon, M. Key points estimation and point instance segmentation approach for lane detection. arXiv 2020, arXiv:2002.06604. [Google Scholar]
  30. Qu, Z.; Jin, H.; Zhou, Y.; Yang, Z.; Zhang, W. Focus on Local: Detecting Lane Marker from Bottom Up via Key Point. In Proceedings of the IEEE/CVF Conference on Computer Vision and Pattern Recognition, Nashville, TN, USA, 21–24 June 2021; pp. 14122–14130. [Google Scholar]
  31. Liu, L.; Chen, X.; Zhu, S.; Tan, P. CondLaneNet: A Top-to-down Lane Detection Framework Based on Conditional Convolution. arXiv 2021, arXiv:2105.05003. [Google Scholar]
  32. Tornbre, K. Technical drawing recognition and understanding: From pixels to semantics. In Proceedings of the Workshop on Machine Vision and Application, Tokyo, Japan, 7–9 December 1992; pp. 393–401. [Google Scholar]
  33. Fahn, C.S.; Wang, J.F.; Lee, J.Y. A topology-based component extractor for understanding electronic circuit diagrams. Comput. Vis. Graph. Image Process. 1988, 44, 119–138. [Google Scholar] [CrossRef]
  34. Lee, S.W.; Kim, J.H.; Groen, F.C. Translation-, rotation-and scale-invariant recognition of hand-drawn symbols in schematic diagrams. Int. J. Pattern Recognit. Artif. Intell. 1990, 4, 1–25. [Google Scholar] [CrossRef]
  35. Kang, S.O.; Lee, E.B.; Baek, H.K. A Digitization and Conversion Tool for Imaged Drawings to Intelligent Piping and Instrumentation Diagrams (P&ID). Energies 2019, 12, 2593. [Google Scholar]
  36. Fu, L.; Kara, L.B. From engineering diagrams to engineering models: Visual recognition and applications. Comput. Aided Des. 2011, 43, 278–292. [Google Scholar] [CrossRef]
  37. Rahul, R.; Paliwal, S.; Sharma, M.; Vig, L. Automatic Information Extraction from Piping and Instrumentation Diagrams. arXiv 2019, arXiv:1901.11383. [Google Scholar]
  38. Yu, E.S.; Cha, J.M.; Lee, T.; Kim, J.; Mun, D. Features recognition from piping and instrumentation diagrams in image format using a deep learning network. Energies 2019, 12, 4425. [Google Scholar] [CrossRef] [Green Version]
  39. Yun, D.Y.; Seo, S.K.; Zahid, U.; Lee, C.J. Deep Neural Network for Automatic Image Recognition of Engineering Diagrams. Appl. Sci. 2020, 10, 4005. [Google Scholar] [CrossRef]
  40. Kim, H.; Lee, W.; Kim, M.; Moon, Y.; Lee, T.; Cho, M.; Mun, D. Deep learning-based recognition of symbols and texts at an industrially applicable level from high-density piping and instrumentation diagram images. Expert Syst. Appl. 2021, 183, 115337. [Google Scholar] [CrossRef]
  41. Zlocha, M.; Dou, Q.; Glocker, B. Improving RetinaNet for CT lesion detection with dense masks from weak RECIST labels. In Proceedings of the International Conference on Medical Image Computing and Computer-Assisted Intervention, Shenzhen, China, 13–17 October 2019; pp. 402–410. [Google Scholar]
Figure 1. Definition of line objects to be recognized in P&IDs.
Applsci 11 10054 g001
Figure 2. Problems when recognizing line objects using image processing techniques only. (a) An image of P&ID. (b) Recognized continuous lines.
Applsci 11 10054 g002
Figure 3. Procedure for recognizing line objects.
Applsci 11 10054 g003
Figure 4. Composition of training data.
Applsci 11 10054 g004
Figure 5. Bounding box sizes for line signs and flow arrows.
Applsci 11 10054 g005
Figure 6. Summary of an initial dataset for line objects.
Applsci 11 10054 g006
Figure 7. Change of bounding box set for the dotted line.
Applsci 11 10054 g007
Figure 8. Image modification for training data augmentation.
Applsci 11 10054 g008
Figure 9. Summary of a final dataset of line objects.
Applsci 11 10054 g009
Figure 10. Removal of outline border and title area. (a) An image of P&ID. (b) After detecting one pixel of the outline, all connected pixel values are stored. (c) Detects and removes the title and outline area by performing the opening operation of the morphology operation. (d) Result of removing outline and title area of image drawing.
Applsci 11 10054 g010
Figure 11. Lining thinning.
Applsci 11 10054 g011
Figure 12. The process to recognize continuous diagonal lines. (a) Construct a diagonal candidate set using the Hough transform. (b) Draw a continuous diagonal line on the empty image. (c) Find a diagonal line from the candidate set that overlaps for a diagonal line of the diagrams. (d) Find the start and end points of the detected diagonal line.
Applsci 11 10054 g012
Figure 13. Removal of continuous lines corresponding to texts and symbols. (a) Both points of a continuous line are inside bounding boxes of symbols and texts. (b) Both points of a continuous line are not inside bounding boxes of symbols and texts.
Applsci 11 10054 g013
Figure 14. Change of line types and addition of flow directions using a deep learning model.
Applsci 11 10054 g014
Figure 15. The architecture of RetinaNet [23].
Applsci 11 10054 g015
Figure 16. Merging multiple lines of the same type into one line. (a) Multiple dotted lines. (b) One dotted line after merging.
Applsci 11 10054 g016
Figure 17. Line recognition data format.
Applsci 11 10054 g017
Figure 18. Test P&IDs used for the experiment.
Applsci 11 10054 g018
Figure 19. Line recognition results for test P&IDs.
Applsci 11 10054 g019
Figure 20. Representative image of recognition results for test P&IDs.
Applsci 11 10054 g020
Table 1. Parameters of the deep neural network used for learning.
ParameterValue
Diagram resolution9933 × 7016
Segmentation resolution512 × 512
Segmentation stride300
Epoch, step50, 2500
AnchorSize322, 642, 1282, 2562, 5122
Stride8, 16, 32, 64, 128
Ratio0.289, 0.581, 1.0, 1.721, 3.457
Scale0.949, 1.182, 1.543
Threshold score0.5
IOU threshold0.5
Table 2. Performance evaluation result for test P&IDs.
Test P&IDPrecisionRecall
10.96570.9038
20.97320.9316
30.97870.9150
40.95310.8592
50.97090.9009
60.91830.8654
70.97710.8649
80.94120.9195
90.97500.8931
Average0.96140.8959
Table 3. Performance evaluation result by line sign and flow arrow types in test P&IDs.
Test P&IDObject Number
in Training Dataset
PrecisionRecallRank
X_sign_line_h8401.01.01
Dotted_line_h31,8961.00.96478
Dotted_line_v38,9161.01.01
Double_slash_sign_line_h6841.01.01
Double_slash_sign_line_v17221.00.85729
Arrow_e22681.01.01
Arrow_w21481.01.01
Arrow_s49141.00.96667
Arrow_n34141.01.01
Publisher’s Note: MDPI stays neutral with regard to jurisdictional claims in published maps and institutional affiliations.

