Article

Comparison of Structure and Magnetic Properties of Ni/C Composites Synthesized from Wheat Straw by Different Methods

1
Faculty of Electrical Engineering, Częstochowa University of Technology, 42-201 Częstochowa, Poland
2
Department of Applied Mathematics and Fundamental Sciences, Lviv Polytechnic National University, 79013 Lviv, Ukraine
3
Faculty of Physics, Ivan Franko Lviv National University, 79005 Lviv, Ukraine
*
Author to whom correspondence should be addressed.
Appl. Sci. 2021, 11(21), 10031; https://doi.org/10.3390/app112110031
Submission received: 17 September 2021 / Revised: 19 October 2021 / Accepted: 23 October 2021 / Published: 26 October 2021
(This article belongs to the Special Issue Advances in Magnetic Nanomaterials and Nanostructures)

Abstract

:
Synthesis of Ni/C nanostructured composites based on a natural raw material, i.e., wheat straw, is carried out in this work. The synthesis is performed by one- and two-stage methods using NiCl2 as the activating agent. The X-ray diffraction and EDS analyses reveal the presence of metallic nickel in the structure of the composites, whereas magnetic measurements showed that nickel was contained in the porous carbon matrix in the nanoparticle state. For nanocomposites synthesized by the one-stage method, the largest contribution to the formation of the porous structure might be attributed to pores with radii from 5 to 30 nm; for a nanocomposite synthesized in two stages, the pore distribution function exhibits a narrow isolated peak with a maximum of around 2.6 nm. Based on the obtained magnetic data, the coercive force, specific saturation magnetization and nickel content in nanocomposites are calculated. For the measured values of the coercive force, the average size of magnetic moment carriers is determined to be ~100 nm for the two-stage synthesis nanocomposite and ~100 ÷ 110 nm for the one-stage synthesis nanocomposites. The developed Ni/C nanocomposites might be used as a cheap material for energy storage applications or as magnetically controlled adsorbents.

1. Introduction

The synthesis of nanosized metals, as well as their oxides and hydroxides, in different highly porous matrices and the study of their physicochemical properties are important issues in modern nanomaterials science. Since these nanostructured composites (NC) possess unique catalytic, magnetic and electrode features, they outperform macroscopic metal powders and their compounds in many aspects. The use of highly porous matrices for the synthesis of such NC allows one to overcome two important problems in the use of metal nanoparticles. Firstly, a highly developed surface of these particles makes them more chemically active in comparison to macroscopic materials, which leads to their complete or partial oxidation. Secondly, metal nano-powders undergo processes of spontaneous agglomeration, which leads to the loss of some unique physicochemical properties and complicates their further application. The composites which use transition metals, their oxides or hydroxides as the active substances, are widely used as catalysts, devices for recording and storing information, active materials for supercapacitor electrodes and magnetically sensitive adsorbents [1,2,3,4,5,6,7,8].
A relatively simple approach to obtain highly porous metal/carbon composites is the method based on metal ions reduction from solutions of their salts in a carbon matrix. The first important factor to take into account is the accessibility of the carbon material surface for ions, as well as the chemical composition of the surface groups. For example, it was shown in [9] that different surface groups had different effects on the reduction of palladium. Therefore, by modifying the surface of the carbon matrix, for example, by treating it with acids, it is possible to increase the reducing properties of the matrix for the synthesis of NC metals [10,11]. However, this method is suitable mainly for noble metals. For transition metals, more complex conditions are required: high temperatures, complex solvents, the presence of excipients, for example, sodium acetate [12].
Another method traditionally used to produce carbon materials is pyrolysis. Encapsulated nanoparticles of metals and their alloys can be obtained using pyrolysis. In [13], nanoparticles of NiFe solid solution, 10–20 nm in diameter, covered with a thin carbon shell approximately 6 nm thick, were obtained by Na2Fe(CN)5NO and Ni(NO3)2 pyrolysis on the surface of gamma-aluminum. The pyrolysis can be combined with detonation technology, as demonstrated in [14]. To that end, the authors used a mixture of picric acid (2,4,6-trinitrophenol) and ferrocene, which was placed in a closed vessel and heated to 290 °C. At this temperature, the acid explosion occurred, which led to an increase in pressure up to 40 MPa and temperature up to 1000 °C. Such conditions caused the decomposition of ferrocene and formation of encapsulated 5–20 nm iron nanoparticles. The carbon nanotubes with a diameter of 40–100 nm also formed in the process of detonation. Their amount depended on the acid/ferrocene ratio.
Notwithstanding the significant advances in the synthesis of transition metals NC, many scientists are looking for technologically simpler, cheaper and, most importantly, environmentally friendly ways to obtain NC with high performance characteristics. To achieve this goal, various natural materials [15,16], ready-made porous carbon materials [17], metal foams [18] or polymer matrices [19] are used as substrates. It has been established that the properties of the obtained NC largely depend on the properties of the matrix used and the synthesis method; therefore, it is extremely important to study the structure and properties of NC according to the conditions for their preparation.
Since natural materials are easily accessible, cheap and belong to renewable raw materials, the aim of this work was the synthesis of Ni/C nanocomposite material from wheat straw by different methods based on pyrolysis and the study of the structural, adsorption and magnetic characteristics of synthesized composites.

2. Materials and Methods

2.1. Sample Preparation Techniques

Nickel chloride was used as an activator for the synthesis of Ni/C NC from natural materials [16]. The synthesis was carried out in one stage by pyrolysis with steam-gas activation. It was noted that nickel chloride not only provided the formation of magnetic moment carriers in carbon, but also contributed to the development of carbon material surface and reduction of the amount of impurities present in the initial raw materials.
However, the use of other activators in the synthesis of activated carbon is often more effective using the two-stage synthesis method. This method is most commonly used in KOH or NaOH activation [20,21] and consists in the preliminary carbonization of the initial raw material at 300–500 °C; then, the char is mixed with alkali in a certain proportion, placed in an oven and activated in an inert atmosphere at 600–1000 °C. As the result, a highly porous activated carbon is obtained, which is both an effective sorbent and active material of supercapacitor electrodes. In [22], the one- and two-stage synthesis was performed using FeCl3. It was shown that, as a result of both types of synthesis, Fe/C NC was obtained, in which iron ions were in the state of Fe3O4 magnetite. However, the two-stage synthesis gives a significantly larger specific surface area and smaller magnetite nanoparticles compared to these parameters for the sample obtained by the one-stage synthesis.
Based on the results of [22], the synthesis of Ni/C NC was performed by the afore-mentioned one- and two-stage methods using nickel chloride NiCl2 (anhydrous, powder, 99.99% trace metals basis) as an activator. The wheat straw granules were used as the initial raw material (cf. Figure 1).
At the first stage, wheat straw granules were carbonized in an inert atmosphere (argon) for 90 min at 400 °C. As the result, the weight of the obtained char was determined to be ≈50% of the initial weight of the initial raw material.
Based on these data, the samples were prepared for further activation:
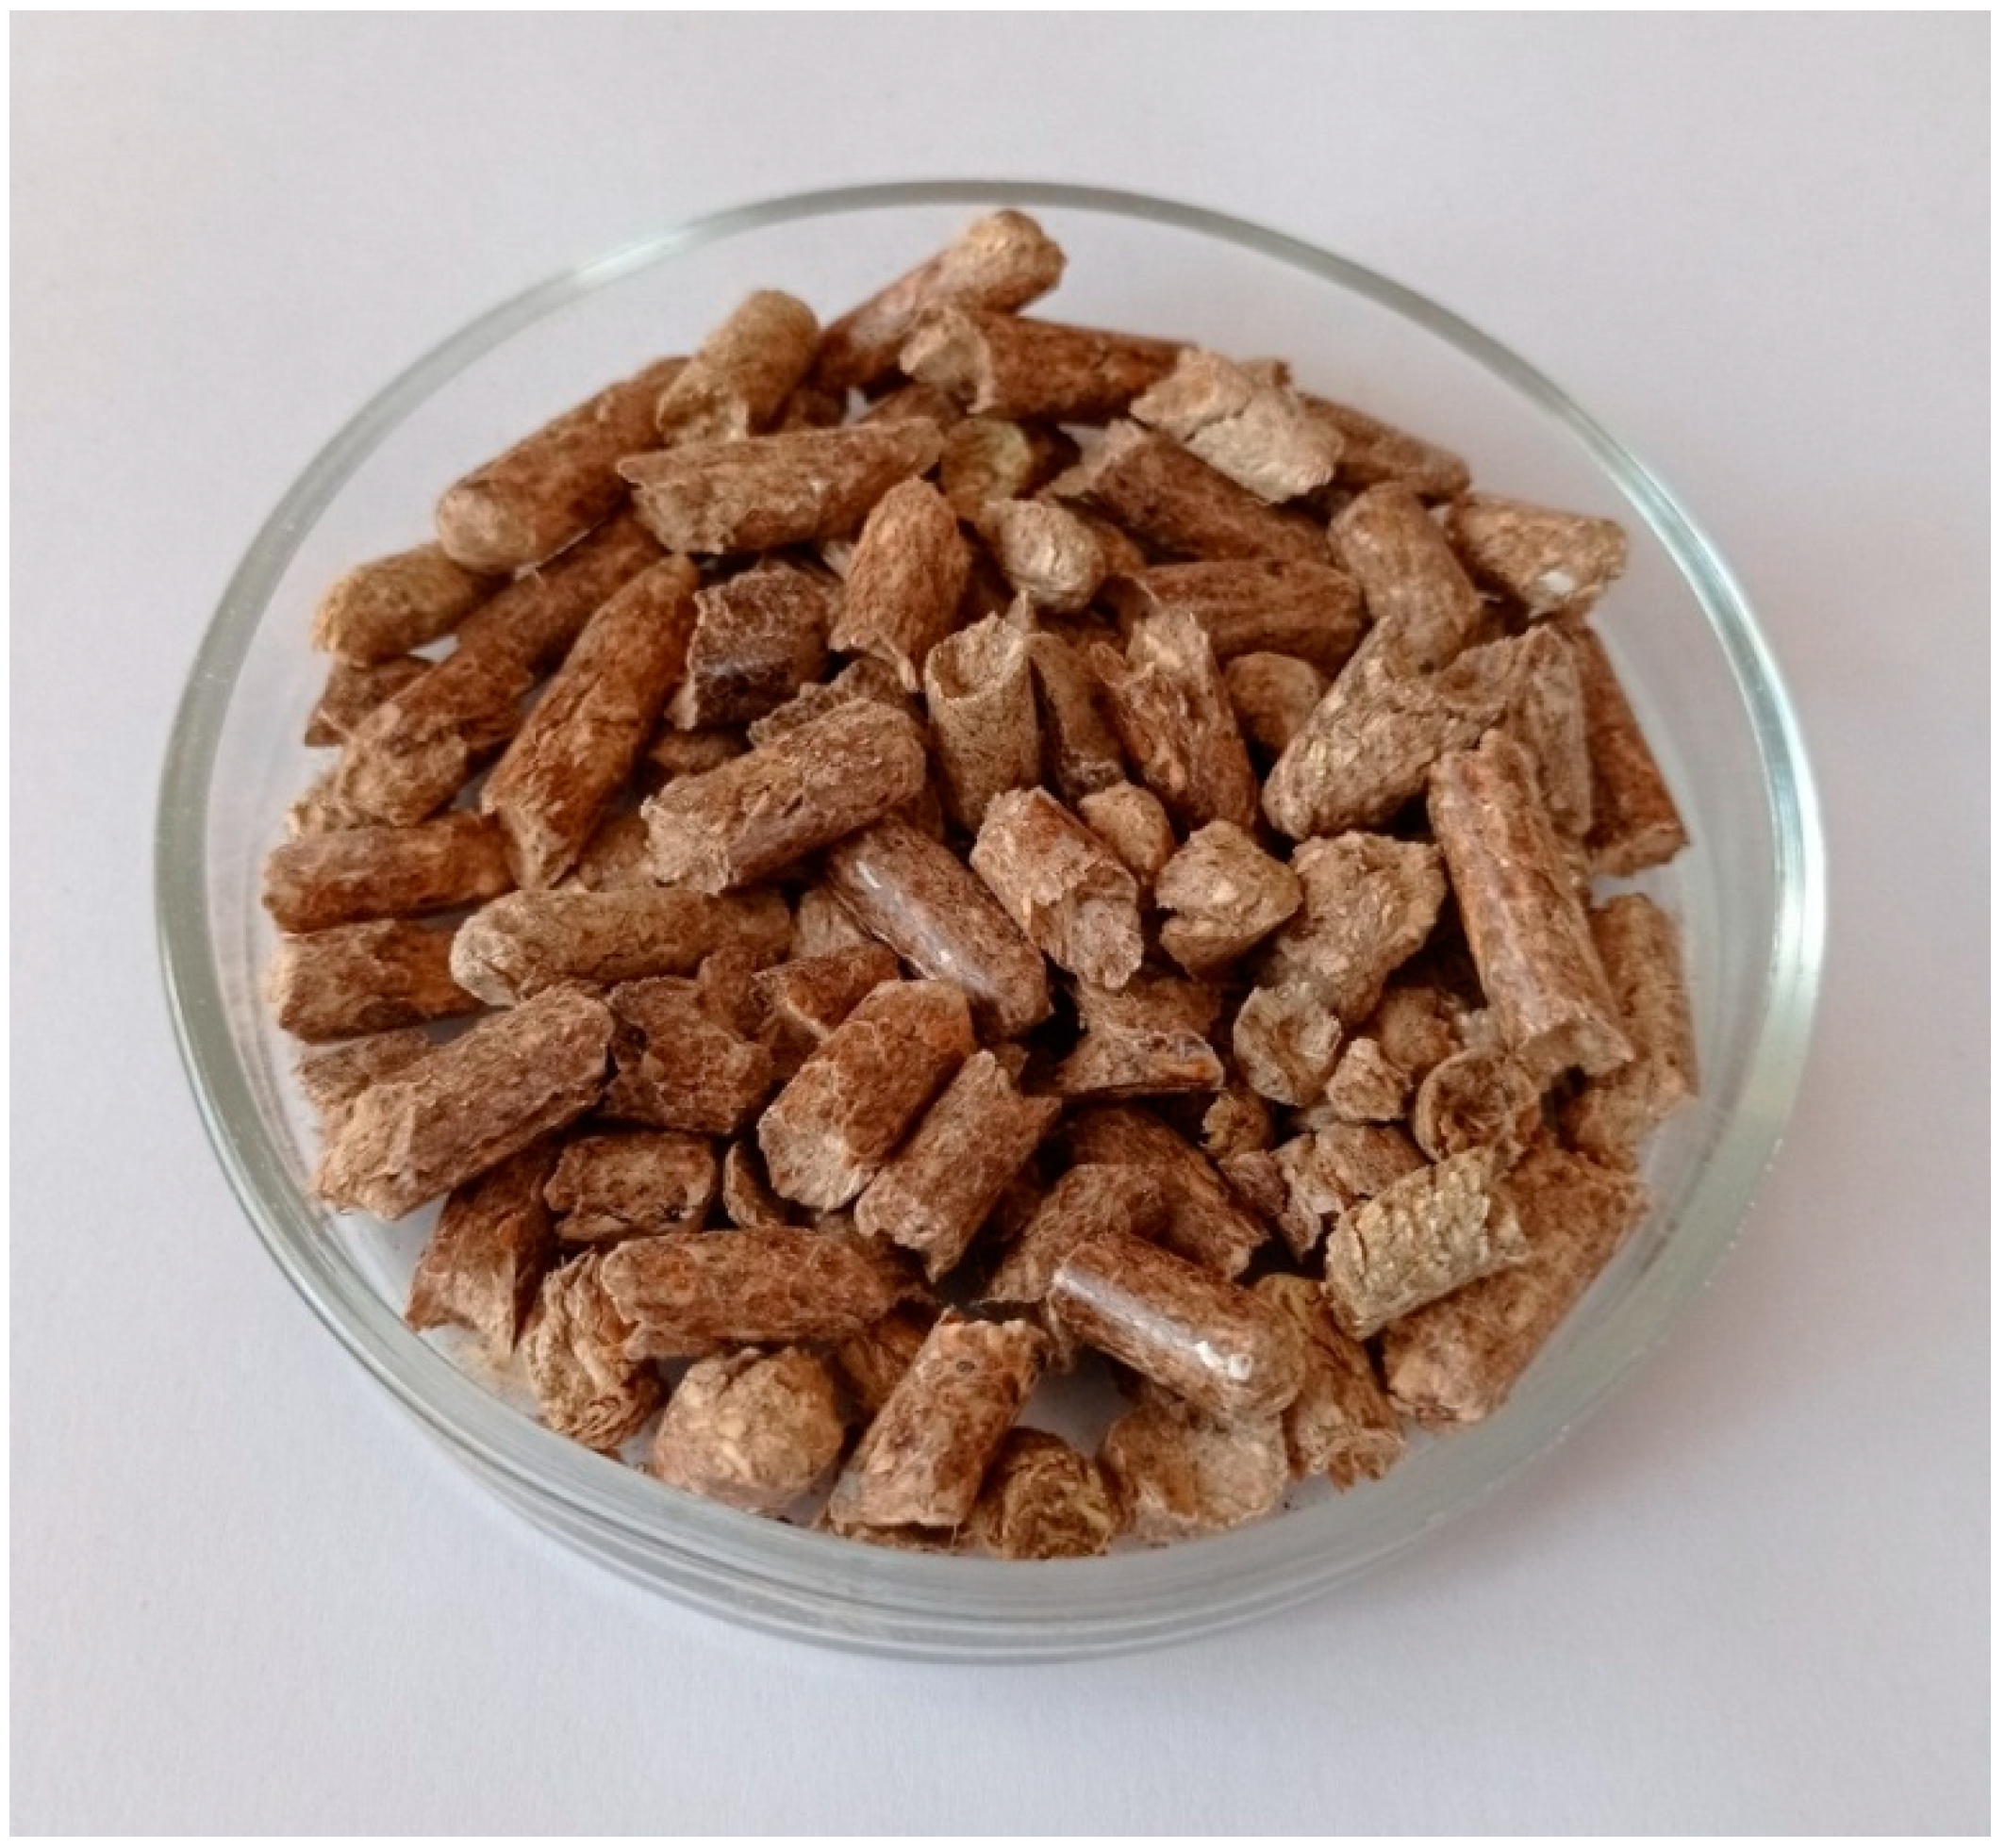
  • The initial wheat straw granules were poured over with an aqueous solution of NiCl2 with the salt/raw material ratio 1:10, as had been carried out successfully for other natural precursors in the work [16] (sample NC1_10);
  • Since there is a loss of ≈50% of the initial weight of the raw material in the process of preliminary carbonization, the char of wheat straw granules was poured over with an aqueous solution of NiCl2 with the salt/char ratio 1:5, which in terms of weight of the initial raw material would correspond to the same concentration as in the sample NC1_10 (sample NC2);
  • To compare the effect of a higher concentration of the activator (as in the sample NC2), the initial granules of wheat straw were poured over with an aqueous solution of NiCl2 with the salt/raw material ratio 1:5 (sample NC1_5).
The materials prepared in this way were kept at room temperature for 48 h and then dried at 110 °C until a constant weight. NC was synthesized at 700 °C and kept at this temperature for 90 min with additional steam-gas activation, which was provided by the supply of water aerosol in argon atmosphere from an ultrasonic aerosol generator to the reactor during carbonization. The gaseous by-products were withdrawn out of the reactor with Ar flow through a hydro-seal. The argon overpressure in the reactor was kept at the level of 1 kPa and the gas flow rate was in the range 2–10 l/min. As-obtained composites were boiled in distilled water for 30 min in a flask with a reflux condenser. Then, they were dried until the constant weight at 100 °C. For further experimental studies, the composites were milled mechanically in a porcelain mortar.

2.2. Methods of Experimental Study

The Phenom ProX scanning electron microscope from ThermoFisher Scientific, Waltham, Mass., U.S. integrated with the EDS analysis system was used for obtaining images of synthesized carbon.
The parameters of the porous structure of synthesized NC (specific surface area, total pore volume, pore size distribution, average pore radius) were estimated using isothermal processes of nitrogen adsorption/desorption at the boiling point (T = 77 K). The Quantachrome NOVAtouch LX2 specific surface area and pore size automated analyzer were used for this purpose. Before the measurements, the test samples were degassed in vacuum at the temperature of 473 K for 16 h.
X-ray structural studies were carried out both for raw material and synthesized NC. The X-ray diffraction patterns were obtained by means of the DRON-3 X-ray automated diffractometer with CuKα-radiation (λ = 1.5418 Å) monochromatized by the reflection from the (002) plane of a single crystal of pyrolytic graphite mounted on a diffracted beam. In order to measure the X-ray diffraction patterns over a wide range of scattering angles, the method availing of ray reflection from the sample surface was used. For this purpose, the powder samples were placed in cuvettes made of organic glass, 2 mm deep. In order to fix the samples, a layer of Vaseline oil was applied to the cuvette bottom and the surface was leveled with a glass slide. The diffraction patterns were recorded in the mode of continuous movement of the detector with an angular velocity of 2 deg/min. The method of research of powder samples is described in detail in the monograph [23].
The method of ray transmission through the sample was used to determine the small-angle X-ray scattering (SAXS) spectra. The SAXS spectra were measured using a DRON-3 automated diffractometer equipped with three-slit collimators of primary and scattered radiation. To monochromatize the scattered CuKα-radiation, a flat single crystal of pyrolytic graphite mounted on a diffracted beam was used. The powder samples were placed in a cuvette 1.5 mm thick, whose inlet and outlet windows were sealed with a polyethylene film 50 μm thick. The scattering at the film could be neglected due to the very low absorption capacity of the material. The correction for background scattering and collimation correction for the height of the detector receiving slit were made in the scattering intensity curves.
Magnetic parameters (hysteresis loop, saturation magnetization, coercive force) were measured using a vibrating sample magnetometer at 73 Hz frequency and at room temperature. Pure non-porous nickel was used as reference for calibration. The specific saturation magnetization was measured at the magnetic field strength equal to 800 kA/m. The description of the equipment and measurement techniques are discussed in detail in [16].

3. Results and Discussion

The diffraction pattern of the original sample is presented in Figure 2. The analysis of phase composition revealed that the dominant phase in the original sample is cellulose i.e., a linear polysaccharide whose molecular composition is (C6H10O5)n [24]. The diffraction pattern of the sample shows a number of diffraction maxima characteristic of this phase, in particular maxima with angular position 2θ ≈ 16.1° (d ≈ 5.5 Å), 2θ ≈ 22.3° (d ≈ 4.0 Å), 2θ ≈ 28.9° (d ≈ 3.1 Å), 2θ ≈ 34.7° (d ≈ 2.6 Å). Apart from maxima related to the crystalline phase, the diffraction pattern reveals broad diffuse maxima corresponding to scattering by the regions exhibiting amorphous structure. They are located close to the scattering angles 2θ ≈ 19.1° and 2θ ≈ 43.6°. Therefore, the structure of the original sample has both amorphous and crystalline features. In order to determine the crystallinity level of the cellulose, the Ruland–Wonka method was used [25]. This approach relies on a comparison of the total integral scattering intensity (with background contribution removed) to the full integral scattering intensity of the amorphous phase. A measure for comparison is the ratio = / I o , where I o stands for the total integral scattering intensity with removed background contribution and I a is the total integral scattering intensity for the amorphous phase. In order to remove the background scattering contribution, the DHN_ADS software was used.
Figure 3 depicts the diffraction pattern of the input raw material in the form of a superposition of diffraction maxima from the crystalline and the amorphous phases. For the analytical description of the profiles, the Lorenz function was used. The presented approach allows one to determine the angular positions, half-widths and integral intensities of the maxima. From the computations, the values of the crystallinity degree were determined as = 37.2 % . Moreover, the size of the coherent scattering region for the crystalline component of the sample was estimated from the half-width of the most distinctive maximum of the crystalline phase (2θ ≈ 22.3°) from the Debye–Scherer formula L = λ / ( β cos Θ ) , where λ = 1.5418   Å and β is the half-width of the maximum. From the computations, it follows that L 4.2   ±   0.4 nm, which indicates that the nanocrystalline structure is being developed.
The obtained SEM images are shown in Figure 4. As it can be seen from this figure, the synthesized nanocomposites mimic the shape of particles of the initial raw material, regardless of the synthesis method. In addition, the synthesis methods used preserve the developed macro-porous structure of wheat straw. The macropores certainly have a small area (up to 2 m2/g), yet they are good transport pores for ions and small molecules, for example, in the case of using synthesized composites as adsorbents or catalysts.
In addition, the EDS analysis data presented in Figure 4 show the presence of Ni ions in the basic substance. This confirms the fact that nickel entered the structure of the synthesized nanocomposite and was not washed out upon washing of the samples before the test. In addition, in NC1_10 and NC1_5 nanocomposites, nickel content is more concentrated than in NC2. This may indicate a better insertion of nickel into the initial natural raw material compared with a pre-carbonized material.
In the X-ray diffraction patterns of synthesized NC samples (Figure 5), apart from diffuse peaks of the disordered carbon phase, there are a number of distinct peaks (111), (200), (220), (311), and (222) of polycrystalline nickel, the presence of which causes ferromagnetic properties of the samples.
For a more detailed analysis of the disordered structure of carbon phase, Figure 6 shows the diffuse peaks of synthesized NC in the form of a superposition of two Gaussian peaks. A characteristic feature of patterns is the presence at small scattering angles (2θ ≈ 11°) of the so-called pre-peak in the main peak, the position of which corresponds to the diffraction angles 2θ ≈ 22.0–22.5°. The parameters of peaks (angular positions 2θ, interplanar distances d, half width at half maximum FWHM, relative integrated intensity I/Io) are presented in Table 1.
The occurrence of an additional peak (pre-peak) on the left side of the main peak may indicate the formation of a cluster structure of the carbon phase. The effects of this type are often observed in the diffraction patterns of amorphous metal alloys of the Al-TM-RZM system (TM—a transition element, RZM—a rare-earth element) [26,27]. The chemically ordered clusters with a predominant interaction of Al-RZM atoms are formed in these alloys. It is possible that, in the studied materials, along with the short-range atomic order, the so-called intermediate order is observed, caused by the correlation in the arrangement of carbon atoms at distances significantly exceeding the typical interatomic distances. As seen in Table 1, the angular position of the pre-peak corresponds to the interplanar distance approximately twice as great as the corresponding value for the main peak dprep. ≈ 2do. The dprep value can be considered as a characteristic spatial scale of the intermediate order. Thus, if the main peak occurs due to the interference of scattered X-rays by atoms inside the cluster, then the occurrence of a pre-peak indicates the effect of inter-cluster scattering.
The position of the main peak in all the samples corresponds to the distance between the graphene layers in the range do ≈ 0.38–0.400 nm. As it can be seen, the interlayer distances are much greater than the distances between the layers in polycrystalline graphite (d(002) ≈ 0.335 nm), which is the evidence of a disordered structure of the samples. The correlation distance, which corresponds to the characteristic size of carbon clusters (Lc), can be estimated by the half-width of the additional maximum. As seen in Table 1, in a number of samples NC1_10→NC1_5→NC2, an increase in the size of clusters from 1.3 to 2.2 nm is observed, which can be explained as an increase in the degree of their atomic ordering. On the other hand, there is a decrease in the pre-peak contribution to the integrated intensity of the diffuse peak, which may be associated with a decrease in the volume fraction of cluster structural units.
The analysis of X-ray diffraction patterns indicated the presence of metallic nickel in the structure of all samples.
The mechanism of metallic Ni formation is most likely the same as that of metallic Fe [28]: at high temperatures, nickel is reduced to zero valence by carbon. The parameters of the unit cells of Ni phase in different samples were calculated by the angular positions of Ni lines (Table 2). A clear tendency to an increase in the Ni cell parameter in a number of samples NC1_10→NC1_5→ NC2 (Table 3) was observed. The calculation of average grain sizes and relative micro-deformation of Ni crystal lattice by half-widths of (111) and (222) Ni lines was performed using the Laue method. The obtained results revealed an increase in the grain size and a decrease in the relative deformation of the lattice during the transition from the sample NC1_10 to NC2.
Figure 7 shows the dependence of the intensity of scattering by the samples on the wave vector modulus after the collimation correction for the height of the detector receiving slit, made on the basis of the SAXS patterns. All scattering intensity curves I(s) are presented in double logarithmic scales. As seen in Figure 5, in the range of wave vectors s < s0 (s0 ≈ 0.55 nm−1), the small-angle patterns of samples NC1_10 and NC1_5 almost coincide and are characterized by a higher scattering intensity compared with the NC2 sample. At the same time, the NC2 sample is characterized by a significantly higher scattering intensity in the range of values s > s0. This result can be explained by an increase in the relative fraction of electron density inhomogeneities (pores), a typical size of which is less than L = 2π/s0 ≈ 11.5 nm.
The distribution functions of effective pore radii were calculated by an integral equation using an indirect Fourier transform, which integrates the scattering intensity with the pore distribution function in a polydisperse system of spherical particles:
I ( s ) = 0 R m a x i 0 ( s R ) m ( r ) D v ( R ) d R  
where I ( s ) is the scattering intensity, i o ( s R ) is the form factor of scattering by a polydisperse spheres system, D v ( R ) = π R 3 N ( R ) is the volume function of pore distribution, and N ( R ) is the number of pores with effective radius R .
The functions Dv(R) were calculated using the GNOM software package. The average pore radius was determined by the formula:
R g s = [ k = 1 N D k k = 1 N ( D k / R k 3 ) ] 1 3 ,
where N is the number of experimental points of the curve D v ( R ) .
Our qualitative analysis of SAXS patterns is confirmed by the calculation of volume functions of the effective pore radii distribution (Figure 8). As can be seen, samples NC1_10 and NC1_5 are characterized by a wide distribution of pore radii in the range up to 50 nm. The largest volume contribution to the formation of the porous structure is observed from pores the radii of which are in the range from 5 to 30 nm. At the same time, a significantly different volume distribution of pores is observed for the NC2 sample. The distribution function Dv(R) of the NC2 sample contains a narrow isolated peak with a maximum of ≈2.6 nm. Thus, the pores R ≈ 2.6 nm make the main contribution to the formation of the porous structure of NC2 sample. The height of the peak Dv(R) of NC2 sample shows a more than two-fold increase in the concentration of micropores compared with NC1_10 and NC1_5 samples. At the same time, the concentration of mesopores with radii from 5 to 50 nm is approximately twice as low. As a result, a decrease in the average pore radius is observed in a number of samples NC1_10→NC1_5→NC2 from Rc = 7.5 nm to Rc = 3.7 nm (Table 4).
Another important characteristic of a porous structure is the specific surface area and pore volume. To calculate the specific surface area, the asymptotic behavior of scattering intensity was used, since the relation known as the Porod’s law is satisfied for s → ∞ [29]:
I ( s ) = I ρ + K p s 4 ,
where Iρ is a constant value characterizing the contribution of atomic scattering to the small-angle scattering intensity, and the Porod constant Kp is proportional to the total pore surface area [29]. The calculation of the parameters Iρ and Kp is performed by creating dependency graphs s 4 I ( s ) = f ( s 4 ) . Then, having selected the linear sections on the graphs when s , I p and K p parameters can be determined using the least squares method. Having determined the Porod constant, the Porod invariant can be calculated:
Q p = 0 s max s 2 I ( s ) ds + K p s max ,
where s max is the maximum value of the wave vector. The specific surface area of pores is calculated by the formula:
S p = S m = π w K p ρ m Q p ,
where w = 1 ρ m ρ x is the pore volume fraction, ρ m is the real density, and ρ x is the structural density.
Table 4 presents the obtained results of calculating the integral invariants of the scattering curves for the studied NC. As seen in Table 4, a decrease in the integral intensity (the Porod invariant Qp) is observed in NC2 sample, which can be explained by a decrease in the fraction of large inhomogeneities (mesopores). However, the total area of pores increases, as indicated by the value of the Porod constant Kp. As a result, almost a two-fold increase in the specific surface area of pores is observed in the NC2 sample compared with other synthesized NC.
The peculiarity of the small-angle X-ray scattering method described above is that it is sensitive to both closed and open pores. However, the presence of closed pores in the nanocomposite makes it unsuitable for use as an adsorbent or catalyst. In this case, it is important to study other adsorption methods that would provide information about open pores. One of the simple and reliable methods is the method of adsorption/desorption of gases, such as nitrogen. The gas molecules will interact only with the surface of the porous material accessible to them, and this will give information about the presence and distribution by the size of open pores in it.
At the first stage of this study, adsorption/desorption isotherms are obtained, which are shown for the synthesized biocarbon nanocomposites in Figure 9. All isotherms can be classified by the isotherm shapes as type I according to the IUPAC classification, which are typical of microporous solids. All isotherms are characterized by the discrepancy of adsorption and desorption branches, especially in the area of low relative pressure. Such isotherm behavior is called low pressure hysteresis, and it can be caused, according to [30], by:
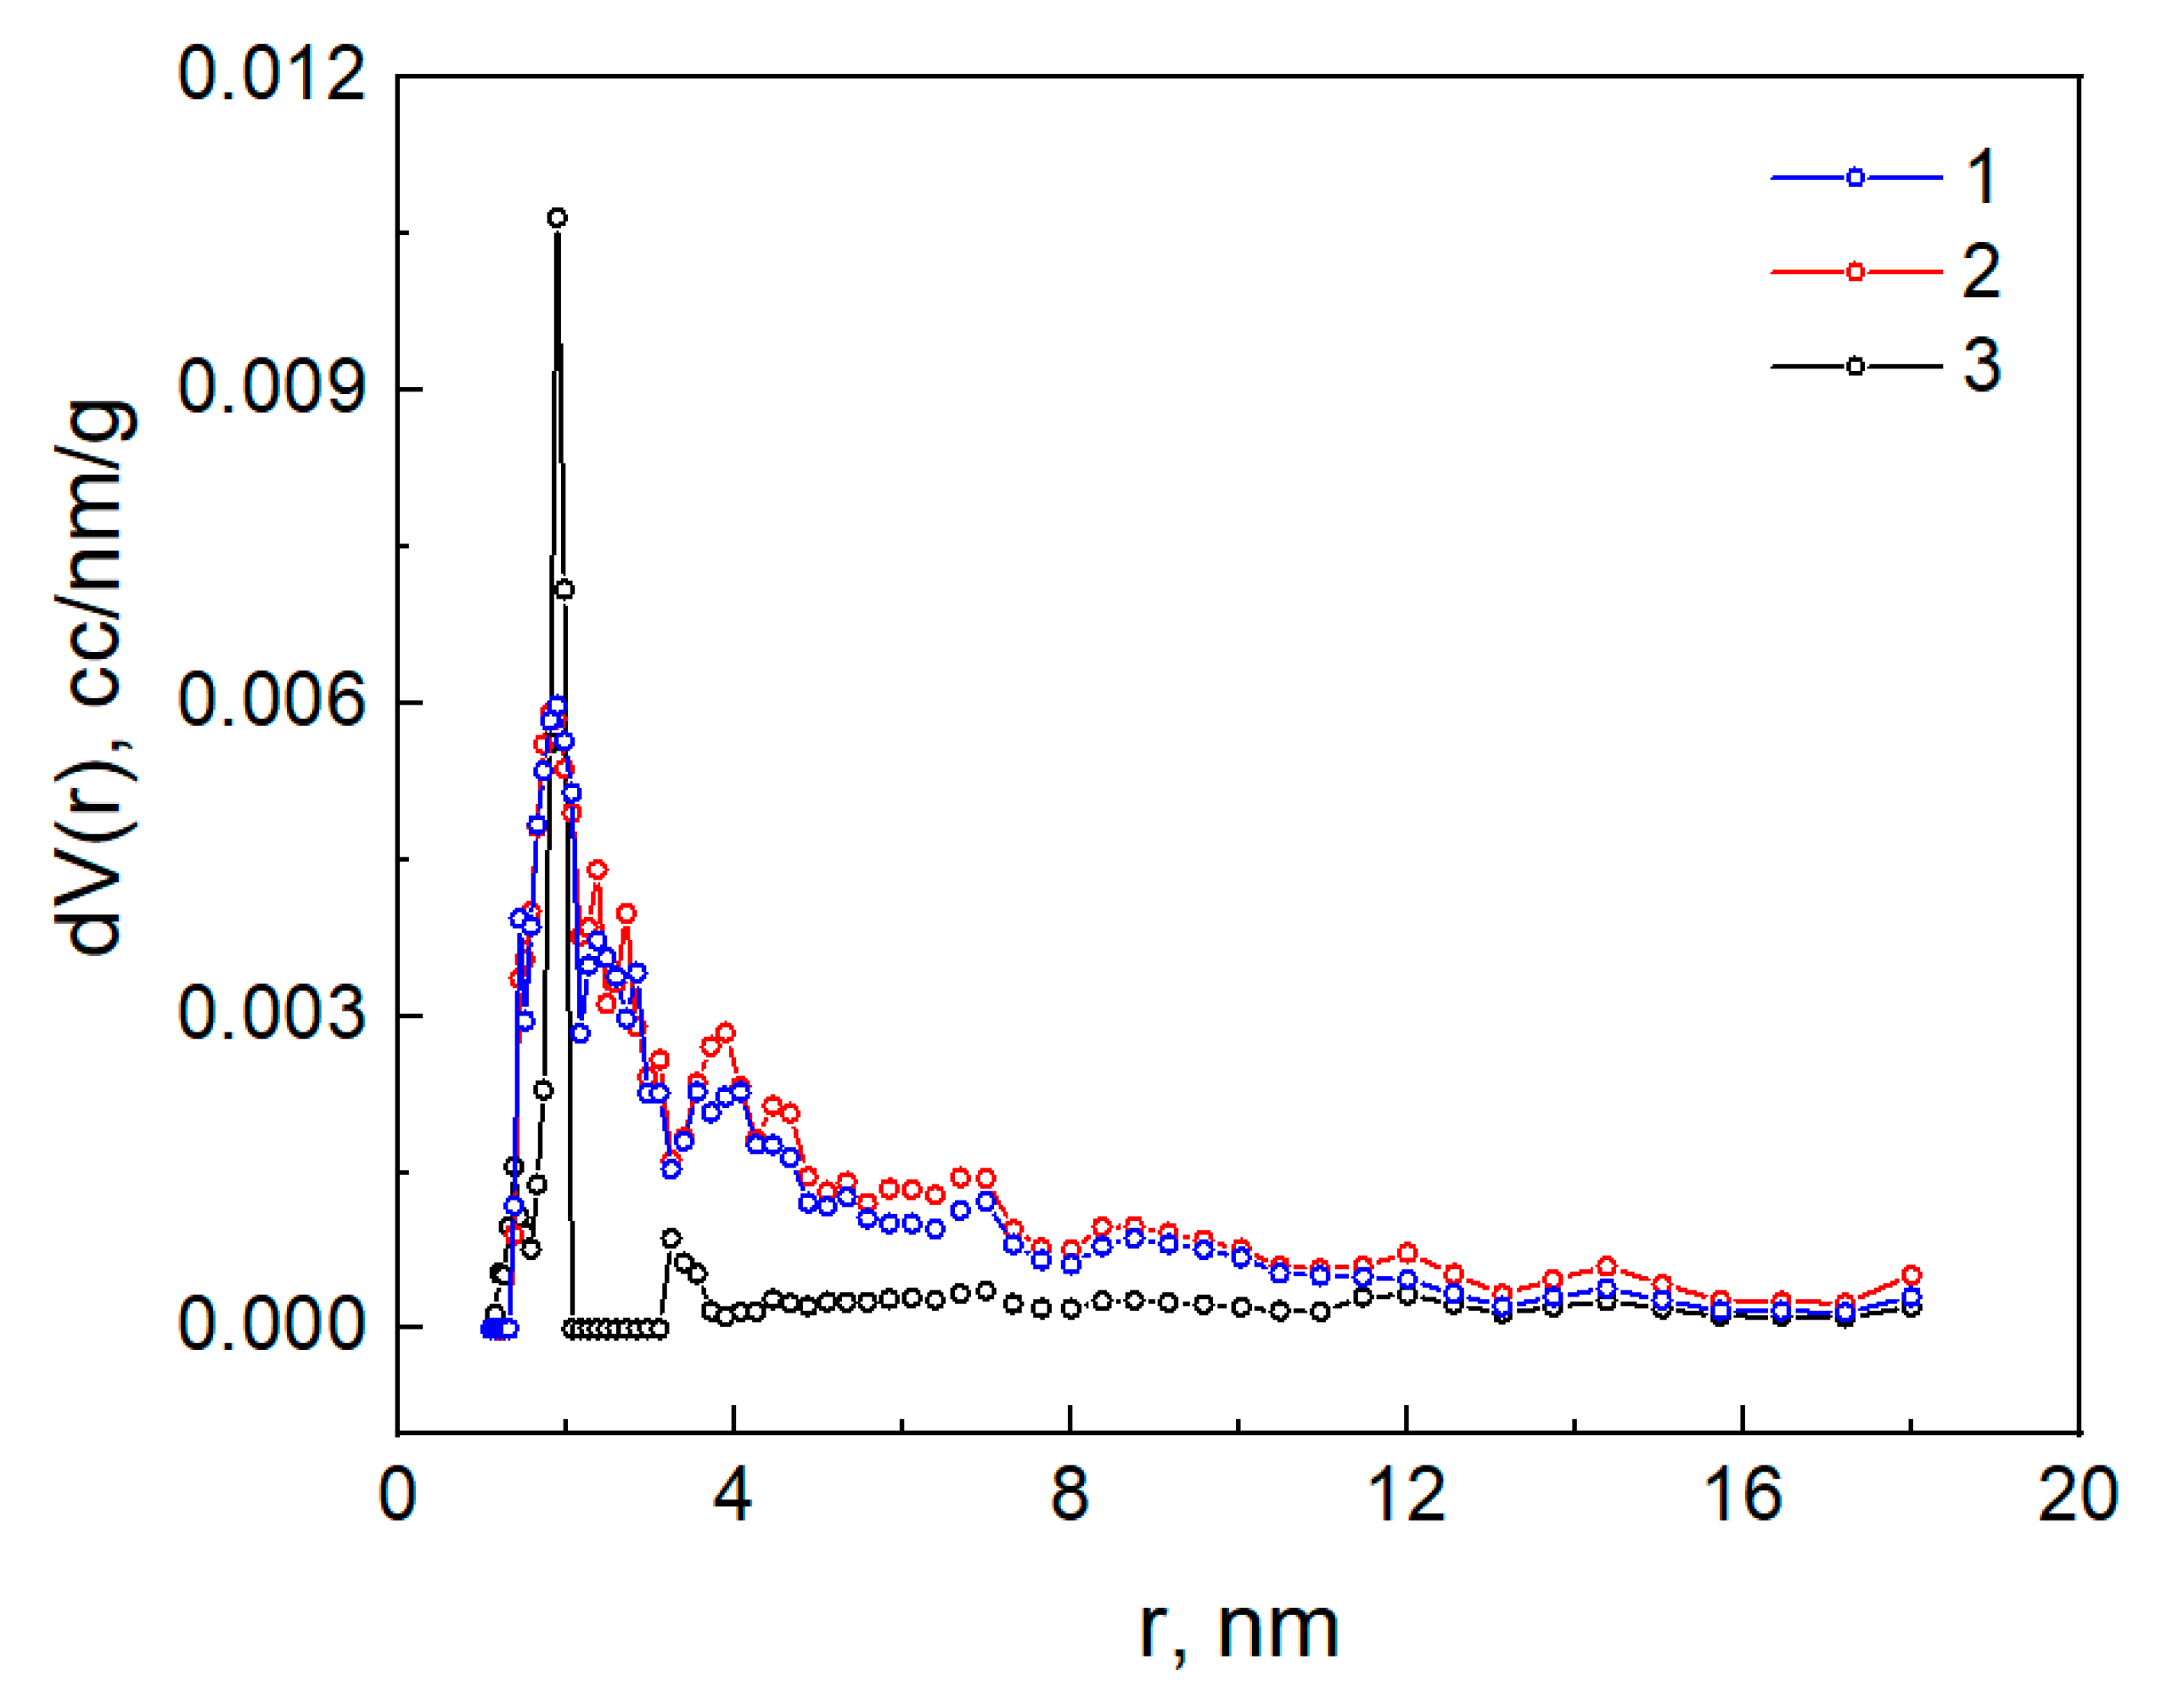
  • Irreversible retention of gas molecules in pores, the size of which is close to the size of these molecules;
  • Irreversible chemical adsorbate/adsorbent interaction;
  • Swelling of the spatial high molecular scaffold of adsorbent.
In our case, the most likely cause may be the first one.
To calculate the parameters of synthesized NC, the obtained isotherms were analyzed using the Quantachrome TouchWin program. In particular, to determine the specific surface area, the multipoint BET method [30] was applied, using the experimental data approximation by a straight line in the range of the relative pressure P/P0 = 0.05 ÷ 0.35, cf. Figure 9. The coefficient of correlation with the model was 0.996 for all nanocomposites. As the result of calculations, the values of specific surface area and pore volume were obtained, as presented in Table 5. The obtained values of the specific surface area for samples NC1_10 and NC1_5 are slightly smaller than the values calculated by SAXS patterns. This difference is significantly bigger for the NC2 sample. These facts indicate that a significant part of the porous space of the samples NC1_10 and NC1_5 is open and accessible to adsorbed molecules, which is not the case for NC2 nanocomposite.
The nature of adsorption isotherm behavior shows a significant effect of micropores in the studied nanocomposites. This allows using the density functional theory (DFT) method for modelling, which is based on quantum mechanical calculations with the use of fundamental molecular parameters characterizing gas–gas and gas–solid interactions in the adsorption system. We have chosen a model of slit-like pores with perfectly flat graphene walls [31]. The results of calculating the pore distribution are shown in Figure 10, and the specific surface area and volume of micropores are presented in Table 5. The behavior of curves in Figure 10 completely follows the behavior of the curves calculated on the basis of SAXS patterns (Figure 8), only with a shift to the area of micropores, because the DFT method gives the best results precisely for this part of the porous structure of samples. Thus, the nickel chloride activator promotes the development of the carbonaceous materials’ surface, especially by the two-stage synthesis. The activation efficiency is not as significant as with FeCl3 [32], but the activation mechanisms are probably similar.
Hysteresis loops of the synthesized Ni/C nanocomposites are shown in Figure 11, and the values of coercive force (Hc), specific saturation magnetization (σs), and relative residual magnetization (σr/σs) are given in Table 6. Table 6 shows that the values of the specific saturation magnetization of composites NC1_10 and NC1_5 significantly exceed the magnetization of previously synthesized Fe/C composites [22], where the carrier of the magnetic moment was Fe3O4 oxide. Slightly lower and close to the values of Fe/C is the value of the specific saturation magnetization of the nanocomposite NC2. However, the previously given values of the specific saturation magnetization are sufficient, for example, for the use of composites as magnetically controlled adsorbents.
On the basis of the dependence coercive field vs. size of nickel nanoparticles at room temperature [33], the size of nickel particles in the synthesized composites was estimated to be ~110 nm for NC1_10 and ~100 nm for NC1_5 and NC2. The particles are obviously multidomain, since these values exceed the critical diameter of the transition to the single-domain state of Ni nanoparticles at T = 300 K, which according to [34] is 85 nm.
Based on the experimental data of the specific saturation magnetization, the content of Ni nanoparticles in the synthesized composites was calculated (Table 6). The values of the specific saturation magnetization for a bulk sample were used in the calculations, since significant values of the magnetization decrease according to the data [35] were observed for d ≤ 100 nm Ni particles. It was found that, for the NC1_10 sample, at a low concentration of the activator, almost all nickel was incorporated into the structure of the synthesized nanocomposite (Table 6). With a twofold increase in the activator concentration (sample NC1_5), the efficiency of nickel incorporation into the nanocomposite decreased and constituted 72% of its amount in the initial activation solution. The amount of nickel incorporated in NC2 sample was even smaller, only 30%. This means that the efficiency of incorporating nickel into pre-carbonized wheat straw is much lower than into the initial raw material.

4. Conclusions

The research has confirmed a fundamental possibility to synthesize Ni/C nanostructured composites by different pyrolysis methods with the use of steam–gas activation based on biocarbon materials, in particular wheat straw.
The present paper contributes to a better understanding of synthesis route for Ni/C nanostructured composites obtained from an easily accessible raw material, i.e., wheat straw. These materials may be useful e.g., for application in supercapacitor design or as magnetically controlled adsorbents. The present paper illustrates the fundamental morphological differences for composites synthesized in one and two-stage methods. The use of the one-stage synthesis method results in a nanocomposite with a wide pore distribution and a higher saturation magnetization compared with the nanocomposite synthesized by the two-stage method.
In the future, we plan to conduct research focused on determination of the optimal ratio of raw material-activator to obtain carbon nanocomposites with a controlled porous structure or the content of Nickel nanoparticles of specified sizes. Of course, it will be possible to use new methods of activation or a combination of already used types of activators. It is important to stress that different types of bioorganic waste may be used as raw input material. Therefore, our research may contribute to sustainable and eco-friendly use of natural resources.

Author Contributions

Conceptualization, I.B., D.C. and F.I.; methodology, I.B., P.C., A.B., Y.K.; validation, D.C., Z.K.; formal analysis, A.B., Y.K.; investigation, I.B., P.C., F.I.; resources, I.B., P.C., F.I.; data curation, P.C., Z.K.; writing—original draft preparation, I.B.; writing—review and editing, K.C.; visualization, K.C.; supervision, D.C., A.B., Y.K.; project administration, I.B.; funding acquisition, K.C. All authors have read and agreed to the published version of the manuscript.

Funding

This research received no external funding.

Institutional Review Board Statement

Not applicable.

Informed Consent Statement

Not applicable.

Data Availability Statement

Data available upon request from the first author.

Conflicts of Interest

The authors declare no conflict of interest.

References

  1. Mango, F.D. Transition metal catalysis in the generation of petroleum and natural gas. Geochim. Cosmochim. Acta 1992, 56, 553–555. [Google Scholar] [CrossRef]
  2. Lipshutz, B.H.; Blomgren, P.A. Nickel on Charcoal (“Ni/C”):  An expedient and inexpensive heterogeneous catalyst for cross-couplings between aryl chlorides and organometallics. I. Functionalized organozinc reagents. J. Am. Chem. Soc. 1999, 121, 5819–5820. [Google Scholar] [CrossRef]
  3. Yu, M.; Liu, Y.; Sellmyer, D.J. Nanostructure and magnetic properties of composite CoPt: C films for extremely high-density recording. J. Appl. Phys. 2000, 87, 6959–6961. [Google Scholar] [CrossRef]
  4. Lee, J.Y.; Liang, K.; An, K.H.; Lee, Y.H. Nickel oxide/carbon nanotubes nanocomposite for electrochemical capacitance. Synth. Met. 2005, 150, 153–157. [Google Scholar] [CrossRef]
  5. Chen, S.; Zhu, J.W.; Wang, X. One-step synthesis of graphene-cobalt hydroxide nanocomposites and their electrochemical properties. J. Phys. Chem. C 2010, 114, 11829–11834. [Google Scholar] [CrossRef]
  6. Lyu, S.; Liu, C.; Wang, G.; Zhang, Y.; Li, J.; Wang, L. Structural evolution of carbon in an Fe@C catalyst during the Fischer-Tropsch synthesis reaction. Catal. Sci. Technol. 2019, 9, 1013–1020. [Google Scholar] [CrossRef]
  7. Liang, Q.; Zhang, E.H.; Yan, G.; Yang, Y.Z.; Liu, W.F.; Liu, X.G. A lithium ion-imprinted adsorbent using magnetic carbon nanospheres as a support for the selective recovery of lithium ions. New Carbon Mater. 2020, 35, 696–706. [Google Scholar] [CrossRef]
  8. Plastiras, O.-E.; Deliyanni, E.; Samanidou, V. Synthesis and application of the magnetic nanocomposite GO-Chm for the extraction of benzodiazepines from surface water samples prior to HPLC-PDA analysis. Appl. Sci. 2021, 11, 7828. [Google Scholar] [CrossRef]
  9. Toebes, M.L.; van Dillen, J.A.; de Jong, K.P. Synthesis of supported palladium catalysts. J. Mol. Catal. A Chem. 2001, 173, 75–98. [Google Scholar] [CrossRef]
  10. Yu, R.; Chen, L.; Liu, Q.; Lin, J.; Tan, K.-L.; Ng, S.C.; Chan, H.S.O.; Xu, G.-Q.; Hor, T.S.A. Platinum deposition on carbon nanotubes via chemical modification. Chem. Mater. 1998, 10, 718–722. [Google Scholar] [CrossRef]
  11. Lordi, V.; Yao, N.; Wei, J. Method for supporting platinum on single-walled carbon nanotubes for a selective hydrogenation catalyst. Chem. Mater. 2001, 13, 733–737. [Google Scholar] [CrossRef]
  12. Bai, S.; Shen, X.; Zhong, X.; Liu, Y.; Zhu, G.; Xu, X.; Chen, K. One-pot solvothermal preparation of magnetic reduced graphene oxide-ferrite hybrids for organic dye removal. Carbon 2012, 50, 2337–2346. [Google Scholar] [CrossRef]
  13. Teunissen, W.; de Groot, F.M.F.; Geus, J.; Stephan, O.; Tence, M.; Colliex, C. The structure of carbon encapsulated NiFe nanoparticles. J. Catal. 2001, 204, 169–174. [Google Scholar] [CrossRef] [Green Version]
  14. Lu, Y.; Zhu, Z.; Liu, Z. Carbon-encapsulated Fe nanoparticles from detonation-induced pyrolysis of ferrocene. Carbon 2005, 43, 369–374. [Google Scholar] [CrossRef]
  15. Farook, A.; Jeyashelly, A.; Ismail, A.R. The synthesis and characterization of cobalt-rice husk silica nanoparticles. Open Colloid Sci. J. 2011, 4, 12–18. [Google Scholar] [CrossRef]
  16. Bordun, I.; Pidluzhna, A.; Ivashchyshyn, F.; Borysiuk, A.; Całus, D.; Chwastek, K. Structural and magnetic properties of Ni/C composites synthesized from beet pulp and corn stems. Magnetochemistry 2021, 7, 31. [Google Scholar] [CrossRef]
  17. Zakharov, Y.A.; Ismagilov, Z.R.; Voropai, A.N.; Manina, T.S.; Barnakov, C.N.; Samarov, A.V.; Pugachev, V.M.; Kolmykov, R.P.; Dodonov, V.G. Nanostructured composites based on porous carbon matrices filled with nickel hydroxide crystallites. Inorg. Mater. 2015, 51, 405–411. [Google Scholar] [CrossRef]
  18. Wei, W.; Mi, L.; Gao, Y.; Zheng, Z.; Chen, W.; Guan, X. Partial ion-exchange of nickel-sulfide-derived electrodes for high performance supercapacitors. Chem. Mater. 2014, 26, 3418–3426. [Google Scholar] [CrossRef]
  19. Bronstein, L.M.; Sidorov, S.N.; Valeckiy, P.M. Nanostructured polymeric systems as nanoreactors for nanoparticle formation. Russ. Chem. Rev. 2004, 73, 501–515. [Google Scholar] [CrossRef]
  20. Bagheri, N.; Abedi, J. Preparation of high surface area activated carbon from corn by chemical activation using potassium hydroxide. Chem. Eng. Res. Des. 2009, 87, 1059–1064. [Google Scholar] [CrossRef]
  21. Vervikishko, D.E.; Yanilkin, I.V.; Dobele, G.V.; Volperts, A.; Atamanyuk, I.N.; Sametov, A.A.; Shkol’nikov, E.I. Activated carbon for supercapacitor electrodes with an aqueous electrolyte. High Temp. 2015, 53, 758–764. [Google Scholar] [CrossRef]
  22. Soloviy, C.; Malovanyy, M.; Bordun, I.; Ivashchyshyn, F.; Borysiuk, A.; Kulyk, Y. Structural, magnetic and adsorption characteristics of magnetically susceptible carbon sorbents based on natural raw materials. J. Water Land Dev. 2020, 47, 160–168. [Google Scholar] [CrossRef]
  23. Pecharsky, V.K.; Zavalij, P.Y. Fundamentals of Powder Diffraction and Structural Characterization of Materials; Springer: New York, NY, USA, 2009. [Google Scholar]
  24. Zhao, H.; Kwak, J.H.; Zhang, Z.C.; Brown, H.M.; Arey, B.W.; Holladay, J.E. Studying cellulose fiber structure by SEM, XRD, NMR and acid hydrolysis. Carbohydr. Polym. 2007, 68, 235–241. [Google Scholar] [CrossRef]
  25. Rabiej, S. A comparison of two X-ray diffraction procedures for crystallinity determination. Eur. Polym. J. 1991, 27, 947–954. [Google Scholar] [CrossRef]
  26. Audebert, F.; Arcondo, B.; Rodriguez, D.; Sirkin, H. Short range order study in Al-Fe-X melt spun alloys. In Material Science Forum; Trans Tech Publications: Bäch, Switzerland, 2001; Volume 360–362, pp. 155–160. [Google Scholar] [CrossRef]
  27. Shved, O.; Mudry, S.; Zhak, O.; Shcherba, I. X–ray diffraction studies of Al–Ni–Zr ternary alloy. Ann. Univ. Paedagog. Cracoviensis. Studia Tech. 2017, 10, 160–168. [Google Scholar]
  28. Zhu, X.; Liu, Y.; Luo, G.; Qian, F.; Zhang, S.; Chen, J. Facile fabrication of magnetic carbon composites from hydrochar via simultaneous activation and magnetization for triclosan adsorption. Environ. Sci. Technol. 2014, 48, 5840–5848. [Google Scholar] [CrossRef]
  29. Koberstein, J.T.; Morra, B.; Stein, R.S. The determination of diffuse-boundary thicknesses of polymers by small-angle X-ray scattering. J. Appl. Cryst. 1980, 13, 34–45. [Google Scholar] [CrossRef]
  30. Gregg, S.J.; Sing, K.S.W. Adsorption, Surface Area and Porosity, 2nd ed.; Academic Press: London, UK, 1982; p. 304. ISBN 0-12-300956-1. [Google Scholar]
  31. Ravikovitch, P.I.; Vishnyakov, A.; Russo, R.; Neimark, A.V. Unified approach to pore size characterization of microporous carbonaceous materials from N2, Ar, and CO2 adsorption isotherms. Langmuir 2000, 16, 2311–2320. [Google Scholar] [CrossRef]
  32. Bedia, J.; Peñas-Garzón, M.; Gómez-Avilés, A.; Rodriguez, J.J.; Belver, C. Review on activated carbons by chemical activation with FeCl3. C 2020, 6, 21. [Google Scholar] [CrossRef] [Green Version]
  33. He, X.; Zhong, W.; Au, C.-T.; Du, Y. Size dependence of the magnetic properties of Ni nanoparticles prepared by thermal decomposition method. Nanoscale Res. Lett. 2013, 8, 446. [Google Scholar] [CrossRef] [PubMed] [Green Version]
  34. Krishnan, K.M.; Pakhomov, A.B.; Bao, Y.; Blomqvist, P.; Chun, Y.; Gonzales, M.; Roberts, B.K. Nanomagnetism and spin electronics: Materials, microstructure and novel properties. J. Mater. Sci. 2006, 41, 793–815. [Google Scholar] [CrossRef]
  35. Yao, Y.D.; Chen, Y.Y.; Hsu, C.M.; Lin, H.M.; Tung, C.Y.; Tai, M.F.; Suo, C.T. Thermal and magnetic studies of nanocrystalline Ni. Nanostruct. Mat. 1995, 6, 933–936. [Google Scholar] [CrossRef]
Figure 1. Granules of wheat straw.
Applsci 11 10031 g001
Figure 2. X-ray diffraction pattern of the raw material.
Applsci 11 10031 g002
Figure 3. Profile analysis of the diffraction pattern of the raw material.
Applsci 11 10031 g003
Figure 4. SEM images of synthesized NC together with data of EDS analysis of the basic substance: (a) NC1_10; (b) NC1_5; (c) NC2.
Applsci 11 10031 g004aApplsci 11 10031 g004b
Figure 5. X-ray diffraction patterns of NC1_10 (1), NC1_5 (2), NC2 (3) samples.
Applsci 11 10031 g005
Figure 6. Analysis of the diffuse peak profile of the carbon phase in NC1_10 (a); NC1_5 (b); NC2 (c) samples.
Applsci 11 10031 g006aApplsci 11 10031 g006b
Figure 7. Curves of intensity of X-ray scattering by samples NC1_10 (1), NC1_5 (2), NC2 (3) after collimation correction for the height of the detector receiving slit.
Applsci 11 10031 g007
Figure 8. Volume functions of pore distribution in samples NC1_10 (1), NC1_5 (2), NC2 (3).
Applsci 11 10031 g008
Figure 9. Isotherms of nitrogen adsorption at 77 K by synthesized nanocomposites, 1—NC1_10; 2—NC1_5; 3—NC2.
Applsci 11 10031 g009
Figure 10. Distribution of pores in synthesized nanocomposites according to DFT model, 1—NC1_10; 2—NC1_5; 3—NC2.
Applsci 11 10031 g010
Figure 11. Hysteresis loops of the magnetic moment of composites: 1—NC1_10; 2—NC1_5; 3—NC2. In insets: range of small values of the magnetic field strength.
Applsci 11 10031 g011
Table 1. Parameters of carbon phase peaks in synthesized nanocomposites.
Sample2θ, °d, nmFWHM, °I/IoLc, nm
NC1_109.70
22.80
0.910
0.390
7.4
13.2
19.2
100.0
1.3
NC1_510.45
22.45
0.850
0.400
4.9
13.1
7.3
100
2.0
NC214.00
23.50
0.630
0.380
4.6
11.4
9.6
100
2.2
Table 2. Analysis of diffraction patterns of polycrystalline Ni in synthesized nanocomposites.
Sampled, Å2θ, °I/IoFWHM, °hkl
NC1_102.0268
1.7557
1.2437
1.0613
1.0158
44.709
52.089
76.603
93.155
98.725
100.0
47.4
26.1
24.8
8.5
0.721
0.744
0.751
0.732
0.799
1 1 1
2 0 0
2 2 0
3 1 1
2 2 2
NC1_52.0319
1.7595
1.2455
1.0627
1.0176
44.591
51.968
76.477
92.999
98.499
100.0
42.3
20.3
15.9
5.0
0.503
0.600
0.635
0.701
0.759
1 1 1
2 0 0
2 2 0
3 1 1
2 2 2
NC22.0244
1.7559
1.2446
1.0621
1.0172
44.764
52.082
76.537
93.069
98.540
100.0
48.8
30.7
35.3
10.9
0.595
0.597
0.612
0.650
0.704
1 1 1
2 0 0
2 2 0
3 1 1
2 2 2
d-interplanar distance (Å), 2θ-diffraction angle, I/Io-relative intensity of peaks, FWHM-full width at half maximum.
Table 3. Microstructural parameters of polycrystalline Ni phase.
Samplea, ÅL, nmε, %
NC1_103.5237 ± 0.000845.5 ± 3.40.017
NC1_53.5369 ± 0.000764.8 ± 4.80.013
NC23.5295 ± 0.0006157.1 ± 11.70.004
a-unit cell parameter (Å), L-average grain size, ε-relative lattice deformation.
Table 4. Parameters of porous structure of synthesized nanocomposites by the SAXS method.
SampleRc, nmQp, 103 nm−3Kp, 104 nm−4Sp, m2/g
NC1_107.5168.71.43267
NC 1_56.9185.31.72291
NC 23.7107.71.87544
Table 5. Parameters of the porous structure of synthesized nanocomposites according to nitrogen adsorption/desorption data.
SampleMultipoint BET MethodDFT Method
S, m2/gV, cm3/g r ¯ , nmSm, m2/gVm, cm3/g
NC1_10224.50.1481.32187.80.128
NC1_5218.80.1451.33184.30.127
NC2296.70.1671.16329.20.146
Table 6. Magnetic properties of synthesized nanocomposites.
Sampleσs, A·m2·kg−1Hc,
kA·m−1
σr/σsNi Content,
Mass %
Ni Content with Respect to that Incorporated into the Initial Raw Material, %
NC1_104.83.50.14990
NC1_57.04.00.121372
NC22.94.00.065.430
Publisher’s Note: MDPI stays neutral with regard to jurisdictional claims in published maps and institutional affiliations.

