Article

Measuring System Design and Experiment for Ground Pressure on Seeding Skateboard of Rice Direct Seeding Machine

School of Engineering, Huazhong Agricultural University, Wuhan 430072, China
*
Author to whom correspondence should be addressed.
Appl. Sci. 2021, 11(21), 10024; https://doi.org/10.3390/app112110024
Submission received: 26 September 2021 / Revised: 21 October 2021 / Accepted: 22 October 2021 / Published: 26 October 2021
(This article belongs to the Special Issue Engineering of Smart Agriculture)

Abstract

:

Featured Application

Intelligent agricultural machinery equipment, wireless measurement technology of the Internet of Things.

Abstract

Acquiring real-time ground pressure measurements from the surface of the soil in working parts of paddy fields is a challenging task. The real-time data can be used to monitor the changing state of the ground pressure of the working parts in a paddy field. To effectively reduce the accumulation of choked mud at the front end of the seeding skateboard and the contact adhesion between the skateboard and the paddy soil, a ground pressure measuring device suitable for paddy fields was designed. The device uses an Arduino controller, combined with Internet of things technology and wireless measurement technology. It can measure the pressure from 16 measuring points at the same time and transmit the measurement data to the computer remotely through the Internet of things technology, which greatly reduces the labor intensity of measuring personnel in the muddy paddy field. Analysis of the data showed that the forward tilt angle, ground pressure, and forward resistance of the seeding skateboard also increased with the increase of forward speed and vertical load. In addition, the distribution law of the ground pressure between the skateboard and the paddy soil was obtained. The conclusions show that the ground pressure measurement system can work stably in the paddy field and the measured data can be wirelessly transmitted to the computer and mobile phone.

1. Introduction

The total land area of paddy fields in China is 30 million hm2 [1], accounting for about 1/4 of the cultivated land in China [2]. Using a direct seeding machine for mechanized direct seeding of rice can effectively improve the degree of mechanization of rice production [3]. When the rice direct seeding machine is working, the seeding skateboard with larger grounding area is often pulled by the power head to flatten the surface in order to make the seeding mud surface smooth [4]. There is often a large amount of soil accumulation in front of the seeding skateboard due to the squeezing of the skateboard on the paddy field soil [5], which directly affects the operation efficiency, traction and adhesion performance, fuel consumption, and power consumption of the rice direct seeding machine, and also reduces the passability of the machine [6]. The serious choking of the mud also causes the seeds on the adjacent sides to be covered and affects the flatness of the paddy field [7]. The occurrence of the above problems is closely related to the contact between the planter skateboard and the paddy soil. Studying the ground pressure at the bottom of the skateboard is helpful to reduce the mud adhered to the surface of the skateboard and reduce the resistance of the skateboard during sliding [8].
The paddy soil used for transplanting and direct seeding has high water content, a fluid state, and remarkable rheological properties [9]. In order to accurately analyze the interaction process between seeding skateboard and paddy soil, it is necessary to study the rheological mechanical properties of paddy soil [10]. In order to understand the rheological properties of lacustrine soft soil at different stress levels, Deng, Z. carried out a one-dimensional indoor consolidation creep experiment on soft soil in the Dongting Lake area. A rheological constitutive model under lateral confinement conditions was then constructed, and the analytical solution was obtained under one-dimensional consolidation conditions according to the fitted rheological constitutive model. The results indicated that soft soil in the Dongting Lake area has obvious nonlinear creep characteristics [11]. Ram, R. B. performed uniaxial compression experiments on soil samples and plotted rheological curves, thus establishing rheological models and rheological equations [12]. Zhuoliang He established an air–water–soil coupling model, used ANSYS/LS-DYNA to conduct a fluid–solid coupling simulation, and applied the rheological parameter research to the design and parameter optimization of a paddy soil boat tractor [13].
Domestic and foreign experts have carried out a lot of theoretical and experimental research regarding the ground pressure measurement technology. Guozhen Wu and others installed a self-made diaphragm ground pressure sensor at the bottom of a machine ploughing ship and measured the ground pressure at the bottom of the ship [14]. Bijuan Yan invented a device that can dynamically measure the distributed ground pressure from a crawler device of heavy equipment [15]. Moreover, Eisenkolb designed a kind of ground pressure measuring device and a set of evaluation methods. The measuring device is embedded in the ground, then, when the car passes from above, the sensor and measuring device can detect the dynamic change of the ground pressure in the contact area between the tire and the ground, and analyze and evaluate the record [16]. In order to reduce the mud of the skateboard of the rice direct seeding machine, Ya Zou used a thin film sensor to measure and analyze the ground pressure between the skateboard and the soil in order to explore the force relationship between the skateboard and the soil [17]. This characteristic of paddy field soil strongly affects the operation performance and work efficiency of paddy field operation machinery. Therefore, studying the rheological characteristics of paddy field soil is of great significance in exploring the relationship between paddy field soil and agricultural machinery and farming machinery, revealing the law of its interaction, and providing a theoretical basis for the design and manufacture of farmland operation machinery.
This study mainly focused on effectively reducing the accumulation of choked mud at the front end of the seeding skateboard and the contact adhesion between the skateboard and the paddy soil. Therefore a specific pressure measurement system for the seeding skateboard of a rice direct seeding machine was designed. Taking the skateboard of Datong 2BD-8A (DXD830) rice direct seeding machine (Figure 1) as the object, the ground pressure and forward resistance between the skateboard and the soil were measured and analyzed. The distribution law of ground pressure between the skateboard and paddy soil was preliminarily obtained in order to provide reference for the optimal design for adhesion and resistance reduction of soil contact.

2. Materials and Methods

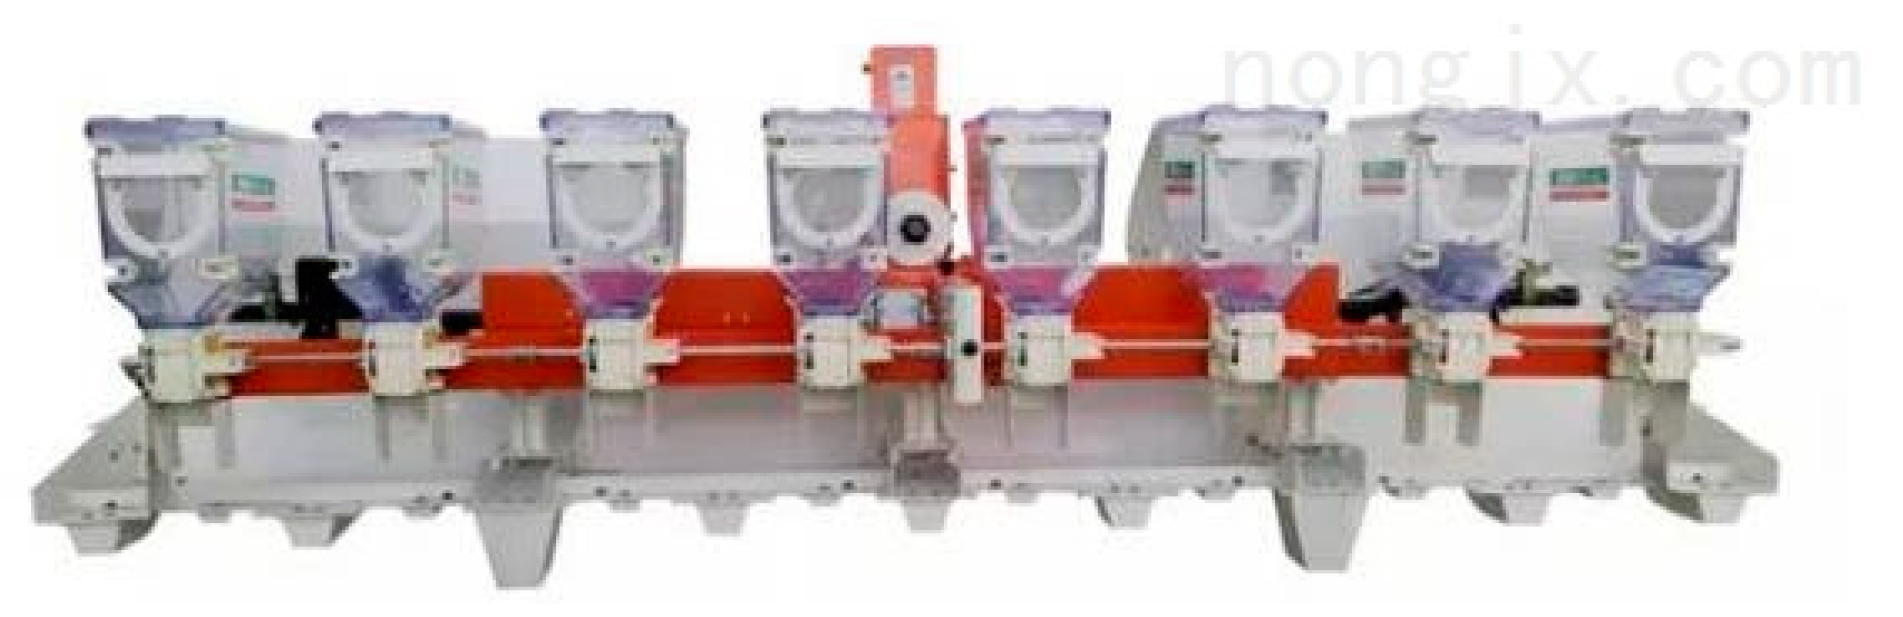
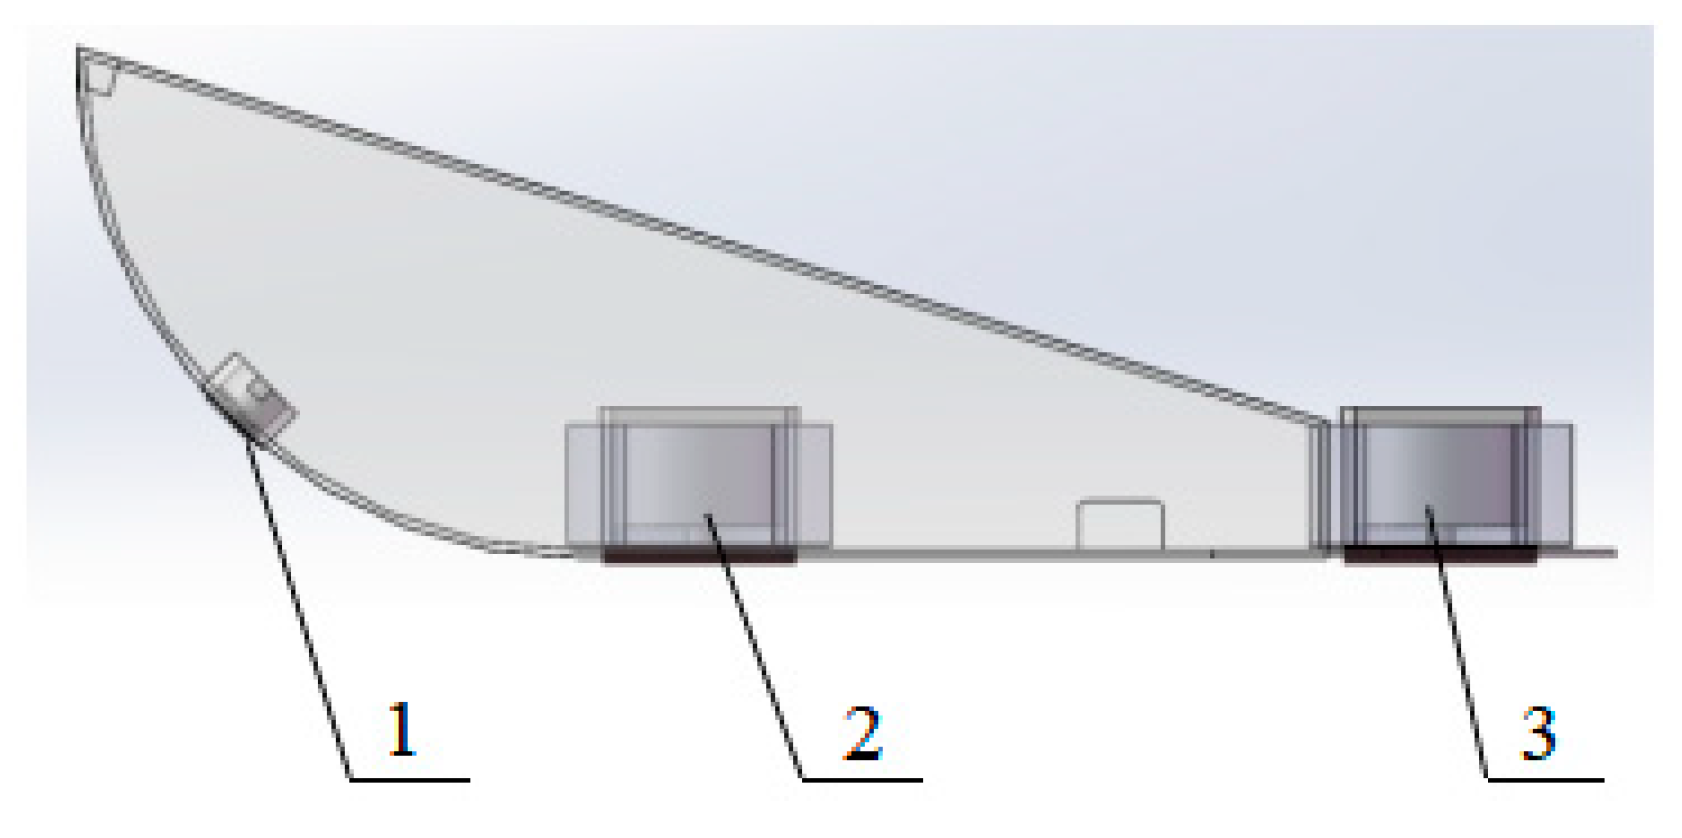
2.1. Working Principle

The ground pressure measurement system consists of two parts: hardware and software. Among them, the hardware system includes a pressure sensor, 9-axis attitude sensor, GPS module, Arduino controller, signal amplifier, wireless serial communication module, Internet of things wireless module, and computer equipped with Arduino software. In addition, the software system mainly includes technology for data acquisition, data filtering, wireless data transmission, data display, data storage, and other functions. The pressure sensor converts the force of the soil on the skateboard of the rice direct seeding machine into a resistance signal, and the signal amplifier converts the resistance signal into an analog voltage signal [18]. The Arduino controller uploads the data to the mobile phone and computer through the wireless transmission module and the Internet of things module after filtering and analyzing the voltage signal. Figure 2 shows the structure of the ground pressure measurement system. Figure 3 shows the flow chart of the ground pressure measurement system. The detailed information of the components used and measurement instrumentations has been provided in Table 1.
According to the experiment requirements, the measurement system can remotely set the sensor parameters, control the data acquisition frequency, initialize the sensor, etc. After the data acquisition starts, the Arduino controller will remotely upload the data to the mobile phone and computer, display the current measurement data in real time, and allow the user to view historical data and save measurement data. Figure 4 shows the software flow of the ground pressure measurement system.
The ground pressure measurement system has 12 independent pressure data acquisition channels. The data from each acquisition channel do not interfere with each other. Nos. 1–4 sensors are forward resistance sensors with a height of 10 cm from the bottom plane of the skateboard, which can effectively measure the resistance caused by the mud at the front end of the skateboard. Nos. 5–8 are the front pressure sensors and Nos. 9–12 are the rear pressure sensors. These are mainly used to measure the front and rear ground pressure and analyze the combination with forward inclination angle and forward resistance. Figure 5 and Figure 6 show the pressure sensor installation location.

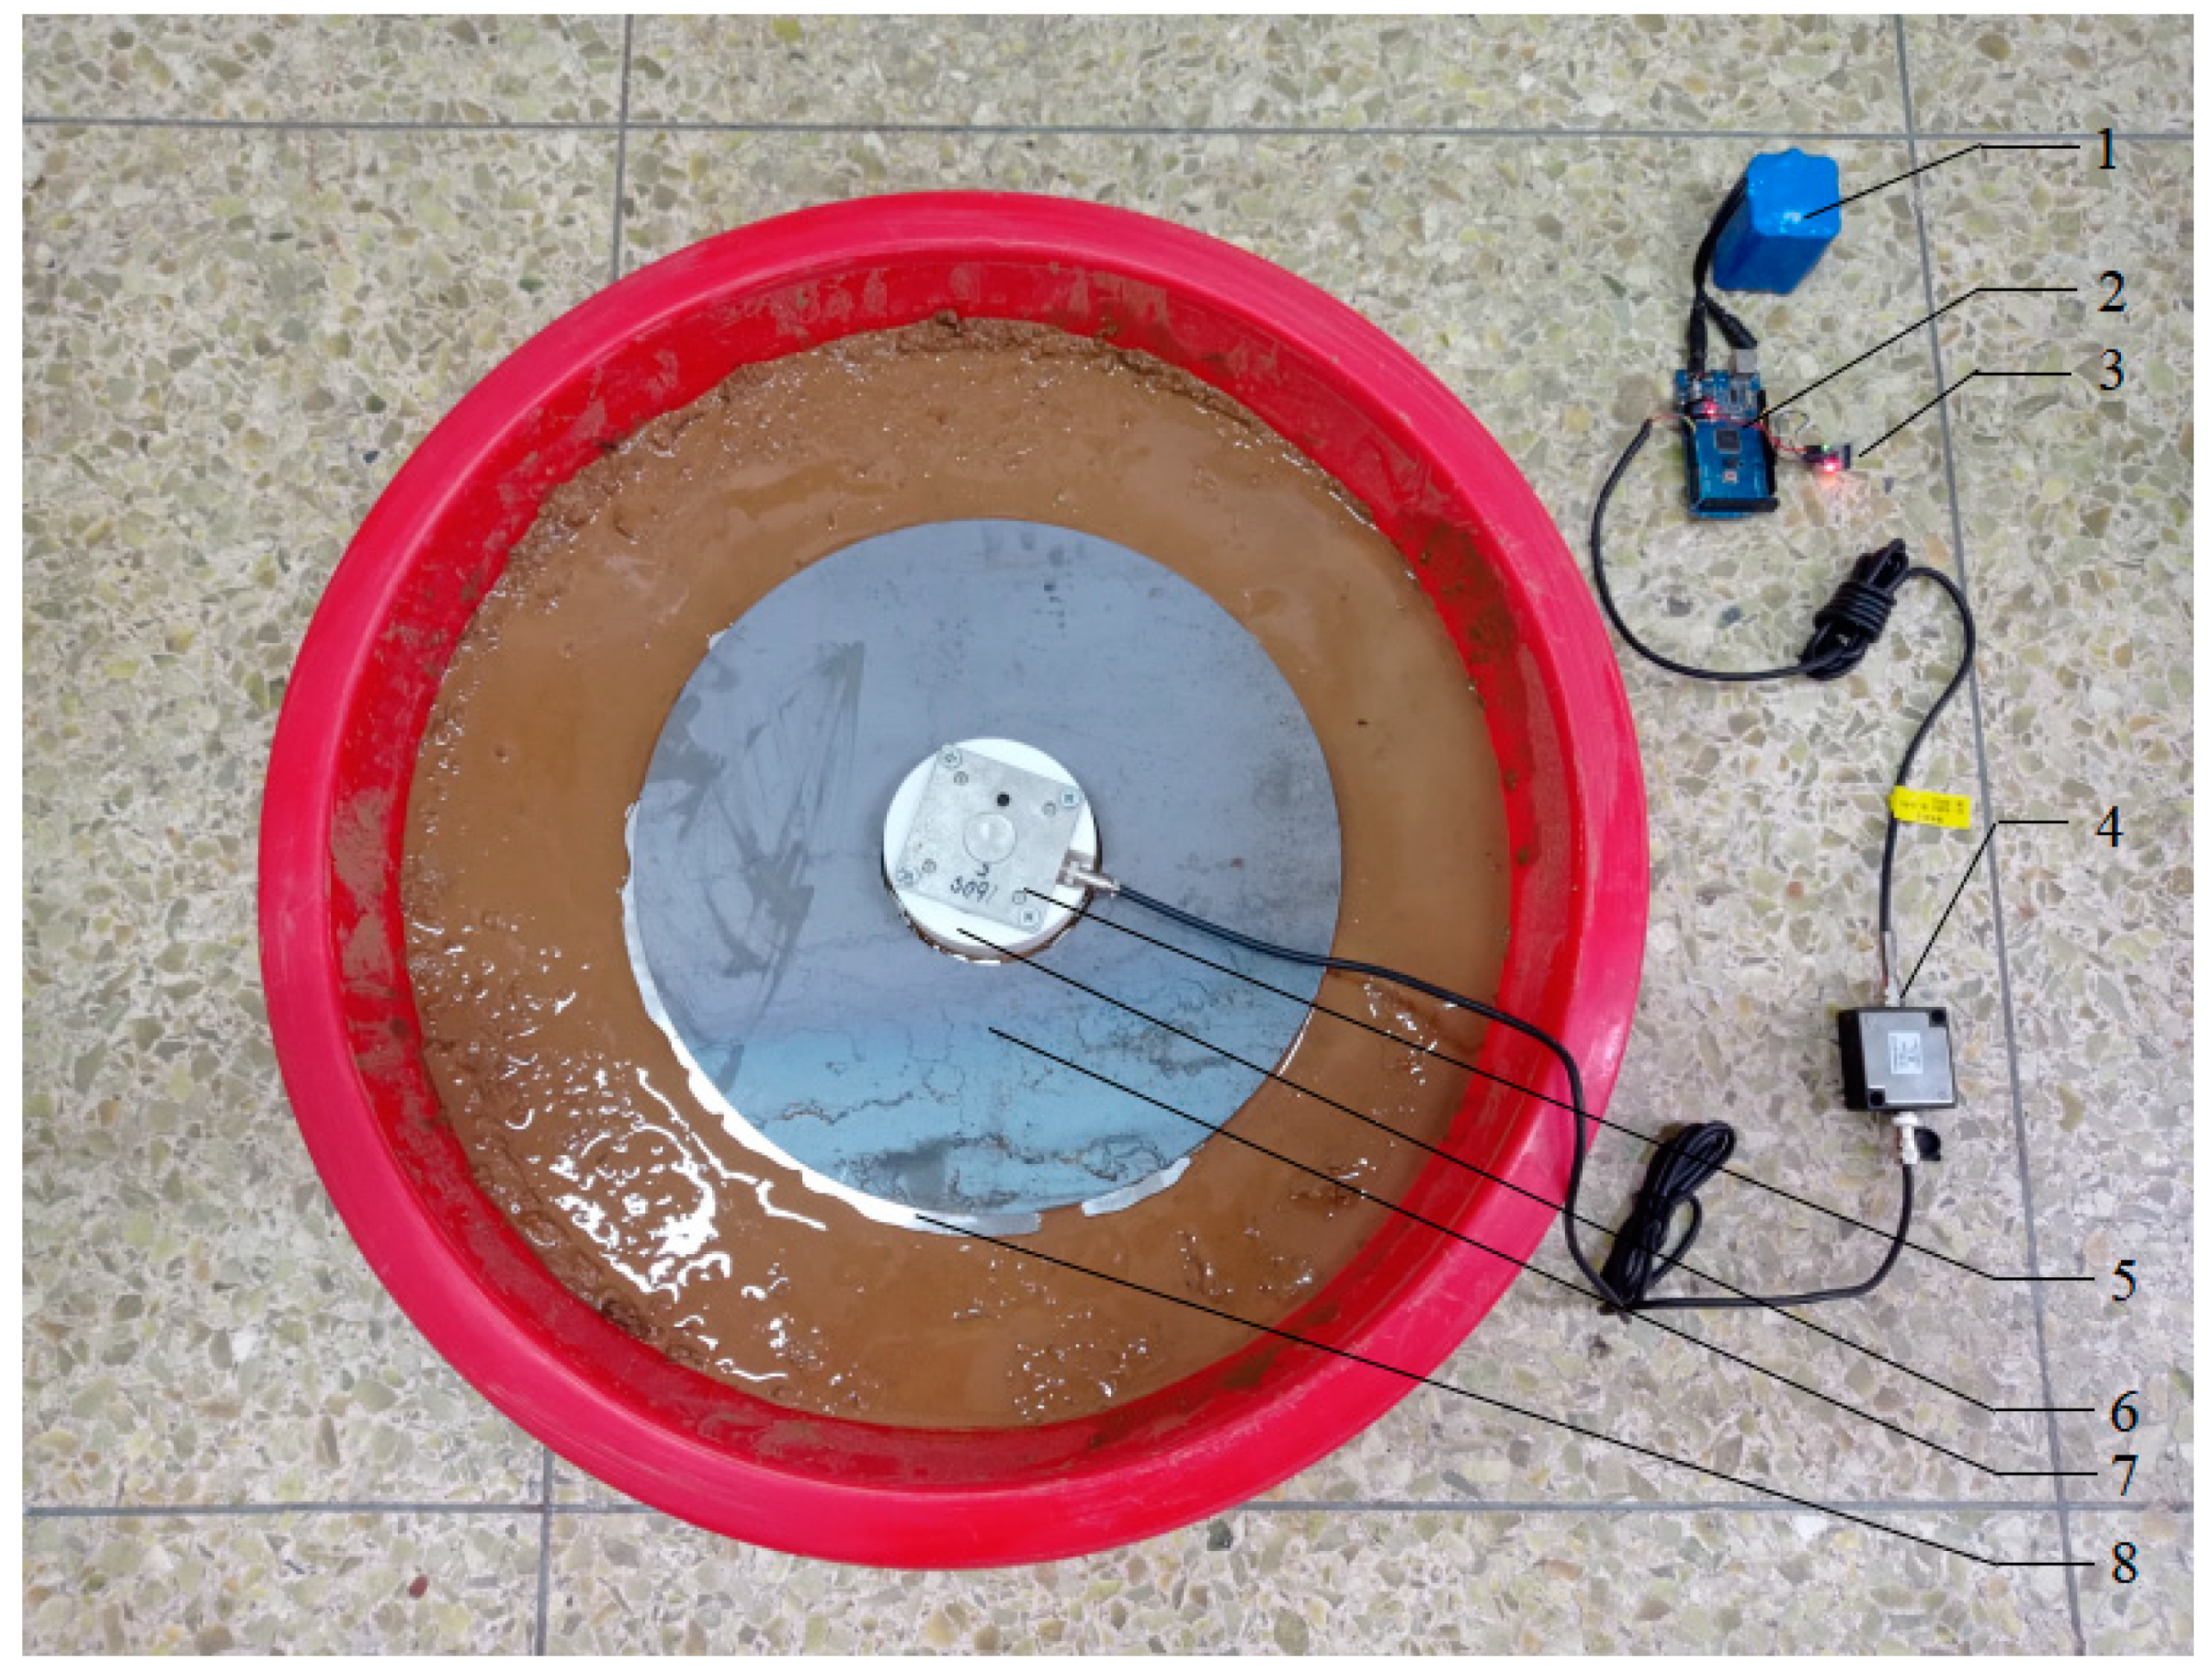
2.2. Ground Pressure Calibration Device

Due to the fact that there is no mature product for measuring the ground pressure of paddy soil in the market, a calibration device combing ground pressure measurement systems was designed and manufactured in order to detect the error between the ground pressure measured by the measuring device and the actual ground pressure and to calibrate and correct the measurement accuracy of the whole ground pressure measurement system.
The pressure sensor is connected with the signal amplifier. The signal amplifier converts the resistance signal into a voltage signal of 0–5 V and inputs it to the Arduino controller. In addition, the Arduino controller filters the data and sends it to the computer through the wireless serial port transceiver module. The number of counterweight plates is gradually increased, and the ground pressure is measured in turn. Figure 7 shows the ground pressure combined calibration system.
The experimental results show that when the number of counterweight plates is between 0 and 10, the actual ground pressure ( q p ) value is linearly related to the total mass (m).
q p = m · g S p
where S p represents the contact area between pressure sensor and soil.
When the ground pressure is in the range of 0~2000 Pa, the actual ground pressure value measured by the measuring system is compared with the theoretical value. The error between the ground pressure values is within 2%, which meets the actual demand for ground pressure measurement accuracy. The ground pressure calibration data are shown in Table 2.

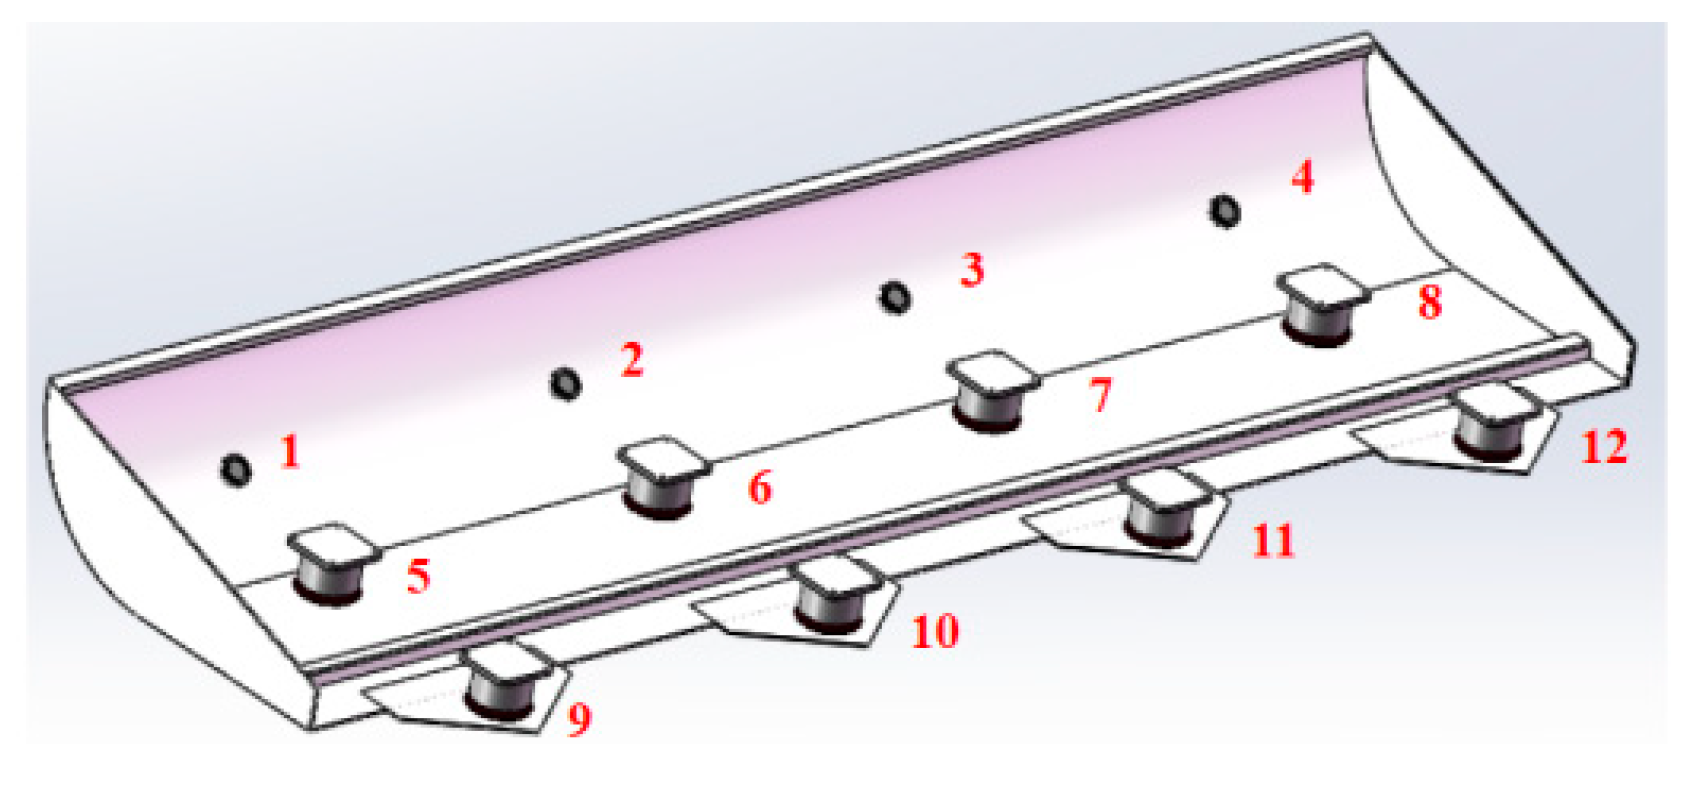
2.3. Design of Key Components

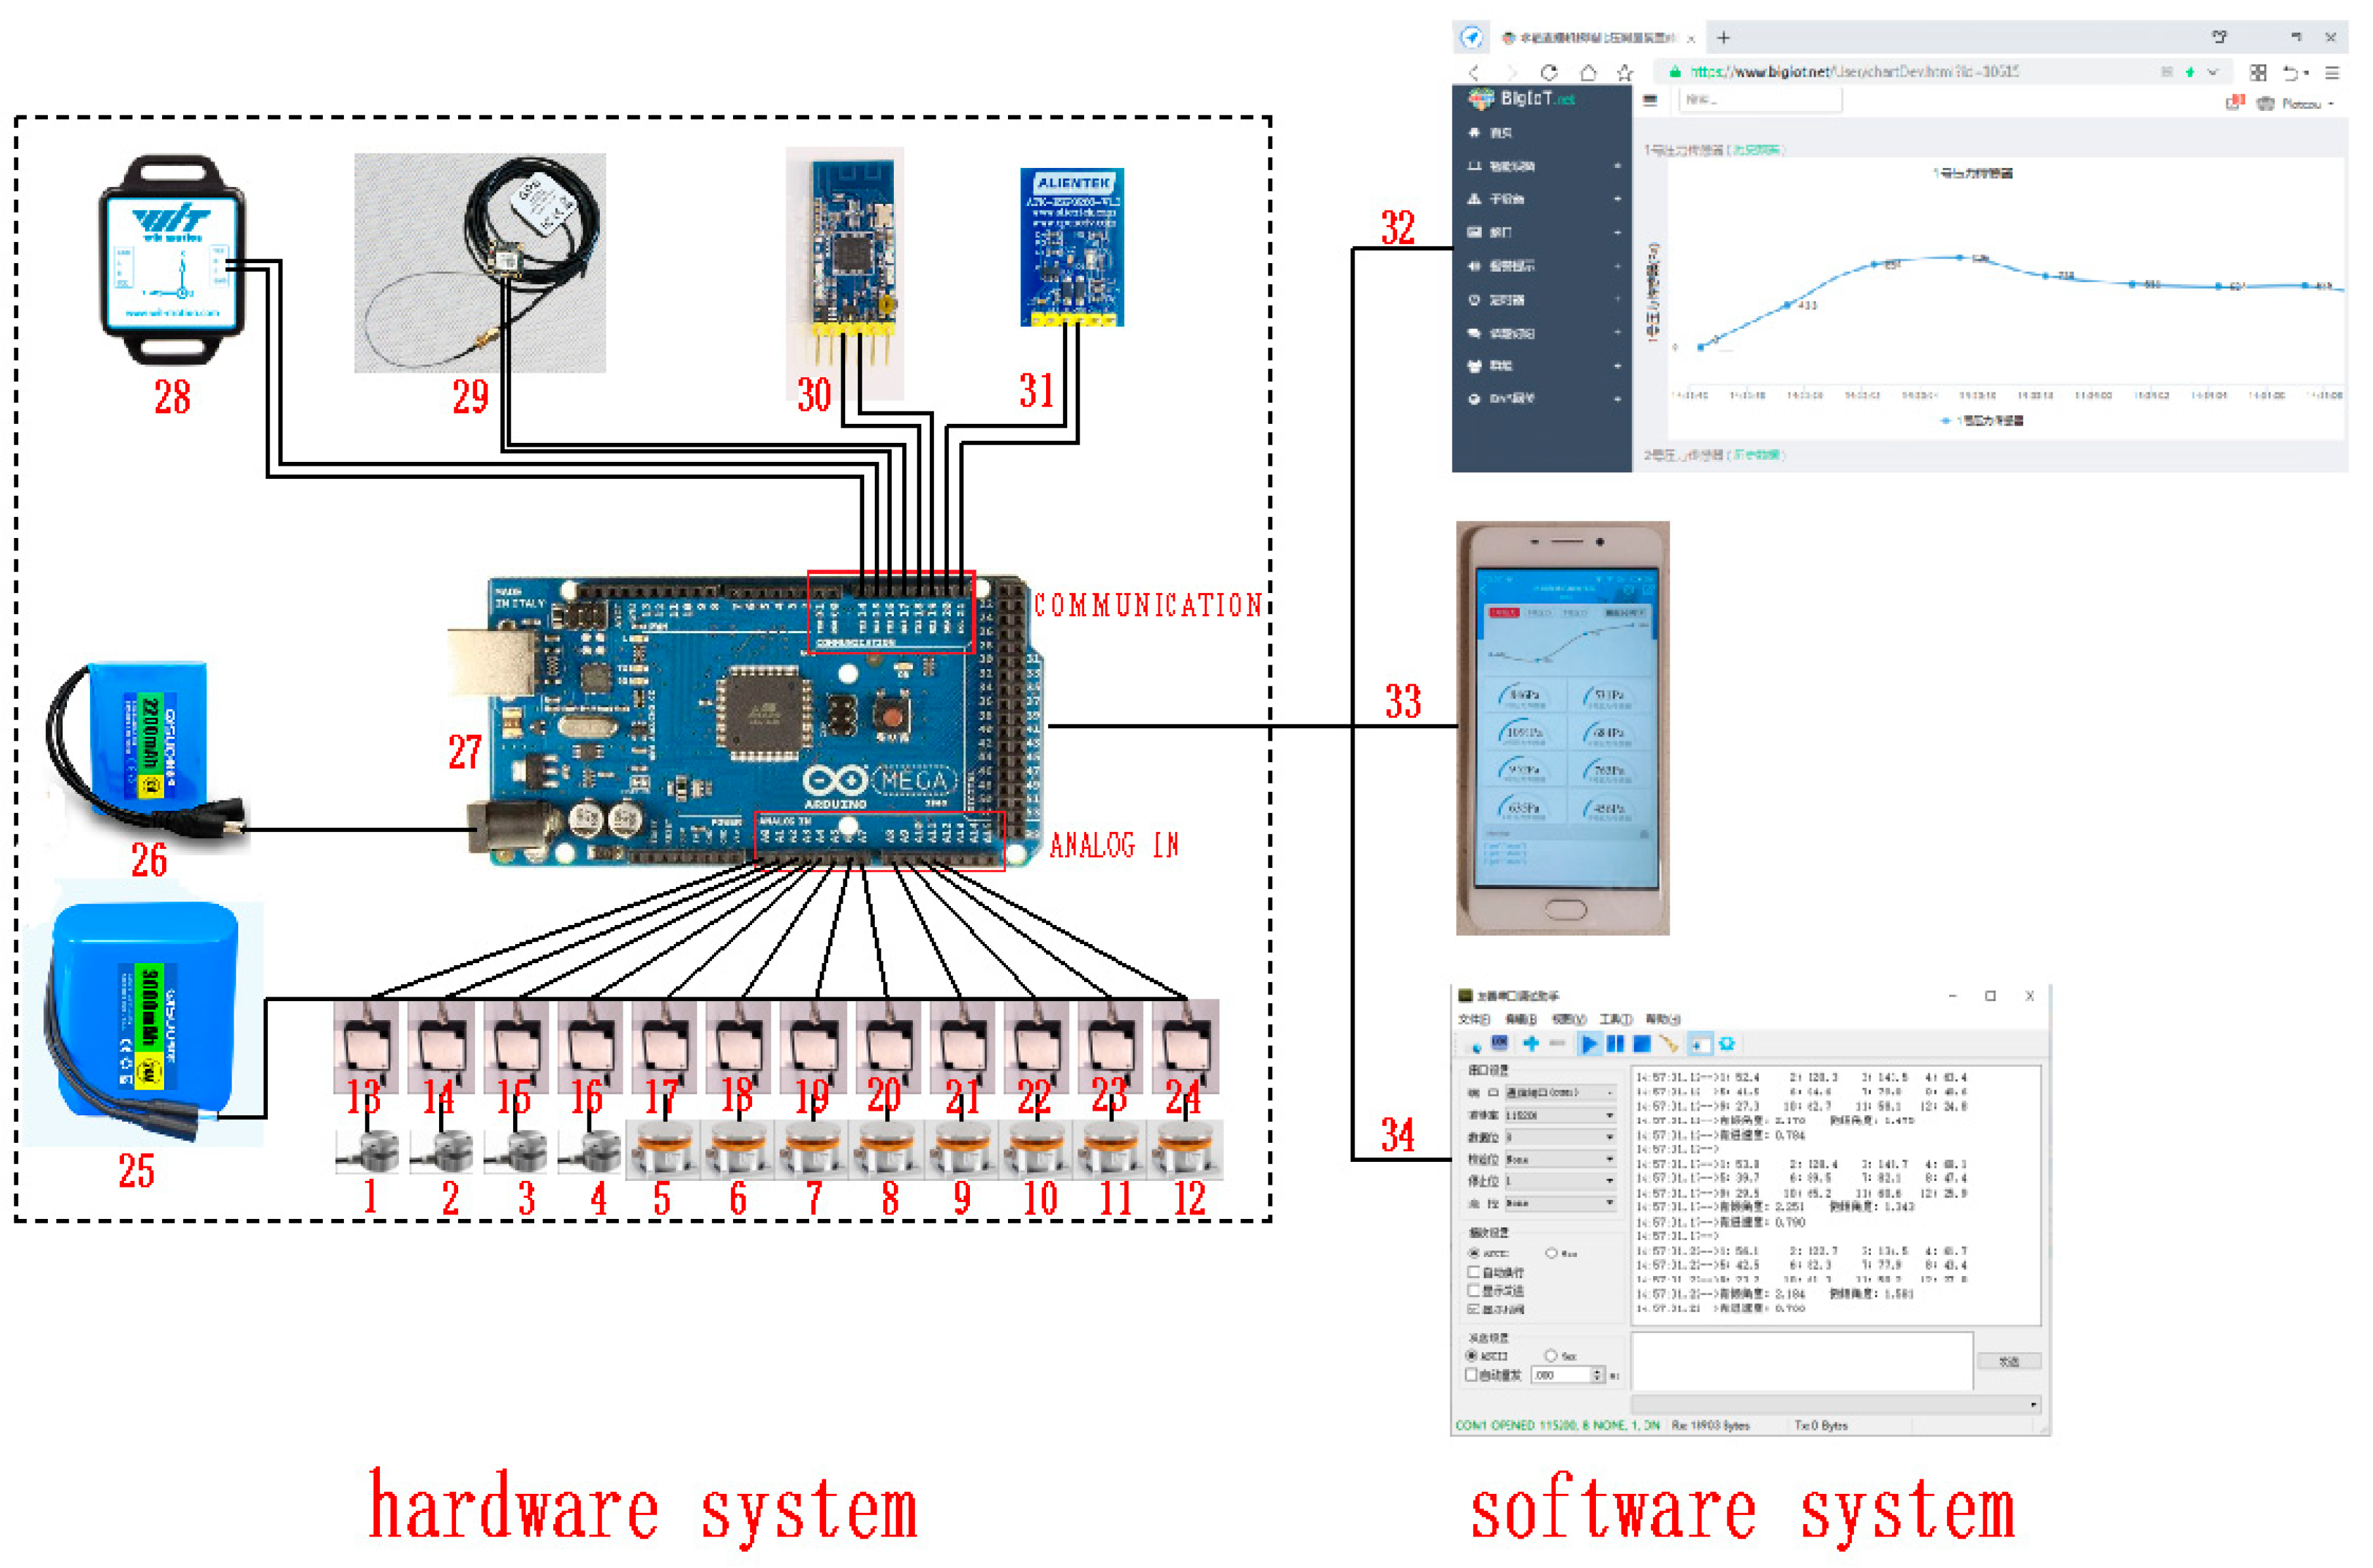
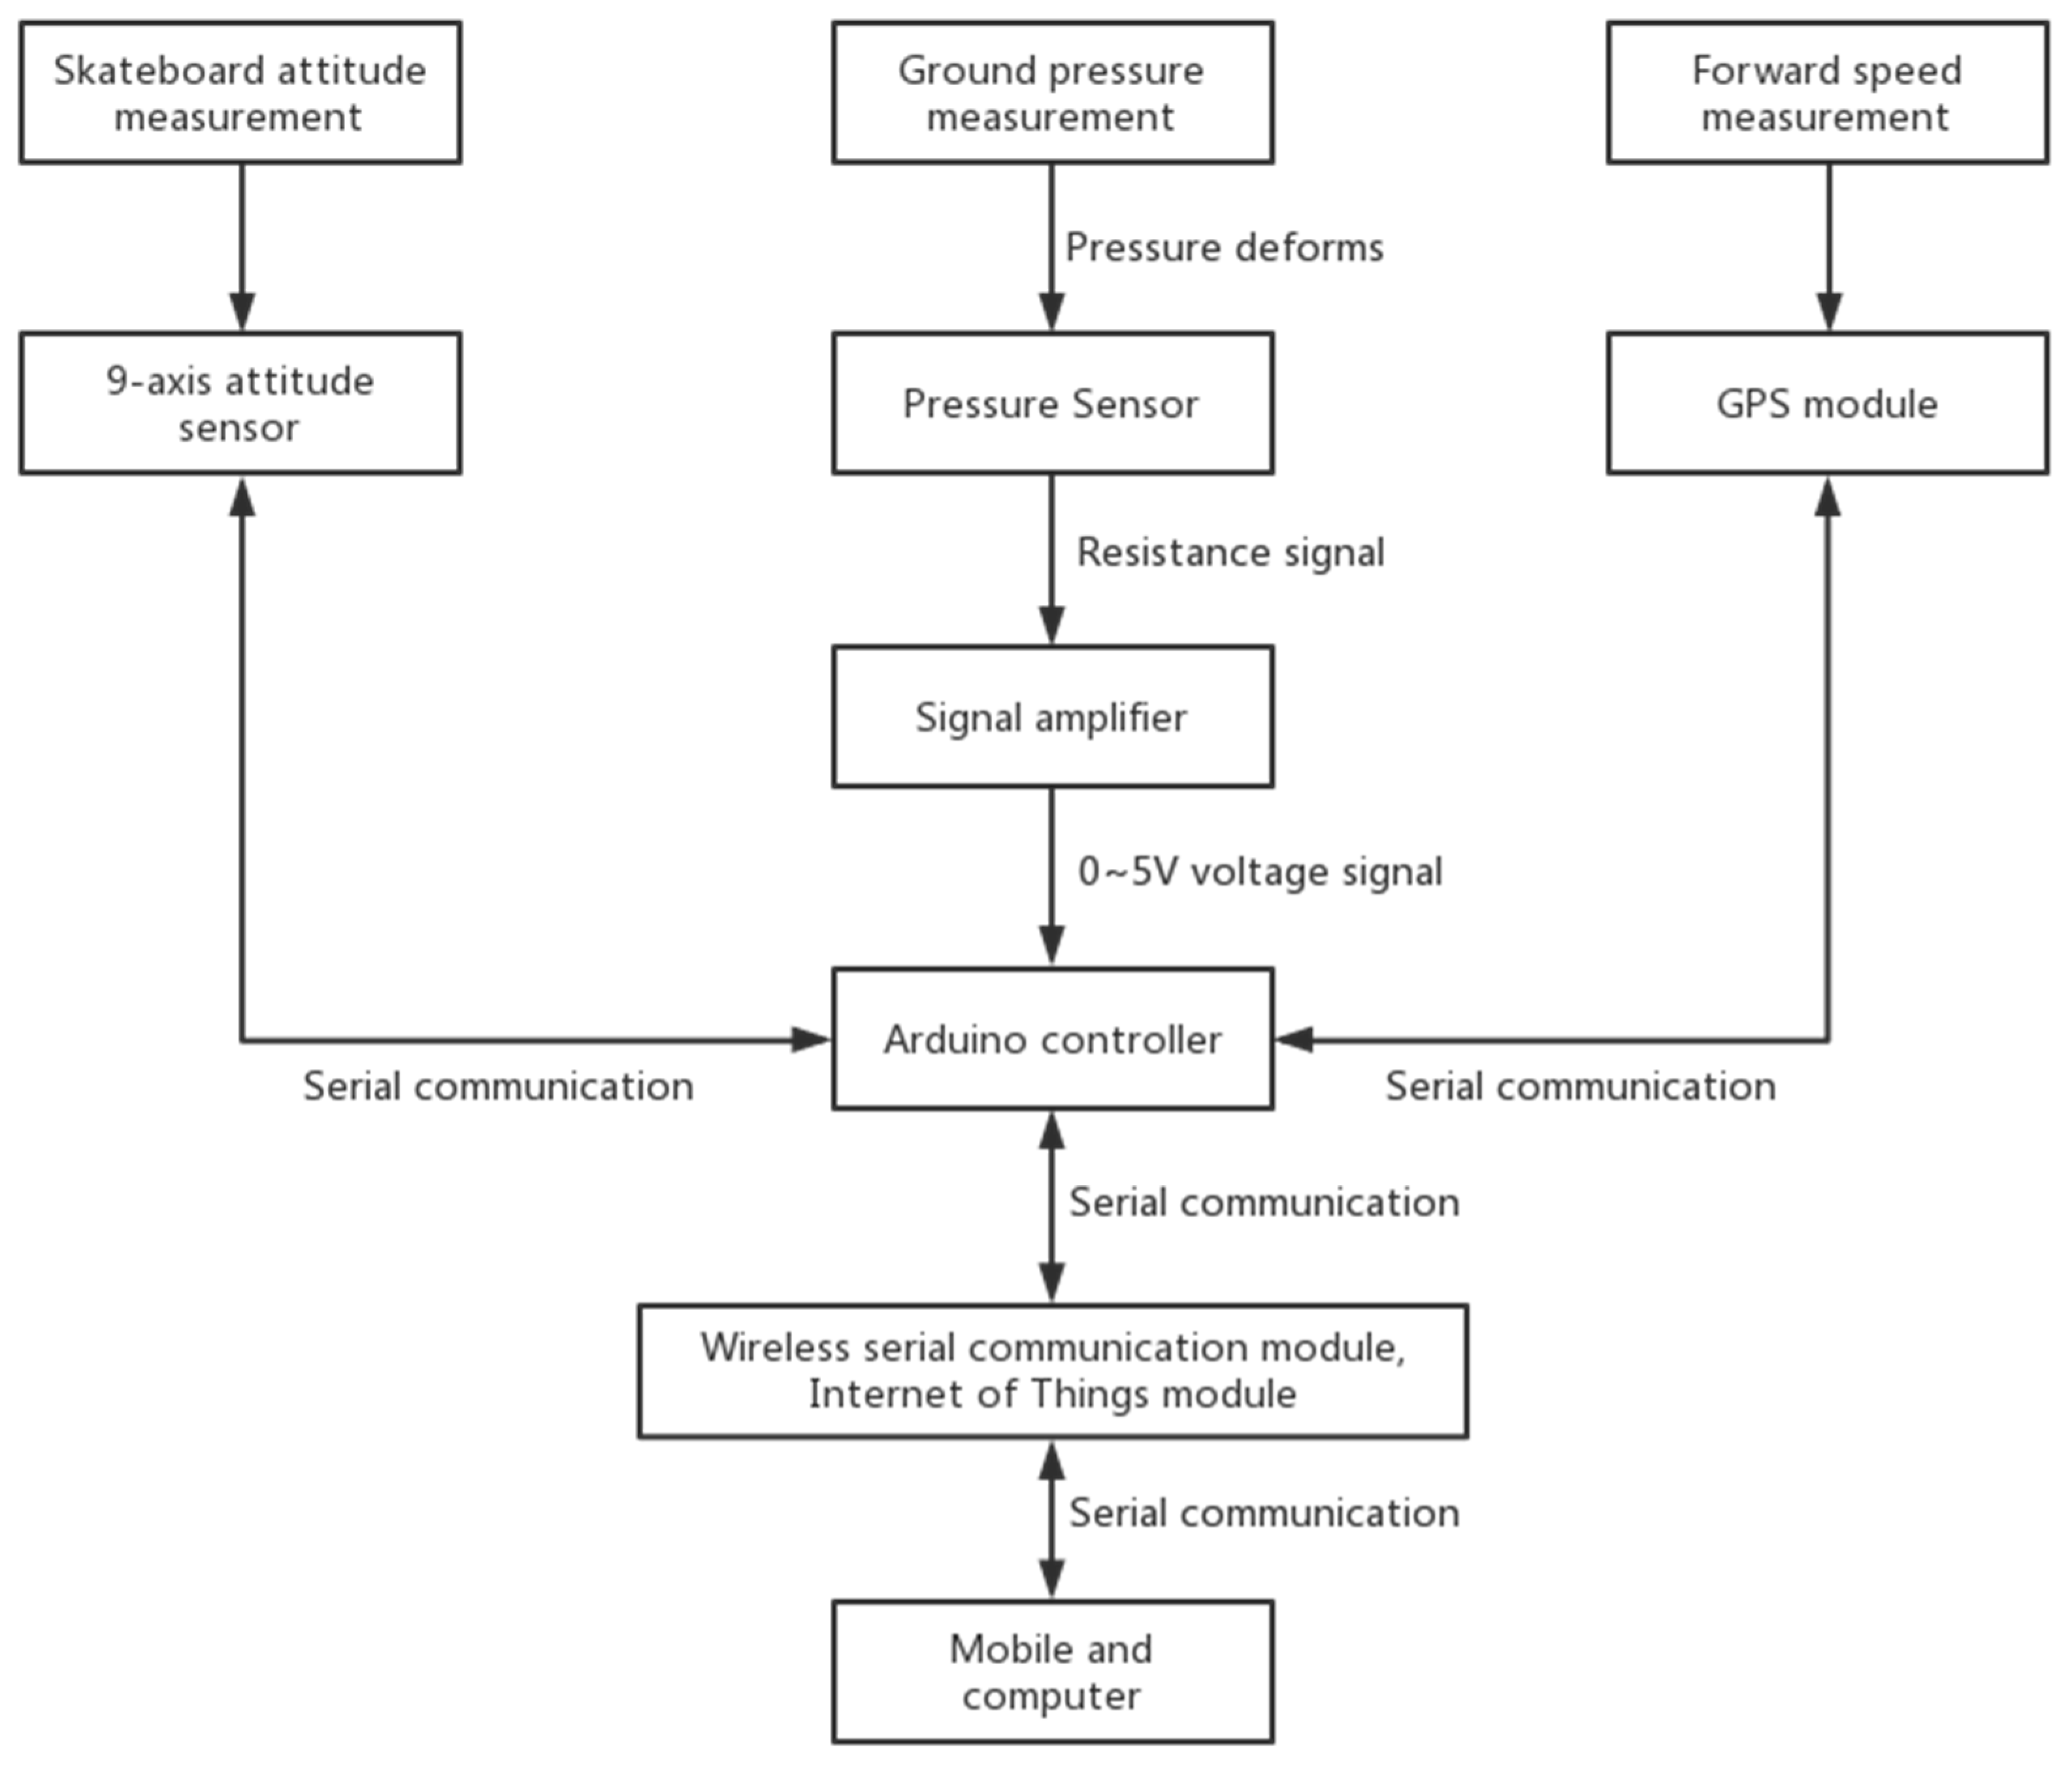
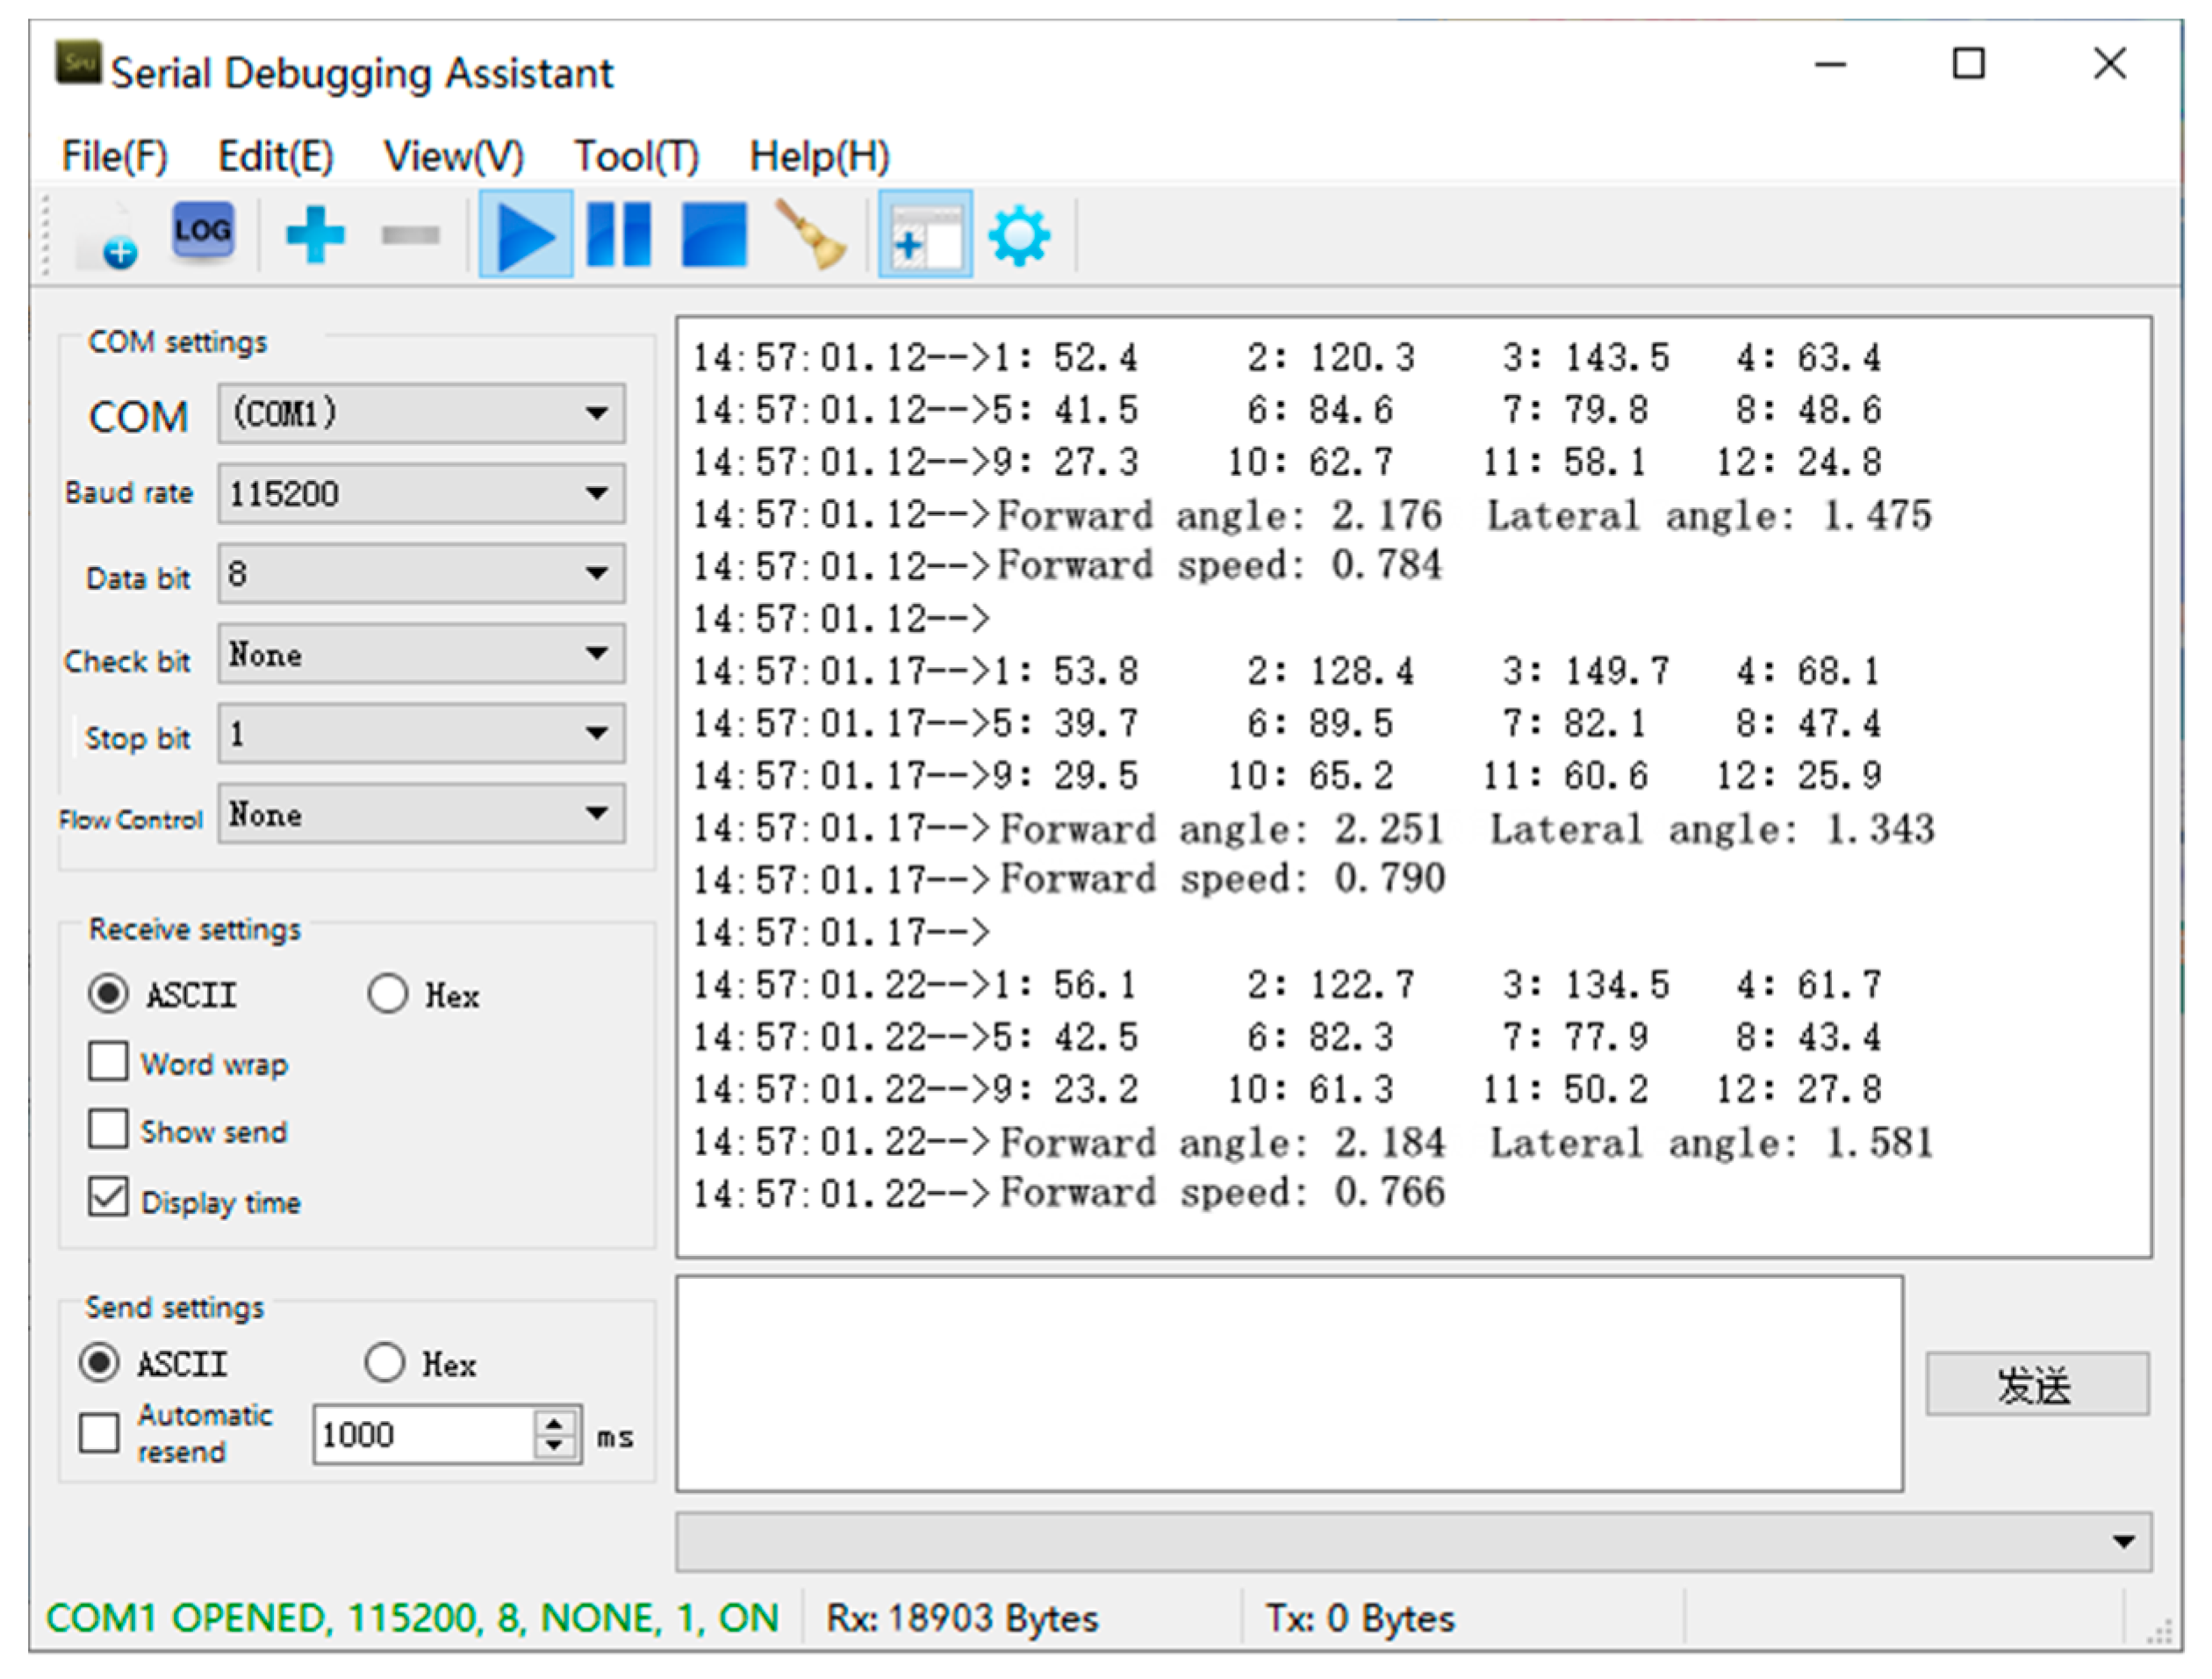
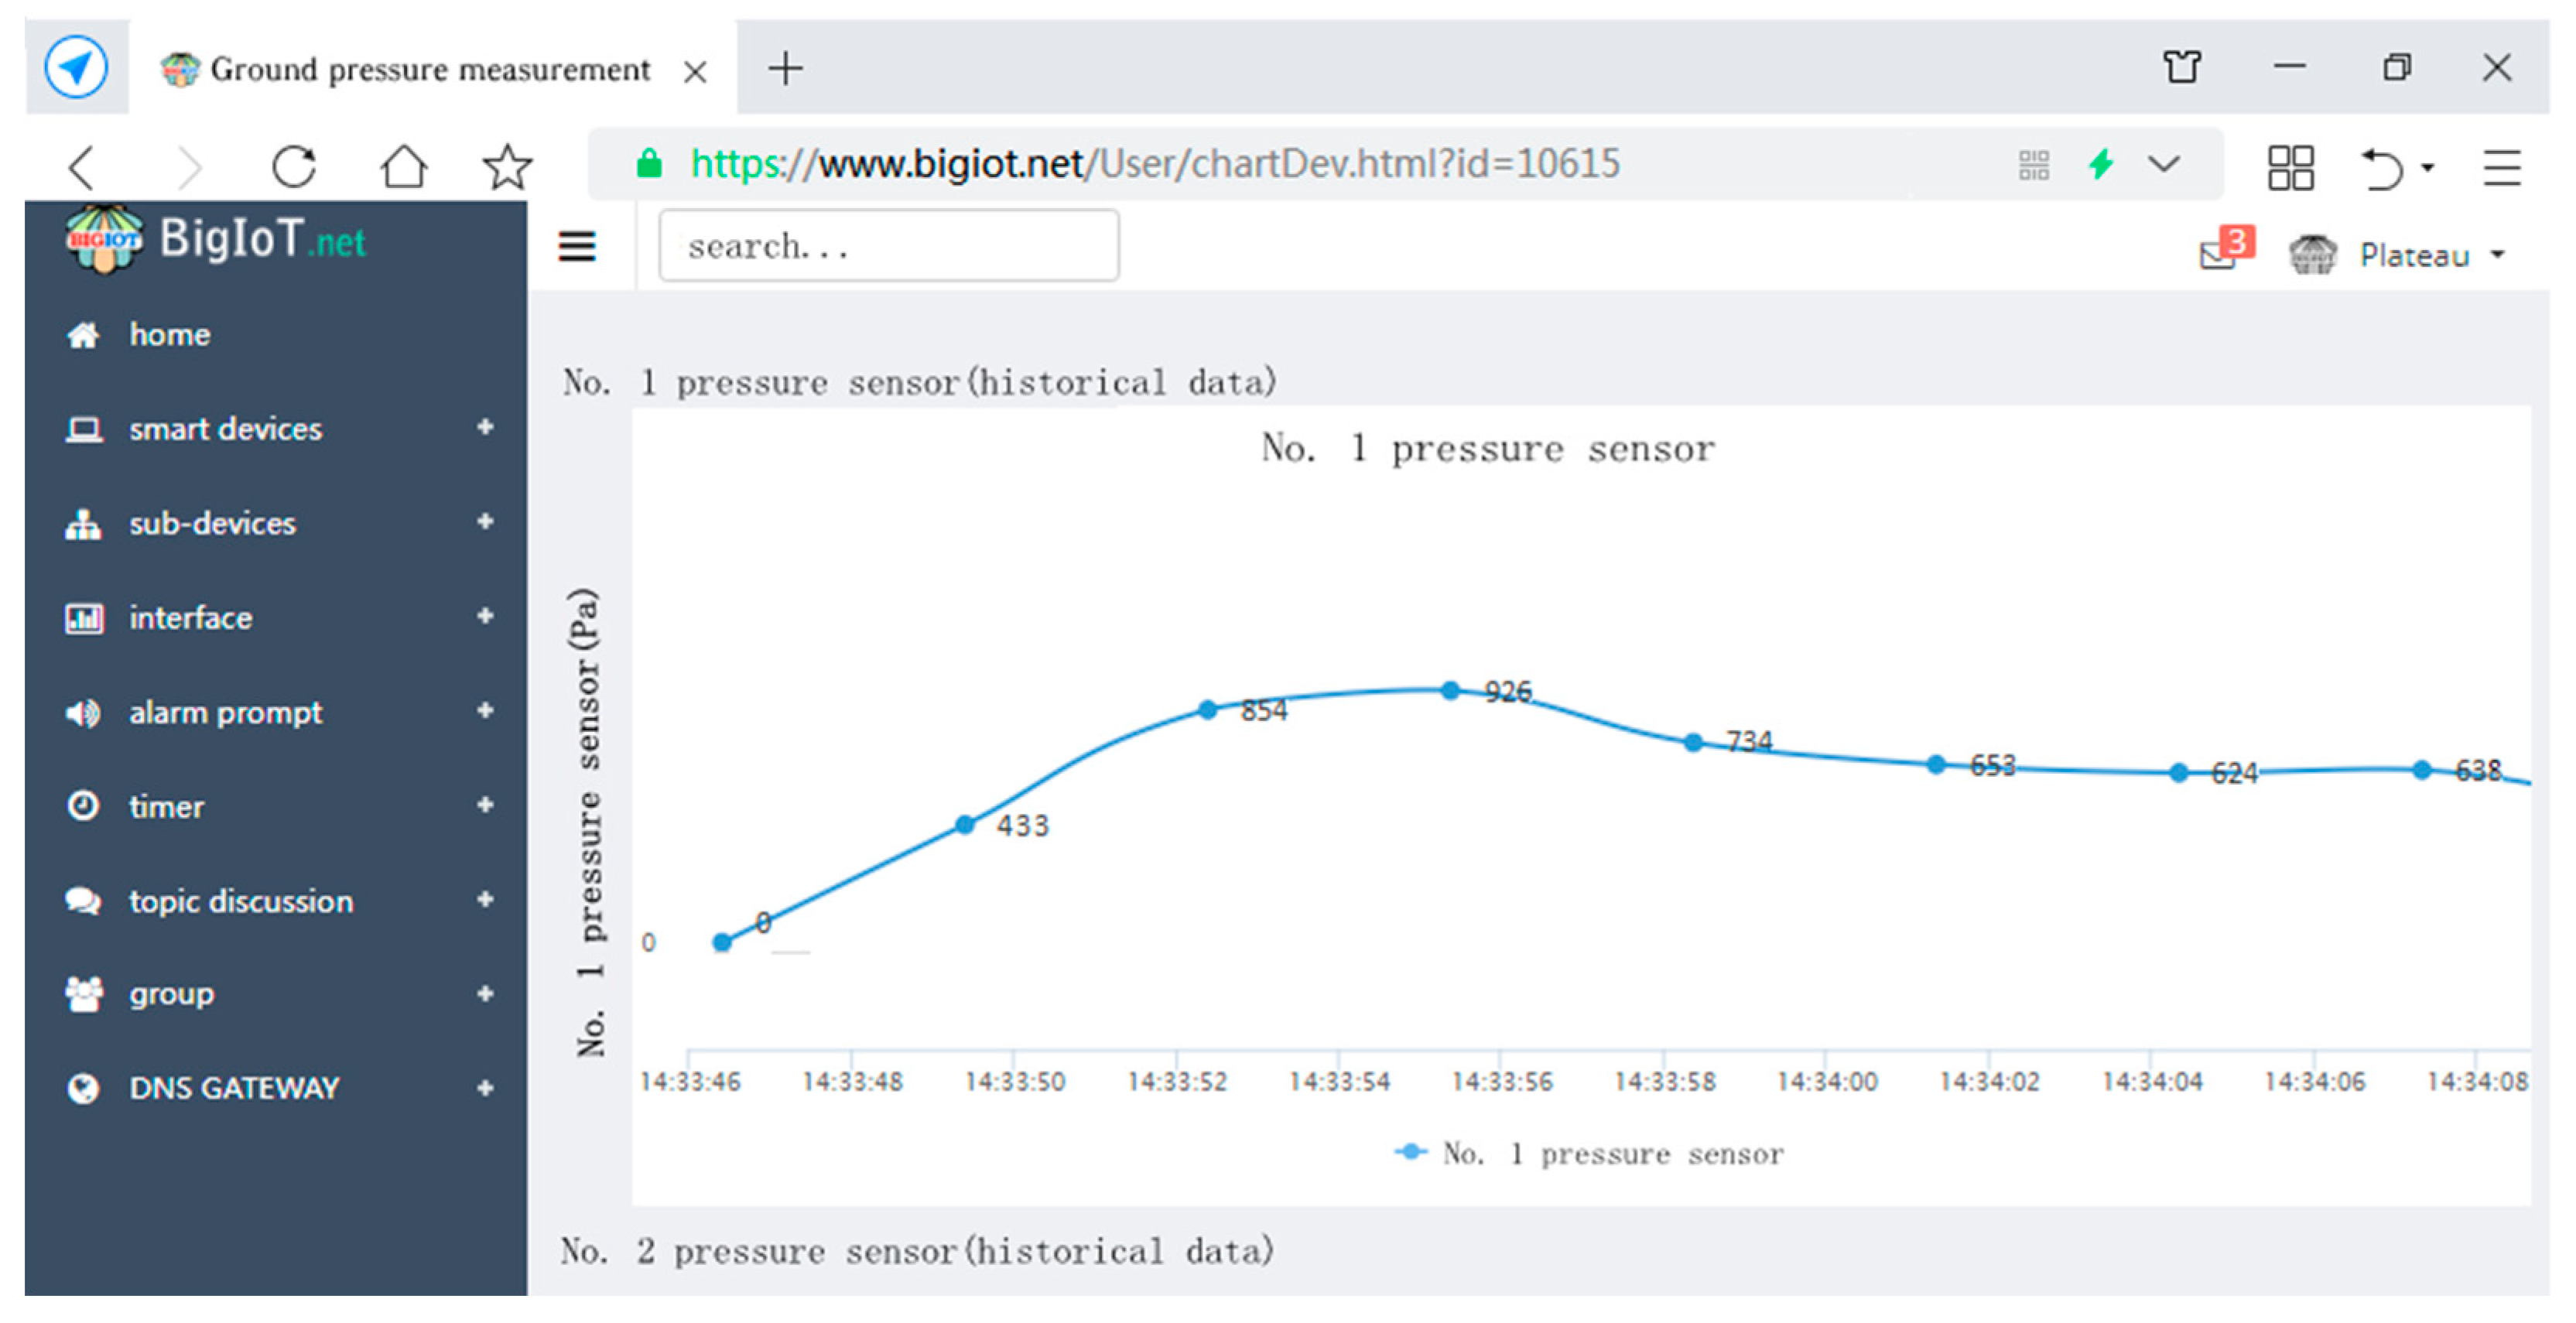
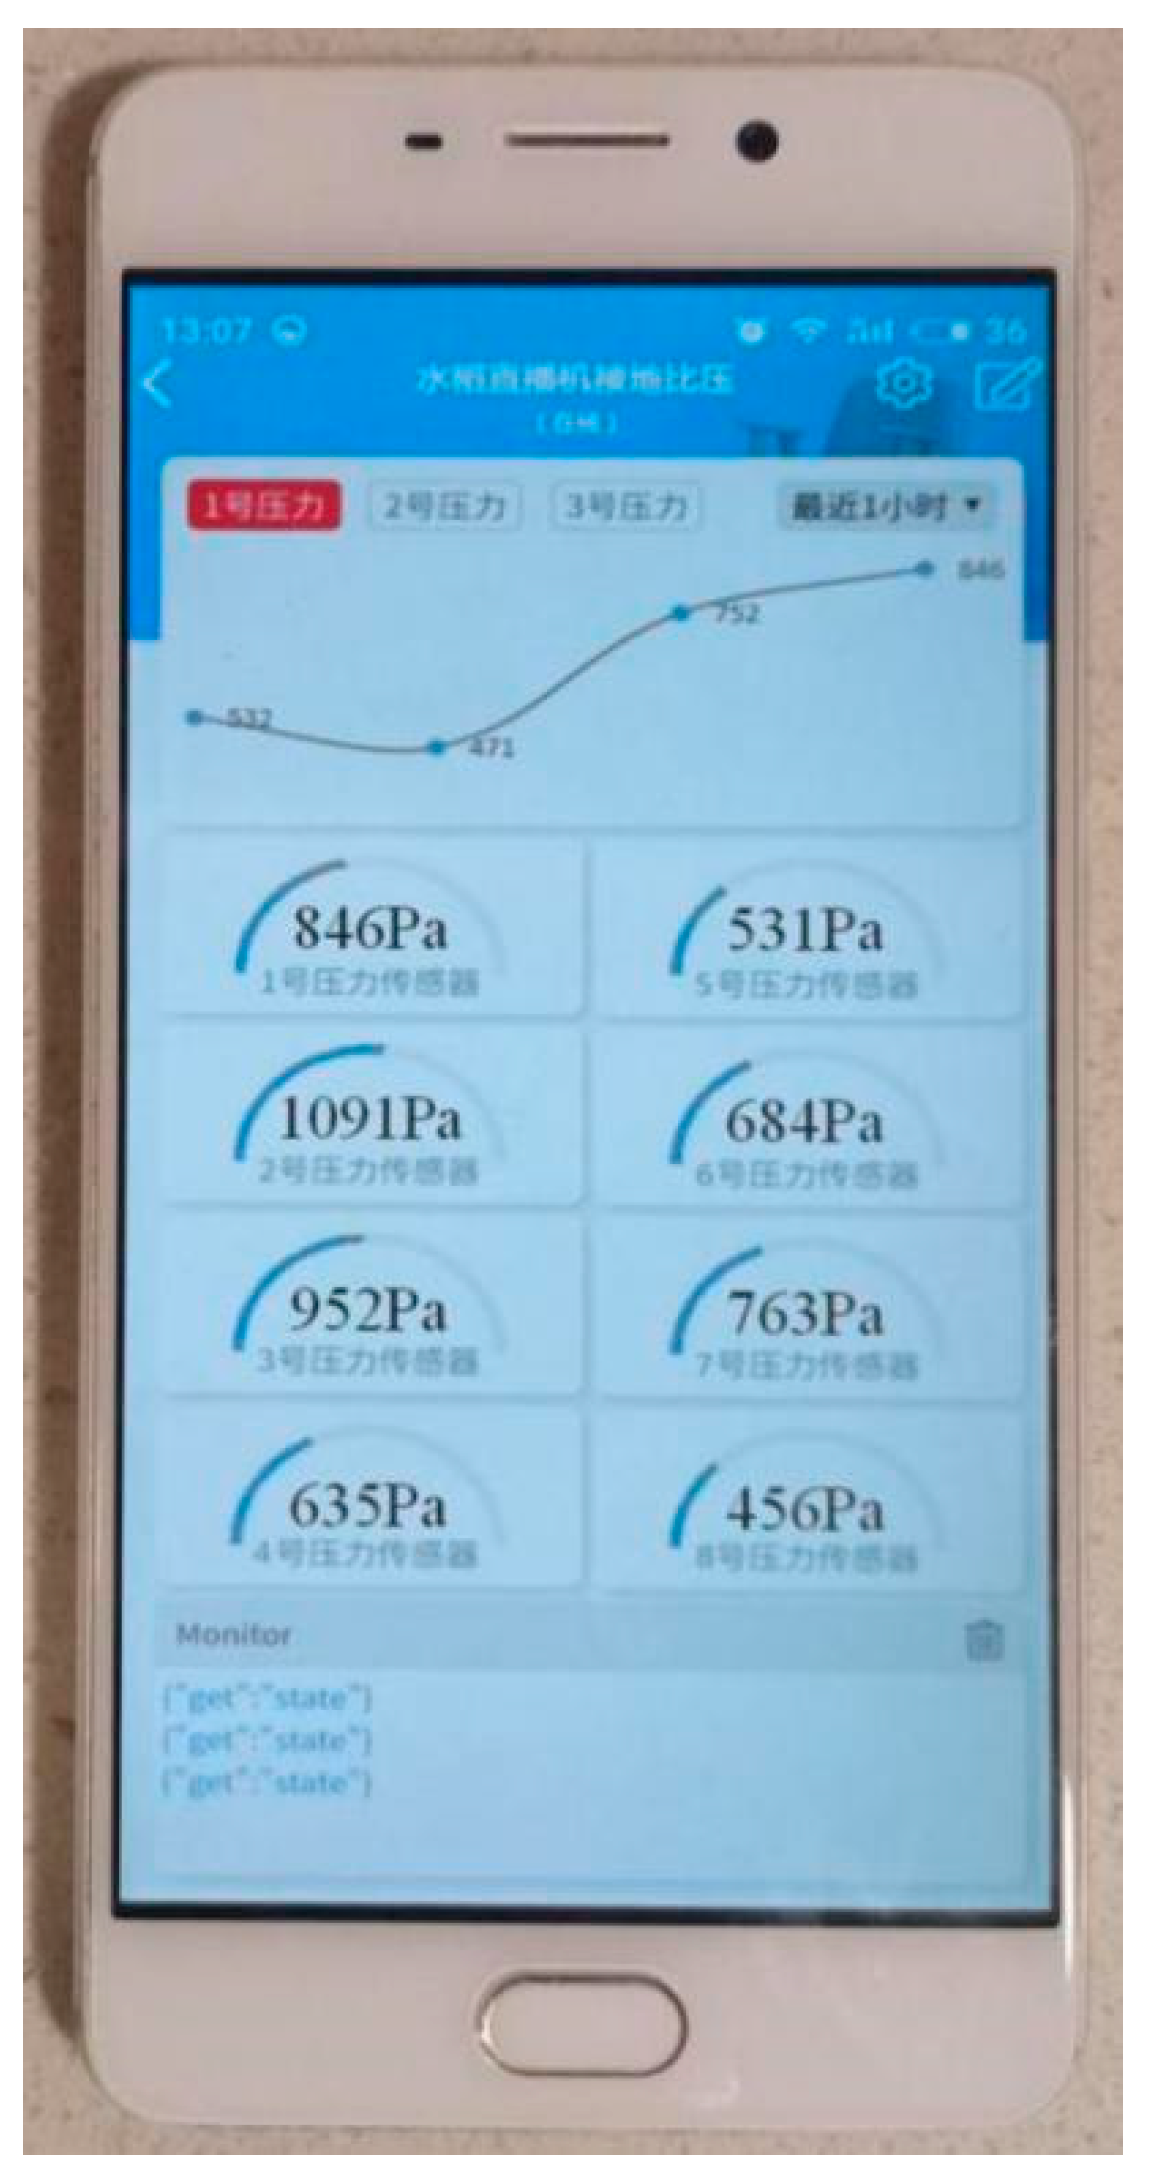
2.3.1. Wireless Serial Communication Measurement System

The Arduino controller is used for wireless serial port transmission of the measurement data. In addition, the serial port debugging software is used on the computer to receive the measurement data and display the measurement data in real time. In the meanwhile, the values of 12 pressure sensors are recorded, as well as forward tilt angle, roll angle, forward speed, time, and so on. Figure 8 shows the measurement software. The measurement data are saved by the measurement software and it can be processed and analyzed immediately.

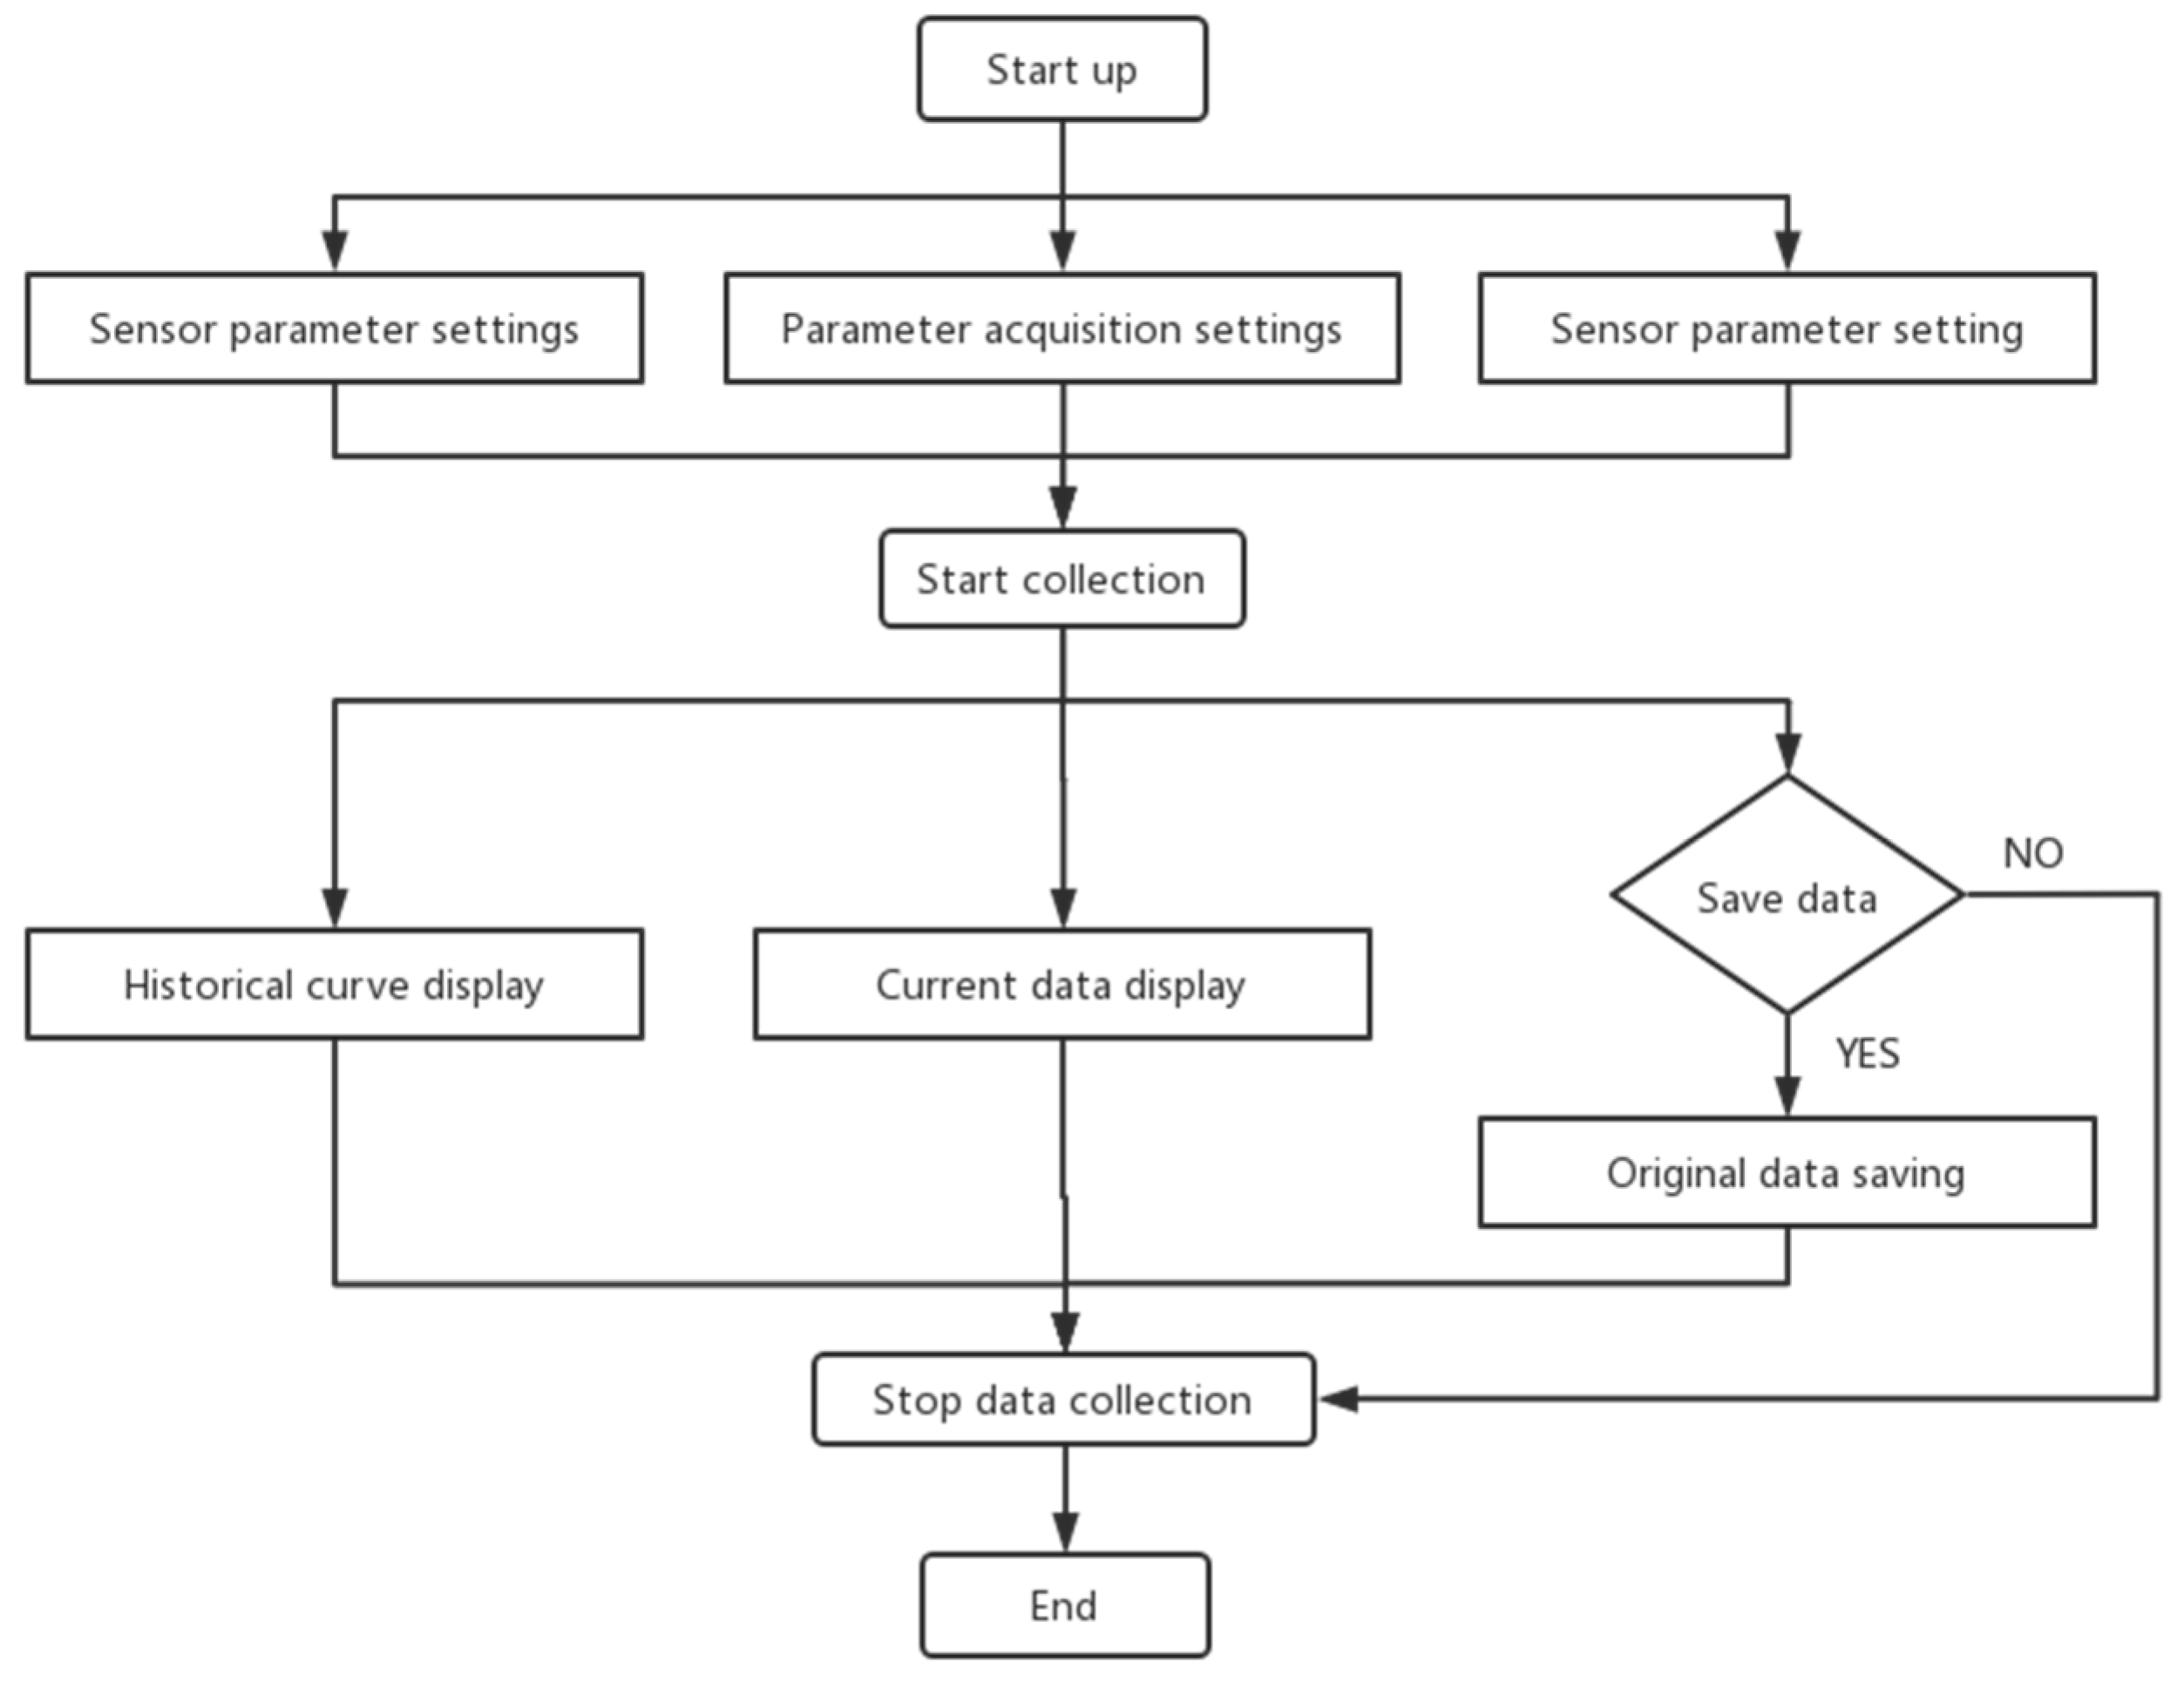
2.3.2. Internet of Things Measurement System

The ground pressure measurement system uses the shell Internet of things cloud platform, which can communicate with the Arduino controller, chat with the Arduino controller in the form of dialogue, remotely control the system, etc., through the Internet, using mobile phone apps or web pages to send instructions, view real-time data and historical data, control remotely, and so on. The pressure measurement data can be uploaded remotely to the Internet of things platform and displayed after the Arduino controller is connected to the Internet of things. When entering the web page of the Internet of things platform, you can connect an interface for each pressure sensor. In addition, you can view the measurement data of the interface in real time, and you can also look back at the historical data through this interface. When the measured data reach the threshold, the automatic alarm can be set to the mobile phone reminder. Figure 9 shows the computer-end ground pressure measurement system.
In the meanwhile, the mobile phone app and WeChat mini programs can be used to monitor the measured data in real time and the ground pressure measurement system can be remotely controlled to gradually approach the intelligence of agricultural machinery. Figure 10 shows the mobile phone terminal of the ground pressure measurement system.

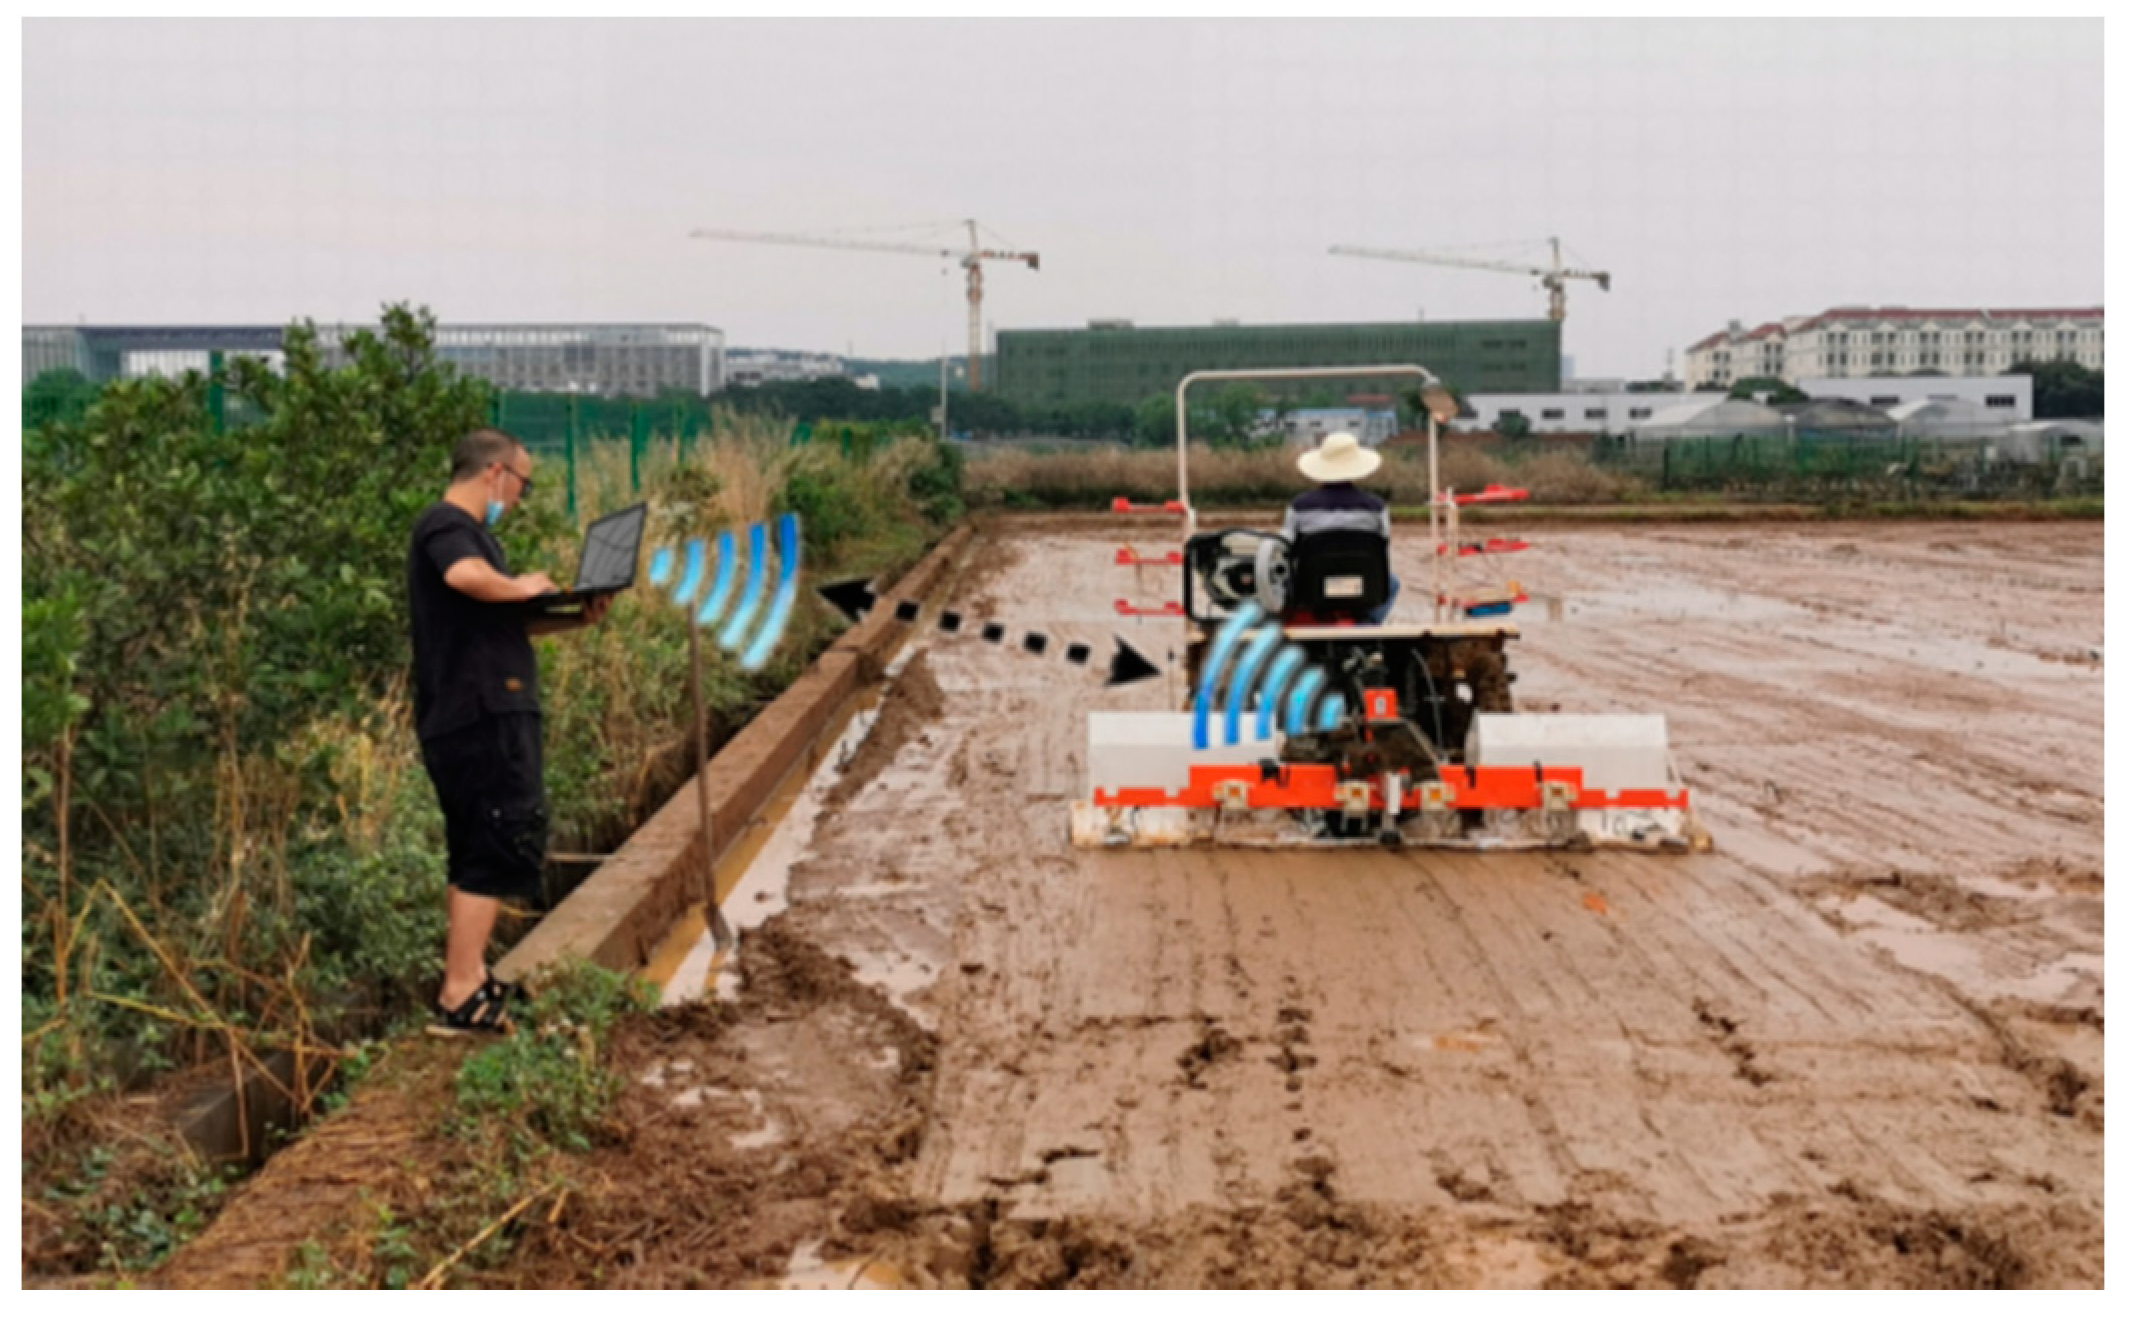
2.4. Field Experiment

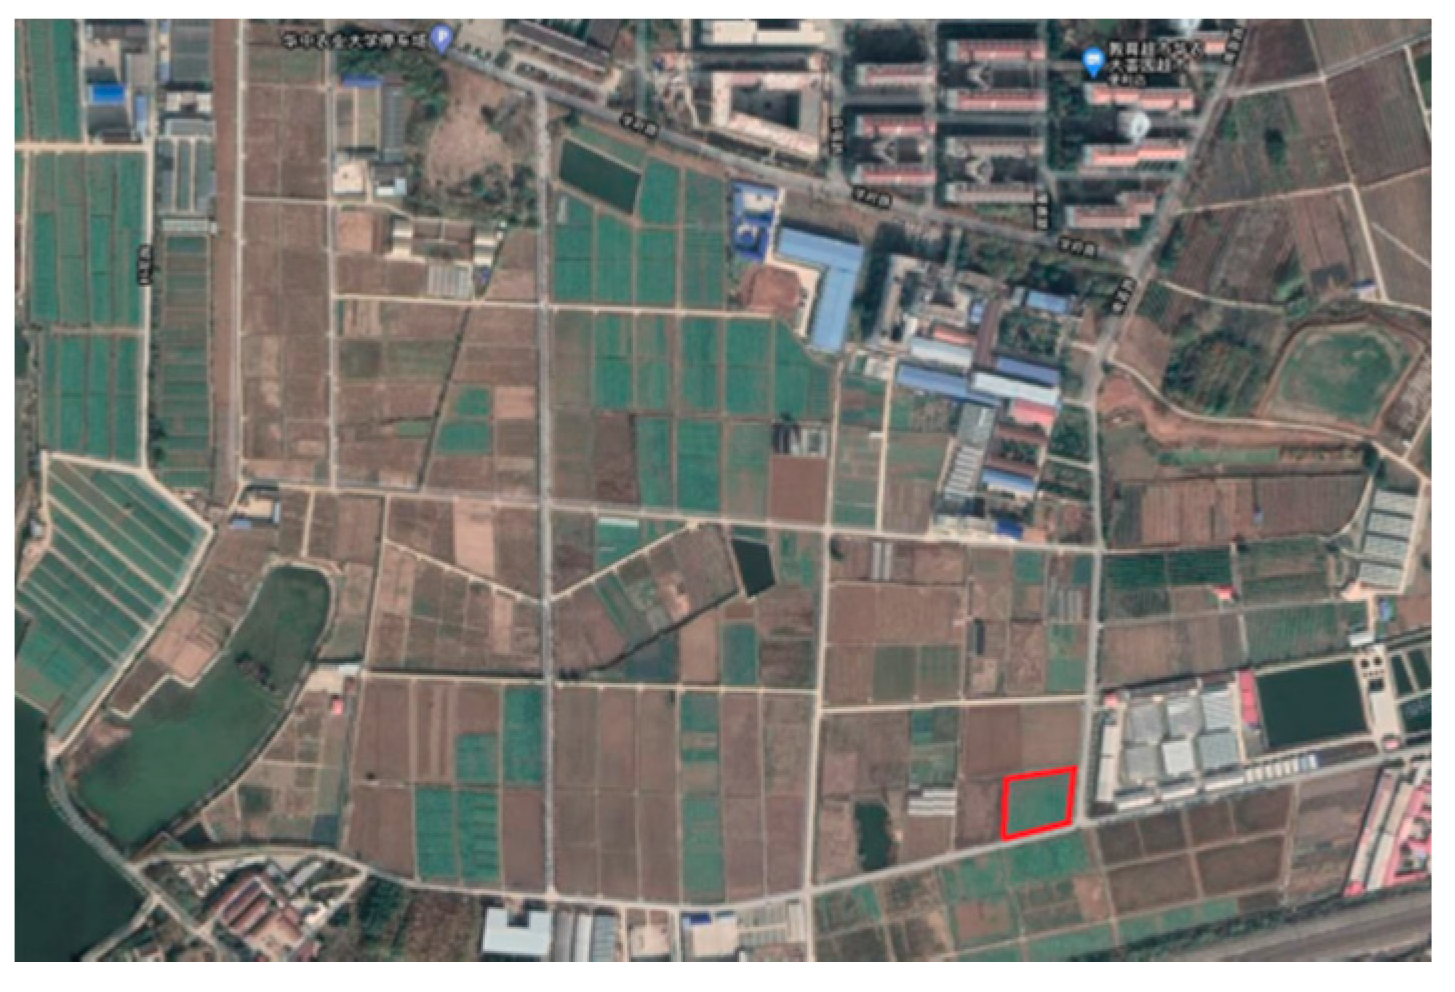
2.4.1. Experimental Conditions

The experimental field of Huazhong Agricultural University was selected. The field surface was irrigated to the height of 3–6 cm above the soil surface, soaked, rotary ploughed, scraped, and settled for 48 h before the experiment. The red wireframe in Figure 11 shows the location of the field, longitude: 114.3631, latitude: 30.4643. The experiment was conducted on the afternoon of 23 May 2020; the weather was cloudy to sunny and the temperature was 15 °C~23 °C.
There was no obvious stagnant water on the surface of the experimental paddy field. In addition, there was a small amount of stagnant water in a few areas, which is in line with the seeding environment of the rice direct seeding machine. Figure 12 shows the actual experimental environment.
The moisture content of soil samples was measured by a MB45 halogen moisture meter, which uses the principle of pyrolysis weight to measure the quality of soil samples at the beginning of drying, followed by heating and air-drying the soil samples through the heating unit and rapid water evaporator in the instrument. The average moisture content of the experimental field was 52.37%.
The soil firmness measurements of the surface layer of the water area and the non-water area were quite different, and the depth of the seeding skateboard was less than 200 mm because the surface of the paddy soil was uneven. As a consequence, 200 mm below the soil surface was selected as the measuring depth. Moreover, the average soil firmness of the experimental field was 278 kPa under the condition of 200 mm depth.

2.4.2. Experimental Design

The main factors affecting the ground pressure of the seeding skateboard model are forward speed and vertical load. As a consequence, the forward speed and vertical load were selected as the experimental factors, and the horizontal parameter range of each factor was as follows:
Generally speaking, the higher the forward speed, the higher the working efficiency, and the running speed of the rice transplanter is 0–1.5 m/s. Considering the operational control of the measuring system, according to the scale of the maximum cruising speed of the rice transplanter, the scale was divided into 4 equal points and marked. Cruise driving at a constant speed was carried out according to the scale mark. The average speeds measured by GPS module under different experiment conditions were 0.175, 0.544, 0.919 and 1.283 m/s.
The vertical load is an important factor affecting the ground pressure of the seeding skateboard, as well as the sliding resistance and sinking depth of the skateboard in the process of sliding. The weight of the experiment skateboard was 80 kg. The average ground pressure was about 1000 Pa. The counterweight is the standard counterweight of a Dongfanghong 954 tractor, and its weight was 40 kg according to the weight of the experiment skateboard divided by the grounding area, 0.8 m2, of the experiment skateboard. Considering these factors comprehensively, the vertical load was set to 0, 40, 80, 120, and 160 kg.

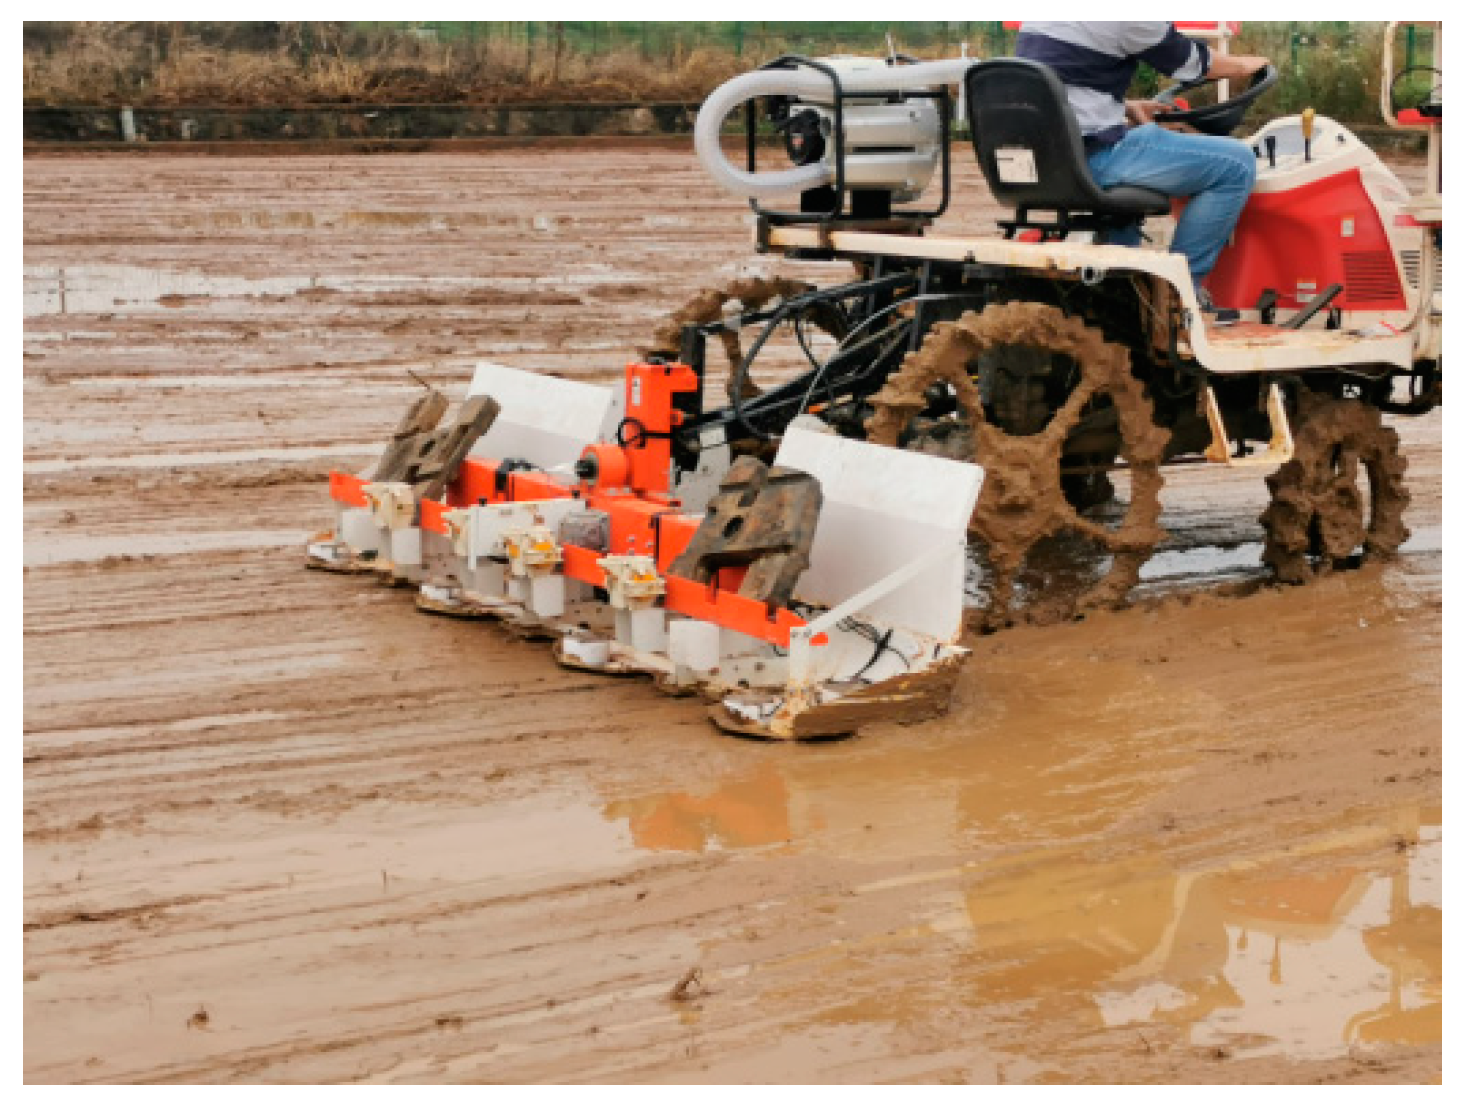
2.4.3. Experimental Process

Power was used for the ground pressure measurement system at the start of the experiment and to make the Internet of things and wireless serial port transceiver module run. In addition, the seeding skateboard of the rice transplanter is pulled by the transplanter to start the experiment. In order to ensure the wireless and stable transmission of data, and to prevent the excessive amount of repeated data from affecting the calculation and filtering effect of the Arduino controller, the experimental data acquisition frequency was set at 20 Hz. The experimental results show that this frequency can ensure the accuracy and reliability of the data. Cruising was carried out with different speeds and different loads, and the data were measured by the ground pressure measurement system and wirelessly uploaded to the computer end. The system was used to change the number of counterweights or forward speed, to regularly check whether the working condition of each sensor was stable, and to try to ensure that the experimental conditions of each group were consistent after each group of experiments. The experiment scenario is shown in Figure 13.

3. Results

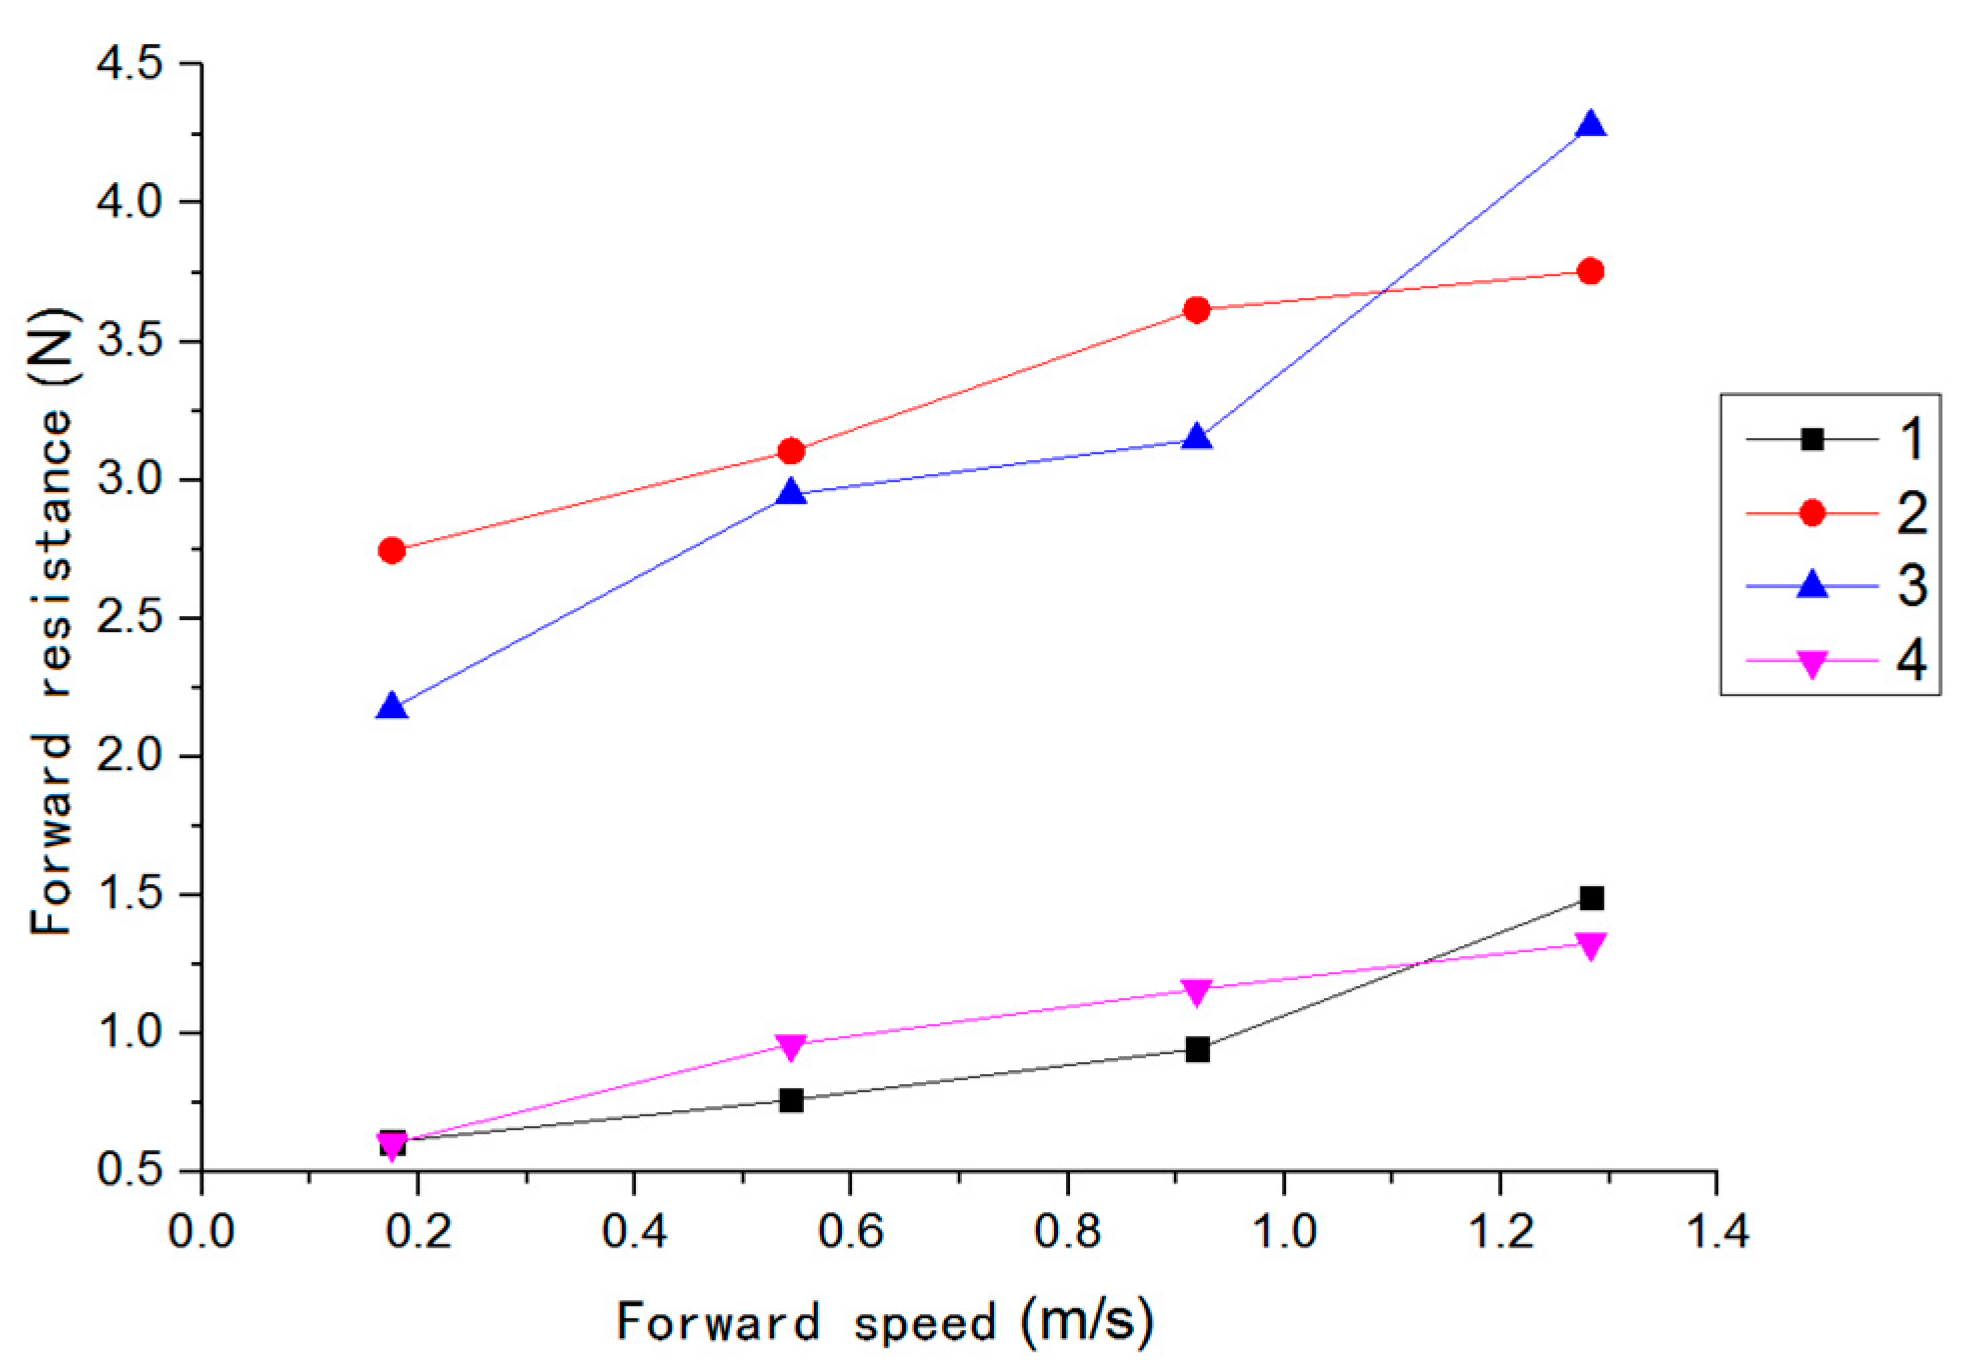
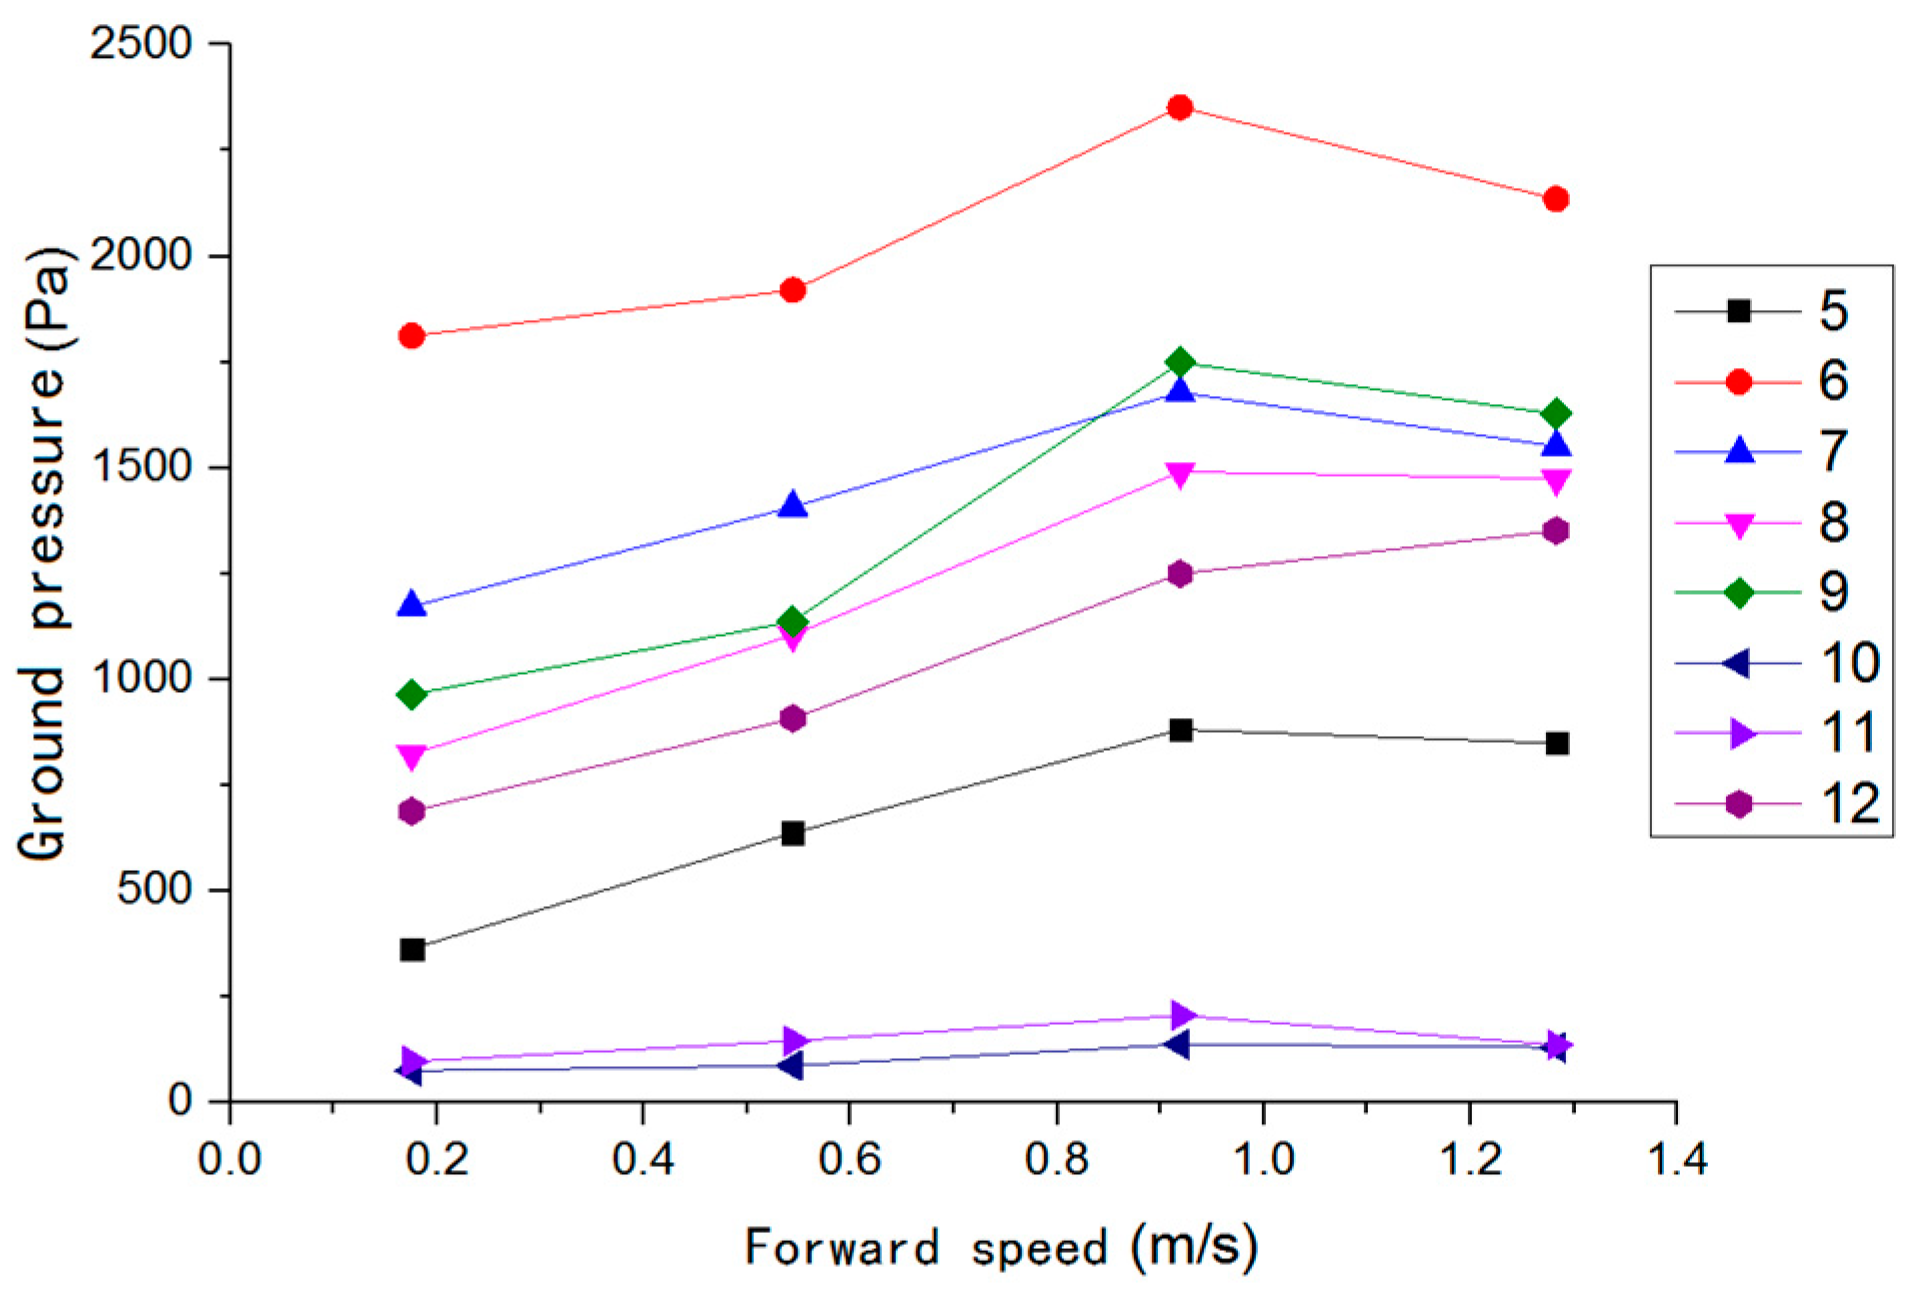
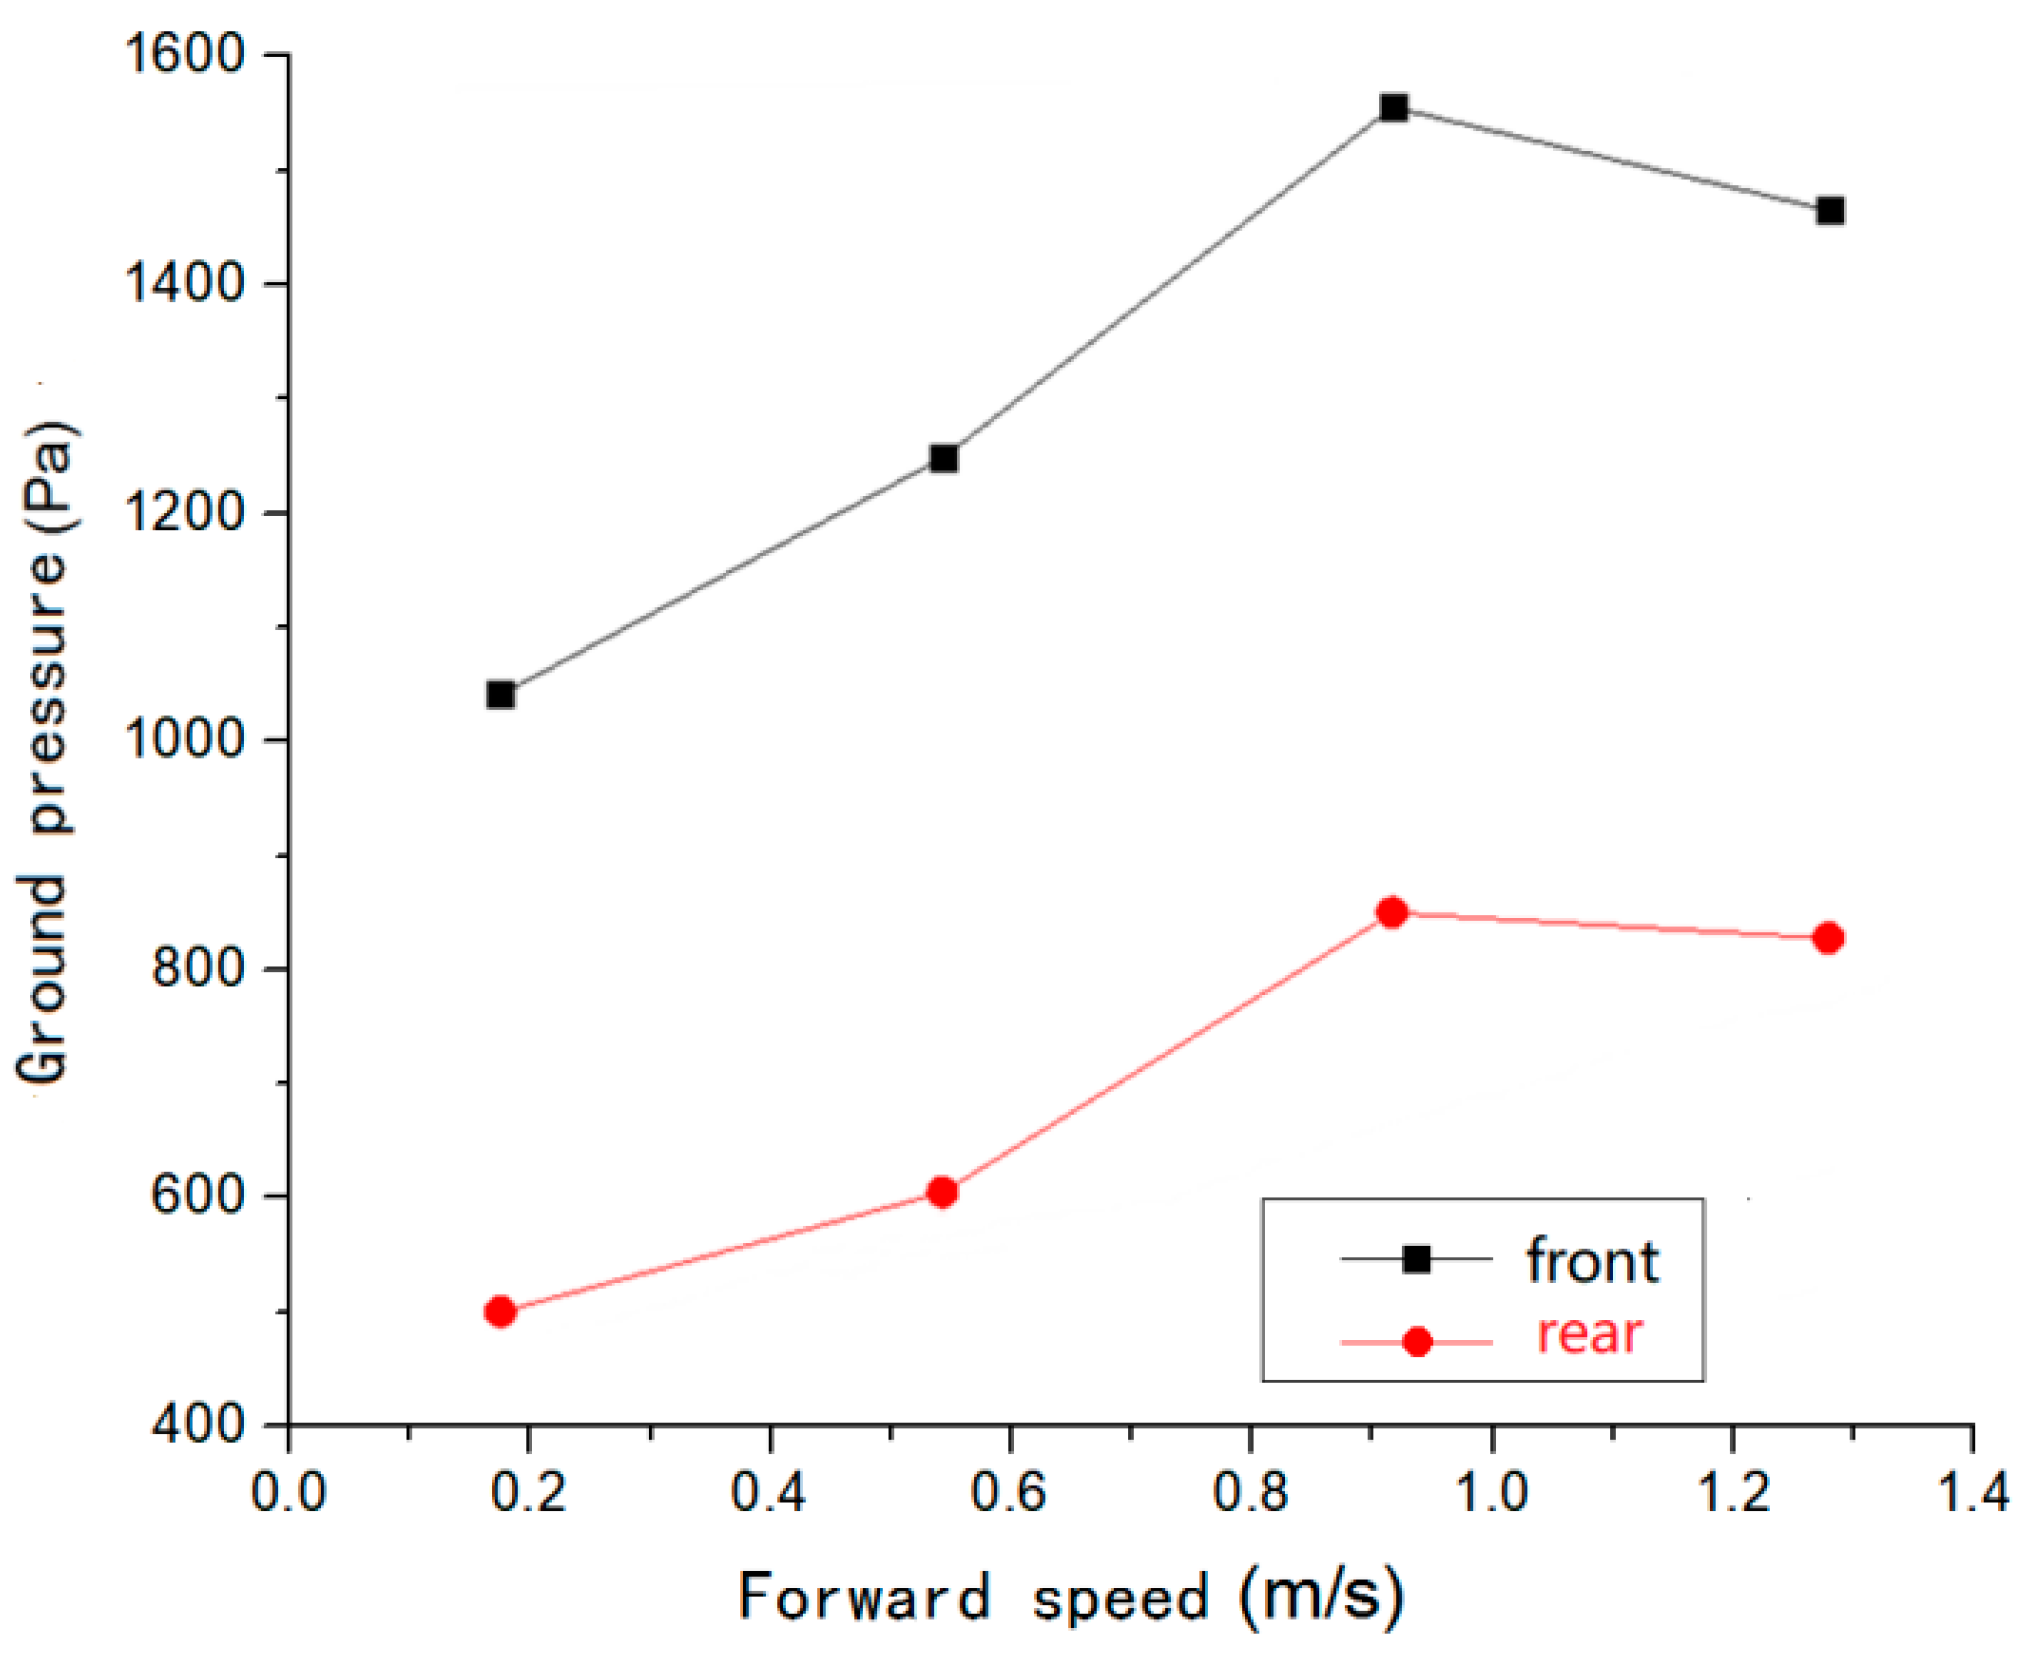
3.1. The Relationship between Forward Resistance, Ground Pressure, and Forward Speed

Multi-level experiments were carried out under variable forward speeds (v = 0.175, 0.544, 0.919, and 1.283 m/s). In addition, the forward resistance and ground pressure values at different forward speeds were measured. Nos. 1–4 are the forward resistance sensors, Nos. 5–8 are the front-end pressure sensors, and Nos. 9–12 are the back-end pressure sensors. The variation curves are shown in Figure 14 and Figure 15.
The following conclusions can be drawn based on the analysis of the above figure:
The ground pressure and forward resistance of the skateboard show an upward trend when other conditions remain unchanged and the forward speed of the skateboard increases. When the forward speed v increases, the traction force F and the reaction force Nx of the skateboard increase, forming a torque that makes the skateboard tilt forward, so that the forward tilting angle of the skateboard increases. When the skateboard tilts forward, the ground-specific pressure at the front and back ends of the skateboard will decrease slightly. In addition, Figure 16 shows the main force on the skateboard.

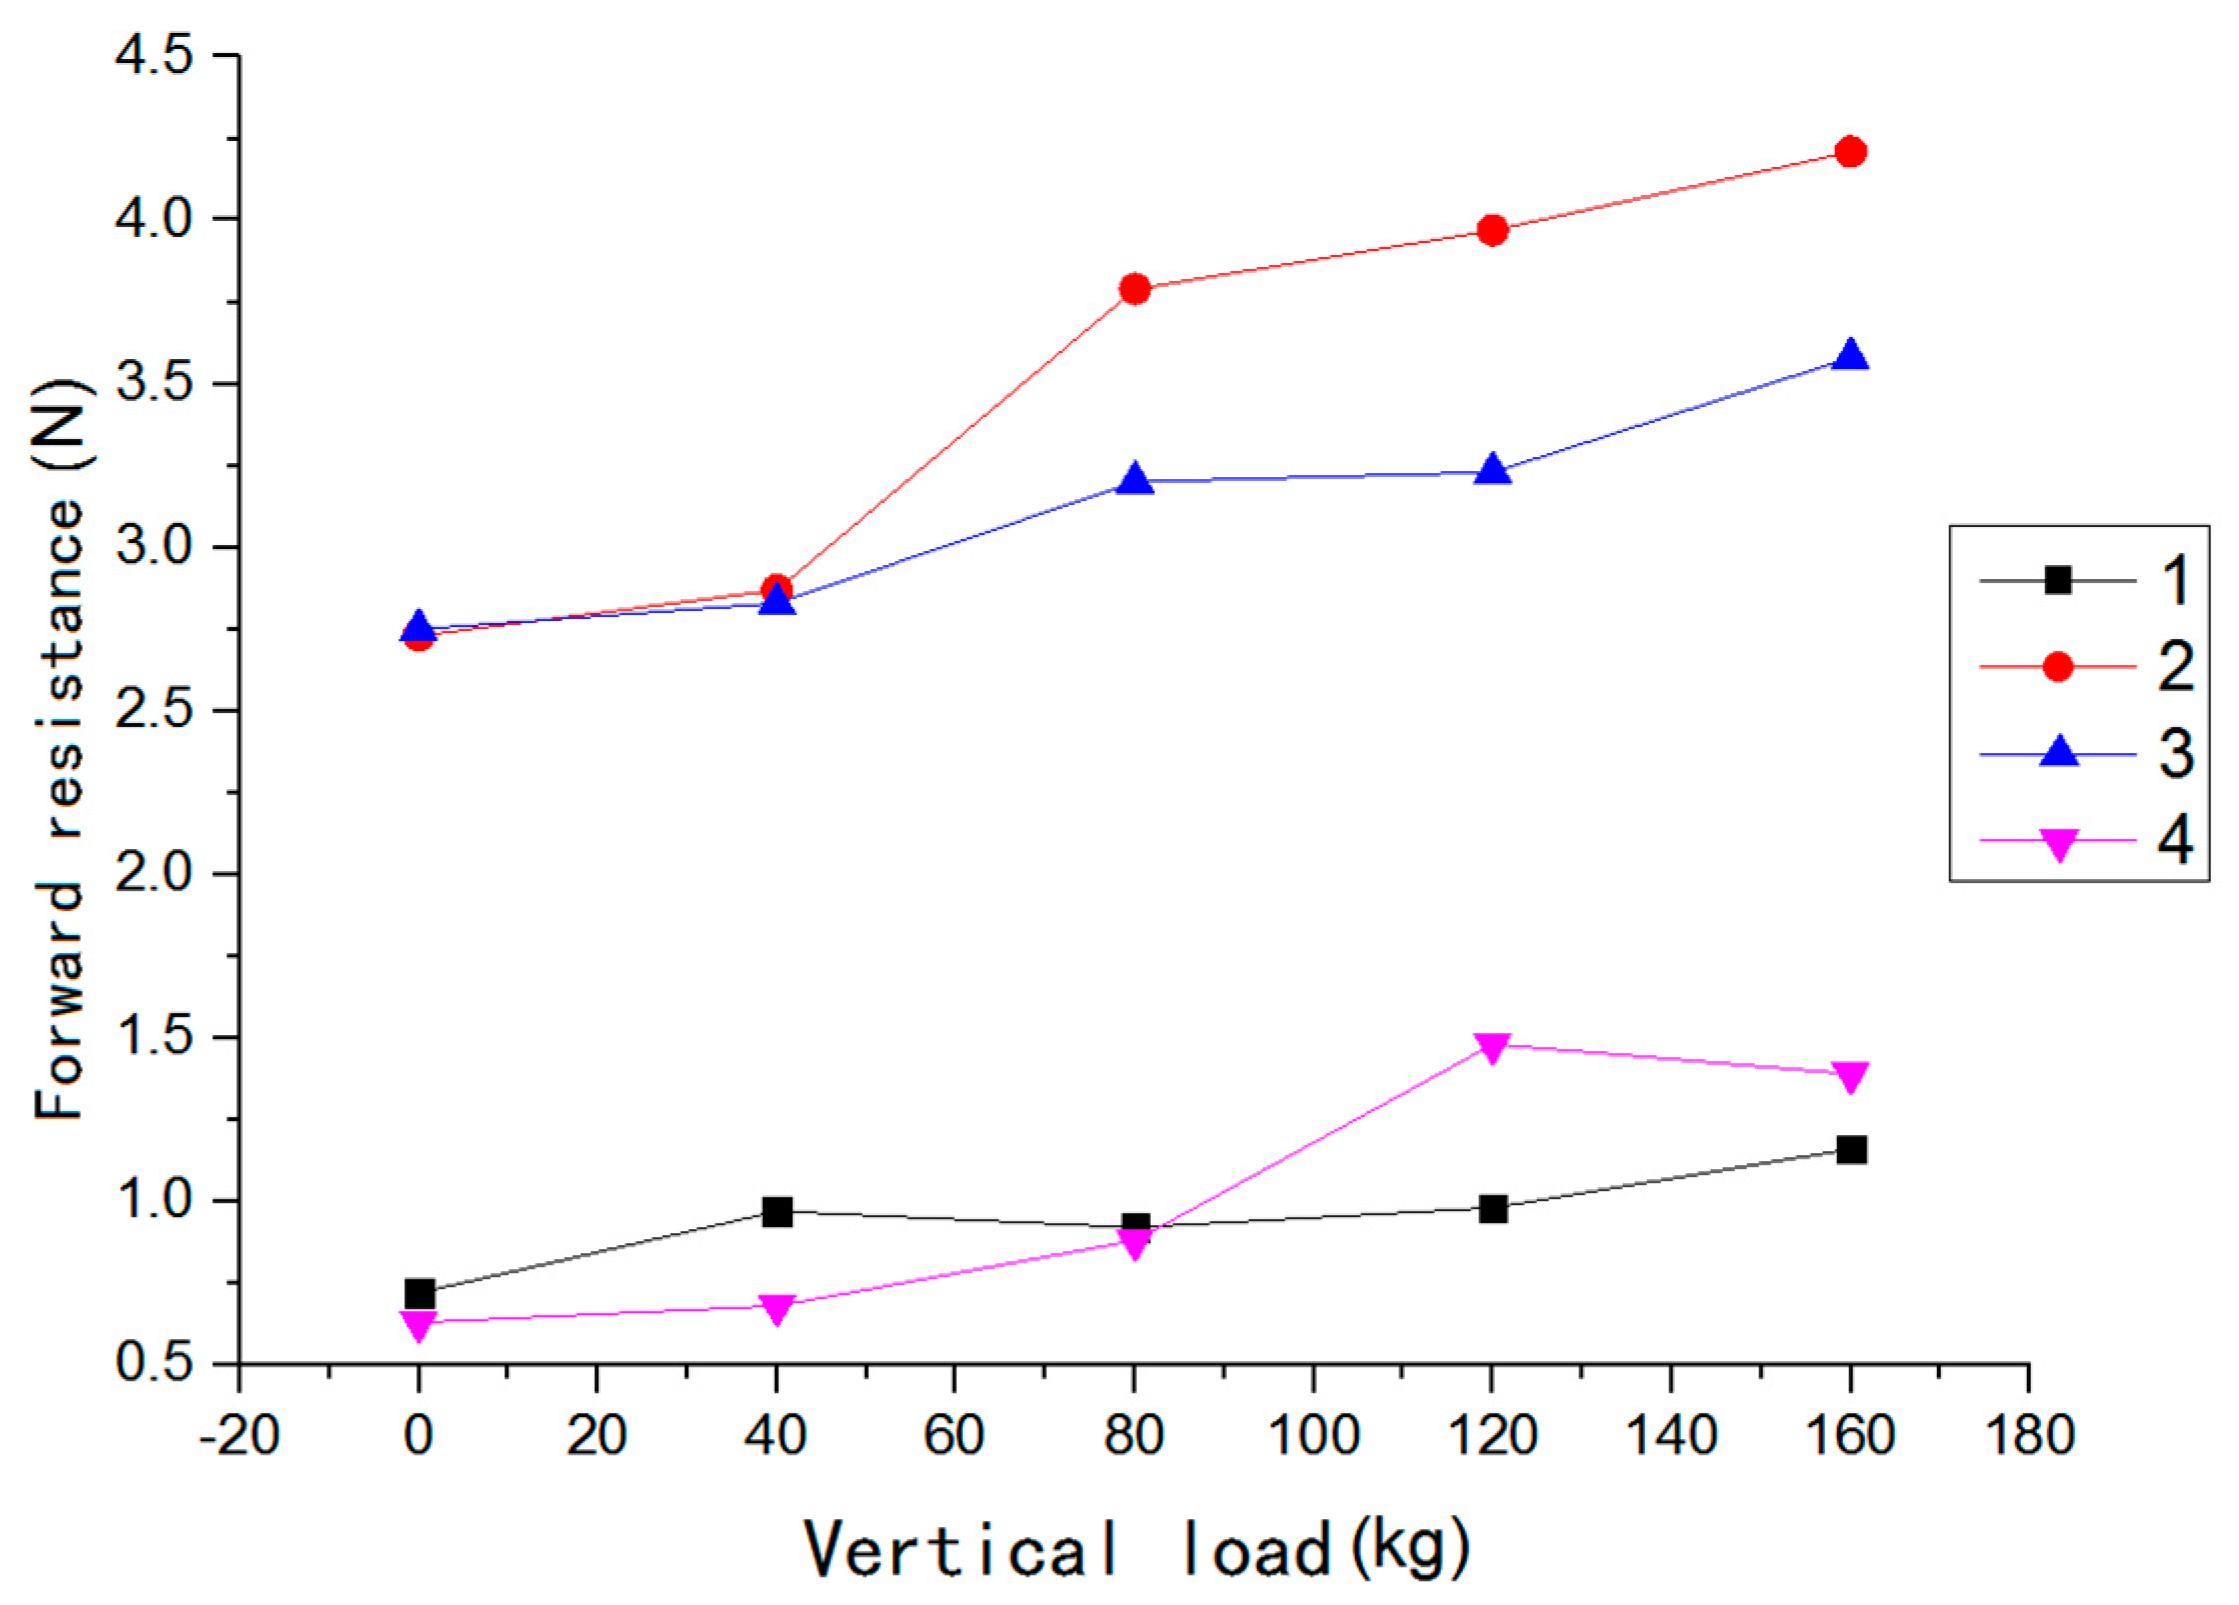
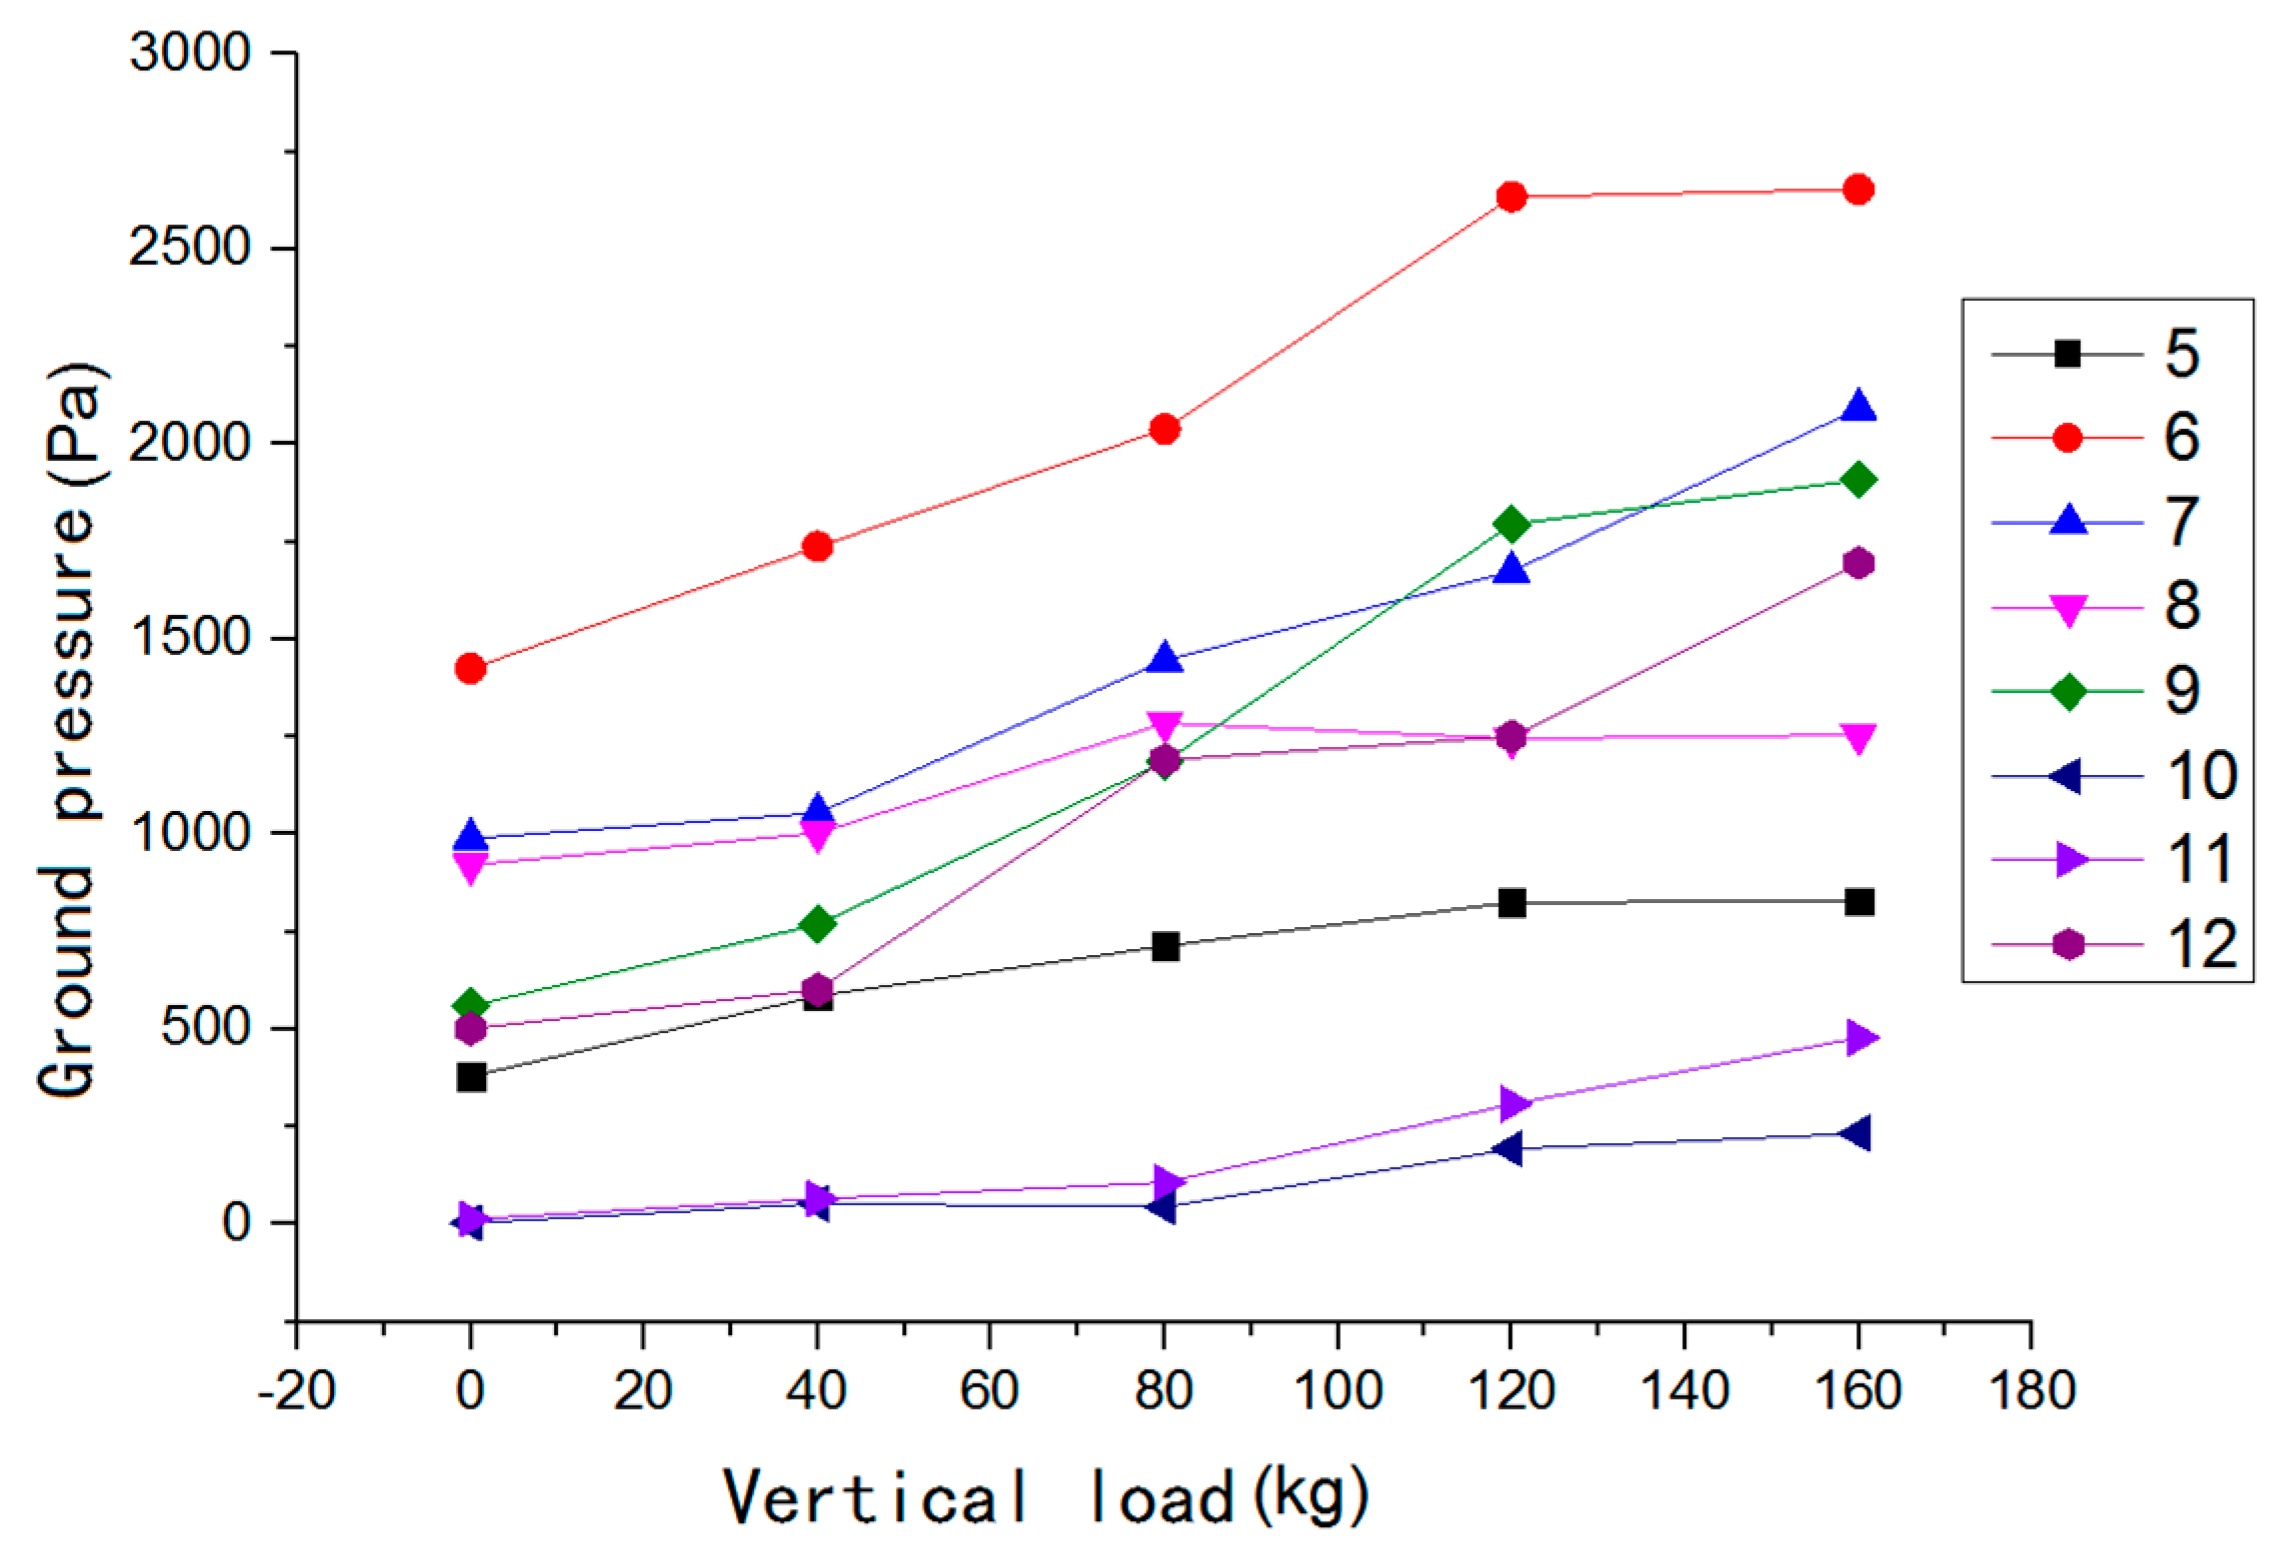
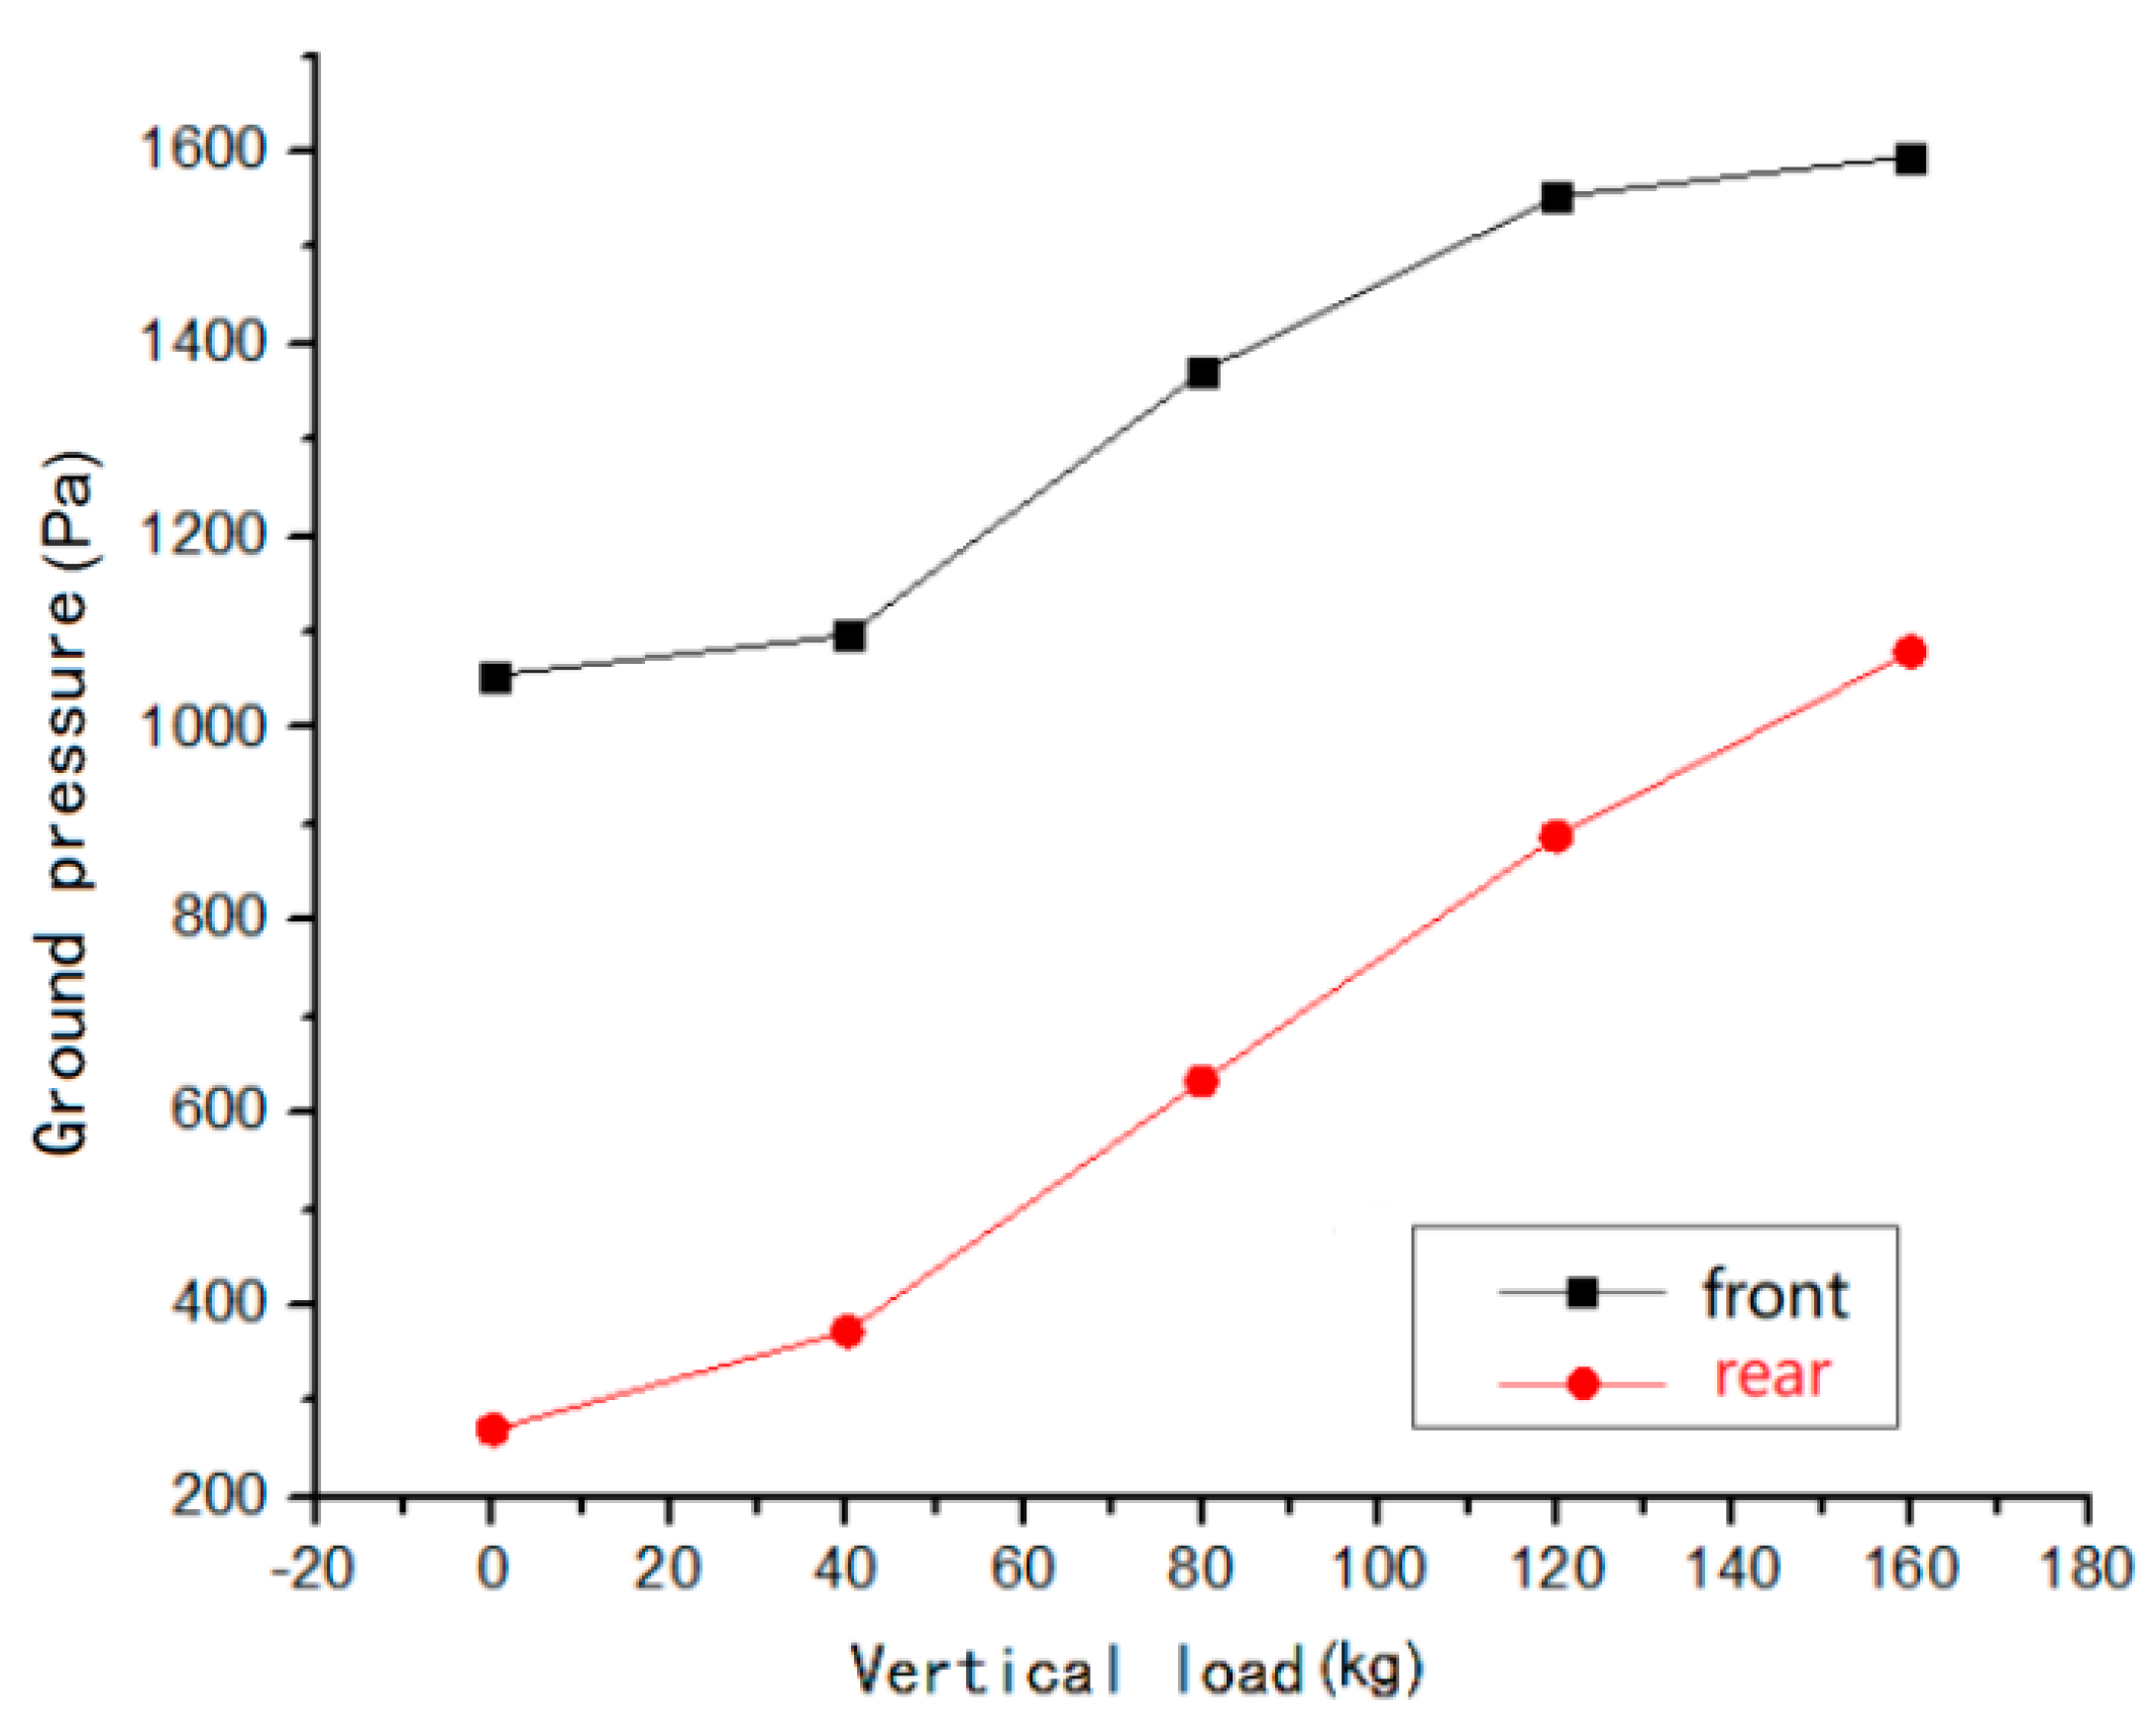
3.2. Relationship between Forward Resistance, Ground Pressure, and Vertical Load

Multi-horizontal experiments were carried out under the following vertical load conditions: m = 0, 40, 80, 120, and 160 kg. Moreover, the values of forward resistance and ground pressure under different vertical loads were measured. Figure 17 and Figure 18 show the variation curves.
The ground pressure and forward resistance of the skateboard show an upward trend, and the increasing range is similar when other conditions remain unchanged and the vertical load of the skateboard increases. With the increase of the counterweight, the accumulation of mud in front of the skateboard becomes more serious. Figure 19 shows the schematic diagram of skateboard force under obstructive mud accumulation. With the increase of mud, the interaction area between skateboard and paddy soil increases, and the total soil force N of skateboard increases. It leads to the increase of ground pressure and forward resistance of the skateboard.

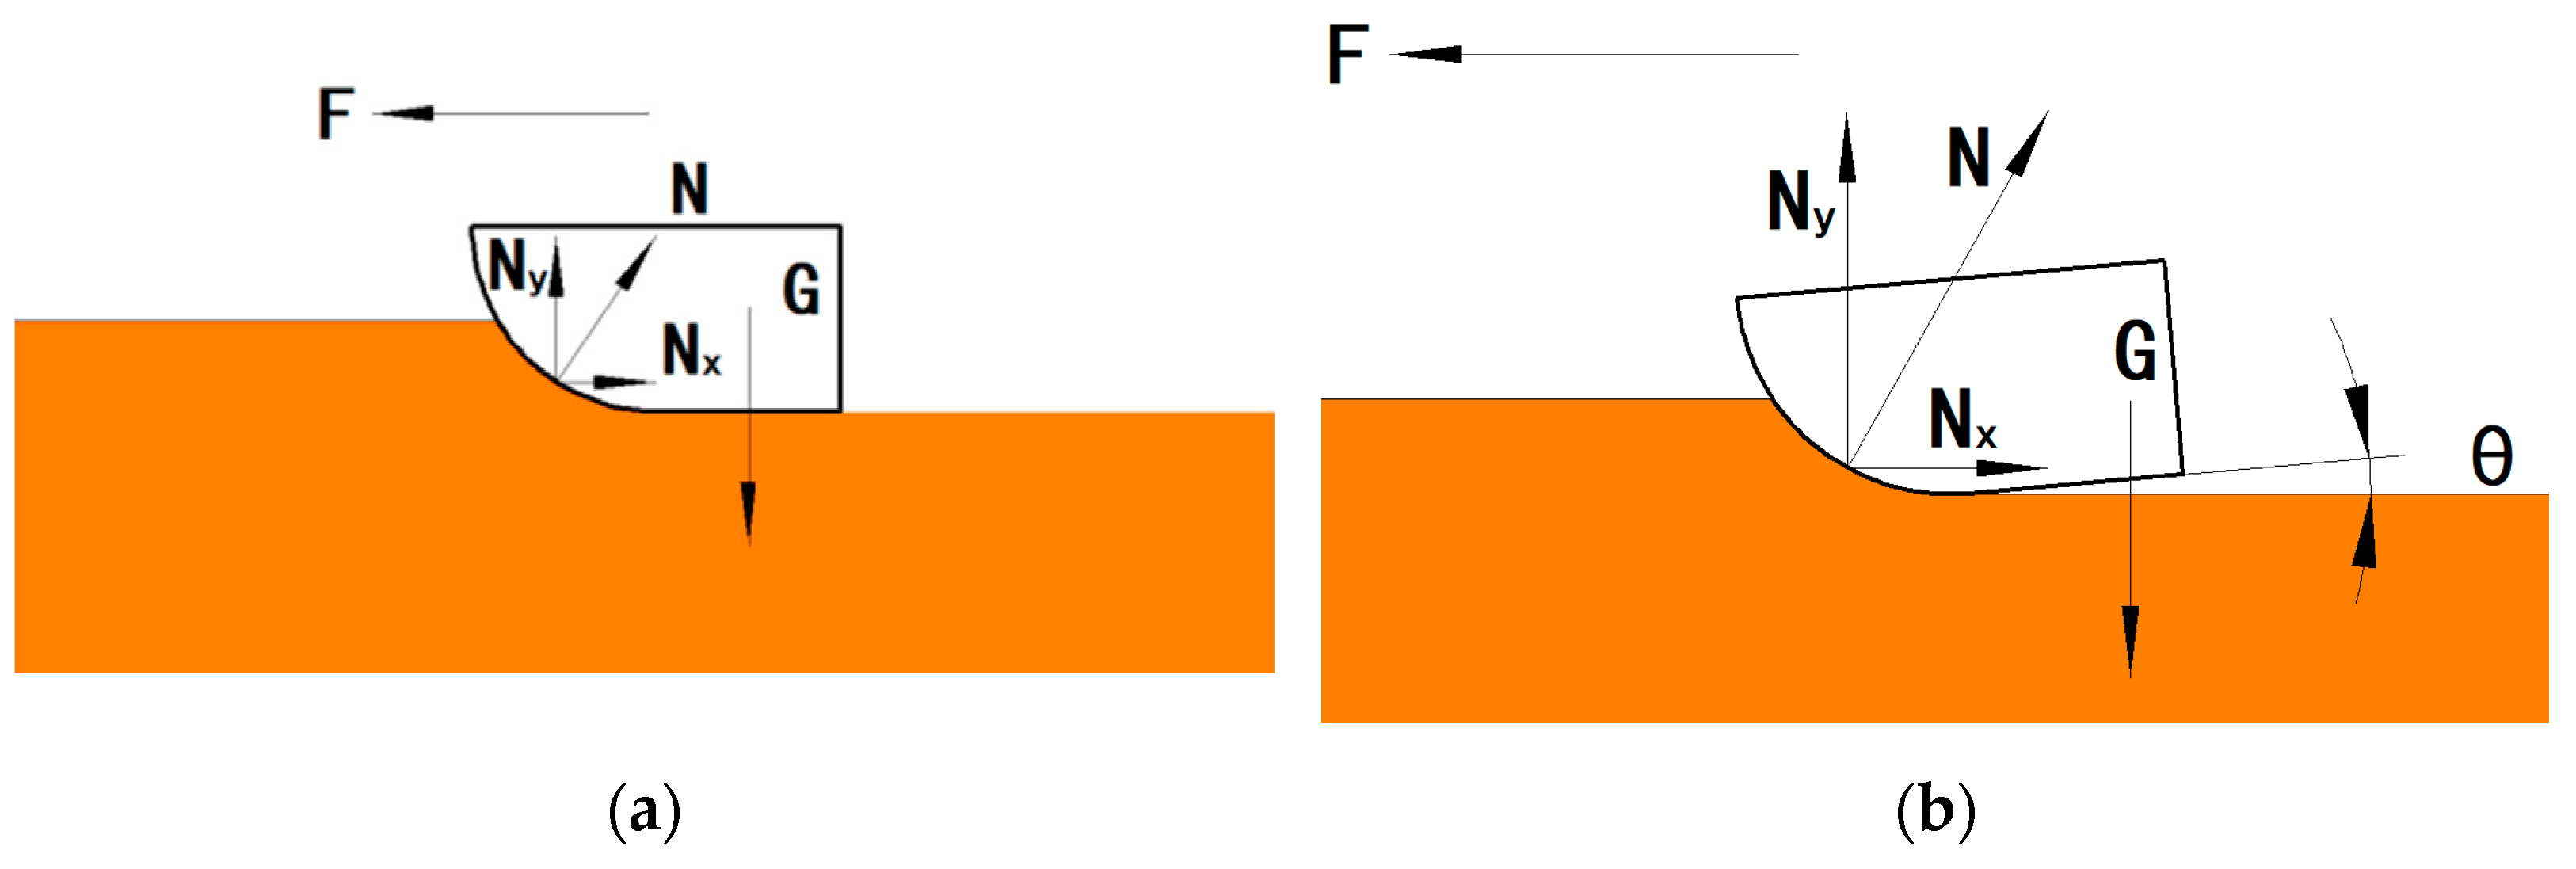
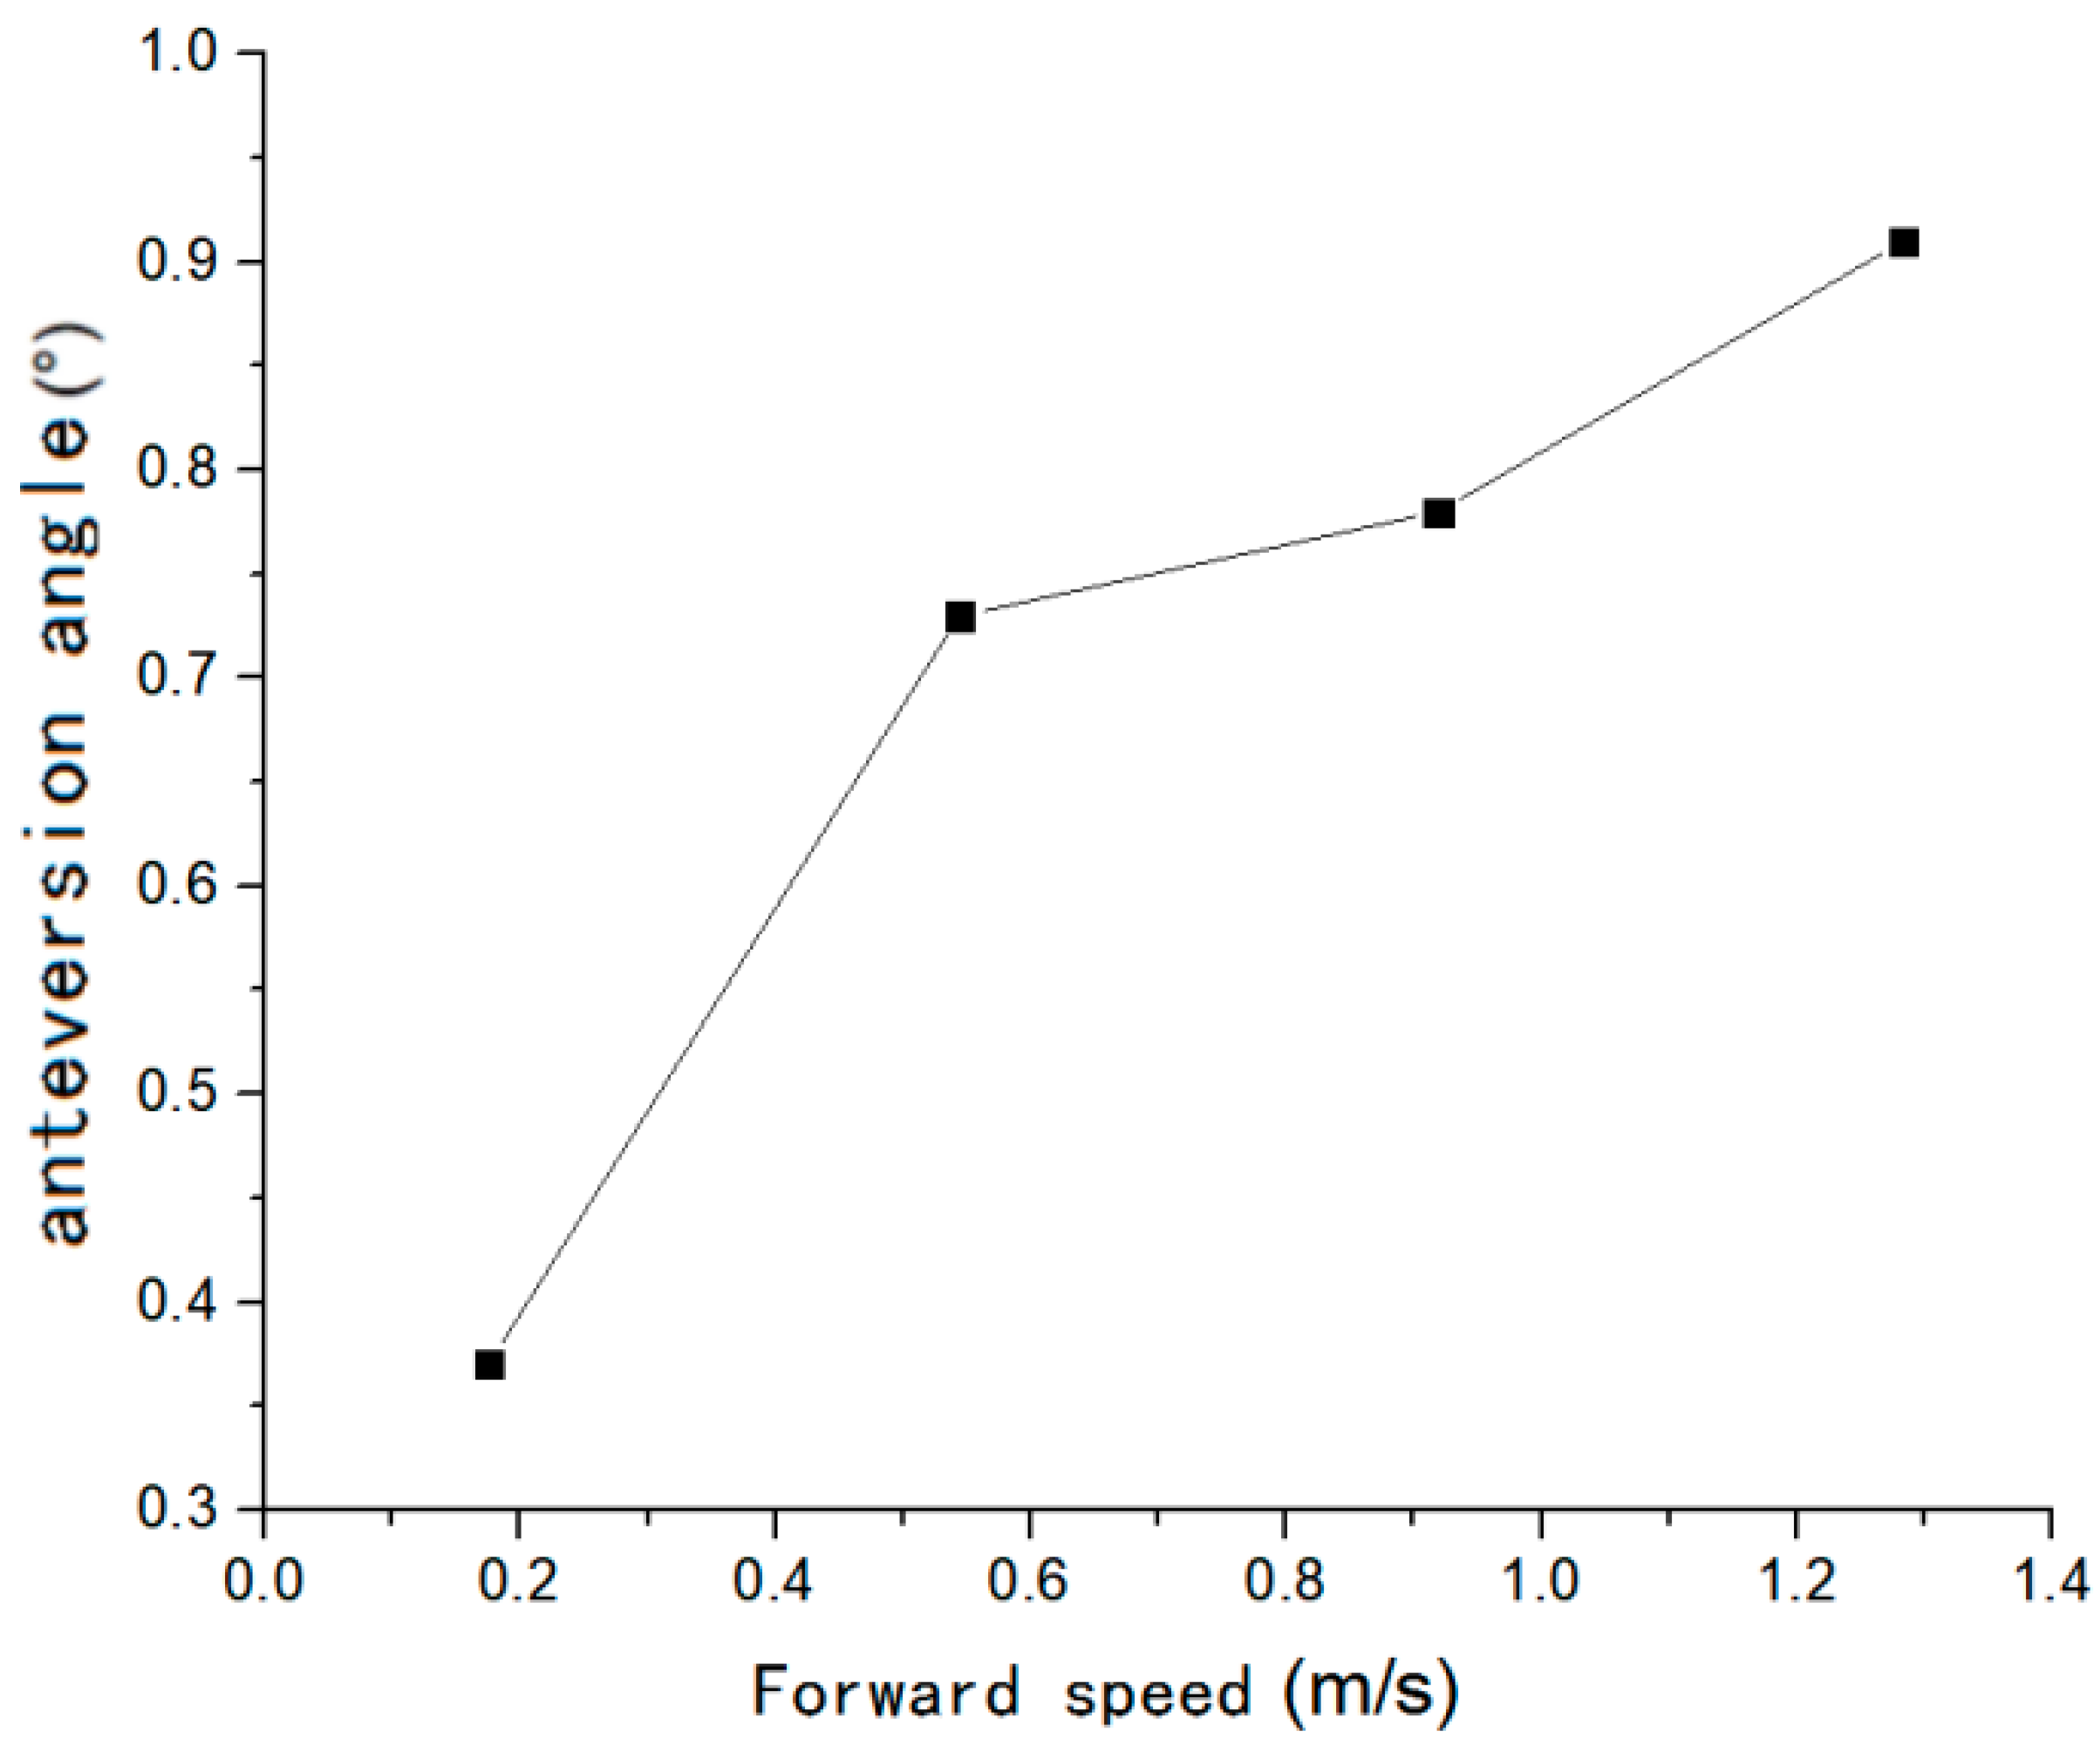
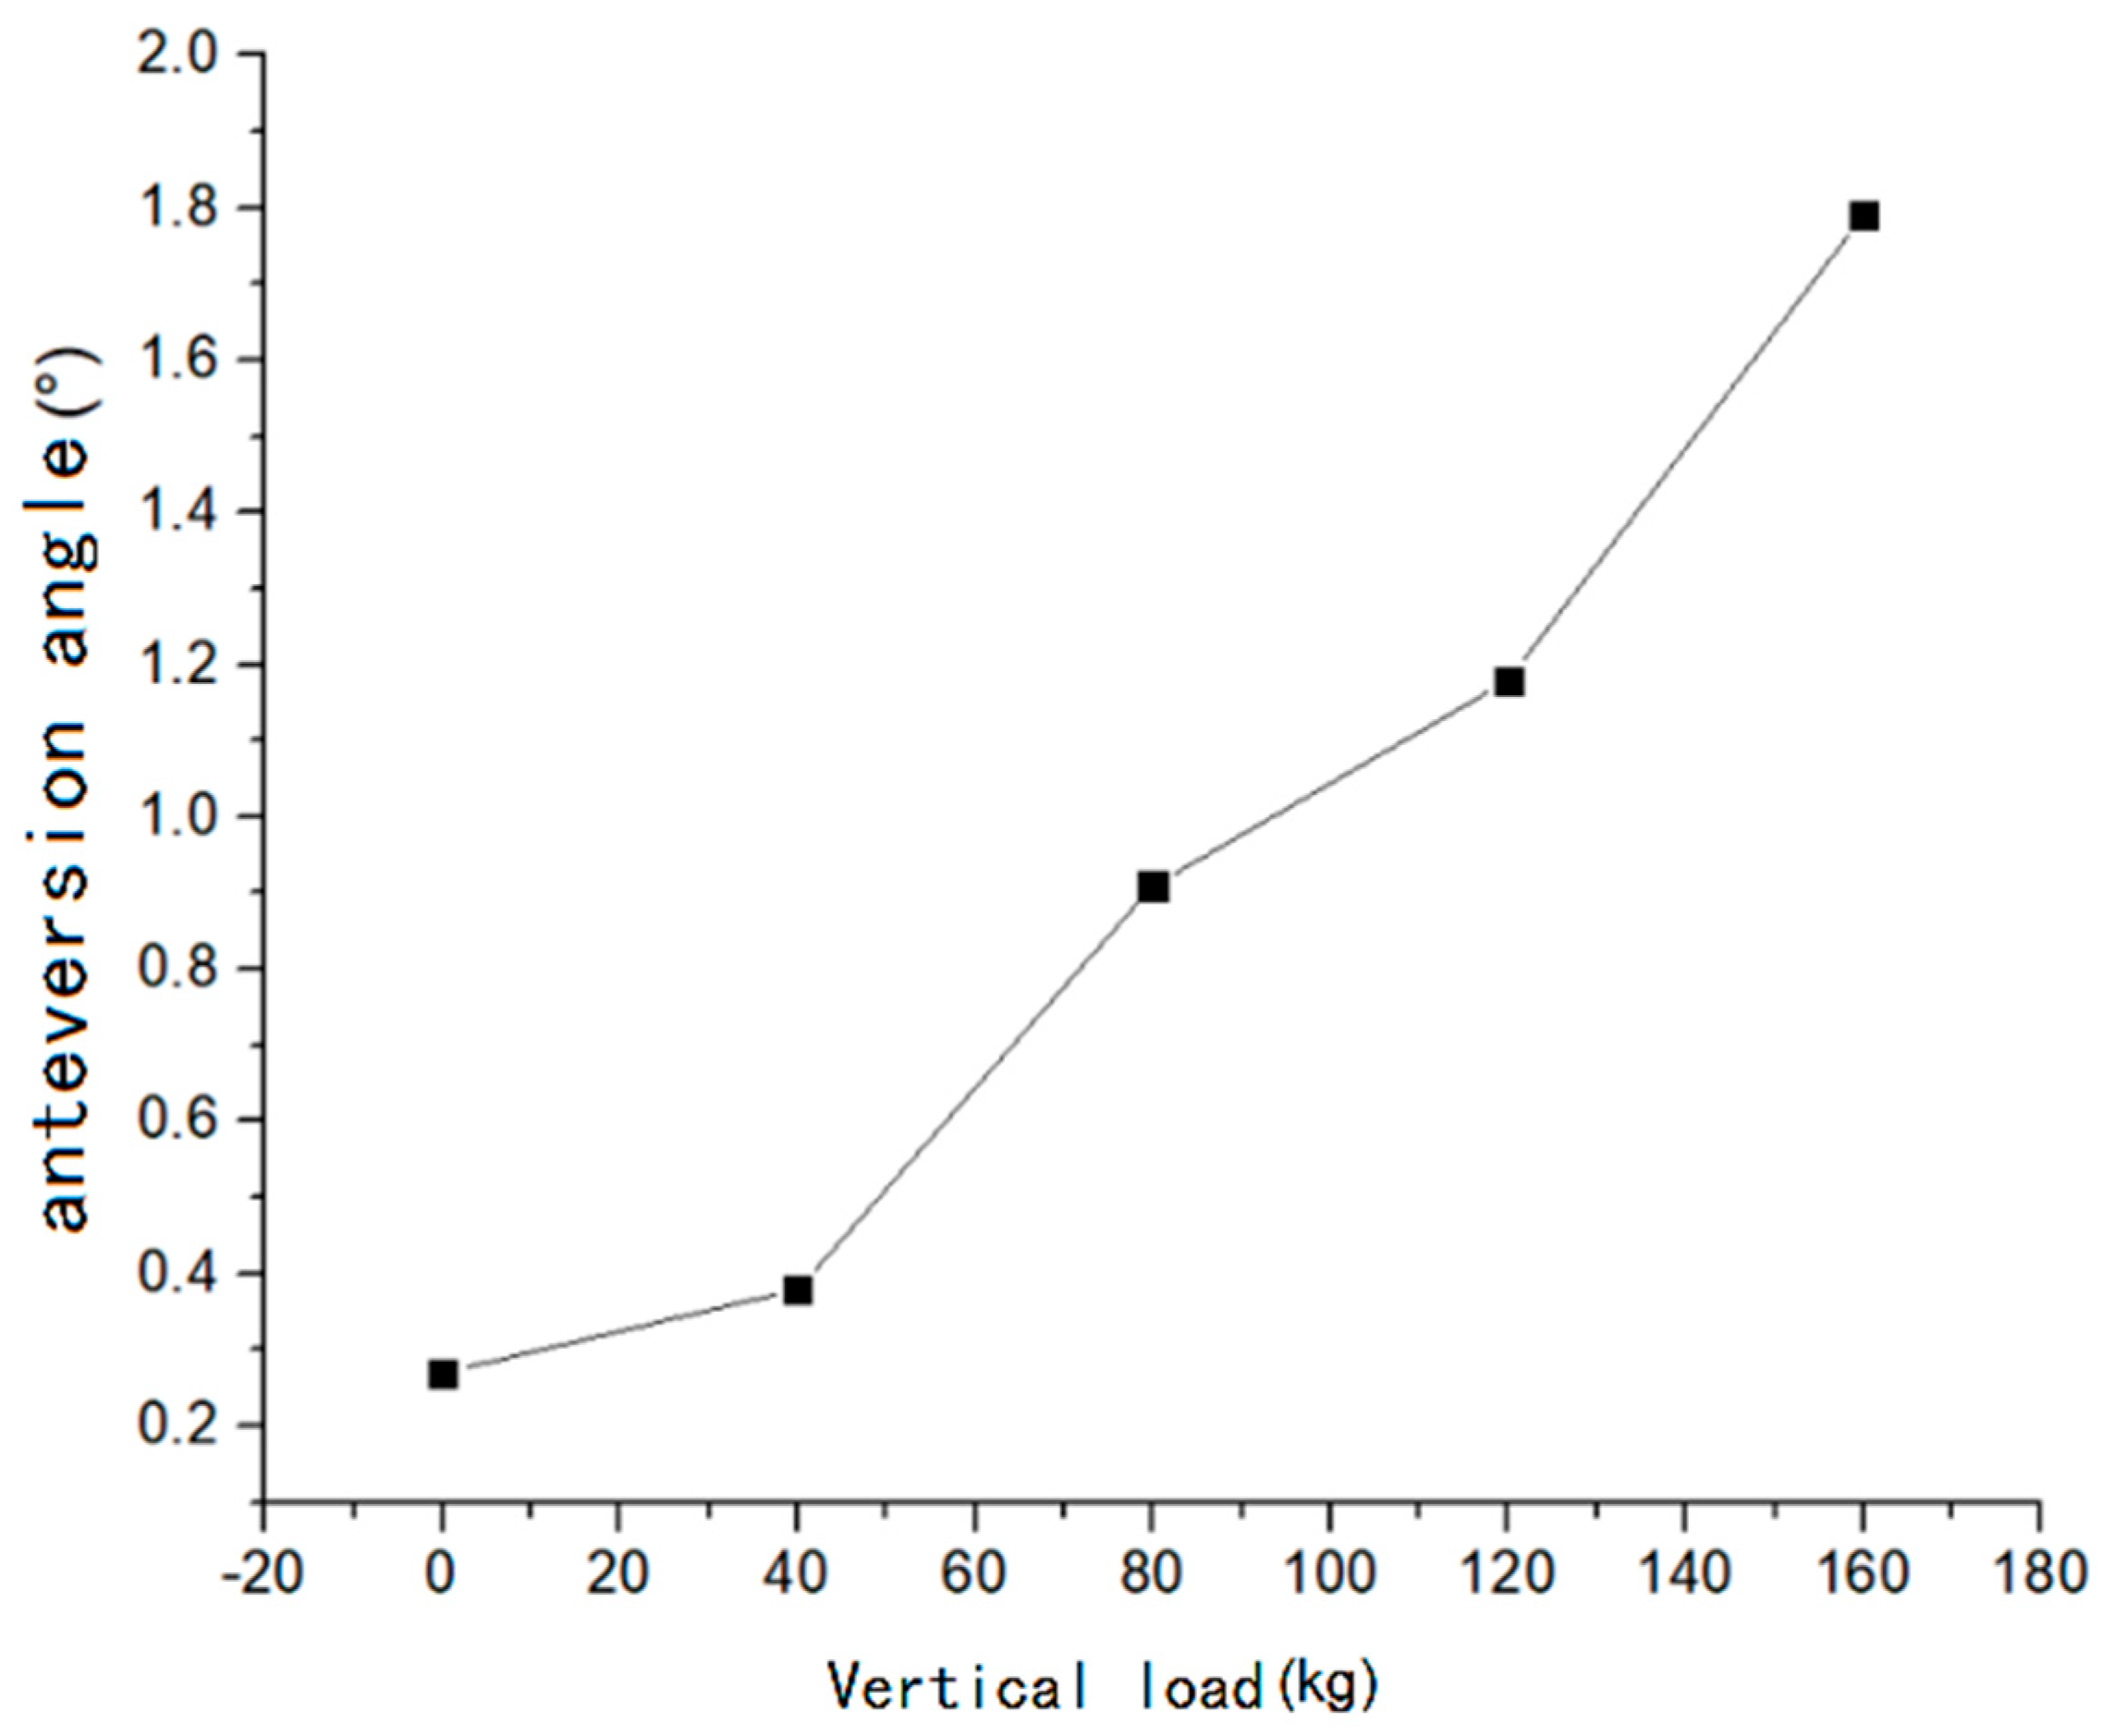
3.3. The Relationship between Forward Inclination Angle, Forward Speed and Vertical Load

The seeding skateboard falls flat on the paddy soil and reaches the equilibrium state when the rice transplanter is in the static state and the vertical load of the seeding skateboard is 0 kg. At this point, the forward tilting angle is recorded as zero. Two-factor and multi-level experiments were carried out under varying conditions of forward speed (v = 0.175, 0.544, 0.919, and 1.283 m/s) and vertical loads (m = 0, 40, 80, 120, and 160 kg). The values of forward tilt angles under different forward speeds and vertical loads were measured. The variation curves are shown in Figure 20 and Figure 21.
The forward tilting angle of the skateboard increases with the increase of forward speed when other conditions are constant. The forward tilting angle of the skateboard also shows an upward trend with the increase of vertical load. The main reason is that the traction force of the skateboard increases with the increase of speed and vertical load, and the contact state between the skateboard and soil changes and the increase of tractive force increases the acting moment, which makes the skateboard tilt forward. The experimental results are consistent with the actual field operation, suggesting that attention should be paid to the change of the forward tilting state of the seeding skateboard when the direct seeder works at a high speed.

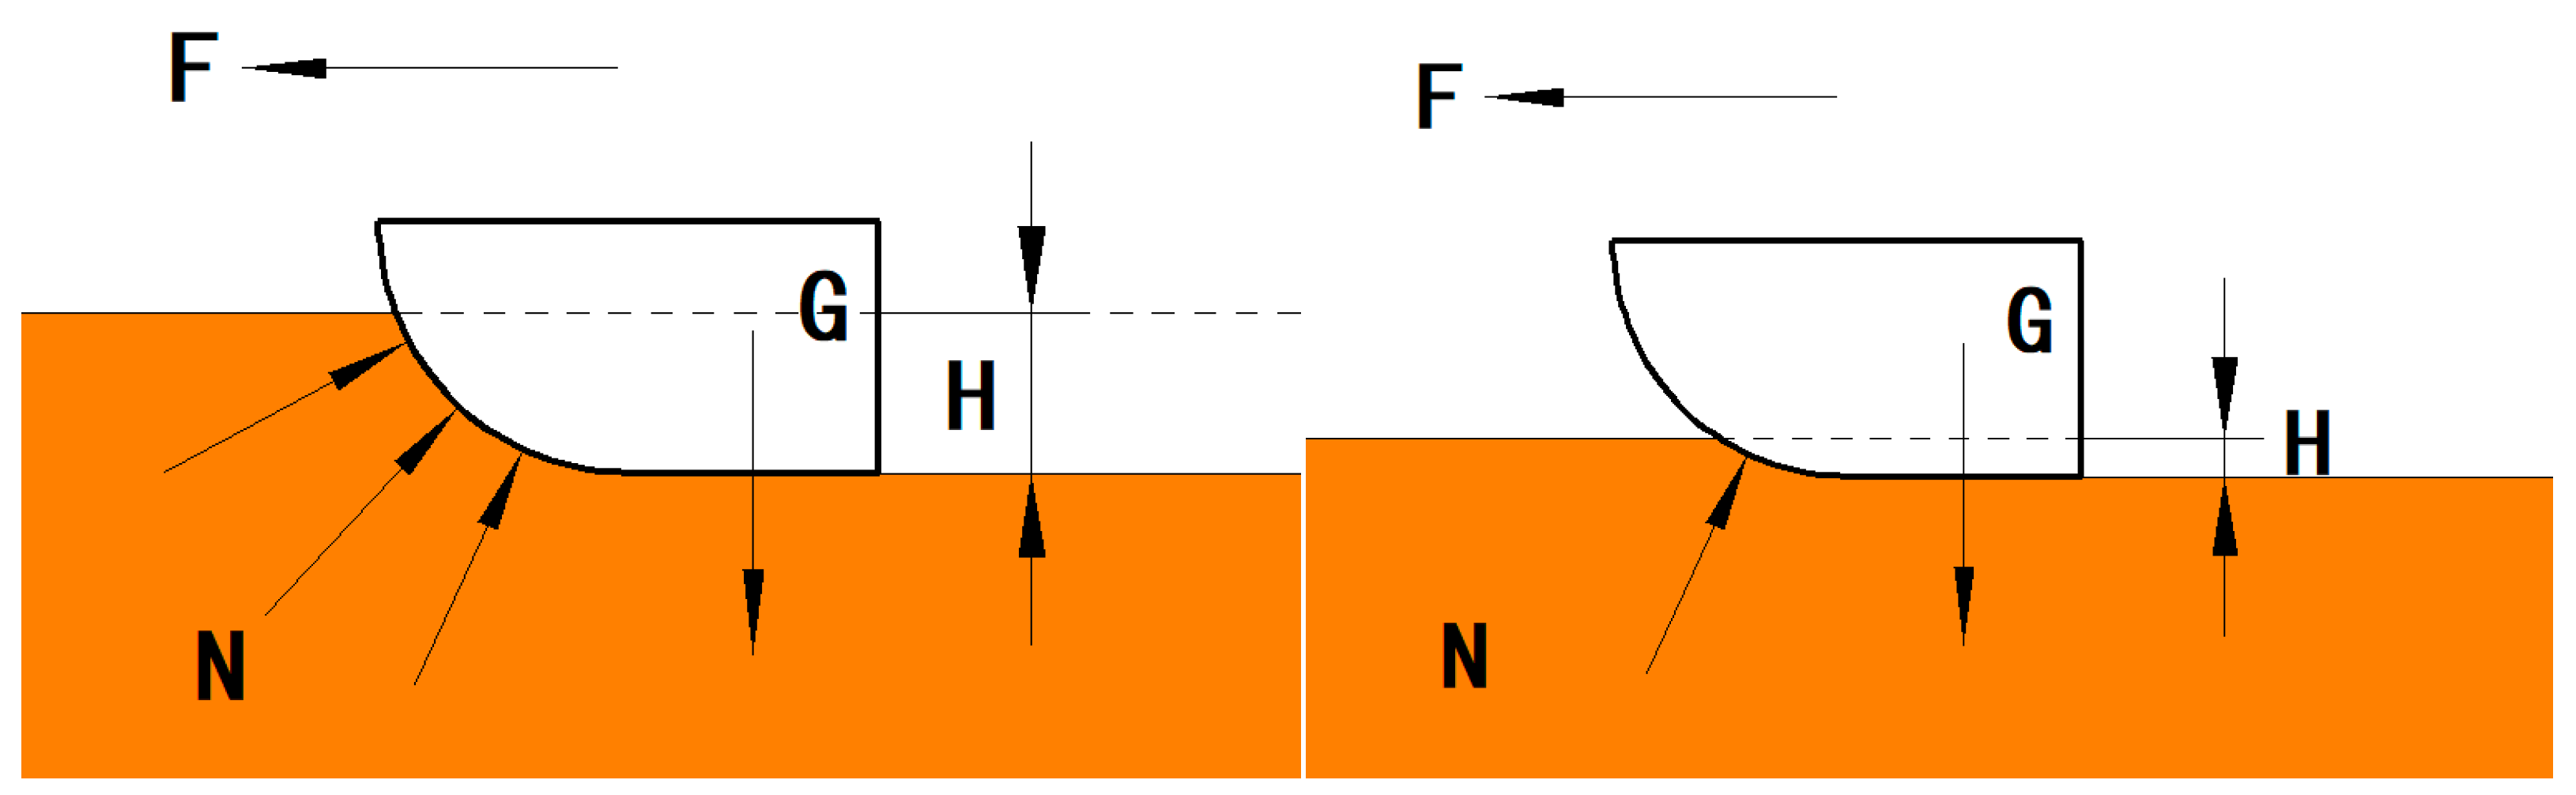
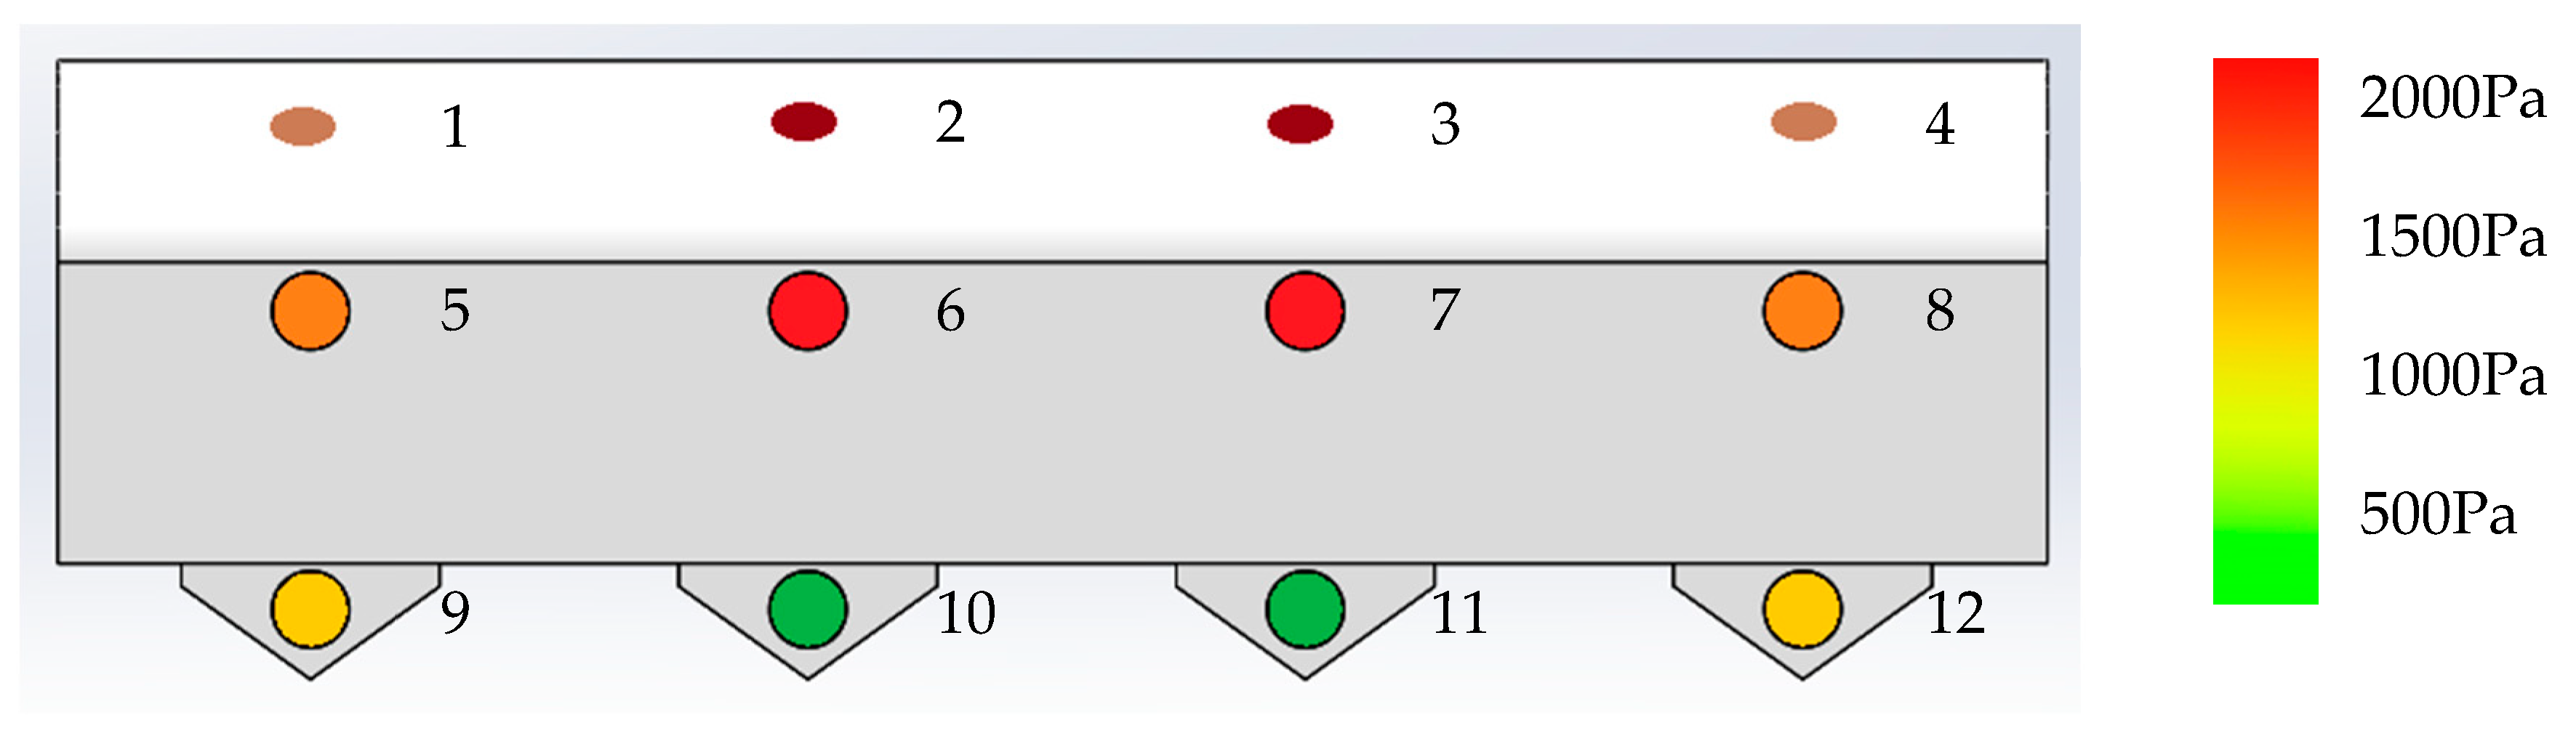
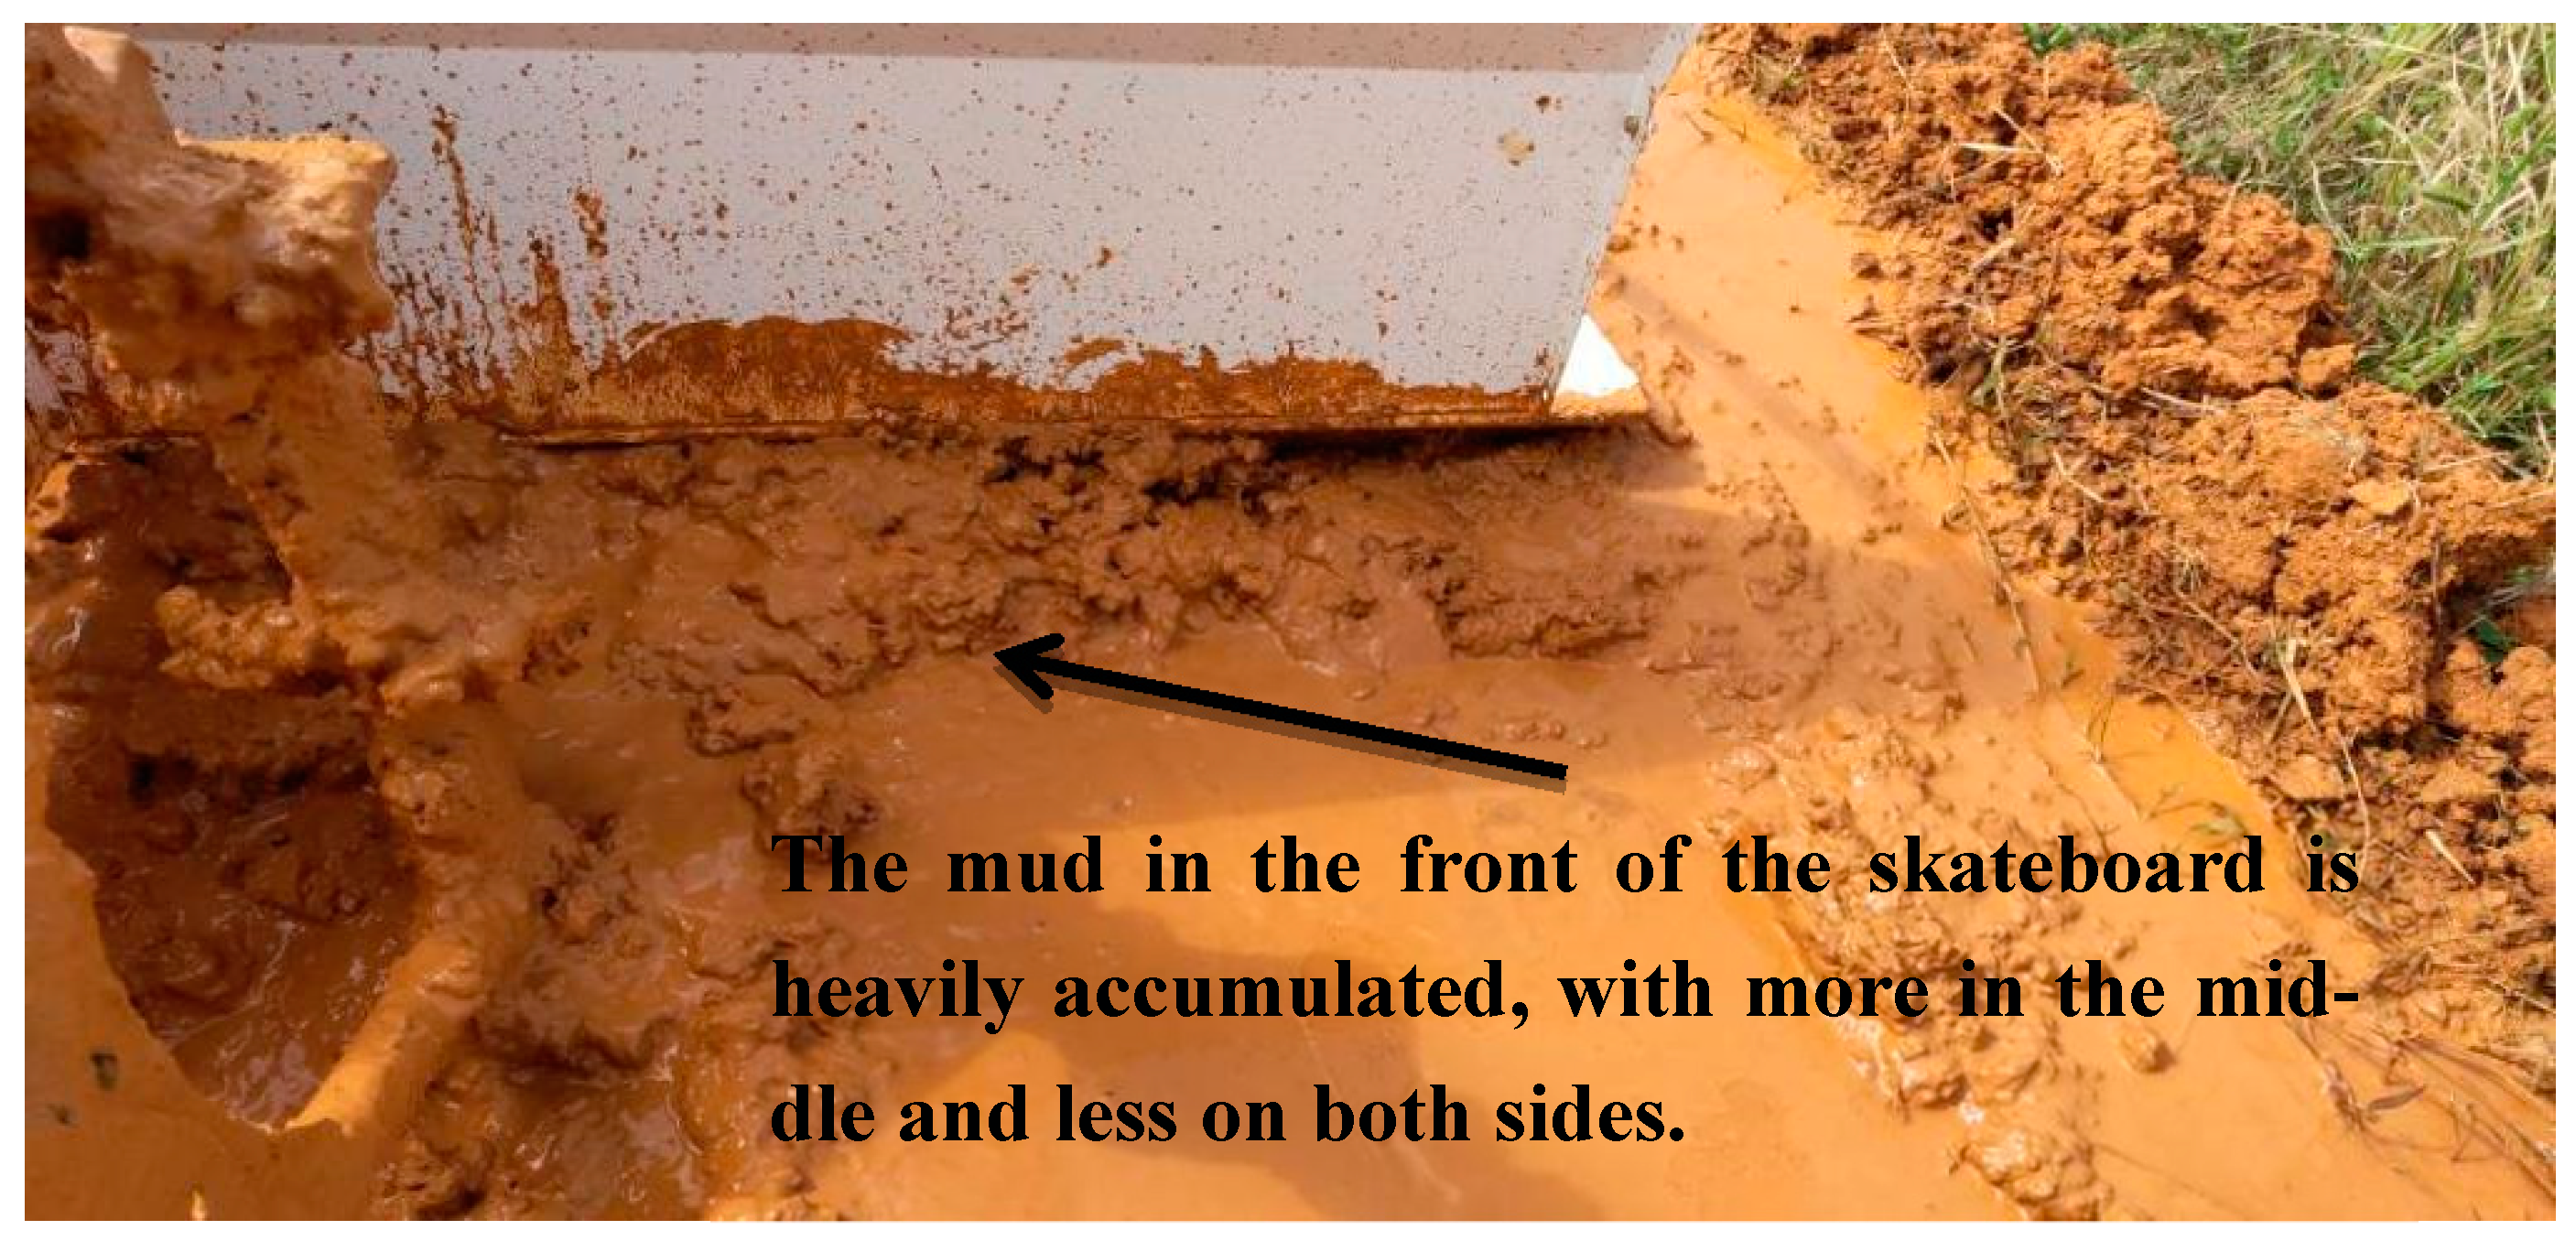
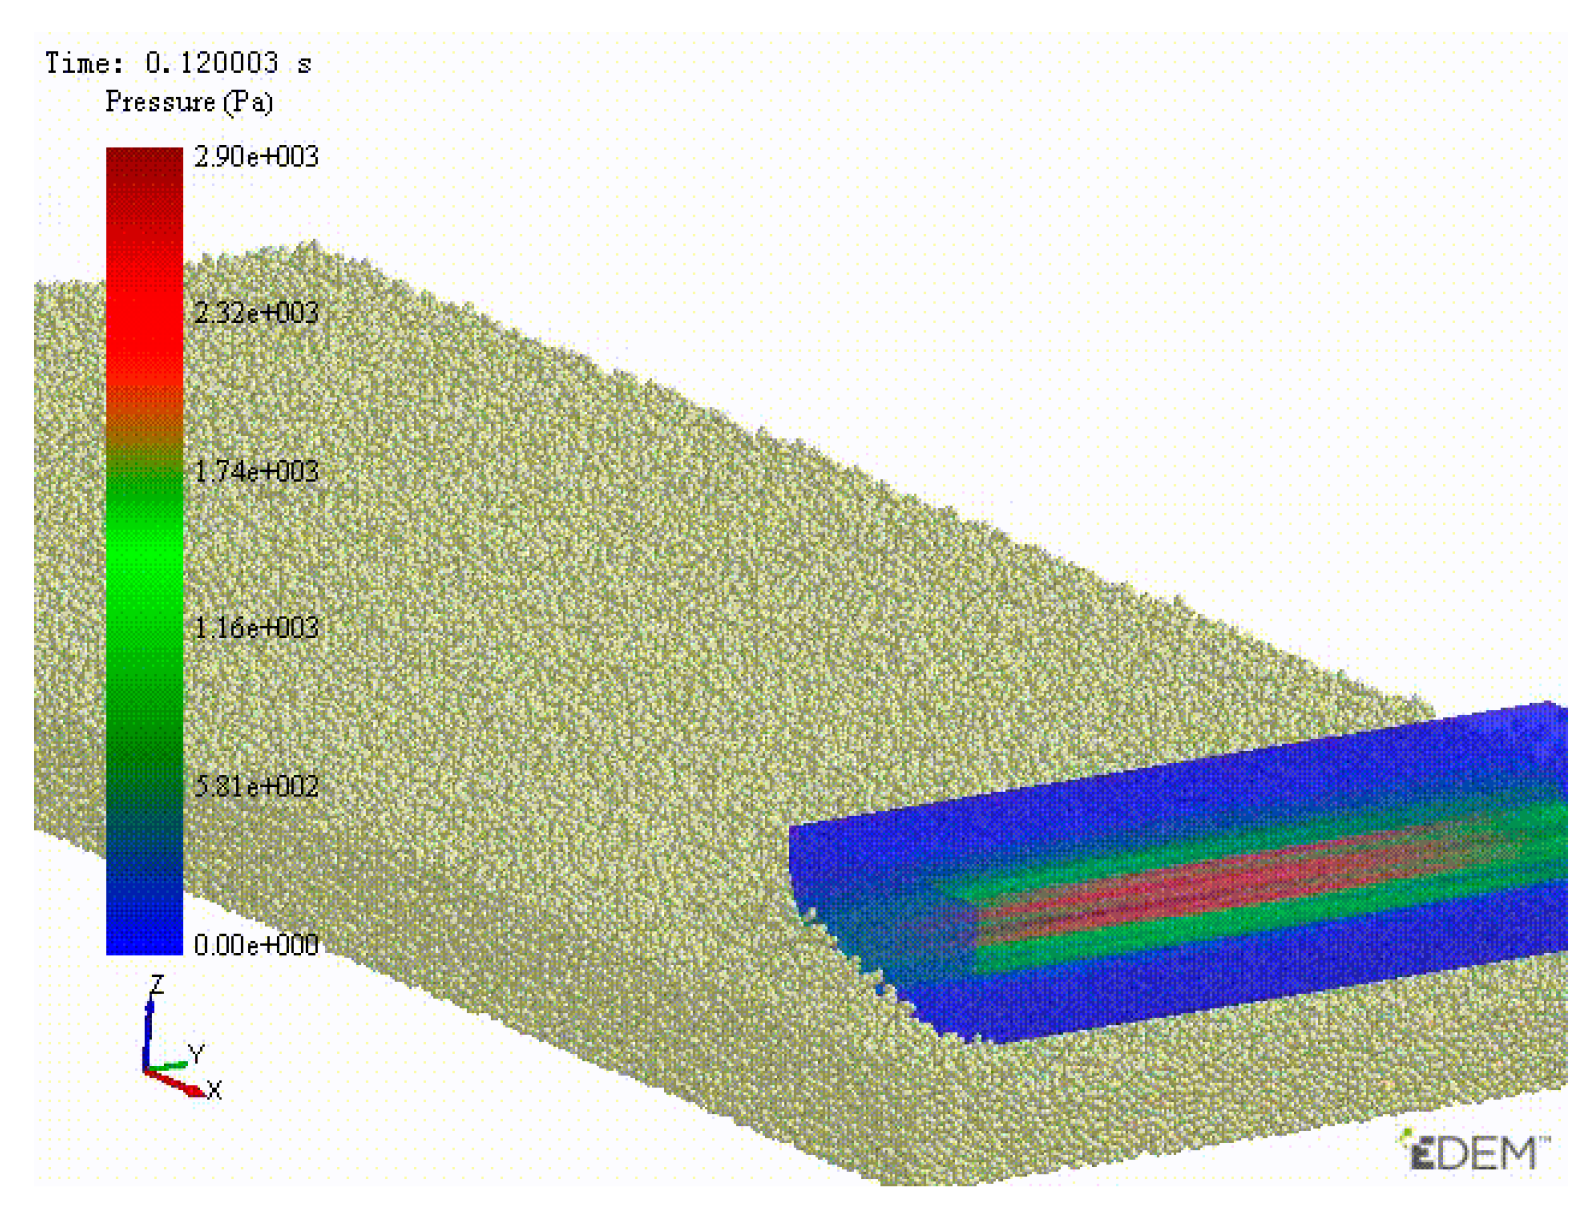
3.4. Distribution Law of Ground Pressure at the Bottom of Skateboard

Two-factor and multi-level experiments were carried out under varying conditions of forward speed (v = 0.175, 0.544, 0.919, and 1.283 km/h) and vertical loads (m = 0, 40, 80, 120, and 160 kg). Moreover, the front-end ground pressure and rear-end ground pressure under different forward speed and load conditions were measured and the variation curves are shown in Figure 22 and Figure 23.
The value of the ground pressure sensor at the bottom of the skateboard is larger than that at the back end due to the forward tilt of the skateboard. The forward tilting angle increases gradually, and the ground pressure at the front and back ends increases gradually with the increase of vertical load. When the forward speed increases to a certain value, the resistance and traction force on the skateboard increase, forming a torque that makes the skateboard tilt forward, which increases the forward tilting angle of the skateboard. The ground pressure at the front and back ends will decrease slightly when the skateboard tilts forward.
There are 12 pressure sensors at the bottom of the skateboard. The pressure distribution law of each sensor was obtained, as shown in Figure 24, by analyzing and calculating the values of each pressure sensor. Red represents larger pressure and green represents smaller pressure.
The contact force between the bottom of the skateboard and the paddy field soil is mainly concentrated in the area between the forward resistance sensor and the front pressure sensor. It is large in the middle and small at both ends of the skateboard. The main reason is that the choking mud accumulated at both ends of the skateboard is more easily removed from the outside of the skateboard than that in the middle, which leads to the accumulation of more mud in the middle and less on both sides, as shown in Figure 25. The actual situation is consistent with the skateboard force diagram in the simulation, as shown in Figure 26.
Taking the seeding skateboard of rice direct seeding machine as the object, an experimental study was carried out on the variation law of ground pressure and forward resistance under different speeds and loads by selecting the outdoor paddy field environment and using the self-developed ground pressure measurement system. According to the experimental purpose and experimental index, a multi-factor and multi-level experiment scheme was designed and the experiment results were analyzed. The results show that the ground pressure measurement system can work stably in the paddy field, and the measured data can be wirelessly transmitted to the computer and mobile phone. The forward tilt angle, ground pressure, and forward resistance of the seeding skateboard also increase with the increase of forward speed and vertical load.

4. Discussion

Combined with networking technology and wireless serial port transceiver technology, a ground pressure measurement system was designed. It includes a ground pressure measurement module, an Internet of things wireless data transmission module, a data display and storage module, and so on. Its hardware mainly includes a Mega2560 Arduino controller, JHBS-1–5KG foil pressure sensor, and JHBM- H3 column pressure sensor. It is calibrated by combination, and the experimental results show that the ground pressure measurement system can meet the requirements set by the measurement experiment for forward resistance and ground pressure of the sliding seeder of the rice direct seeding machine. It has the characteristics of Internet of things remote wireless measurement, high precision, sensitive response, stable performance, simple operation, wide practicability, and so on.
An experimental field study on the ground pressure measuring system was carried out. The single-factor multi-horizontal experiment of ground pressure was carried out by taking the seeding skateboard of the rice direct seeding machine as the research object and taking the traveling speed, v, and vertical load, G, as the influencing factors. The experimental results show that with the increase of vertical load, G, and traveling speed, v, the forward tilting angle of the skateboard, the ground pressure of the skateboard, and the forward resistance all showed an upward trend. The ground pressure measurement system can work continuously and stably in the paddy field. In addition, the measured data can be wirelessly transmitted to the computer and mobile phone stably at a high speed.
By observing the distribution law of the stagnant mud generated by the skateboard, it was found that a large amount of stagnant mud is generated in the middle of the skateboard, which increases the forward resistance and ground pressure of the skateboard, and reduces the working efficiency of the rice direct seeding machine. In order to reduce the mud generated by the seeding slide of the rice direct seeding machine and improve the work efficiency of the rice transplanter, the surface of the slide can be treated to reduce the sliding resistance, for example, by adding a water retention support plate to the bottom of the slide to form a muddy channel under the skateboard. It is also possible to use a slide material with a small friction coefficient and to design a separate skateboard so that the mud in the middle of the skateboard can be quickly discharged.

Author Contributions

Conceptualization, Y.G. and G.Z.; methodology, G.Z.; software, Y.G.; validation, Y.G., A.S. and J.F.; formal analysis, Y.G.; investigation, Y.Z.; resources, Y.Z.; data curation, Y.G.; writing—original draft preparation, Y.G.; writing—review and editing, H.W.; visualization, G.Z.; supervision, G.Z.; project administration, Y.Z.; funding acquisition, G.Z. All authors have read and agreed to the published version of the manuscript.

Funding

The APC was funded by Innovative Research Group Project of the National Natural Science Foundation of China (No. 51775220).

Institutional Review Board Statement

Not applicable.

Informed Consent Statement

Not applicable.

Data Availability Statement

No new data were created or analyzed in this study. Data sharing is not applicable to this article.

Conflicts of Interest

The authors declare no conflict of interest.

References

  1. Xin, F.; Xiao, X.; Dong, J.; Zhang, G.; Li, B. Large increases of paddy rice area, gross primary production, and grain production in Northeast China during 2000–2017. Sci. Total. Environ. 2019, 711, 135–183. [Google Scholar] [CrossRef] [PubMed]
  2. Zhou, Y.; Li, X.; Liu, Y. Cultivated land protection and rational use in China. Land Use Policy. 2021, 106, 1–3. [Google Scholar] [CrossRef]
  3. Yang, X.; Zhang, W.; Zhang, X.; Ma, Z. The Development of Budded Rice Direct Seeding Machine. China. Agric. Mech. 2005, 6, 7–12. [Google Scholar]
  4. Lv, X.R.; Lv, X.L.; Ren, W. Experimental study on working performance of rice rope direct seeding machine. Agric. Sci. China. 2010, 9, 275–279. [Google Scholar]
  5. Ye, H.; Chen, H.; Zhu, D.; Chen, Y.; Xu, Y. Yield and Application of direct seeding mechanization technology of hybrid rice. China. Rice. 2009, 5, 38–40. [Google Scholar]
  6. Luo, X.; Li, X.; Liu, T.; Tan, M. Present situation and development prospect of rice mechanical direct seeding. In Proceedings of the Annual Meeting of Chinese Society of Agricultural Engineering, Wuhan, China, 24–27 October 2016. [Google Scholar]
  7. Liu, Y. Soil Traffichability Study Based on Mechanical Properties of Paddy Soil. Master’s Thesis, Nanjing Agricultural University, Nanjing, China, June 2014. [Google Scholar]
  8. Liu, K. Paddy field operation skills of rotary tiller. Hunan Agric. Mach. 2011, 12, 28. [Google Scholar]
  9. Lei, W.; Yi, L.; Cong, W.; Ling, W. Driving performance of bearing pressure-sinkage plates based on SPH. J. Agric. Mech. Res. 2021, 43, 5–7. [Google Scholar]
  10. Zheng, P.; Fang, C.; Juan, H. The modified rheological model for paddy soils in South China after remoulding. J. Terramechanics 1990, 27, 4–7. [Google Scholar]
  11. Deng, Z.; Zhu, Z.; Zeng, X.; Kong, G. Study of rheological properties of the lacustrine soft soil under different stress level. Ind. Constr. 2014, 44, 67–72. [Google Scholar]
  12. Ram, R.B.; Gupta, C.P. Relationship Between rheological coefficients and soil parameters in compression test. Trans. ASAE 1972, 15, 1054–1058. [Google Scholar] [CrossRef]
  13. He, Z. Experiment of Structures and Working Parameters Optimization for Paddy Field Boat-Type Tractor. Master’s Thesis, Zhejiang University, Hangzhou, China, June 2018. [Google Scholar]
  14. Wu, G.A. Preliminary study on the measurement of hull grounding pressure of tractor. J. Zhejiang Univ. Agric. Life Sci. 1984, 351. [Google Scholar]
  15. Yan, B.; Liu, Z.; Ma, L.; Yang, Z.; Li, W.; Fan, X.A. Dynamic Measuring Device for Specific Pressure of Crawler Grounding. China Patent No.202010951243.9.
  16. Eisenkolb, U.; Eckhoff, D.; Kaspari, A. Ground Pressure Measuring Device and Method for Evaluation. European Patent No.1722185, 31 December 2008. [Google Scholar]
  17. Zou, Y. Design and Experiment of the Test System for Ground Pressure of Seeding Pallet of Rice Direct Seeder. Master’s Thesis, Huazhong Agricultural University, Wuhan, China, June 2017. [Google Scholar]
  18. Soy, H.; Toy, İ. Design and implementation of smart pressure sensor for automotive applications. Measurement 2021, 176, 109–184. [Google Scholar] [CrossRef]
Figure 1. Datong 2BD-8A (DXD830) rice direct seeding machine.
Applsci 11 10024 g001
Figure 2. Structure of the ground pressure measurement system. 1~4: Forward resistance sensor, 5~12: ground pressure sensor, 13~24: signal amplifier, 25: 24 V power supply, 26: 12 V power supply, 27: Arduino controller, 28: 9-axis attitude sensor, 29: GPS module, 30: wireless serial port transceiver module, 31: Internet of things wireless module, 32: Internet of things measurement system—computer terminal, 33: Internet of things measurement system—mobile terminal, 34: wireless serial communication measurement system.
Applsci 11 10024 g002
Figure 3. Flow chart of ground pressure measurement system.
Applsci 11 10024 g003
Figure 4. Flow chart of measurement system software.
Applsci 11 10024 g004
Figure 5. Pressure sensor installation location.
Applsci 11 10024 g005
Figure 6. Pressure sensor installation location (Side view). 1. Forward resistance sensor. 2. Front pressure sensor. 3. Rear pressure sensor.
Applsci 11 10024 g006
Figure 7. Ground pressure calibration device. 1. 12 V power supply. 2. Arduino controller. 3. Wireless serial port transceiver module. 4. Signal amplifier. 5. Pressure sensor. 6. Mounting base. 7. Counterweight plate. 8. Bottom plate.
Applsci 11 10024 g007
Figure 8. Wireless serial communication measurement system.
Applsci 11 10024 g008
Figure 9. Internet of things measurement system—computer terminal.
Applsci 11 10024 g009
Figure 10. Internet of things measurement system—mobile terminal.
Applsci 11 10024 g010
Figure 11. Experimental field.
Applsci 11 10024 g011
Figure 12. Experimental environment.
Applsci 11 10024 g012
Figure 13. Wireless measurement system.
Applsci 11 10024 g013
Figure 14. Relationship between forward resistance and forward speed.
Applsci 11 10024 g014
Figure 15. Relationship between ground pressure and forward speed.
Applsci 11 10024 g015
Figure 16. Force analysis of skateboard at different speeds. (a) At slow speed; (b) at fast speed.
Applsci 11 10024 g016
Figure 17. Relationship between forward resistance and vertical load.
Applsci 11 10024 g017
Figure 18. Relationship between ground pressure and vertical load.
Applsci 11 10024 g018
Figure 19. Force analysis of the skateboard under different accumulation thicknesses (H) of mud.
Applsci 11 10024 g019
Figure 20. Relationship between forward tilt angle and forward speed.
Applsci 11 10024 g020
Figure 21. Relationship between forward tilt angle and vertical load.
Applsci 11 10024 g021
Figure 22. Relationship between the front and rear ground pressure and forward speed.
Applsci 11 10024 g022
Figure 23. Relationship between the front and rear ground pressure and vertical load.
Applsci 11 10024 g023
Figure 24. Pressure distribution of sensors at the bottom of skateboard.
Applsci 11 10024 g024
Figure 25. Mud accumulation in front of skateboard.
Applsci 11 10024 g025
Figure 26. Force diagram when the skateboard is sliding.
Applsci 11 10024 g026
Table 1. Brief information about components used and measurement instrumentations.
SensorModelOperating VoltageOutputMeasuring RangeMeasurement Accuracy
Forward resistance sensorJHBM-H35–10 V350 ± 3Ω0–5 kg±0.1%
Ground pressure sensorJHBS-1–5KG5–10 V350 ± 3Ω0–5 kg±0.1%
Signal amplifierBSQ-324 V0 ± 5 V0~700 Ω±0.05%
9-axis attitude sensorWTGAHRS13.0–5.5 VSerial communication±180°±0.1°
GPS moduleATGM332D3.0–5.5 VSerial communication0~515 m/s<0.1 m/s
Wireless serial communication moduleCC25303.0–5.5 VSerial communication250 m±0.1%
Table 2. Ground pressure calibration data.
Number of
Counterweights
Total Mass
(kg)
Theoretical Ground
Pressure (Pa)
Actual Ground
Pressure (Pa)
Error
(%)
03.854306.69310.321.18%
16.258498.00505.461.50%
28.662689.30694.150.70%
311.066880.60887.130.74%
413.4701071.911079.450.70%
515.8741263.211270.330.56%
618.2781454.521462.810.57%
720.6821645.821648.170.14%
823.0861837.131831.71−0.30%
925.4902028.432019.19−0.46%
1027.8942219.732203.88−0.71%
Publisher’s Note: MDPI stays neutral with regard to jurisdictional claims in published maps and institutional affiliations.

