1. Introduction
In radiotherapy for breast cancer, tangential fields that avoid irradiation to normal organs such as the heart and the lungs are traditionally adopted to reduce doses to these critical organs [
1]. Multiple studies have indicated that intensity-modulated radiotherapy (IMRT) can produce a uniform dose distribution within the target volume as well as provide decreasing doses to the surrounding critical organs, thereby reducing complications, greatly enhancing prognosis, and improving the local tumor control rate [
2,
3,
4,
5,
6]. Owing to the superior beam direction, the concept of tangential beams is still being used in some 3D conformal radiotherapy (3D-CRT) and IMRT treatments after modification [
7,
8,
9,
10].
Literature has indicated that female patients undergoing postoperative radiotherapy for breast cancer are likely to receive higher doses to the surrounding normal tissues such as the lungs and the heart. It is also challenging for postoperative radiotherapy plans to achieve the desired tumor control curve without compromising on the doses to adjacent normal tissues. At present, there are three postoperative radiotherapy techniques for breast cancer patients, namely (1) 3D-CRT; (2) IMRT; and (3) Volumetric-modulated arc therapy (VMAT). The difference between these three techniques lies in the number and the angles of the beams, which results in different dose distributions. The rapid development of radiotherapy techniques has made it possible to increase the target dose while minimizing organ-at-risk (OAR) doses as well as shortening the treatment duration [
11]. In addition to the radiotherapy technique, the cardiac dose can be reduced by the use of the prone position or the deep-inspiratory breath-hold (VBH) method for managing the movement of the patient’s internal organs due to breathing [
12].
Radiotherapy for breast cancer requires not only the achievement of good target coverage, but also the reduction of normal tissue complications in the lungs and the heart. Since 1976, Brenard Fisher et al. started performing tumor resection combined with radiotherapy on patients with stage I and II tumors of sizes less than 4 cm. Subsequently, they carried out a statistical analysis on these patients, which found that the mortality of breast cancer patients receiving combined treatment was slightly lower than that of those receiving tumor resection alone. However, the side effects of radiotherapy increased the number of deaths from other causes, thereby compromising the overall survival rate [
13].
A study by Pehr A.R.M. Lind et al. [
14] identified the correlation between the lung volume in patients receiving more than 20 Gy and pulmonary complications and suggested that when the lung dose was less than 20 Gy, there was no incidence of radiation-induced injury. However, in clinical practice, it is often inevitable that approximately 10–20% of the irradiated areas receive 30–40 Gy or even over 40 Gy. The probability of radiation pneumonia would increase with increasing dose.
In radiotherapy, the primary tool used to assess the dose received by tumors and normal tissues in different treatment plans is the dose volume histogram (DVH). The lung V
20Gy parameter is adopted to evaluate the probability of radiation-induced lung injury. In a study in 1999 that analyzed the correlation between DVH and radiation pneumonia, Graham et al. suggested that when the lung V
20Gy was less than 25%, the probability of radiation pneumonia approached 0. When the lung V
20Gy was between 25–37%, an alternative plan was necessary to reduce V
20Gy. Therefore, it is important to ensure that the lung V
20Gy of a breast plan is within a reasonable range to reduce the probability of subsequent radiation pneumonia in breast cancer patients [
15].
Similarly, the mortality due to radiation-induced heart disease is correlated with the irradiated volume and dose of the heart. The larger the irradiated heart volume, or higher the radiation dose, the higher the mortality of heart disease. Radiation-induced heart complications are likely to occur when the heart dose exceeds 40–50 Gy. Clinically, the pericardial disease may have typical symptoms or sudden onset symptoms. Early symptoms of acute pericarditis include chest pain, fever, dyspnea, pericardial friction sounds, abnormal ECG, etc., which are common during radiotherapy. Continued radiotherapy can lead to delayed pericarditis within 4 months to several years after the procedure, which can develop into constrictive pericarditis and severe heart failure due to fibrosis [
16].
Darby et al. conducted a study on the incidence of coronary artery disease in 2168 female cancer patients who received radiotherapy between 1958 and 2001. Their research found that the average heart dose was 4.9 Gy, and the incidence of heart disease increased linearly at a rate of 7.4% per 1 Gy of heart dose increase. In addition, they indicated that the exposure of the heart to ionizing radiation during breast radiotherapy would increase the incidence of ischemic heart disease at a rate that was proportional to the average heart dose. Consequently, the disease, which could not appear until after years of the exposure, could last over two decades. Women with heart risk factors were more likely to develop complications [
17].
After collecting the data of patients who received breast radiotherapy between 2001 and 2013, Rehammar et al. reported that the average heart dose of patients undergoing conventional tangential radiotherapy fields was lower than that of patients undergoing IMRT. The average heart dose of the former and the latter was 1.3 Gy and 5.6 Gy, respectively. They also found that patients whose tumor was at the left side had a higher risk of heart disease than those in whom the tumor was at the right side. In addition, the risk of heart disease was substantially lifted if patients with left breast cancer received radiotherapy and anthracycline chemotherapy simultaneously [
18].
In the study by Carolyn Taylor et al. that recruited 647 patients who underwent radiotherapy, it was found that the average heart dose was 4.4 Gy, whereas the incidence of heart disease 10 years after the procedure was 1.3% (95% CI: 1.15–1.46;
p < 0.001). Their results indicated that when the dose of the entire heart increased by 1 Gy, the incidence of heart disease increased by 0.04% [
19].
The accuracy of optically stimulated luminescence dosimeter (OSLD) has been proven to be within 5% of the actual dose. Relevant research has shown that it possesses both superior dose reproducibility and good accuracy within a certain energy range. Therefore, OSLD was adopted in this study as the dose measurement tool [
20,
21].
The purpose of this study was to perform a dosimetric comparison of 3D-CRT, IMRT, and VMAT on left breast cancer patients who underwent breast-conserving surgery. More importantly, the dose reduction to organs at risk (particularly to the heart dose) was evaluated using lead shields covered surrounding the left breast.
2. Materials and Methods
2.1. Standard Source
An Elekta Synergy linear accelerator (Elekta Oncology Systems Ltd., Crawley, UK) was used as the standard photon radiation source equipment. The dose of the standard radiation source at the central position of the linear accelerator was normalized to an absorbed dose, with one monitor unit (MU) equivalent to 1 cGy. A megavoltage photon beam of 6 MV was selected as the energy of the radiation source for the treatment of left breast cancer in this experiment. The treatment planning system employed was Pinnacle3 version 9.8 (Philips Medical Systems, Madison, WI, USA).
2.2. The CIRS ATOM Anthropomorphic Phantoms
The CIRS ATOM phantom (CIRS Inc., Norfolk, VA, USA) is an anthropomorphic phantom for radiation dose measurements, which can be used to assess the absorbed organ doses as well as the effective body dose. The phantom is made of tissue-equivalent epoxy resins and is composed of materials simulating the densities of average soft tissue, average bone tissue, cartilage, spinal cord, spinal disks, lungs, brain, and sinus. For the photon energy range of 40–150 keV, the linear attenuations of these simulated materials are within 3% of the actual attenuations of real tissue.
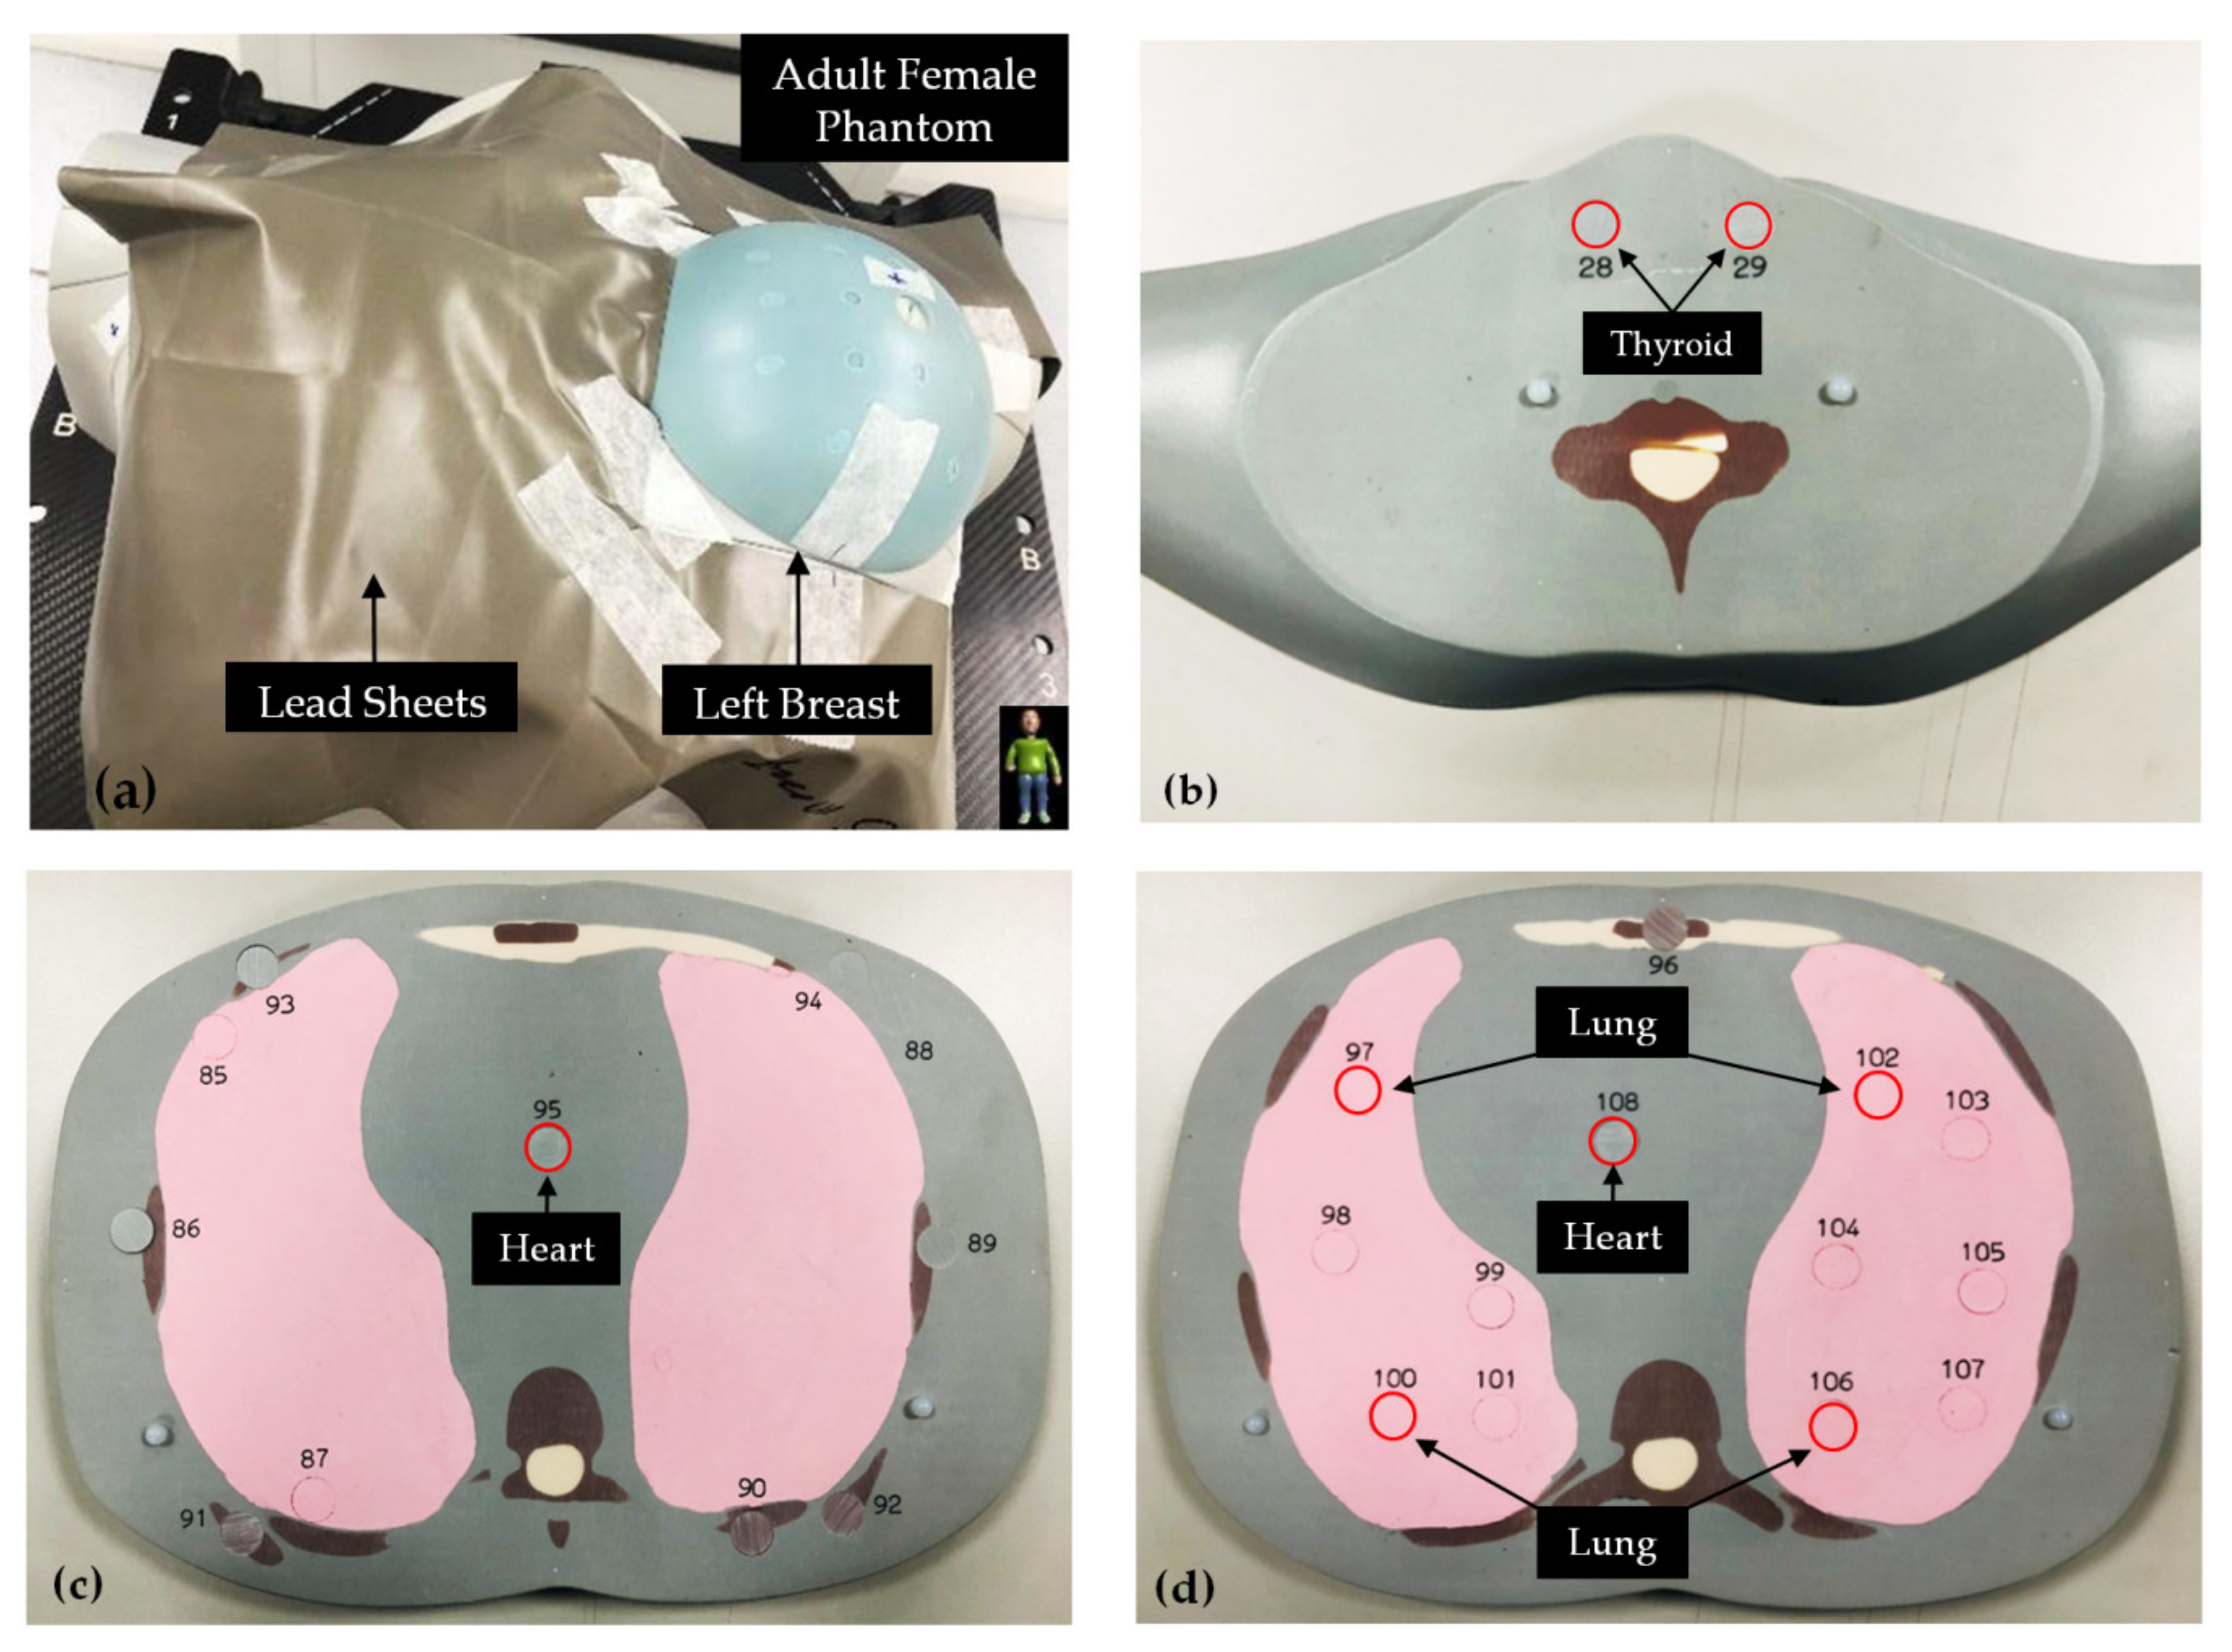
This study adopted the adult female phantom (Model ATOM 702-G) for the experiment, which consisted of 38 sections (Section 1–38) with an individual thickness of 25 mm. Each section had several 14 mm diameter holes that could be inserted with tissue-equivalent plugs covering the densities of 21 internal organs. A radiation dosimeter could then be placed in these plugs for dose measurements.
2.3. Tangential 3D-CRT Treatment Planning
Two tangential beams were planned at opposing angles facing the left breast of the adult female phantom. During the planning stage, only the gantry angle was considered. A pair of opposing beams were created, each at a gantry angle of 302° and 125°. If the beam was unmodulated, the high-dose region would concentrate on the surface of the breast. Therefore, a wedge filter was added to the beams to achieve a uniform dose distribution, as shown in
Figure 1.
2.4. IMRT Treatment Planning
In the IMRT plan, six coplanar tangential beams were placed on the left breast of the simulated clinical patient. The gantry angles of the 3D-CRT plan were adopted, and additional fields were added 5–10 degrees apart, resulting in a total of six fields at gantry angles of 302 degrees, 312 degrees, 322 degrees, 90 degrees, 100 degrees, and 110 degrees, respectively, as shown in
Figure 2.
2.5. VMAT Treatment Planning
Coplanar VMAT plans were implemented using the singular value decomposition for dose optimization and the adaptive collapsed cone convolution algorithm for dose calculation in the Pinnacle Treatment Planning System. The dose grid size was 3 mm, and the prescription dose was 50 Gy in 25 fractions to the left breast PTV. The field design of the VMAT plan consisted of two partial arcs: one was the clockwise partial arc, with the gantry rotated from 300° to 110°; the other was the counterclockwise arc, with the gantry rotated from 110° to 300°, as shown in
Figure 3. The multi-leaf collimator (MLC) had a 10 mm high-resolution lead width at the isocenter position.
The primary aim of the treatment plan was to achieve 100% of the PTV with 95% of the prescribed dose to ensure dose coverage of the target volume. The PTV was prescribed to 50 Gy (D50%) and the optimization constraint ensured that the 95% isodose line
Encompassed 95% of PTV (V95% ≥ 47.5 Gy). The planning objectives for OARs were V5Gy < 30%, V15Gy < 10% and V30Gy < 1% for the heart.
Figures of merits such as the conformity index (CI) and homogeneity index (HI) were calculated to evaluate the quality of the treatment plan. The CI is used to evaluate the conformal coverage of the PTV by the isodose volume prescribed in the treatment plan, and is defined as follows:
where V
TV is the volume of the prescription isodose, V
PTV is the volume of the PTV, and TV
PV is the volume of V
PTV within V
TV. The closer the CI value is to 1, the better the conformal coverage. The HI, as suggested in the ICRU 83 report (ICRU, 2010), can be expressed as follows:
where D
2%, D
50% and D
98% represent the near-maximum absorbed dose, the median absorbed dose and the near-minimum absorbed dose, respectively. D
2%, D
50% and D
98% are the doses covering 2%, 50% and 98% of the target volume, respectively. The HI value represents the dose homogeneity within the target volume. The smaller and closer the value of HI to 0, more superior the homogeneity, while the larger and closer the value to 1, more inferior the homogeneity.
2.6. Optically Stimulated Luminescence Dosimeter System
The dosimetry equipment used in this study was the nanoDot OSLD and the InLight™ MicroStar reader manufactured by Landuaer USA (Landauer Inc., Glenwood, IL, USA). The nanoDot OSL dosimeter was made of 5 mm diameter and 0.2 mm thick plastic disks infused with Al2O3:C. The disks are encased in 10 × 10 × 2 mm3 light-tight plastic holders having a density of 1.03 g/cm3. Prior to measurements, the OSLDs were screened to reduce measurement errors. This study decided not to use the cumulative dose feature of the OSLD for dose calculation. Therefore, the OSLDs were annealed after each measurement to remove the previous dose reading. Incandescent light was used for annealing, as literature indicated that its annealing efficiency was better than that of fluorescent light. Once the residual signal was removed after 24 h of illumination, the reading of the OSLD without any dose was recorded as the background reference.
Before the experiment, the OSLDs were exposed to doses in the range of 10–100cGy in a stepwise manner of 10 cGy doses each, so as to confirm whether the correlation between the dosimeter reading and the actual dose was linear.
2.7. Dosimeter Distribution of CIRS ATOM Phantom
In this study, 40 OSLDs were utilized to measure doses in the left breast of the adult female phantom and to compare them with the calculated doses of the 3D-CRT, IMRT, and VMAT plans. In addition, the skin around the target area was covered by lead shields to protect critical organs from radiation. Two types of lead sheets thickness of 0.125 mm and 0.25 mm were used. The density of the lead shields was 11.34 g.cm
−3, as shown in
Figure 4.
During the radiotherapy planning stage, the left breast of the phantom was contoured as the planning target volume (PTV), and the organs at risk (OARs) included bilateral lungs, heart, and thyroids that were further away. Subsequently, eight organ dose measurement points were selected across different sections of the adult female phantom, including the thyroids on Section 11 (No. 28 and 29), the heart on Section 17 (No. 95), and the heart (No. 108) and the lungs (No. 97, 100, 102 and 106) on Section 18. Two heart locations were chosen for dose measurement to represent the anatomical structure of the atrium and the ventricle, respectively. As the largest organ in the body, multiple measurement points were set in the lungs of the phantom, which divided the anatomy on Section 18 into the left upper lung (No. 97), the right upper lung (No. 102), the left lower lung (No. 100), and the right lower lung (No. 106).
2.8. Data Analysis
In this study, as both the TPS calculations of different techniques and the measured OSLD doses had to be compared, the number of samples exceeded two. Therefore, the paired sample t test was adopted for data analysis, which was completed in SPSS 18.0 (SPSS, Inc., Chicago, IL, USA). The confidence interval (CI) was set at 95%, and the significance level was set at p < 0.05.
3. Results
3.1. PTV Dose Evaluation
This study utilized three plan techniques, of which IMRT and VMAT belonged to inverse planning. According to the results from the Pinnacle 9.8 TPS, among the three plan types, only the target volume receiving 90% prescribed dose of the 3D-CRT plan was lower than 80%. The PTV Dmean of the 3D-CRT, IMRT, and VMAT plans was 49.16 ± 0.05 Gy, 50.78 ± 0.06 Gy, and 51.24 ± 0.10 Gy, respectively. Alternatively, the V47.5Gy of the 3D-CRT, IMRT, and VMAT plans was 90.88 ± 0.53%, 90.74 ± 0.17%, and 97.87 ± 0.06%, respectively. The VMAT plan had the best V95% PTV coverage. The CI of the 3D-CRT, IMRT, and VMAT plans was 0.70 ± 0.01, 0.81 ± 0.02, and 0.89 ± 0.02, respectively, with VMAT ranking the top. Similarly, the VMAT plan had the best HI of 0.10 ± 0.01, followed by the IMRT plan with an HI of 0.13 ± 0.01 and the 3D-CRT plan with an HI of 0.18 ± 0.02.
The average heart dose and the V
5Gy, V
15Gy and V
30Gy of the three plan types calculated by the TPS are listed in
Table 1. The average heart dose of the 3D-CRT, IMRT, and VMAT plans was 1.90 ± 0.02 Gy, 3.79 ± 0.04 Gy, and 2.25 ± 0.04 Gy, respectively. The IMRT plan had the highest heart dose because of restricted beam angles.
The V5Gy of the 3D-CRT, IMRT, and VMAT plans was 16.16 ± 0.23%, 28.17 ± 0.34% and 26.18 ± 0.17%, respectively. The low-dose spillage volume of the 3D-CRT plan was the smallest, whereas that of the VMAT plan was relatively large. Alternatively, the V15Gy of the 3D-CRT, IMRT, and VMAT plans was 4.08 ± 0.06 Gy, 7.09 ± 0.09 Gy and 6.18 ± 0.14 Gy, respectively, with the 3D-CRT plan showing the smallest volume and the IMRT plan showing the largest volume. Last, the V20Gy of the 3D-CRT, IMRT, and VMAT plans was 0.32 ± 0.02 Gy, 0.52 ± 0.01 Gy and 0.40 ± 0.01 Gy, respectively, and again the 3D-CRT plan had the smallest volume, while the IMRT plan had the largest volume.
3.2. Comparison of OARs in Three Techniques on Dosimetry
Table 2 shows the average dose of the thyroids, the heart, and the lungs. For the 3D-CRT plan, the left- and the right-thyroid doses were 0.10 ± 0.01 Gy and 0.18 ± 0.02 Gy, respectively; the atrium and the ventricle doses of the heart were 0.69 ± 0.03 Gy and 0.70 ± 0.01 Gy, respectively; and doses of the left upper lung, the right upper lung, the left lower lung, and the right lower lung were 6.14 ± 0.03 Gy, 0.69 ± 0.03 Gy, 0.24 ± 0.03 Gy, and 0.13 ± 0.02 Gy, respectively. Alternatively, for the IMRT plan, the left- and the right-thyroid doses were 0.11 ± 0.02 Gy and 0.20 ± 0.01 Gy, respectively; the atrium and the ventricle doses of the heart were 0.78 ± 0.04 Gy and 0.94 ± 0.02 Gy, respectively; and doses of the left upper lung, the right upper lung, the left lower lung, and the right lower lung were 8.22 ± 0.01 Gy, 1.02 ± 0.02 Gy, 0.52 ± 0.01 Gy, and 0.15 ± 0.03 Gy, respectively. Lastly, for the VMAT plan, the left- and the right-thyroid doses were 0.34 ± 0.03 Gy and 0.38 ± 0.01 Gy, respectively; the atrium and the ventricle doses of the heart were 2.88 ± 0.02 Gy and 4.05 ± 0.04 Gy, respectively; and doses of the left upper lung, the right upper lung, the left lower lung, and the right lower lung were 8.93 ± 0.02 Gy, 3.95 ± 0.03 Gy, 0.83 ± 0.03 Gy, and 0.77 ± 0.03 Gy, respectively.
These results indicated that the three techniques did not show significant differences in the thyroid dose. Due to its superior CI, the VMAT plan had a substantially higher average heart dose than the 3D-CRT and the IMRT plans. In addition, for all the three techniques, the dose of the measurement point located at the ipsilateral lung (No. 97) was considerably higher than the overall lung dose.
3.3. Comparison of TPS Doses with Doses Measured by OSLDs
OSLDs were used to measure the OAR doses of different treatment techniques, so as to identify the difference between the TPS calculated dose and the actual measured dose. The results are listed in
Table 3,
Table 4 and
Table 5.
Table 3 compares the TPS calculated doses and the doses measured by OSLDs of the 3D-CRT plan. It was observed that the TPS underestimated the average dose of the left thyroid, the measurement of which was 0.27 ± 0.05 Gy. The
p value was 0.024, indicating that the difference was statistically significant. Therefore, special attention should be paid to the thyroids when applying lead shields. In contrast, in terms of the average doses of the right thyroid, the heart, and the lungs, no significant differences were seen between the planning dose and the dose measured by OSLD.
Table 4 compares the TPS calculated doses and the doses measured by OSLDs of the IMRT plan. It was noted that the TPS underestimated the average doses of both the left thyroid and the lungs (No. 100), the measurements of which were 0.25 ± 0.04 Gy and 1.37 ± 0.14 Gy, respectively. The
p values were 0.035 and 0.022, respectively, indicating that the differences were statistically significant. Therefore, special attention should be paid to the thyroid when applying lead shields. In contrast, in terms of the average doses of the right thyroid, the heart, and the lungs, no significant differences were seen between the planning dose and the dose measured by OSLD.
3.4. Radiation Dose Difference after the Application of Lead Shields
Comparison of the TPS calculated dose and the dose measured by OSLDs of different radiotherapy techniques indicated that sometimes the TPS could underestimate the OAR dose. Therefore, the actual measurements acquired with OSLDs were used to compare thyroid, heart, and lung doses following the application of lead shields. In terms of the dose distribution within the PTV, both the conformity and the homogeneity of the VMAT plan were superior to those of the IMRT plan. In addition, the average heart dose of the 3D-CRT plan, the IMRT plan, and the VMAT plan was 1.90 ± 0.02 Gy, 3.79 ± 0.04 Gy and 2.25 ± 0.04 Gy, respectively, with IMRT having a higher heart dose than VMAT. Therefore, in this part of the study, the VMAT technique was utilized to identify the effect of lead shielding. Two different thickness of lead shields were deployed, namely 0.125 mm and 0.25 mm. The results are shown in
Table 6 and
Table 7.
Table 6 shows the results of using lead shields with a thickness of 0.125 mm, which were applied to the skin around the breast tumor area to protect critical organs. It was found that the absorbed doses of thyroids, heart, and lungs all decreased. After applying 0.125 mm of lead shields, the dose to the thyroid was reduced by 5.12–27.5%. In particular, for the left thyroid, the average dose before and after the application of the 0.125 mm lead shields was 0.40 ± 0.07 Gy and 0.29 ± 0.04 Gy, respectively, showing a significant dose reduction. Similarly, the heart dose reduced by 49.41–50.12% after 0.125 mm of lead shields were used. Before lead shields were applied, the average atrium and ventricle doses were 4.11 ± 0.11 Gy and 4.31 ± 0.09 Gy, respectively, and after lead shields were applied, these became 2.05 ± 0.06 Gy and 2.18 ± 0.09 Gy, respectively, the reduction of which was also significant. Last, the lung doses decreased by 1.23–45.22% with lead shields. More specifically, the left upper lung dose (No. 97) before and after the application of the lead shield of thickness 0.125 mm was 11.10 ± 0.14 Gy and 6.08 ± 0.09 Gy, respectively, again showing a significant dose reduction.
Table 7 lists the results of using lead shields with a thickness of 0.25 mm to cover the skin around the breast tumor area to protect critical organs. It was found that the absorbed doses of thyroids, heart, and lungs all decreased. The dose to the thyroid was reduced by 20.51–30%. In particular, for the left thyroid, the average dose before and after the use of lead shields with a 0.25 mm thickness was 0.40 ± 0.07 Gy and 0.28 ± 0.05 Gy, respectively, showing a significant dose reduction. Similarly, the heart does were reduced by 56.38–57.42% when the lead shields were used. The average atrium and ventricle doses were 4.11 ± 0.11 Gy and 4.31 ± 0.09 Gy before the use of lead shields, while these doses become 1.75 ± 0.11 Gy and 1.88 ± 0.08 Gy with the use of lead shields. The lung doses were reduced by 0.98–57.83% with lead shields. The left upper lung dose (No. 97) before and after the application of the lead shield of thickness 0.25 mm was 11.10 ± 0.14 Gy and 4.68 ± 0.13 Gy, respectively. These results suggested that increasing the thickness of the lead shields could effectively reduce the OAR doses, thereby potentially minimizing the risk of normal tissue complications. The risk of heart disease was especially reduced (decreased by 7.4% for each reduction of 1 Gy; Darby et al.) [
19]. However, applying excessive thicknesses of lead shields in clinical practice can reduce treatment comfort, and therefore whether it is tolerable by the patient should be confirmed prior to treatment.
4. Discussion
Radiotherapy may damage heart structures such as pericardium, myocardium and heart valves and cause injury-induced cardiovascular toxicity. Despite being a relatively common heart injury, acute pericarditis barely shows symptoms within one year of radiotherapy, as radiation-induced heart disease develops slowly and does not cause functional damage until after a few years. Similarly, radiation can damage lung structures, including alveoli, alveolar compartments, trachea, bronchi, and other pulmonary vessels, with one of the most common lung injuries being radiation pneumonitis. In most circumstances, the degree of lung injury is closely related to the irradiated volume as well as the radiation dose. In a study by Mahsa Abdemanafi et al. [
22], a 3D-CRT breast radiotherapy plan with a total dose of 50 Gy was created on a 3D phantom. A total of 10 thermoluminescent dosimeters (TLDs) were then evenly distributed across the left lung of the phantom to measure doses and compare them to TPS calculations. The results indicated that the measured and the calculated average doses differed significantly, which is consistent with our results acquired with OSLDs.
In a study by Tuomas Virén et al. [
23] the authors investigated 10 patients with left breast cancer, they compared various techniques including standard tangential field-in-field (FinF), tangential IMRT, tangential VMAT, and continuous VMAT under a dose scheme of 50 Gy in five fractions. The study found that cVMAT had the lowest average heart dose, followed by tVMAT, IMRT, and FinF. The same study indicated that tVMAT was the most effective method to improve target homogeneity and reduce heart dose. On this basis, although cVMAT was more common in clinical practice, the authors included tVMAT as an option to treat future breast patients. Alternatively, Haciislamogl et al. [
24] published the outcome of 15 patients who underwent radiotherapy after left breast-conserving surgery in 2015. The dose scheme was 50Gy in 25 fractions. The study indicated that the average heart dose of VMAT, Tomotherapy, and 3D-CRT was 9.24 ± 2.12 Gy, 4.13 ± 0.77 Gy, and 4.39 ± 2.24 Gy, respectively, with VMAT having the highest average heart dose. Last, Darby et al. [
17] reviewed a total of 2168 women in Sweden and Denmark who received radiotherapy for breast cancer between 1958 and 2001. They found that their heart doses ranged between 0.03 and 27.72 Gy, and the average dose was 4.9 Gy. In addition, the results showed that the risk of heart disease increased by 7.4% with every 1 Gy of increase in heart dose. In this study, by applying lead shields, the heart dose was successfully reduced from 4.31 ± 0.09 Gy to 1.88–2.18 Gy, thereby reducing the risk of associated heart diseases by 14.8%.
The present study is limited to phantom experiments and cannot fully be adapted into clinical use. It needs further investigation in the clinical situation when considering put the technique into practice. The lead shields can potentially reduce the skin surface dose of the surrounding organs; however, the reproducibility of the lead shields for each treatment fraction of radiotherapy is a non-negligible issue due to the breathing movement. The use of lead shields in conjunction with deep inspiration breath-hold irradiation may be a useful solution to tackle the issue. Several studies have pointed out that the DIBH technique of radiotherapy on the left breast can reduce the irradiated heart volume and cardiac dose [
25,
26,
27,
28,
29]. The combination of the two techniques is expected to further reduce the cardiac dose. On the other hand, the materials of the lead shields can be further optimized to ensure the fitness between the lead clothing and the body surface, thereby reducing the reproducibility of the lead shields for each treatment.
Our study has several limitations. First, OAR doses were correlated with the patient’s chest wall thickness, thoracic angle, respiratory motion, tumor location, and operation method. However, only the heart and the lung doses were discussed in this study, whereas the above related variables were not included in the discussion. Second, due to the limited geometry of the anthropomorphic breast phantom and the treatment plan design, the study only investigated dose changes in patients undergoing breast-conserving surgery, while those who received total mastectomy were not discussed in the study.


