1. Introduction
High intensity focused ultrasound (HIFU) treatment is regarded as one of the most promising cancer treatment technologies in the 21st century due to its high penetration and non-invasiveness [
1,
2,
3]. Its principle is to use ultrasonic energy to focus on the tumor tissues, the tumor tissues absorb the ultrasonic energy, and the temperature rapidly increases to above 65 °C in a short time, which results in coagulative necrosis of cells and achieves the purpose of killing the tumor tissues [
4,
5,
6]. Additionally, it has no obvious effect on the tissues outside the focus [
7]. In addition, some scholars believe that HIFU can destroy the double-stranded DNA to inhibit the growth of tumor cells [
4,
8]. Therefore, it is particularly important to monitor and evaluate HIFU treatment accurately and efficiently.
So far, researchers have studied the ultrasound echo signals during the HIFU treatment in many ways to reflect the effect of treatment. For example, many researchers studied ultrasonic echo signals and extracted parameters that could accurately reflect the characteristics of the tissues, such as ultrasonic attenuation coefficient, sound velocity and entropy [
9,
10,
11]. Some scholars studied the effects of temperature and thermal dose on the attenuation of ultrasound in muscle, liver and kidney [
12]. Additionally, some scholars used characteristic parameters of ultrasonic echo signals to identify denatured tissues [
13,
14,
15]. Other scholars also have used the harmonic frequency of ultrasonic echo signals to explore tissue characteristics [
16].
However, all the above studies require a diagnostic ultrasound source to monitor and obtain the ultrasound echo signals. Few scholars directly used the HIFU echo signals for research. One of the reasons is that it is difficult to correctly judge whether the HIFU echo signal is received, because the HIFU echo signal is sampled mainly by manual observation of the waveform or spectrum. When conducting follow-up research, if the observer cannot accurately judge that the sampled signal is the HIFU signal, it may cause misjudgment and affect the research results. The judgment result depends on the observer’s experience, the judgment result of the different observer may be different.
Therefore, it is of great significance to effectively judge whether the sampled signal is the HIFU echo signal [
17]. In this paper, a method based on an auto-regressive (AR) model and spectrum information entropy is proposed to judge the HIFU echo signal. The consistency between this method and empirical judgment is compared, and the segment number for power spectrum is analyzed and discussed. The optimal segment number is determined, and the advantages of this method are verified by comparing with the classic power spectrum estimation method.
2. Theory
2.1. Auto-Regressive Model
Suppose that the system model of the random sequence
is a linear difference equation:
where
is the white Gaussian noise sequence;
and
are constants.
The
transformation of Equation (1) is as follows:
Therefore, the transfer function of the system is:
where the expressions of
and
are:
Assuming that the power spectral density of the white noise is
, the output power spectral density is:
where
, and Equation (6) can be substituted into:
According to Equation (1), when
and
, the difference equation of the system can be changed to:
Equation (8) is an auto-regressive (AR) model, where
is the parameters of AR model;
is the white Gaussian noise with mean variance of
;
is the order of AR model [
18]. And its output power spectrum is:
where Akaike information criterion (AIC) is used to determine the order of AR model; Yule-Walker method is used to estimate the parameters of AR model [
19]. After calculating
and
, the power spectrum of the time series can be estimated by calculation.
2.2. Spectrum Information Entropy
In 1948, Shannon proposed the concept of “information entropy”, which solved the problem of quantifying information. The more orderly a system, the lower the information entropy; conversely, the more chaotic a system, the higher the information entropy. Therefore, information entropy is an important indicator to measure the order of the system [
20,
21,
22].
Considering the characteristics of the signal, the power spectrum of the HIFU echo signal is more uncertain, and its power spectrum information entropy is higher than that of the noise signal. Therefore, power spectrum information entropy can be used as a judgment index.
The judgment process based on power spectrum information entropy is as follows:
AR model is used to estimate the power spectrum of the sampled signal, and the power spectrum amplitude is normalized.
The amplitude range of the power spectrum is segmented. For example, 0~0.1 is the first segment, 0.1~0.2 is the second segment, and so on.
The amount of data in each segment number is counted and the probability that the segment appears in the whole data point is calculated.
According to the Equation (10), the spectrum information entropy is calculated, and the HIFU echo signal is judged according to the appropriate threshold.
where
is spectrum information entropy;
is the probability of the
-th segment after the power spectrum segmentation;
is the segment number.
2.3. Evaluation Indexes
In order to compare and analyze the consistency between the results of this method and empirical judgments, the Accuracy, Sensitivity and Specificity are used as evaluation indexes. Their calculation formula is as follows:
where
is the number of this method’s judgments and empirical judgments that are both the HIFU echo signals;
is the number of this method’s judgments and empirical judgments that are both the noise signals;
is the number of this method’s judgments that are the HIFU echo signals but whose empirical judgments are the noise signals;
is the number of this method’s judgments that are the noise signals but whose empirical judgments are the HIFU echo signals.
3. Experimental Methods and Results
3.1. Experimental Platform
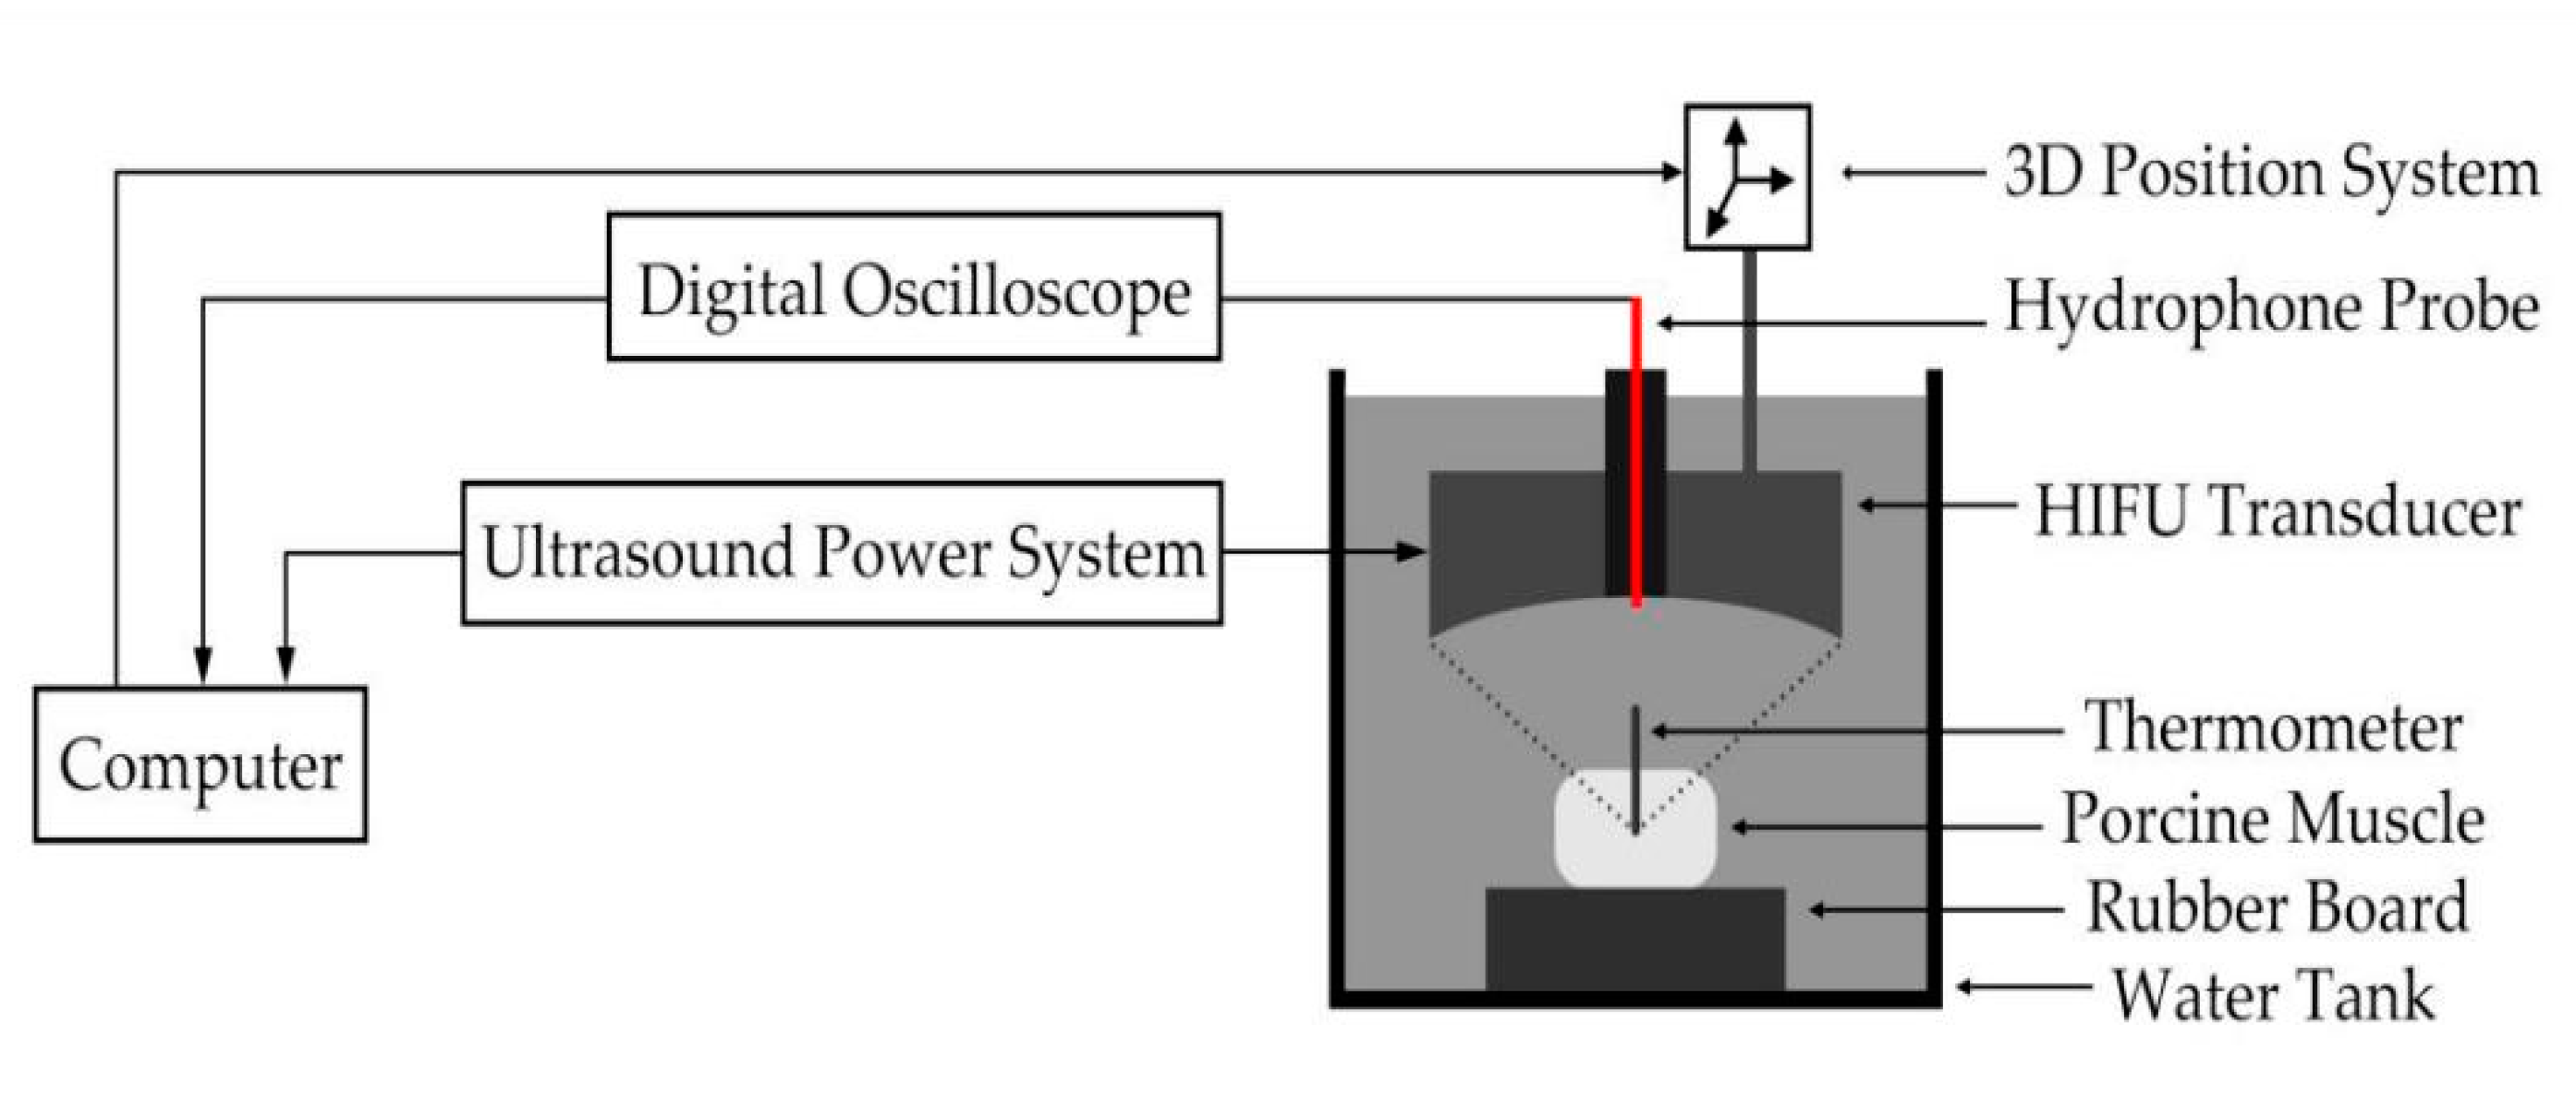
Figure 1 shows the HIFU experimental system, which is mainly composed of a water tank, a thermometer, a HIFU transducer, a hydrophone probe, a 3D position system, a digital oscilloscope and a computer control terminal. The input power of the HIFU transducer can be adjusted by the HIFU control system. The drive power of the HIFU transducer is 210~300 W and the irradiation period is 0.1~0.2 ms. Fresh porcine muscle tissues were selected as the experimental material. The preparation process of the tank liquid is as follows: firstly, 95% ethanol was mixed with povidone in a ratio of 4:1, then the mixture was poured into the tank and mixed with water in a ratio of 1:20 to remove oxygen. In order to stabilize the mixture, we waited one hour before the experiment. The experimental material was fixed on an acoustic rubber plate and placed in the mixture under the HIFU transducer (PRO2008, Shenzhen, China). The geometric focal length of the HIFU transducer was 13 cm, the aperture of transducer was 11 cm, the diameter of the circular hole was 4.7 cm, and the source pressure of transducer was 0.23 MPa. In addition, the ellipsoidal −6 dB focal beam width of this transducer was 1.6 mm. The 3D position system can control the position change of the HIFU irradiation target area. There is a channel above the HIFU transducer that allows a hydrophone probe (FOPH2000, Lautenbach, Germany) to be placed. A thermometer (DT-3891G, Shenzhen, China) was inserted into fresh porcine tissues to measure the temperature and estimate the extent of the damage. The sampled signals were obtained through a hydrophone probe, amplified by a broadband signal amplifier, and sent to the digital oscilloscope (MDO3032, Tektronix, Beaverton, OR, USA) for observation and preservation.
In this experiment, 188 groups of data were obtained from 10 specimens of in vitro fresh porcine muscle tissues, including 90 groups that were sampled while the HIFU source was on and 98 groups that were sampled while the HIFU source was off. The HIFU echo signals can be obtained while the HIFU source is on. The center frequency of the HIFU echo signal was 1.39 MHz, the second harmonic frequency was 2.78 MHz.
3.2. Time Domain Analysis of the Sampled Signals
In the actual signal acquisition, the HIFU echo signals containing noises were obtained because the instrument user did not strictly follow the standard or the vibration of the experimental instrument.
Figure 2a shows the time domain waveform of the HIFU echo signal, and
Figure 2b shows the time domain waveform of the noise signal. It can be seen that it is difficult to judge whether it is the HIFU echo signal based on the time domain waveform, but it can also be seen from the waveform that the HIFU echo signal contains certain echo characteristics relative to the noise signal. When the waveform has difficulty judging the type of the sampled signal, we need to convert the time domain waveform into the power spectrum to make the judgment. The above is the basis for empirical judgment. If there are many sampled signals to judge, empirical judgment may cause misjudgment to some extent. Therefore, this method is proposed to judge the different types of sampled signals.
3.3. Analysis of the Power Spectrum by AR Model
The AR model is one of the main methods for modern power spectrum estimation. In the AR model, it is a difficult problem to choose the proper order. The higher the order is, the more the characteristics of the time series are reflected. However, when the order is too high, the more parameters are required to be estimated, and the error rate will increase. Therefore, it is important to determine the appropriate order.
In this paper, AIC was used to determine the order, which overcomes the artificiality of statistical hypothesis test, and the order obtained by AIC is the definite optimal estimate.
Figure 3 shows the AIC value of the HIFU echo signal. It can be seen that the AIC value fluctuates greatly when the order is small, which is not suitable to be used as the order. As the order increases to 34, the AIC value tends to be stable. Therefore, the order of the HIFU echo signals is determined to be 34. Additionally, after analysis, the order of the noise signals is determined to be 23. In addition, the Yule-Walker method was used to solve the parameters of the AR model. After the order of AR model is solved, the parameters of AR model can be calculated by the Yule-Walker method.
Figure 4 shows the power spectrum estimated by two methods of the signal shown in
Figure 2a. The black part is the result of classic power spectrum estimation, and the red part is the result of AR model estimation. The calculation steps of classic power spectrum estimation are as follows: firstly, Fourier transform is directly applied to the signal, and then the square of its modulus is calculated and divided by the data points of the signal, and finally the power spectrum is obtained. It can be seen that the central frequency and the second harmonic can be well estimated by the AR model. Although the corresponding amplitude is somewhat reduced, it is helpful to calculate the spectral information entropy. Then power spectral information entropy is calculated.
3.4. The Influence of the Segment Number for Power Spectrum
In this section, the spectrum information entropy of the power spectrum estimated by the AR model is calculated and the influence of the segment number for power spectrum is analyzed. The segmented range for power spectrum is from 2 to 40 for analysis and comparison.
This experiment used this method to judge 188 groups of data, including 90 groups of the HIFU echo signals and 98 groups of the noise signals. The power spectra of these sampled signals were estimated by the AR model, and these power spectra were segmented from 2 to 40 to calculate spectral information entropy under each segment number. Then, the appropriate threshold under each segment number was determined to judge the types of these sampled signals. We analyzed the consistency between the results of this method and empirical judgments, and the Accuracy, Sensitivity and Specificity under each segment number were calculated using Equations (11)–(13). The fitting curve of the comparison results is shown in
Figure 5.
As shown in
Figure 5a, when the segment number is 2 to 20, the Accuracy starts to increase from 0.932. In addition, when the segment number is between 14 and 17, it has the highest value. When the segment number is greater than 20, the Accuracy decreases slowly.
Figure 5b is a fitting curve of the Sensitivity, when the segment number is 2 to 40, the Sensitivity keeps increasing and always stays above 95%.
Figure 5c shows the Specificity, when the segment number is from 2 to 20, the Specificity starts to increase, and when the segment number is greater than 20, it starts to decrease slowly. In the application environment of this experiment, it is recommended to select the segment number from 14 to 17, because when the segment number is 14 to 17, this method has better Accuracy, Sensitivity and Specificity. Moreover, the single average running time of this method is only 1.2 s, which is easy to calculate.
3.5. Comparison of Different Judgment Methods
Figure 6 shows the average power spectrum information entropy under each segment number calculated by this method. It can be seen that the average power spectrum information entropy of the HIFU echo signals under each segment number are greater than that of the noise signals, and there is a certain degree of differentiation. Only an appropriate threshold under each segment number needs to determine, and then it can be judged whether or not the sampled signal is the HIFU echo signal. After a comprehensive analysis of the average entropy value and three evaluation indicators under each segment number, this method was compared with classic power spectrum method when the segment number is 17.
When the segment number is 17, the average entropy of the HIFU echo signals is 2.32, and the average entropy of the noise signals is 1.51. In addition, when the threshold is determined to be 1.98, the optimal recognition rate of distinguishing the two types of sampled signals can reach 98.60%. Similarly, if classic power spectrum method is used for distinguishing, the optimal recognition rate reaches 95.20% after determining the threshold. When the segment number is 17, it can be obtained that the recognition rate of this method to distinguish the two types of sampled signals is higher than that of the classic power spectrum method.
Table 1 shows the Accuracy, Sensitivity and Specificity of this method and classic power spectrum method compared with empirical judgments when the segment number is 17. It can be concluded from
Table 1 that this method has higher values on the Accuracy, Sensitivity and Specificity, which verifies that this method is more consistent with empirical judgments.
4. Conclusions
In this paper, a judgment method based on AR model and spectrum information entropy for HIFU echo signal was proposed. The influence of the segment number was analyzed and discussed, and the optimal segment number was obtained. Then, the judgment results of this method and empirical judgments were analyzed in consistency, and the sampled signals were distinguished by this method and classic power spectrum method, respectively. The experimental results show that when the segment number is 14 to 17, the judgment results of this method have a higher consistency with empirical judgments, and the Accuracy greater than 96%, the Sensitivity greater than 96% and the Specificity greater than 86%. In addition, when the segment number is 17, recognition rate of this method for distinguishing two types of these sampled signals reaches 98.60%, which is higher than that of the classic power spectrum estimation method. Therefore, this method can effectively judge the different types of sampled signals. If the parameter selection of the AR model can be automatically optimized, it will be more intelligent. In addition, the research results of this paper have a certain significance for further in-depth analysis of the characteristics of the HIFU echo signals to estimate curative effects.
Author Contributions
Conceptualization, S.-Y.Q., X.Z. and S.-Q.Y.; methodology, X.Z., S.-Y.Q., S.-Q.Y., H.Z. and B.L.; validation, S.-Q.Y., X.-S.N. and Z.H.; writing—review and editing, S.-Y.Q., S.-Q.Y. and X.Z. All authors have read and agreed to the published version of the manuscript.
Funding
This research was funded by “National Natural Science Foundation of China, grant number 11774088 and 11474090”.
Institutional Review Board Statement
Not applicable.
Informed Consent Statement
Not applicable.
Data Availability Statement
Not applicable.
Conflicts of Interest
The authors declare no conflict of interest.
References
- Illing, R.O.; Kennedy, J.E.; Wu, F.; ter Haar, G.R.; Protheroe, A.S.; Friend, P.J.; Gleeson, F.V.; Cranston, D.W.; Phillips, R.R.; Middleton, M.R. The safety and feasibility of extracorporeal high-intensity focused ultrasound (HIFU) for the treatment of liver and kidney tumours in a Western population. Br. J. Cancer 2005, 93, 890–895. [Google Scholar] [CrossRef] [Green Version]
- Kennedy, J.E. High-intensity focused ultrasound in the treatment of solid tumours. Nat. Rev. Cancer 2005, 5, 321–327. [Google Scholar] [CrossRef] [PubMed]
- Orsi, F.; Arnone, P.; Chen, W.; Zhang, L. High intensity focused ultrasound ablation: A new therapeutic option for solid tumors. J. Cancer Res. Ther. 2010, 6, 414–420. [Google Scholar] [PubMed]
- Ide, H.; Nakagawa, T.; Terado, Y.; Yasuda, M.; Kamiyama, Y.; Muto, S.; Horie, S. DNA damage response in prostate cancer cells after high-intensity focused ultrasound (HIFU) treatment. Anticancer Res. 2008, 28, 639–643. [Google Scholar]
- Zhou, Y.; Wang, Z.; Chen, Y.; Shen, H.; Luo, Z.; Li, A.; Wang, Q.; Ran, H.; Li, P.; Song, W.; et al. Microbubbles from Gas-Generating Perfluorohexane Nanoemulsions for Targeted Temperature-Sensitive Ultrasonography and Synergistic HIFU Ablation of Tumors. Adv. Mater. 2013, 25, 4123–4130. [Google Scholar] [CrossRef]
- Park, S.M.; Kim, M.S.; Park, S.; Park, E.S.; Choi, K.; Kim, Y.; Kim, H.R. Novel temperature-triggered liposome with high stability: Formulation, in vitro evaluation, and in vivo study combined with high-intensity focused ultrasound (HIFU). J. Control. Release 2013, 170, 373–379. [Google Scholar] [CrossRef]
- Mottet, N.; Bellmunt, J.; Bolla, M.; Briers, E.; Cumberbatch, M.G.; De Santis, M.; Fossati, N.; Gross, T.; Henry, A.M.; Joniau, S.; et al. EAU-ESTRO-SIOG Guidelines on Prostate Cancer. Part 1: Screening, Diagnosis, and Local Treatment with Curative Intent. Eur. Urol. 2017, 71, 618–629. [Google Scholar] [CrossRef] [PubMed]
- Kramer, G.; Steiner, G.E.; Grobl, M.; Hrachowitz, K.; Reithmayr, F.; Paucz, L.; Newman, M.; Madersbacher, S.; Gruber, D.; Susani, M.; et al. Response to sublethal heat treatment of prostatic tumor cells and of prostatic tumor infiltrating T-cells. Prostate 2004, 58, 109–120. [Google Scholar] [CrossRef]
- Worthington, A.E.; Trachtenberg, J.; Sherar, M.D. Ultrasound properties of human prostate tissue during heating. Ultrasound Med. Biol. 2002, 28, 1311–1318. [Google Scholar] [CrossRef]
- Zhou, Z.; Sheng, L.; Wu, S.; Yang, C.; Zeng, Y. Ultrasonic evaluation of microwave-induced thermal lesions based on wavelet analysis of mean scatterer spacing. Ultrasonics 2013, 53, 1325–1331. [Google Scholar] [CrossRef]
- Damianou, C.A.; Sanghvi, N.T.; Fry, F.J.; Maass-Moreno, R. Dependence of ultrasonic attenuation and absorption in dog soft tissues on temperature and thermal dose. J. Acoust. Soc. Am. 1997, 102, 628–634. [Google Scholar] [CrossRef] [PubMed]
- Clarke, R.L.; Bush, N.L.; Ter Haar, G.R. The changes in acoustic attenuation due to in vitro heating. Ultrasound Med. Biol. 2003, 29, 127–135. [Google Scholar] [CrossRef]
- Liu, B.; Qian, S.Y.; Hu, W.P. Identification of Denatured Biological Tissues Based on Time-Frequency Entropy and Refined Composite Multi-Scale Weighted Permutation Entropy during HIFU Treatment. Entropy 2019, 21, 666. [Google Scholar] [CrossRef] [Green Version]
- Hughes, M.S.; McCarthy, J.E.; Marsh, J.N.; Arbeit, J.M.; Neumann, R.G.; Fuhrhop, R.W.; Wallace, K.D.; Znidersic, D.R.; Maurizi, B.N.; Baldwin, S.L.; et al. Properties of an entropy-based signal receiver with an application to ultrasonic molecular imaging. J. Acoust. Soc. Am. 2007, 121, 3542–3557. [Google Scholar] [CrossRef]
- Yan, S.Q.; Zhang, H.; Liu, B.; Tang, H.; Qian, S.Y. Identification of denatured and normal biological tissues based on compressed sensing and refined composite multi-scale fuzzy entropy during high intensity focused ultrasound treatment. Chin. Phys. B 2021, 30, 601–607. [Google Scholar] [CrossRef]
- Dong, H.; Qian, S.Y.; Tan, Q.; Zou, X.; Liu, B. Temperature Measurement Using Passive Harmonics during High Intensity Focused Ultrasound Exposures in Porcine Tissue. Acta Phys. Pol. A 2018, 134, 524–528. [Google Scholar] [CrossRef]
- Liu, C.; Han, H.; Ta, D.; Wang, W. Effect of selected signals of interest on ultrasonic backscattering measurement in cancellous bones. Sci. China Phys. Mech. Astron. 2013, 56, 1310–1316. [Google Scholar] [CrossRef]
- Ma, J.; Xu, F.; Huang, K.; Huang, R. Improvement on the linear and nonlinear auto-regressive model for predicting the NOx emission of diesel engine. Neurocomputing 2016, 207, 150–164. [Google Scholar] [CrossRef]
- Mei, J.; Shao, Q.; Liu, R. Efficient inference for parameters of unobservable periodic autoregressive time series. Commun. Stat.-Theor. Methods 2017, 46, 7390–7408. [Google Scholar] [CrossRef]
- Gao, J.; Liu, F.; Zhang, J.; Hu, J.; Cao, Y. Information Entropy As a Basic Building Block of Complexity Theory. Entropy 2013, 15, 3396–3418. [Google Scholar] [CrossRef] [Green Version]
- Kish, L.B.; Ferry, D.K. Information entropy and thermal entropy: Apples and oranges. J. Comput. Electron. 2018, 17, 43–50. [Google Scholar] [CrossRef] [Green Version]
- Jiang, F.; Sui, Y.; Cao, C. An information entropy-based approach to outlier detection in rough sets. Expert Syst. Appl. 2010, 37, 6339–6344. [Google Scholar] [CrossRef]
| Publisher’s Note: MDPI stays neutral with regard to jurisdictional claims in published maps and institutional affiliations. |
© 2021 by the authors. Licensee MDPI, Basel, Switzerland. This article is an open access article distributed under the terms and conditions of the Creative Commons Attribution (CC BY) license (https://creativecommons.org/licenses/by/4.0/).


 ,
, 


