
Multivariate Time Series Data Prediction Based on ATT-LSTM Network


Abstract
:1. Introduction
- (1)
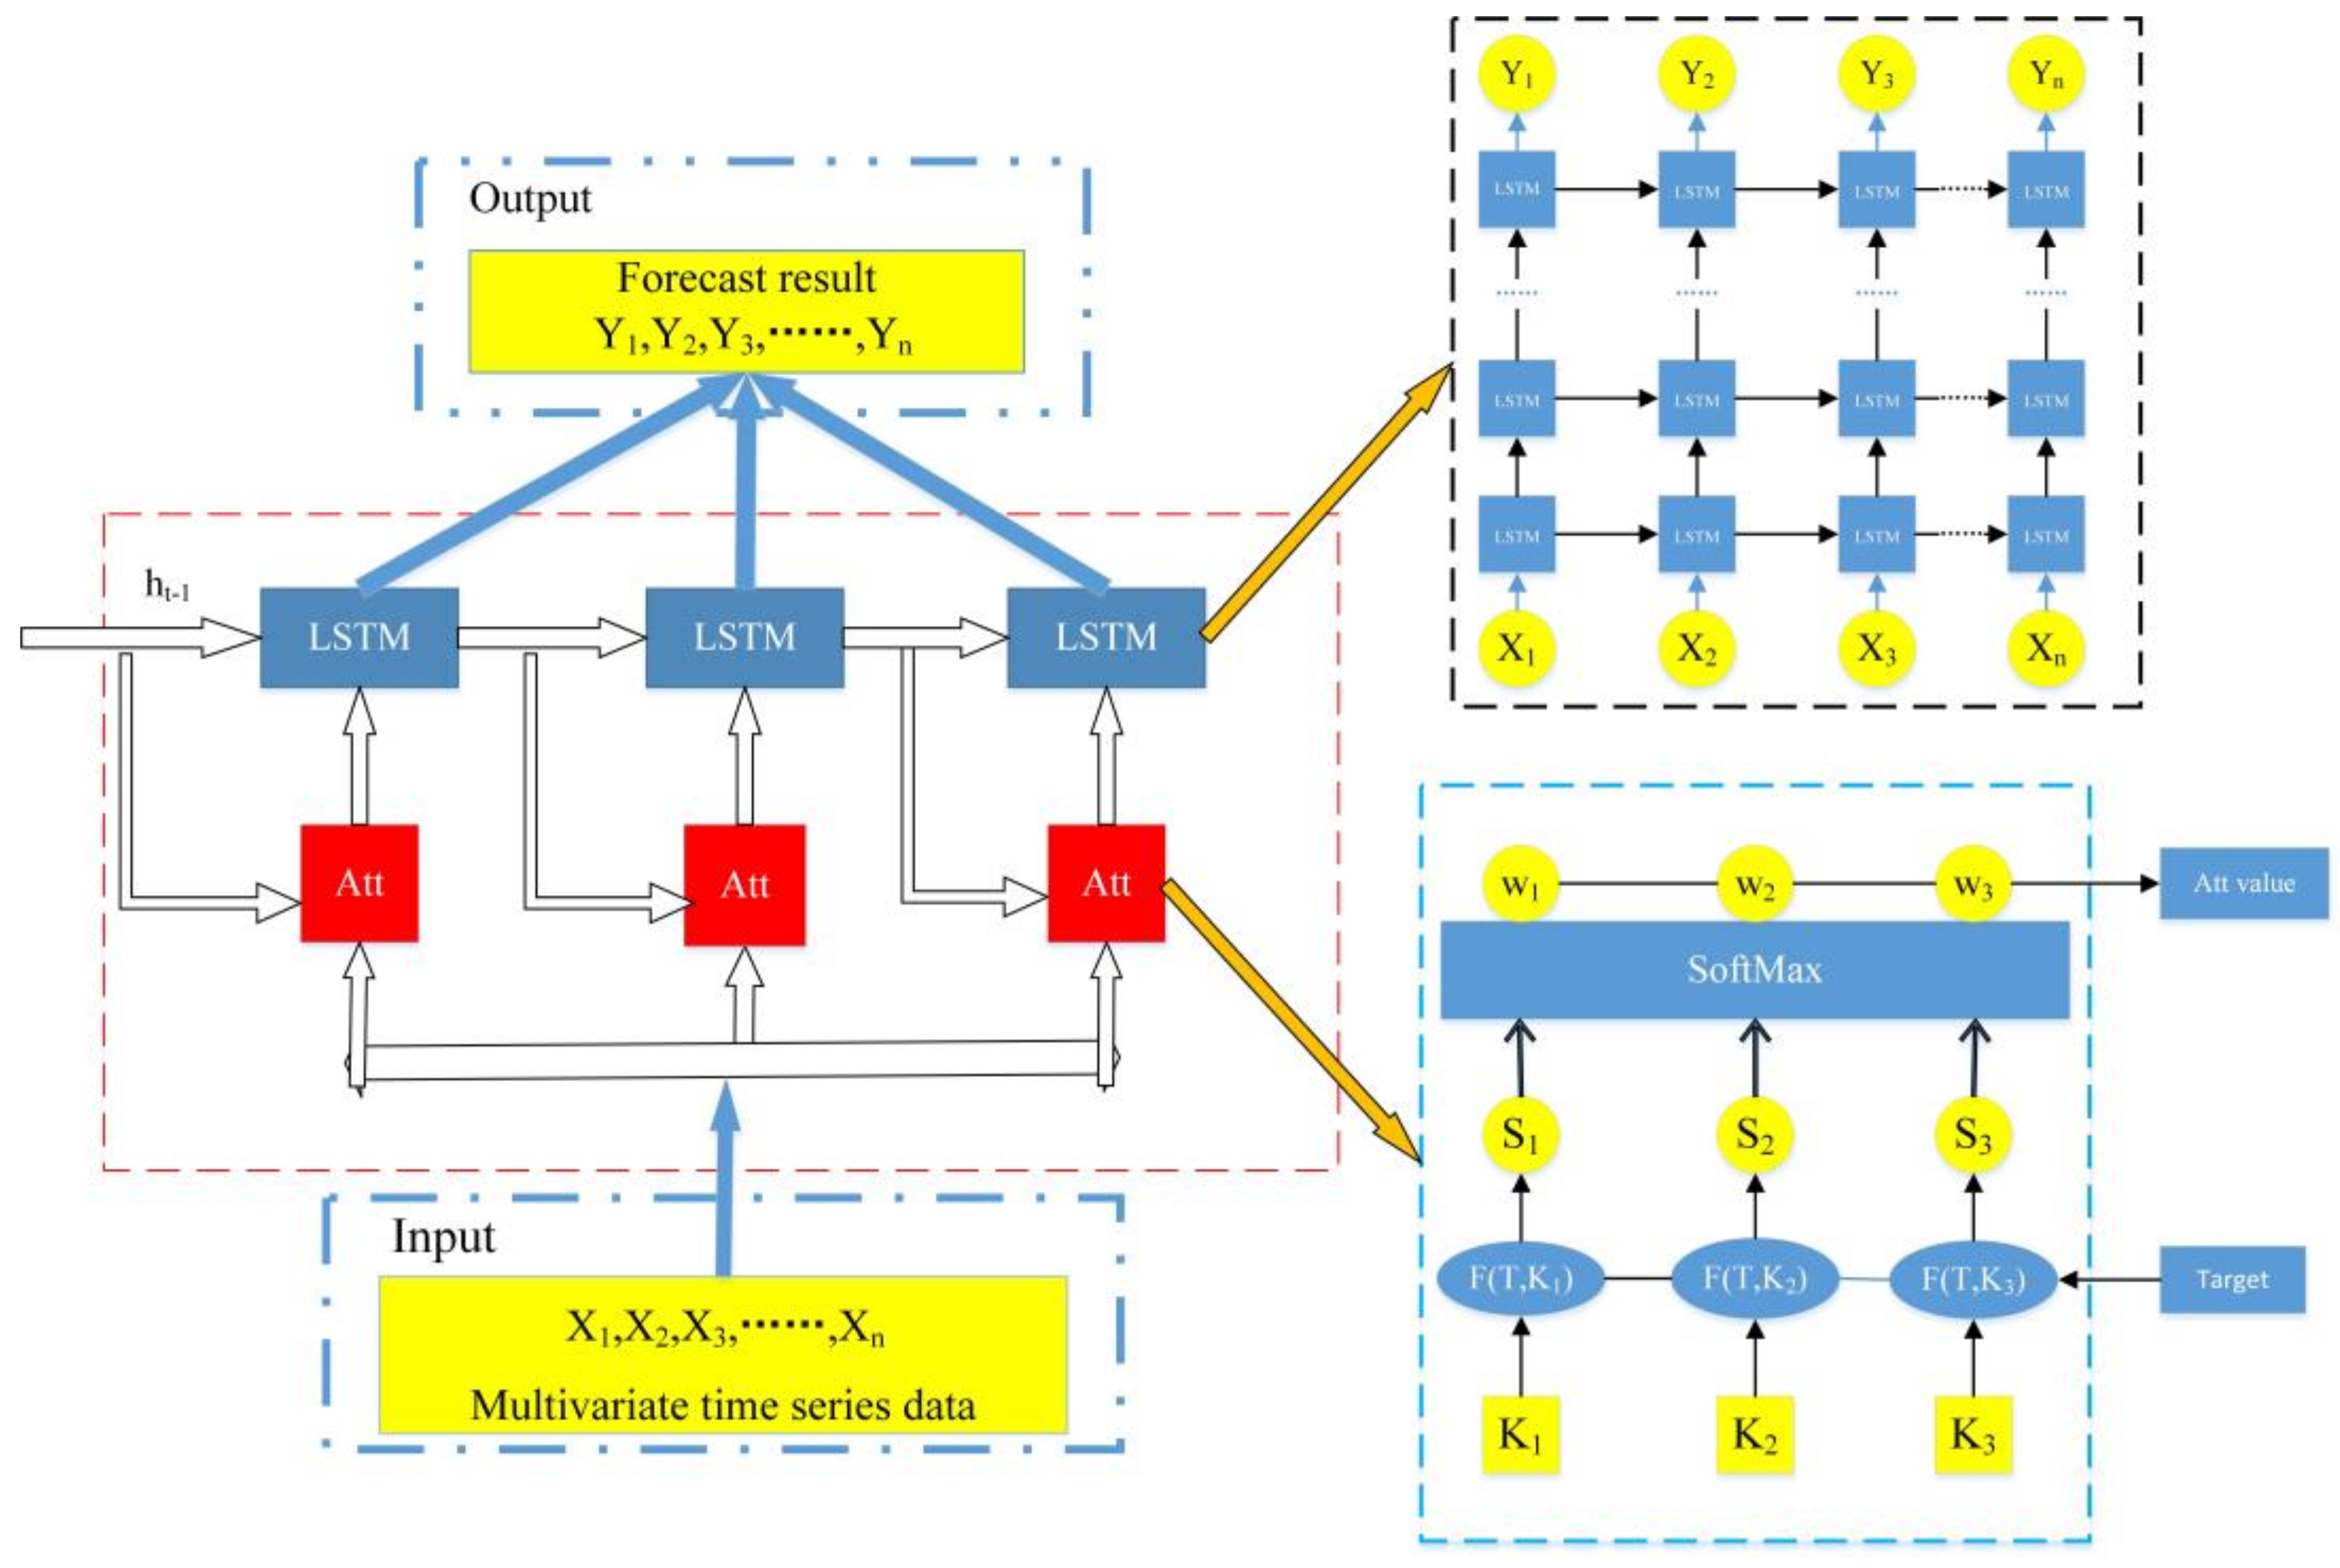
- We propose a long short-term memory neural network (ATT-LSTM) based on the attention mechanism for multivariate time series data prediction.
- (2)
- Use an attention mechanism to process multiple time series data. The attention mechanism can reduce the effect of irrelevant information on the results and enhance the influence of related information by assigning different weights and improve prediction results’ accuracy.
- (3)
- We compare the proposed ATT-LSTM model with the other six models on two real multivariate time series data sets based on two evaluation indicators: MAE and RMSE. The results prove the effectiveness of the model in predicting multivariate time series data.
2. Related Work
- (1)
- The diversity of multiple time series data. Various sequences often determine changes in one sequence, and at the same time, changes in one sequence often affect various sequences. This makes the data analysis process particularly complicated.
- (2)
- The time series of multiple time series data. Multivariate time series data are data that changes with time and often have a changing law within a certain period, which will significantly affect the overall analysis of the data by the model.
- (3)
- The instability of multiple time series data. Multivariate time series data are often realistic data sets, and most of the data contain strange information, such as missing values and data mutations. How to deal with this strange information is also an excellent challenge for multivariate time series data prediction.
- (4)
- How to correctly grasp the mutual influence information between sequences. The interaction information between the sequences can make the data analysis and prediction process more complicated on the one hand. It can also improve the accuracy of the prediction results on the other hand. The key question is how to remove irrelevant influence information and grasp the interaction information between sequences.
3. ATT-LSTM Model
3.1. Long Short-Term Memory Neural Network
3.2. Attention Mechanism
3.3. ATT-LSTM Model
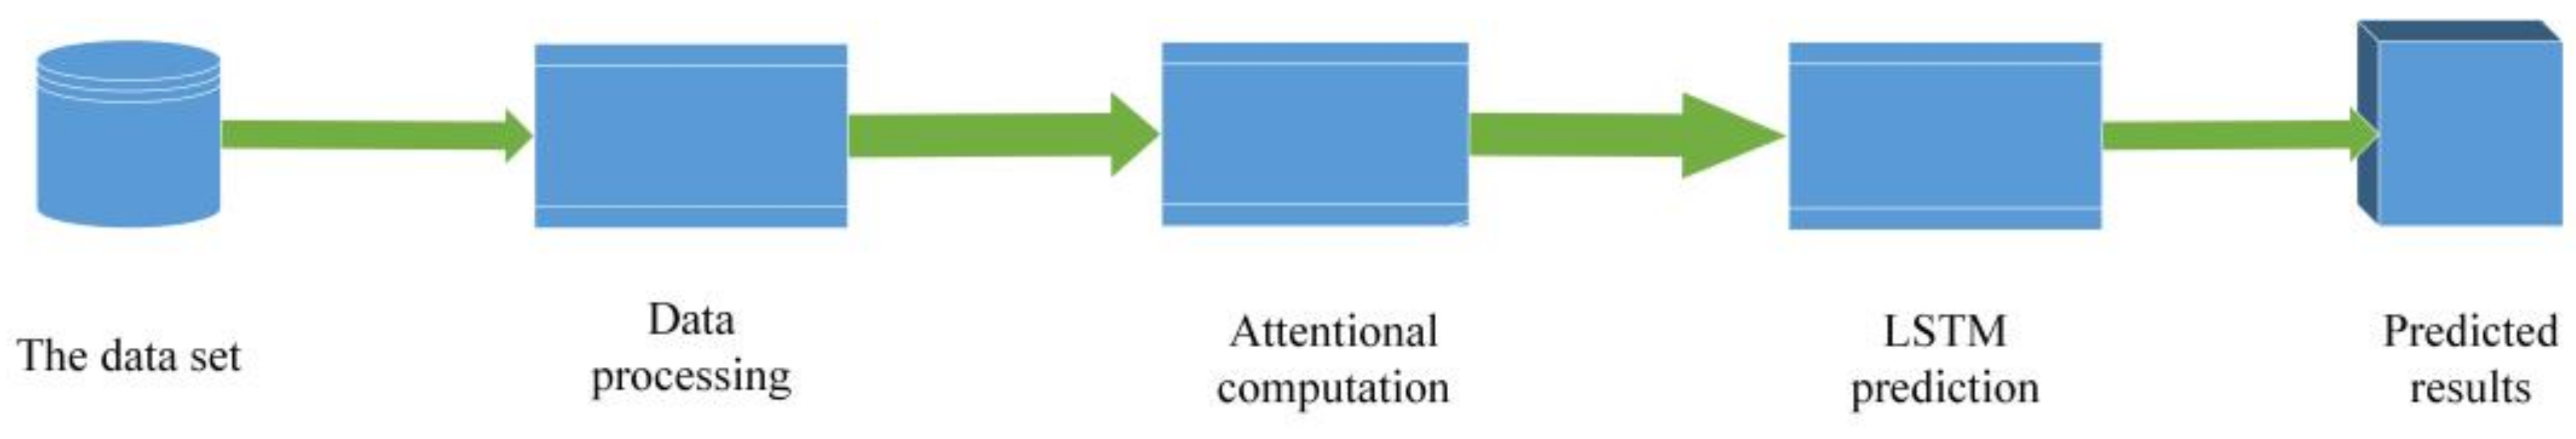
- (1)
- Data set selection. We select two real multivariate time series data sets for follow-up experiments. We will elaborate on the details of each data set in the experimental section.
- (2)
- Data processing. Since we choose an actual multivariate time series data set, the processed data set can be input to the model. The data set processing mainly includes two parts: ① missing value processing; ② mutation information processing.
- (3)
- Attention mechanism processing. Multivariate time series data has several or even dozens of related sequences, and changes in each sequence will affect the target sequence. According to historical lows, the attention mechanism calculates the attention value of each sequence, which is the distribution weight of each sequence. Finally, analyze and predict based on the attention value of each sequence.
- (4)
- LSTM network prediction. LSTM analyzes and predicts data based on the input data and the attention value processed by the attention mechanism.
- (5)
- Model output. According to the data set’s attributes, the analysis and prediction results of the ATT-LSTM model are output intuitively. The model is compared with other models according to the two evaluation indicators of RMSE and MAE.
4. Experiment
4.1. Dataset and Evaluation Indicators
4.1.1. Dataset
- (1)
- Nasdaq 100 stock data set: This data set consists of the stock prices of 104 companies under the Nasdaq 100 and the index value of the Nasdaq 100. The data collection frequency was 1 min. The data set contains 191 days of closing data from 26 July 2016 to 28 April 2017, and includes 390 data points per day. We take the Nasdaq 100 index as the target sequence and the stock prices of other 104 companies as the correlation sequence.
- (2)
- Beijing PM2.5 concentration dataset: This dataset is a PM2.5 concentration dataset sampled by the US Embassy in Beijing. The frequency of data collection was 1 h. The data set includes the PM2.5 concentration from 1 January 2020 to 31 December 2015 and other related factors (temperature, humidity, wind direction, wind force, rainfall, etc.). We take PM2.5 concentration as the target sequence and other related factors as the correlation sequence.
4.1.2. Model Evaluation Indicators
4.2. Comparison Model and Parameter Configuration
4.3. Experimental Results and Analysis
4.3.1. Model Comparison
- (1)
- Three baseline models (VAR, LSTM, GRU). On the Nasdaq 100 dataset, the LSTM performed best, followed by the VAR model. The gated recurrent unit (GRU), as a simpler variant of the LSTM, has not achieved better prediction results on this data set. The LSTM is still the best performer on the Beijing PM2.5 dataset, but the difference between the three models is insignificant.
- (2)
- Three variant models (LSTM+Zoneout, LSTM-RNN, Attention-RNN). The LSTM+Zoneout model performed best on the Nasdaq 100 dataset, followed by the Attention-RNN model. The combination of the attention mechanism and RNN has greatly improved the ability of the RNN to process multivariate data. However, due to the characteristics of the RNN, the processing of multivariate time series data has not reached the desired effect.
- (3)
- The performance of the three baseline models (VAR, LSTM, GRU) on the Nasdaq 100 dataset is worse than that on the Beijing PM2.5 dataset because the three baseline models do not analyze the correlation between multivariate sequences. The correlation sequence of the NASDAQ 100 dataset is far greater than that of the Beijing PM2.5 dataset, which causes some interference to the three baseline models, making the effect of the three baseline models on the NASDAQ 100 data set low the impact of the Beijing PM2.5 dataset. On the contrary, the three variant models (LSTM+Zoneout, LSTM-RNN, Attention-RNN) analyze related sequences. The overwhelming number of related sequences in the Nasdaq 100 dataset provides the three models with more robust learning capabilities, making the three models perform better on the Nasdaq 100 dataset than the PM2.5 dataset.
- (4)
- The ATT-LSTM model has achieved good results on both datasets. On the Nasdaq 100 dataset, compared to the best-performing LSTM baseline model, the ATT-LSTM model has about 70% improvement, compared to the best-performing LSTM+Zoneout change model, ATT-LSTM model has about 40% improvement. On the Beijing PM2.5 dataset, the ATT-LSTM model has also achieved performance improvements compared to other models, but the improvement is lower than in the Nasdaq 100 dataset.
4.3.2. Model Prediction
5. Conclusions
Author Contributions
Funding
Institutional Review Board Statement
Conflicts of Interest
References
- Trnka, A. Big data analysis. Eur. J. Sci. Theol. 2014, 10, 143–148. [Google Scholar]
- Labrinidis, A.; Jagadish, H.V. Challenges and opportunities with big data. Proc. VLDB Endow. 2012, 5, 2032–2033. [Google Scholar] [CrossRef]
- Karevan, Z.; Suykens, J.A.K. Transductive LSTM for time-series prediction: An application to weather forecasting. Neural Netw. 2020, 125, 1–9. [Google Scholar] [CrossRef]
- Zhao, Z.; Chen, W.; Wu, X.; Chen, P.C.Y.; Liu, J. LSTM network: A deep learning approach for short-term traffic forecast. IET Intell. Transp. Syst. 2017, 11, 68–75. [Google Scholar] [CrossRef] [Green Version]
- Pang, X.; Zhou, Y.; Wang, P.; Lin, W.; Chang, V. An innovative neural network approach for stock market prediction. J. Supercomput. 2020, 76, 2098–2118. [Google Scholar] [CrossRef]
- Kırbaş, I.; Sözen, A.; Tuncer, A.D.; Kazancıoğlu, F. Şinasi Comparative analysis and forecasting of COVID-19 cases in various European countries with ARIMA, NARNN and LSTM approaches. Chaos Solitons Fractals 2020, 138, 110015. [Google Scholar] [CrossRef]
- Hochreiter, S.; Schmidhuber, J. Long short-time memory. Neural Comput. 1997, 9, 1735–1780. [Google Scholar] [CrossRef] [PubMed]
- Medsker, L.R.; Jain, L.C. Recurrent neural networks. Des. Appl. 2001, 5, 64–67. [Google Scholar]
- Singhal, A.; Seborg, D.E. Clustering multivariate time-series data. J. Chemometr. J. Chemometr. Soc. 2005, 19, 427–438. [Google Scholar] [CrossRef]
- Newman, J.; Baars, B.J. A neural attentional model for access to consciousness: A global workspace perspective. Concepts Neurosci. 1993, 4, 255–290. [Google Scholar]
- LeCun, Y.; Bengio, Y.; Hinton, G. Deep learning. Nature 2015, 521, 436–444. [Google Scholar] [CrossRef] [PubMed]
- Greff, K.; Srivastava, R.K.; Koutnik, J.; Steunebrink, B.R.; Schmidhuber, J. LSTM: A search space odyssey. IEEE Trans. Neural Netw. Learn. Syst. 2016, 28, 2222–2232. [Google Scholar] [CrossRef] [Green Version]
- Chen, K.; Zhou, Y.; Dai, F. A LSTM-based method for stock returns prediction: A case study of China stock market. In Proceedings of the 2015 IEEE International Conference on Big Data, Santa Clara, CA, USA, 29 October–1 November 2015; pp. 2823–2824. [Google Scholar]
- Altché, F.; de La Fortelle, A. An LSTM network for highway trajectory prediction. In Proceedings of the 2017 IEEE 20th International Conference on Intelligent Transportation Systems (ITSC), Yokohama, Japan, 16–19 October 2017; pp. 353–359. [Google Scholar]
- Li, Y.F.; Cao, H. Prediction for tourism flow based on LSTM neural network. Proc. Comput. Sci. 2018, 129, 277–283. [Google Scholar] [CrossRef]
- Bai, Y.; Zeng, B.; Li, C.; Zhang, J. An ensemble long short-term memory neural network for hourly PM2.5 concentration forecasting. Chemosphere 2019, 222, 286–294. [Google Scholar] [CrossRef] [PubMed]
- Qi, Y.; Li, Q.; Karimian, H.; Liu, D. A hybrid model for spatiotemporal forecasting of PM2.5 based on graph convolutional neural network and long short-term memory. Sci. Total Environ. 2019, 664, 1–10. [Google Scholar] [CrossRef] [PubMed]
- Xie, G.; Shangguan, A.; Fei, R.; Ji, W.; Ma, W.; Hei, X. Motion trajectory prediction based on a CNN-LSTM sequential model. Sci. China Inf. Sci. 2020, 63, 1–21. [Google Scholar] [CrossRef]
- Zhou, J.; Wang, Y.; Xiao, F.; Wang, Y.; Sun, L. Water quality prediction method based on IGRA and LSTM. Water 2018, 10, 1148. [Google Scholar] [CrossRef] [Green Version]
- Qin, Y.; Song, D.; Chen, H. A dual-stage attention-based recurrent neural network for time series prediction. arXiv 2017, arXiv:1704.02971. [Google Scholar]
- Zheng, C.; Fan, X.; Wang, C.; Qi, J. GMAN: A graph multi-attention network for traffic prediction. In Proceedings of the Conference on Artificial Intelligence, New York, NY, USA, 7–12 February 2020; Volume 34, pp. 1234–1241. [Google Scholar]
- Li, Y.; Zhu, Z.; Kong, D.; Han, H.; Zhao, Y. EA-LSTM: Evolutionary attention-based LSTM for time series prediction. Knowl.-Based Syst. 2019, 181, 104785. [Google Scholar] [CrossRef] [Green Version]
- Liu, Y.; Gong, C.; Yang, L.; Chen, Y. DSTP-RNN: A dual-stage two-phase attention-based recurrent neural network for long-term and multivariate time series prediction. Expert Syst. Appl. 2020, 143, 113082. [Google Scholar] [CrossRef]
- Yu, Y.; Si, X.; Hu, C.; Zhang, J. A review of recurrent neural networks: LSTM cells and network architectures. Neural Comput. 2019, 31, 1235–1270. [Google Scholar] [CrossRef]
- Kong, W.; Dong, Z.Y.; Jia, Y.; Hill, D.J.; Xu, Y.; Zhang, Y. Short-term residential load forecasting based on LSTM recurrent neural network. IEEE Trans. Smart Grid 2019, 10, 841–851. [Google Scholar] [CrossRef]
- Karim, F.; Majumdar, S.; Darabi, H.; Chen, S. LSTM fully convolutional networks for time series classification. IEEE Access 2018, 6, 1662–1669. [Google Scholar] [CrossRef]
- Wu, Y.; Yuan, M.; Dong, S.; Lin, L.; Liu, Y. Remaining useful life estimation of engineered systems using vanilla LSTM neural networks. Neurocomputing 2018, 275, 167–179. [Google Scholar] [CrossRef]
- Fukui, H.; Hirakawa, T.; Yamashita, T.; Fujiyoshi, H. Attention branch network: Learning of attention mechanism for visual explanation. In Proceedings of the IEEE/CVF Conference on Computer Vision and Pattern Recognition, Long Beach, CA, USA, 16–20 June 2019; pp. 10705–10714. [Google Scholar]
- Chorowski, J.; Bahdanau, D.; Serdyuk, D. Attention-based models for speech recognition. arXiv 2015, arXiv:1506.07503. [Google Scholar]
- Qiu, J.; Wang, B.; Zhou, C. Forecasting stock prices with long-short term memory neural network based on attention mechanism. PLoS ONE 2020, 15, e0227222. [Google Scholar] [CrossRef] [PubMed]
- Li, Z.; Li, Y. A comparative study on the prediction of the BP artificial neural network model and the ARIMA model in the incidence of AIDS. BMC Med. Inform. Decis. Mak. 2020, 20, 143. [Google Scholar]
- Gers, F.A.; Schmidhuber, J.; Cummins, F. Learning to forget: Continual prediction with LSTM. Neural Comput. 2000, 12, 2451–2471. [Google Scholar] [CrossRef] [PubMed]
- Dey, R.; Salem, F.M. Gate-variants of gated recurrent unit (GRU) neural networks. In Proceedings of the 2017 IEEE 60th International Midwest Symposium on Circuits and Systems (MWSCAS), Boston, MA, USA, 6–9 August 2017; pp. 1597–1600. [Google Scholar]
- Krueger, D.; Maharaj, T.; Kramár, J. Zoneout: Regularizing rnns by randomly preserving hidden activations. arXiv 2016, arXiv:1606.01305. [Google Scholar]
- Abdel-Nasser, M.; Mahmoud, K. Accurate photovoltaic power forecasting models using deep LSTM-RNN. Neural Comput. Appl. 2019, 31, 2727–2740. [Google Scholar] [CrossRef]
- Wang, F.; Tax, D.M.J. Survey on the attention based RNN model and its applications in computer vision. arXiv 2016, arXiv:1601.06823. [Google Scholar]


| Dataset | NASDAQ 100 | PM2.5 of Beijing |
|---|---|---|
| Target series | NDX | PM2.5 |
| Related series | 104 | 8 |
| Time | 2016/07/26–2017/04/28 1 min | 2020/01/01–2015/12/31 |
| Time Intervals | 1 h | |
| The amount of data | 74,501 | 52,584 |
| Train/Validation/Test | 56875/7626/10000 | 39438/3146/10000 |
| Dataset | Time Step | Units | Batch Size | Learning Rate |
|---|---|---|---|---|
| NASDAQ 100 | 10 | 128 | 256 | 0.001 |
| PM2.5 of Beijing | 10 | 64 | 128 | 0.001 |
| Model | Dataset | |||
|---|---|---|---|---|
| NASDAQ 100 | PM2.5 of Beijing | |||
| MAE | RMSE | MAE | RMSE | |
| VAR | 0.7012 | 0.9134 | 0.6538 | 0.7986 |
| LSTM | 0.6974 | 0.8965 | 0.6328 | 0.7245 |
| GRU | 0.9567 | 0.9981 | 0.6728 | 0.7457 |
| LSTM+Zoneout | 0.3665 | 0.4203 | 0.5769 | 0.6867 |
| LSTM-RNN | 0.5439 | 0.6268 | 0.6364 | 0.7842 |
| Attention-RNN | 0.4056 | 0.4938 | 0.4241 | 0.5178 |
| ATT-LSTM | 0.1948 | 0.2633 | 0.2134 | 0.2956 |
Publisher’s Note: MDPI stays neutral with regard to jurisdictional claims in published maps and institutional affiliations. |
© 2021 by the authors. Licensee MDPI, Basel, Switzerland. This article is an open access article distributed under the terms and conditions of the Creative Commons Attribution (CC BY) license (https://creativecommons.org/licenses/by/4.0/).
Share and Cite
Ju, J.; Liu, F.-A. Multivariate Time Series Data Prediction Based on ATT-LSTM Network. Appl. Sci. 2021, 11, 9373. https://doi.org/10.3390/app11209373
Ju J, Liu F-A. Multivariate Time Series Data Prediction Based on ATT-LSTM Network. Applied Sciences. 2021; 11(20):9373. https://doi.org/10.3390/app11209373
Chicago/Turabian StyleJu, Jie, and Fang-Ai Liu. 2021. "Multivariate Time Series Data Prediction Based on ATT-LSTM Network" Applied Sciences 11, no. 20: 9373. https://doi.org/10.3390/app11209373