Article

Comparative Accuracy Analysis of Truck Weight Measurement Techniques

1
Department of Civil Engineering, Auburn University, Auburn, AL 36849-5337, USA
2
Department of Civil Engineering, University of Technology and Life Sciences, 85-796 Bydgoszcz, Poland
3
Department of Civil Engineering, Kielce University of Technology, 25-314 Kielce, Poland
*
Author to whom correspondence should be addressed.
Appl. Sci. 2021, 11(2), 745; https://doi.org/10.3390/app11020745
Submission received: 30 December 2020 / Revised: 7 January 2021 / Accepted: 11 January 2021 / Published: 14 January 2021

Abstract

:
Roads and bridges are designed to meet the transportation demands for traffic volume and loading. Knowledge of the actual traffic is needed for a rational management of highway infrastructure. There are various procedures and equipment for measuring truck weight, including static and in weigh-in-motion techniques. This paper aims to compare four systems: portable scale, stationary truck weigh station, pavement weigh-in-motion system (WIM), and bridge weigh-in-motion system (B-WIM). The first two are reliable, but they have limitations as they can measure only a small fraction of the highway traffic. Weigh-in-motion (WIM) measurements allow for a continuous recording of vehicles. The presented study database was obtained at a location that allowed for recording the same traffic using all four measurement systems. For individual vehicles captured on a portable scale, the results were directly compared with the three other systems’ measurements. The conclusion is that all four systems produce the results that are within the required and expected accuracy. The recommendation for an application depends on other constraints such as continuous measurement, installation and operation costs, and traffic obstruction.

1. Introduction

The monitoring of traffic-induced load effects is essential to maintain the safety of the transportation infrastructure. The highway system is a significant part of the national investment, and it requires adequate maintenance. The condition of roads and bridges is important for responding to transportation and economic growth. Therefore, the knowledge of traffic volume and traffic-induced load effects has to be continuously monitored and evaluated.
Truck traffic is one of the critical factors influencing transportation safety and efficiency. It is related to a number of traffic accidents, maintenance scheduling, traffic flow interruption, risk control, and management. The number of accidents involving trucks may be two to four times larger than accidents with passenger cars. Traffic weight measurement is required for selecting the design and evaluation loads, as they are needed to design new structures and evaluate existing bridges. Knowledge of the actual live load can serve as a basis for calibration of the live load factors to assure the minimum safety reserve. Development of the live load model requires the measurement of the traffic, number and weight of vehicles, and load distribution on axles. In the infrastructure evaluation, truck assessment is essential since they cause most of the damage to pavements and bridges. The truck is a vehicle class 5 and above based on the Federal Highway Administration classification system, which includes two to seven or more axle single and multi-trailer vehicles.
The weight measurements can be conducted by static scales, where the measured vehicle has to stop to be weighed; this approach has been used to collect traffic weight data for 40 years. In 1977 in Ontario (Canada), portable scales were used to obtain data that were used in the development of the current AASHTO LRFD for bridge design. However, the static weighing methods are local and selective, and they could measure only a small fraction of the highway traffic. At present, the vehicle weight of vehicles can be obtained using weigh-in-motion measurements (WIM). WIM measurements allow for a continuous recording of vehicles passing a measurement site. The WIM systems can collect traffic volume, vehicle configuration, load distribution on axles, etc. It is a powerful tool to collect a massive traffic database. Data is recorded for every vehicle, including a detailed description of vehicle configuration, vehicle class, measurement date and time, occupied lane, direction, and moving speed, as well as individual axle weights and axle spacings.
To accurately assess the traffic-induced load effects, the data quality has to be verified. There are uncertainties involved in the measurement process that must be considered while dealing with millions of vehicle records. Several factors can affect the accuracy of the weigh-in-motion measurements, such as pavement roughness (causing bouncing axle movement or dynamic impact), temperature effects, multiple presence, incorrect vehicle position, etc. Assessment of live load effect plays a key role in designing and evaluating roads and bridges to assure the safety of the infrastructure. Therefore, it is important to adequately assess the load effects to make sure they are not underestimated or overestimated. The underestimation can cause premature damage to bridges and roads, and overestimation can result in a significant cost increase.
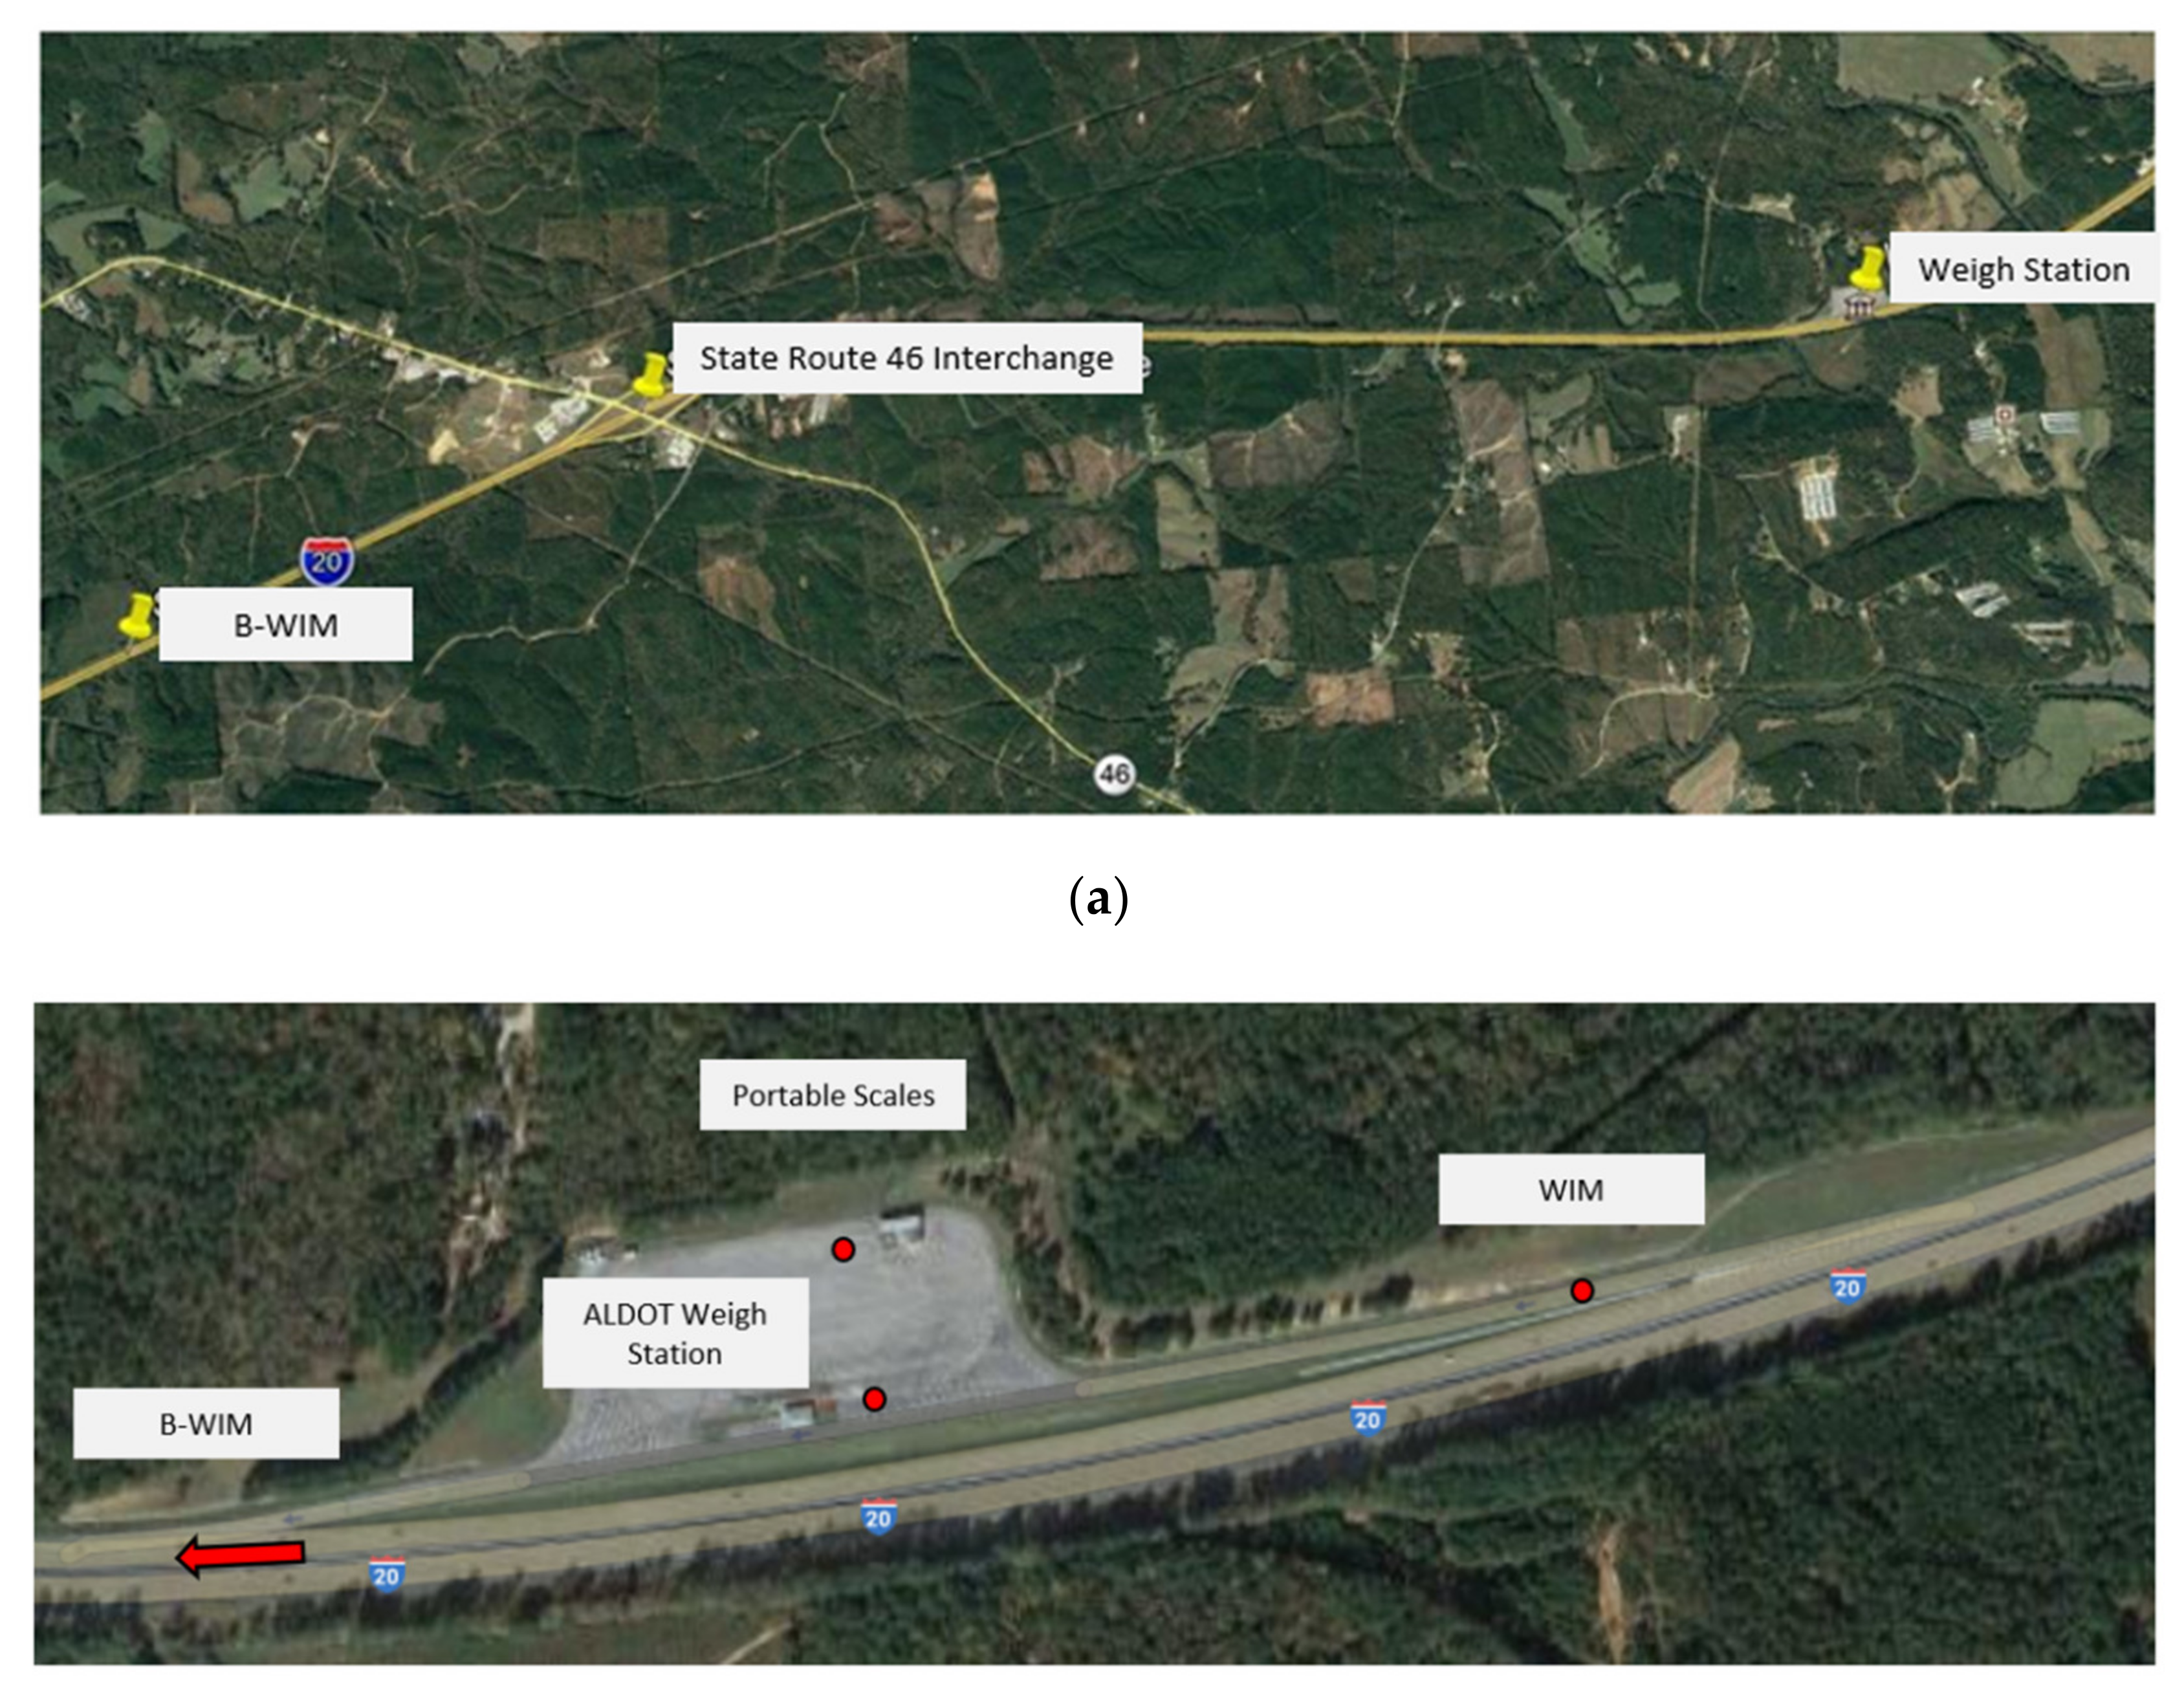
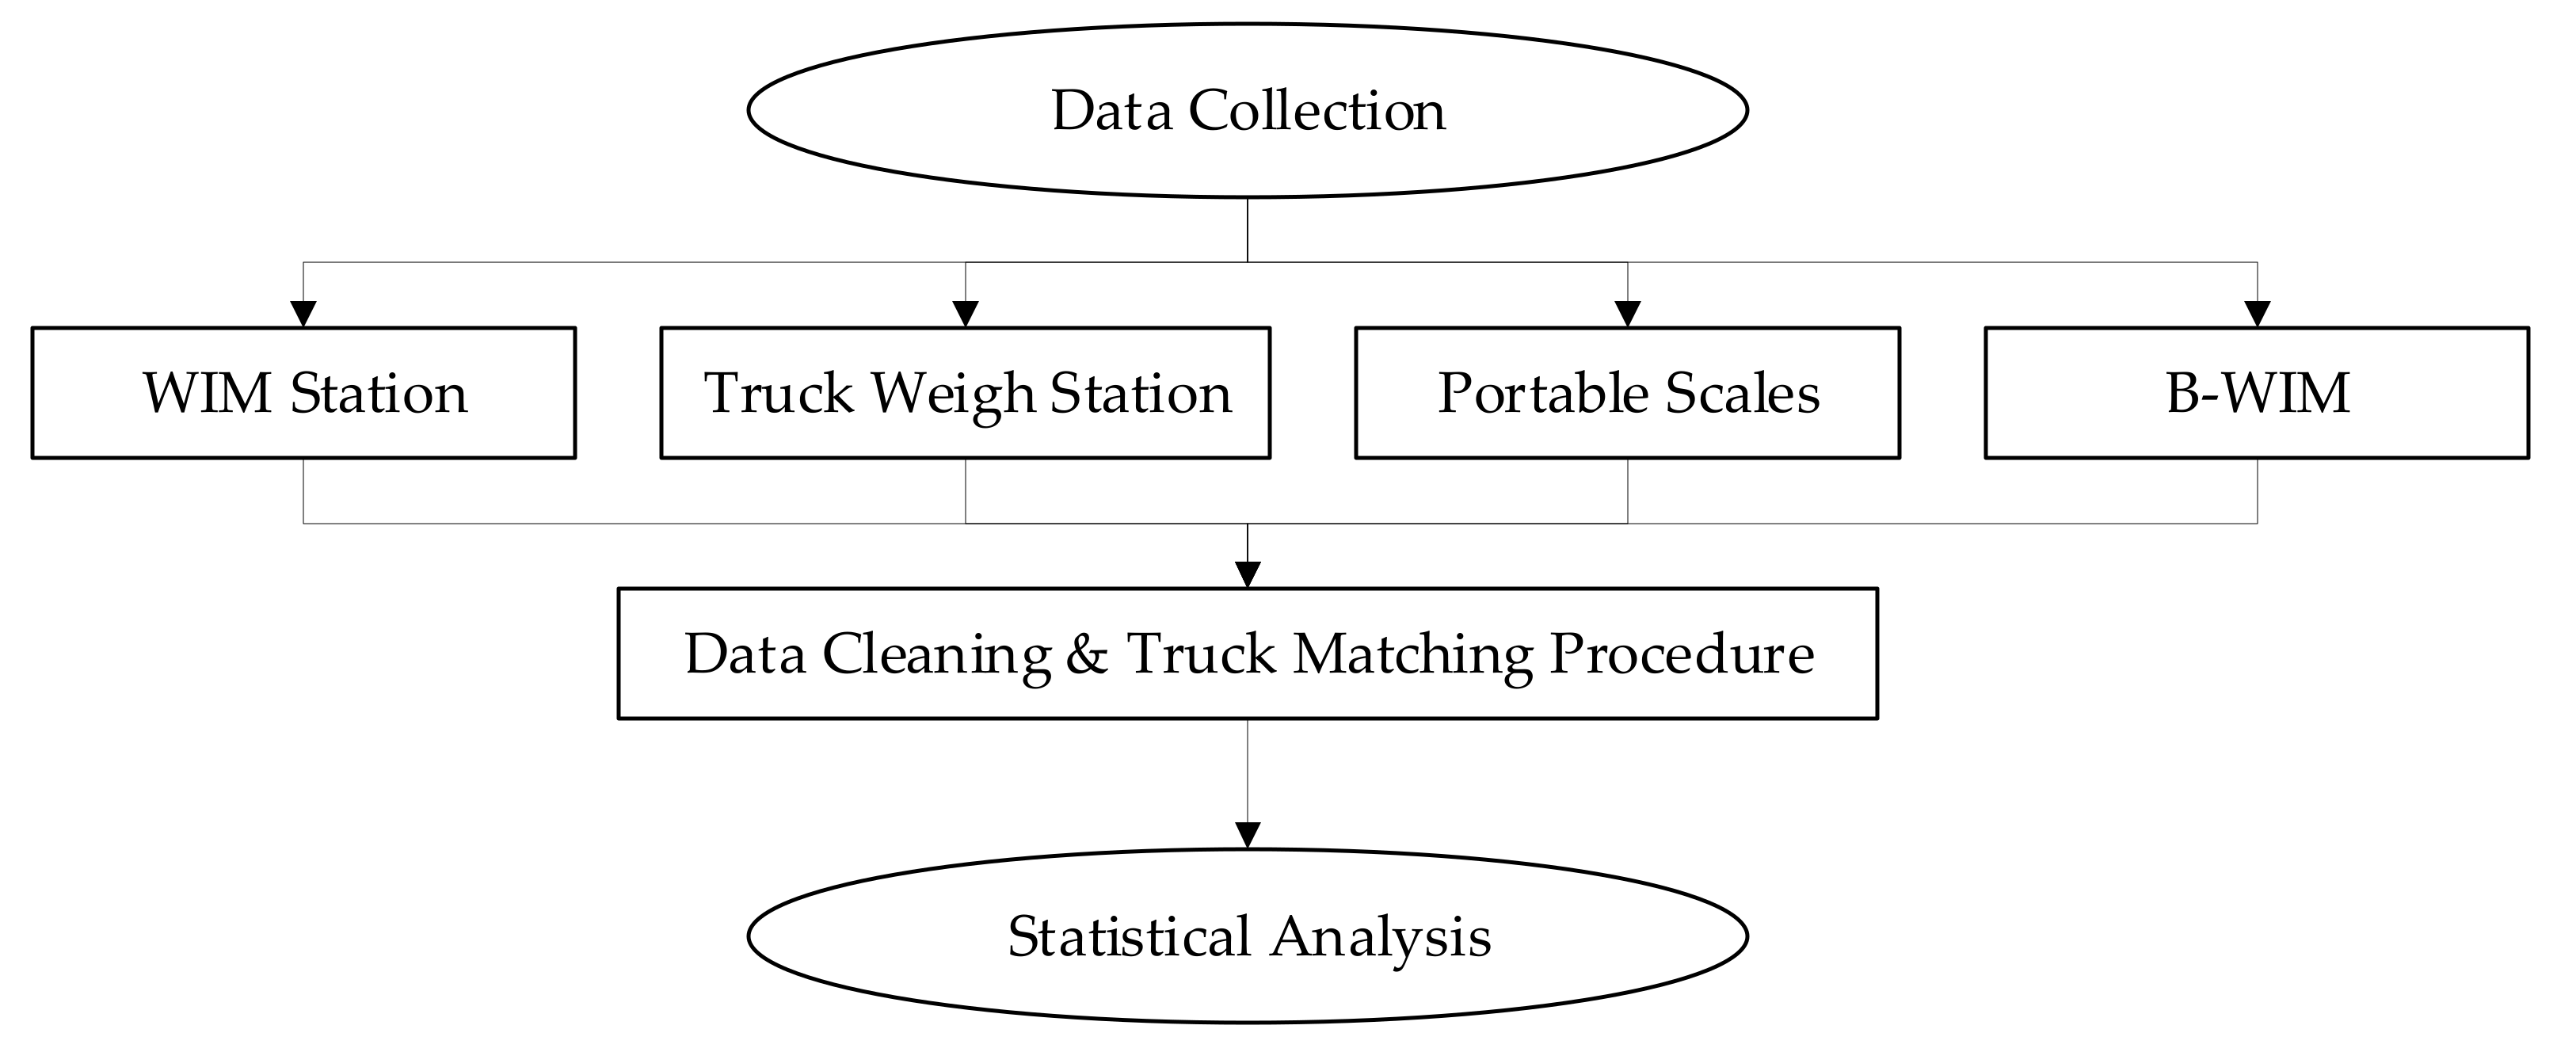
In this study, weight measurement accuracy was considered for four weighing systems: portable scales, truck weigh station, WIM, and bridge-WIM (B-WIM). The objective of this study was to assess the accuracy of the static and dynamic weighing systems. About 150 trucks were measured using static and dynamic weighing systems, and the results were compared to assess the accuracy. This study’s focus was on a comparison of the accuracy of the in-motion measurement and static scales.
Static scales can measure only non-moving vehicles or vehicles moving at a very low speed. Static scales are considered an accurate weighing method and are used as a reference point while testing and calibrating other weighing systems. The portable scale weighing method is reliable, but the process is time-consuming. Each axle weight has to be measured separately, one after another. It requires an operator (typically a qualified police officer) and a driver to move the truck after measuring each axle. The measured truck has to be parked on a flat surface (no slope) and can be an obstruction to the traffic. The portable scale can be moved from place to place because it is easy to setup.
Trucks can also be measured at truck weigh stations. Each weigh station consists of built-in static scales that can weigh standing or very slowly moving vehicles. Truck weigh stations are built off the road, typically on major highways. All the trucks must exit the road and go through the scales monitored by the police operator. However, truck weigh stations often do not capture the heaviest traffic. As the location of these stations is known, so the drivers of illegally overloaded vehicles can take alternative routes.
In pavement-WIM stations are another measurement system. The WIM sites measure vehicle attributes in motion, and data is recorded continuously. In this case, sensors are built-in the pavement, and they take measurements of axle or wheel weights, axle spacings, etc. The WIM stations have been collecting data for over 20 years resulting in millions of records for each station. The WIM systems can collect traffic volume and a wide spectrum of load parameters; each record collected by the WIM system includes the date, time, occupied lane and movement direction, and the vehicle data (vehicle class, number of axles, axle weights, wheel loads, axle spacings).
The weigh-in-motion technologies are available for permanent or temporary traffic data collection classified in the US by ASTM E1318-09 [1] as WIM from Type I to Type IV, depending on the performance requirements of the WIM system. These systems were designed for long-term traffic monitoring. According to ASTM, the calibrations of weighing systems are performed using test trucks. The WIM systems can be classified as low speed (LS-WIM) or high speed (HS-WIM). LS-WIM systems are more accurate than the HS-WIM, but they require measurements with the vehicle speed only up to 15 km/h, which is not feasible on highways. The LS-WIM systems are equipped with strip and bar sensors, scales, and plates, embedded in a pavement structure.
The WIM scales can be divided into the following groups: load cell scales, bending plates, capacitive mats, and hydraulic plates [2]. Several types of WIM sensors vary by function (weighing sensors or axle detecting sensors), accuracy, durability, width (plate or strip), price, and requirements for pavement surface. There are three types of piezoelectric WIM sensors: piezoceramic, piezopolymer, and piezoquartz. The first two types are temperature-dependent and mostly used for vehicle count and classification. Piezoquartz WIM sensors are extensively used in frequent freeze-and-thaw cycle regions because of their low sensitivity to temperature variations [3]. The piezoelectric sensor function is based on the difference in voltage due to the applied force. The calibration procedure verifies the force-voltage relationship. However, this type of system is only accurate in dynamic load, while for static or slow-motion speed measurements can produce a substantial error. Load cell-based WIM systems utilize a similar mechanism as bending plates. The weight sensor is usually a strain-gauge type, which converts the applied force into a proportional electrical signal. The load cell WIM systems are commonly used in conjunction with the inductance loops to eliminate incorrect records and activate the principal system [4].
Virtual weigh-in-motion stations are an additional type of WIM. They utilize practically the same WIM scale system along with the digital cameras and software to process the visual information in real-time. This system can recognize the characters on vehicle license plates and analyze them, along with the gross vehicle weight (GVW), axle weight, and vehicle class obtained from the traditional sensors.
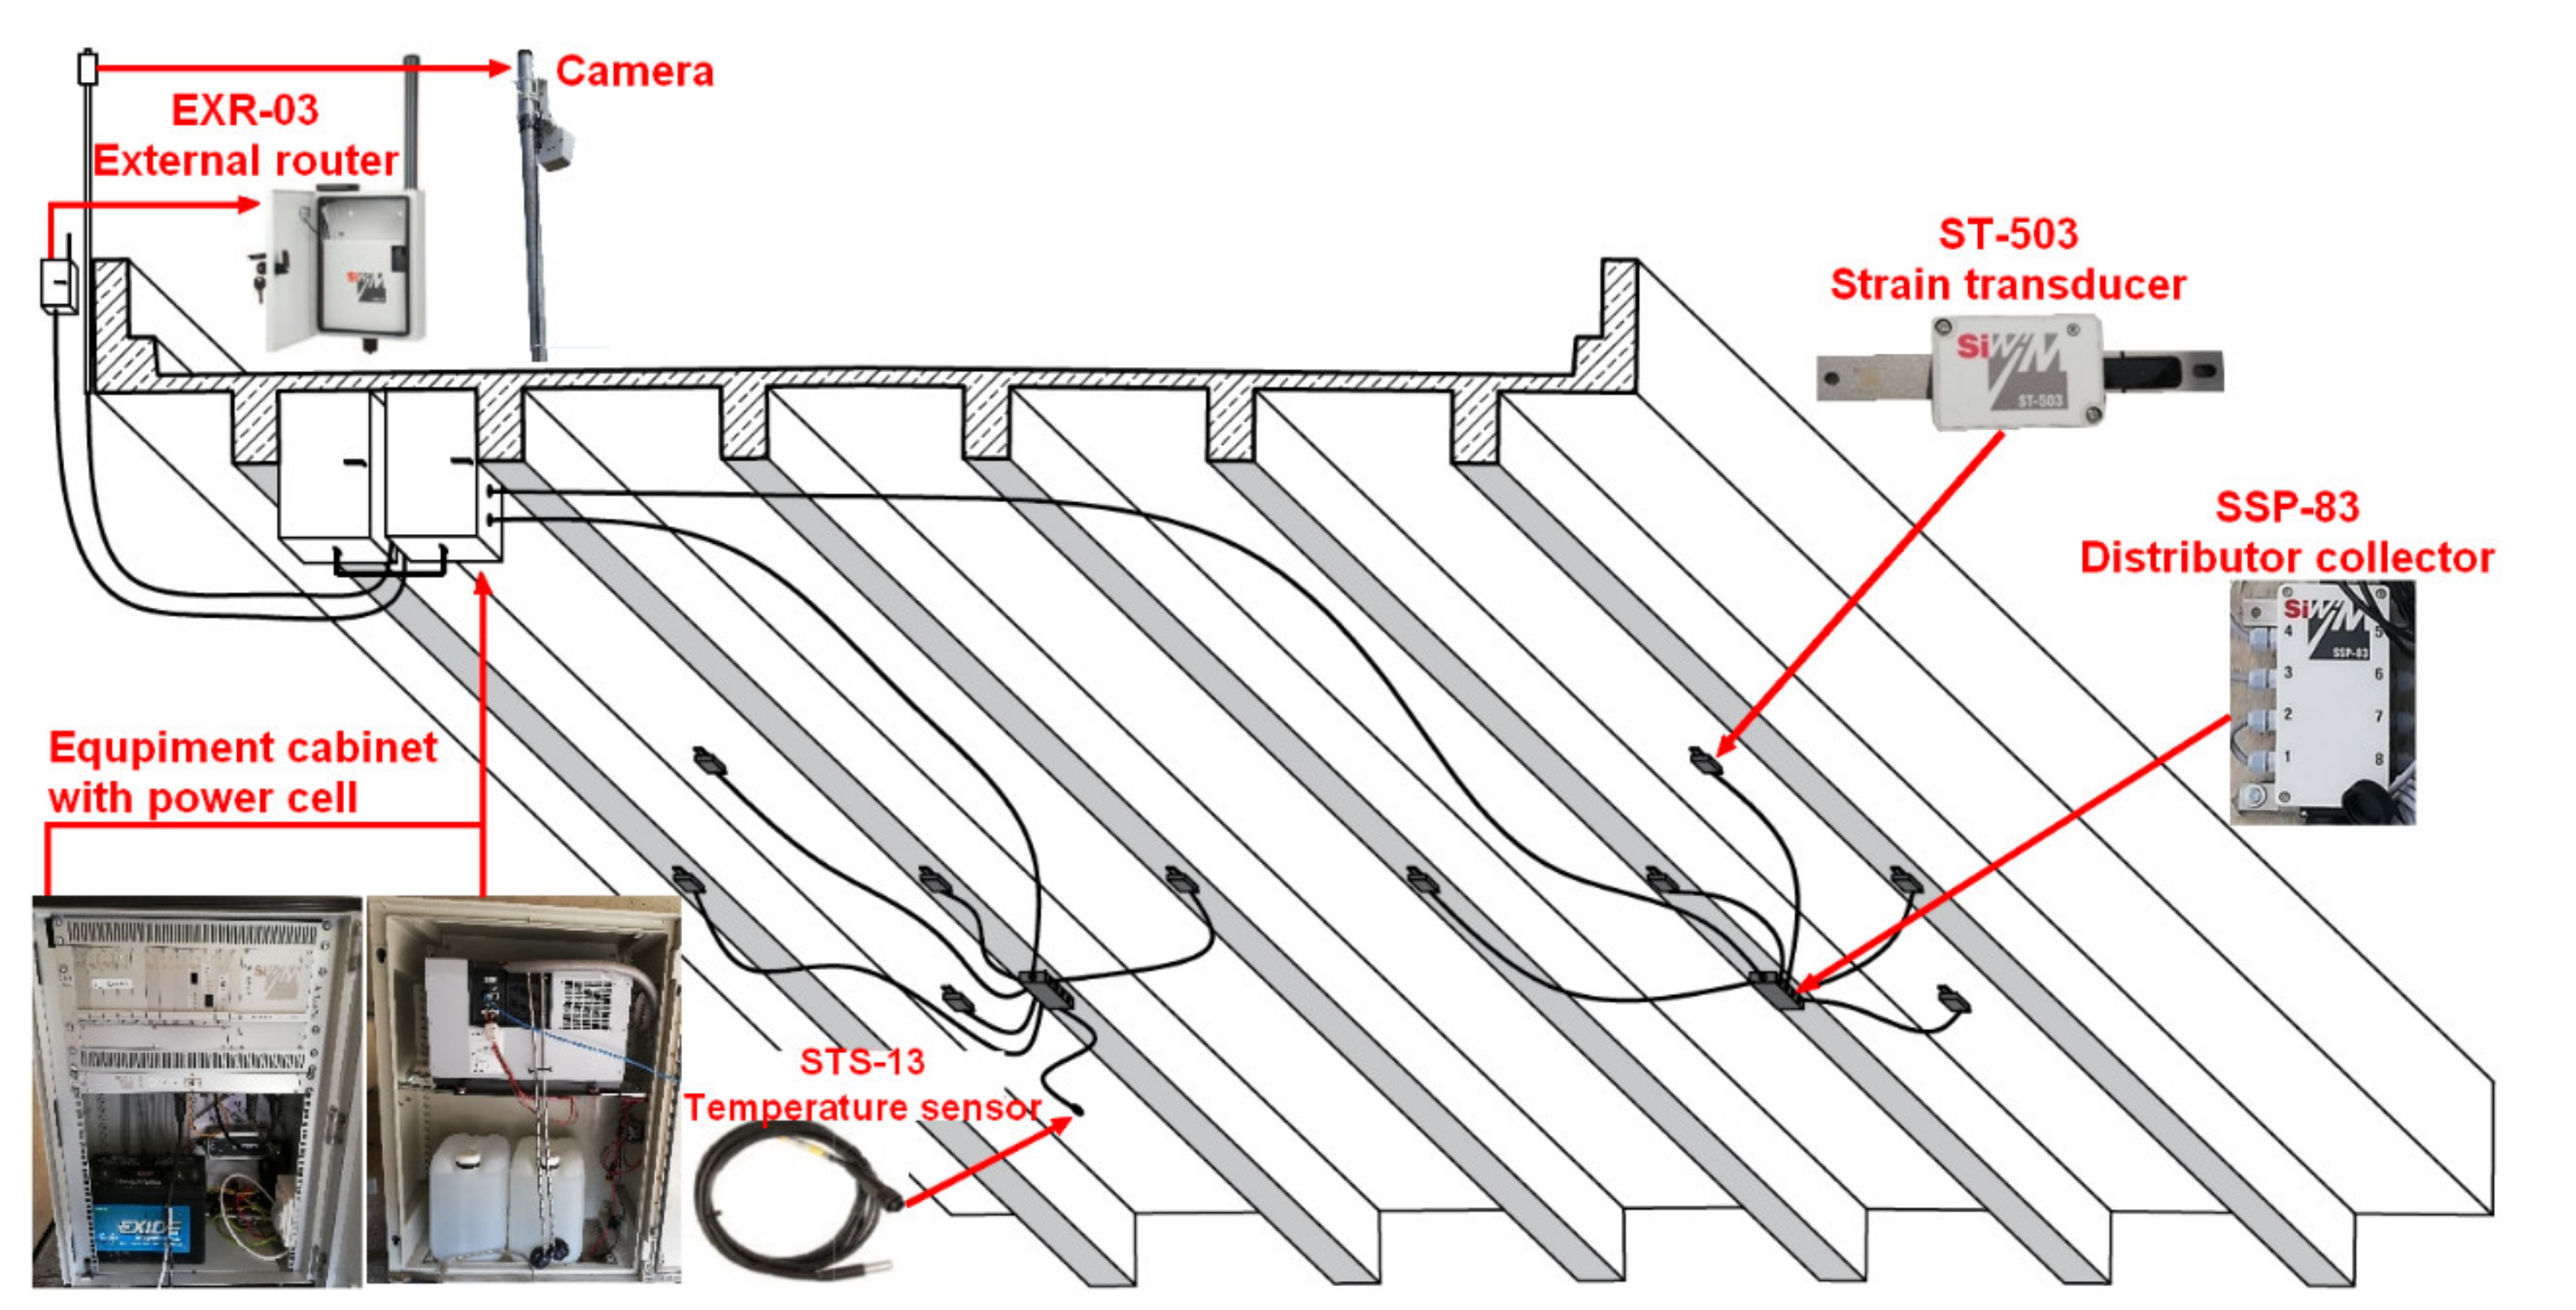
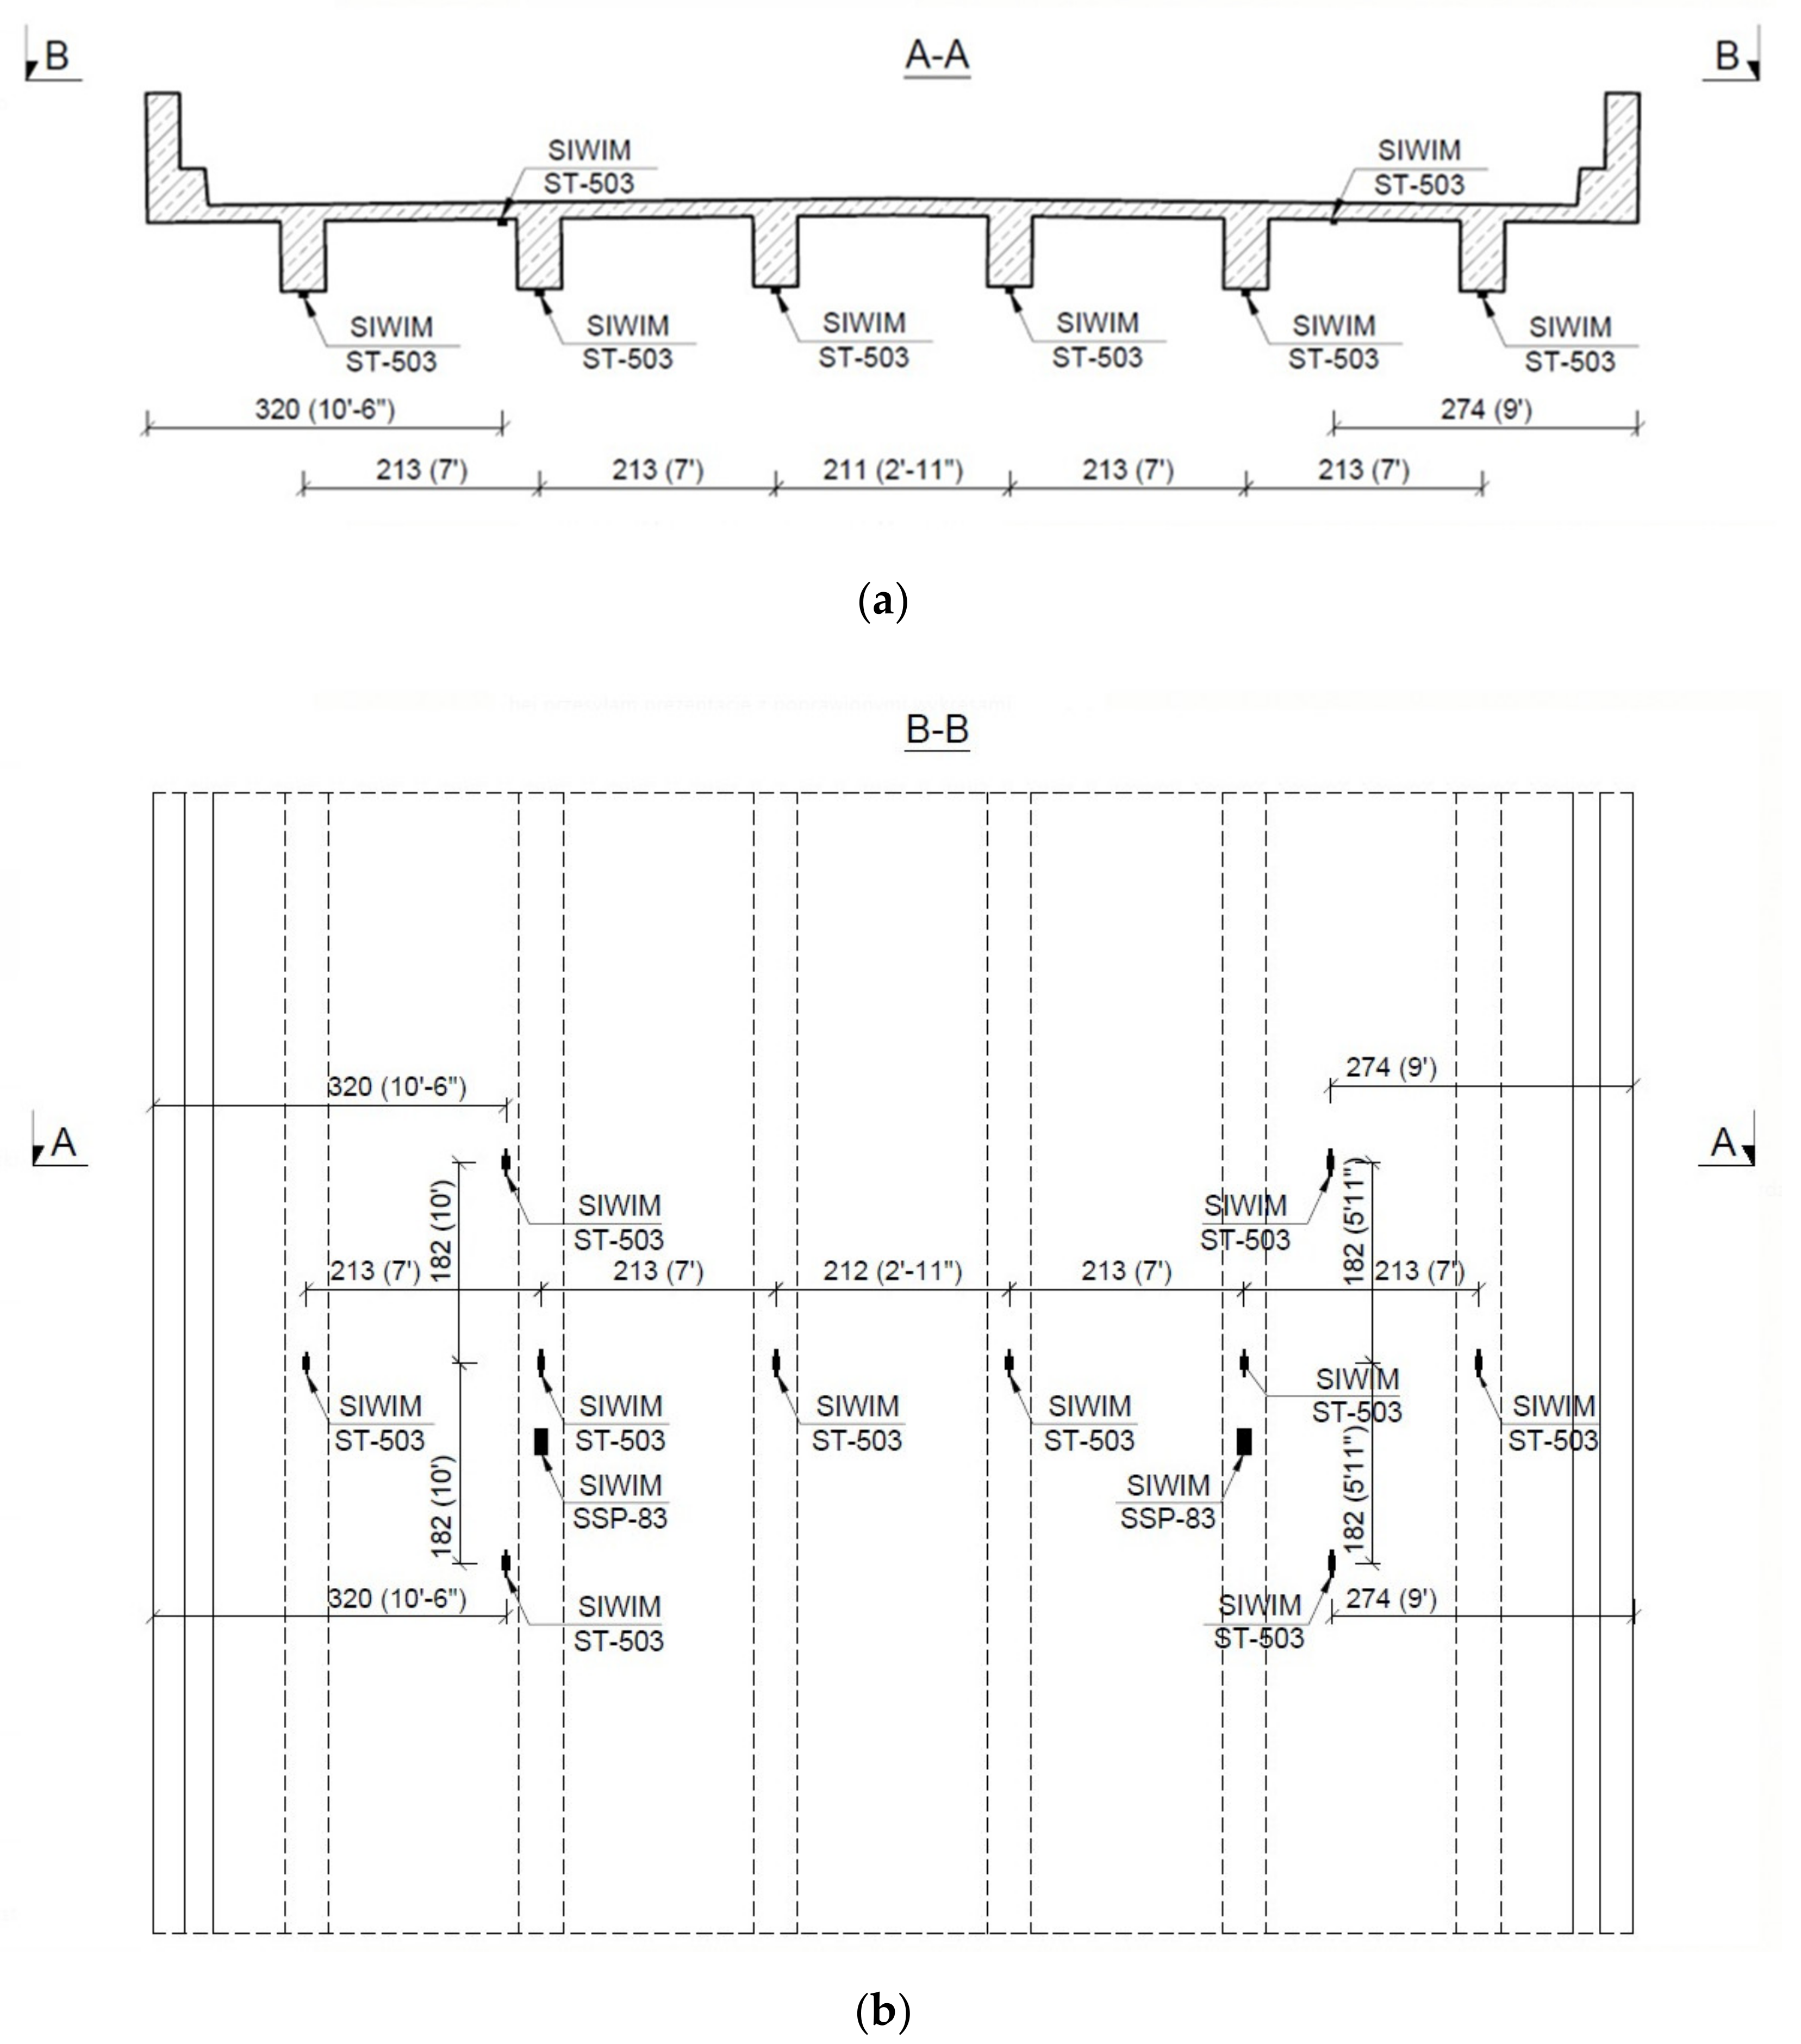
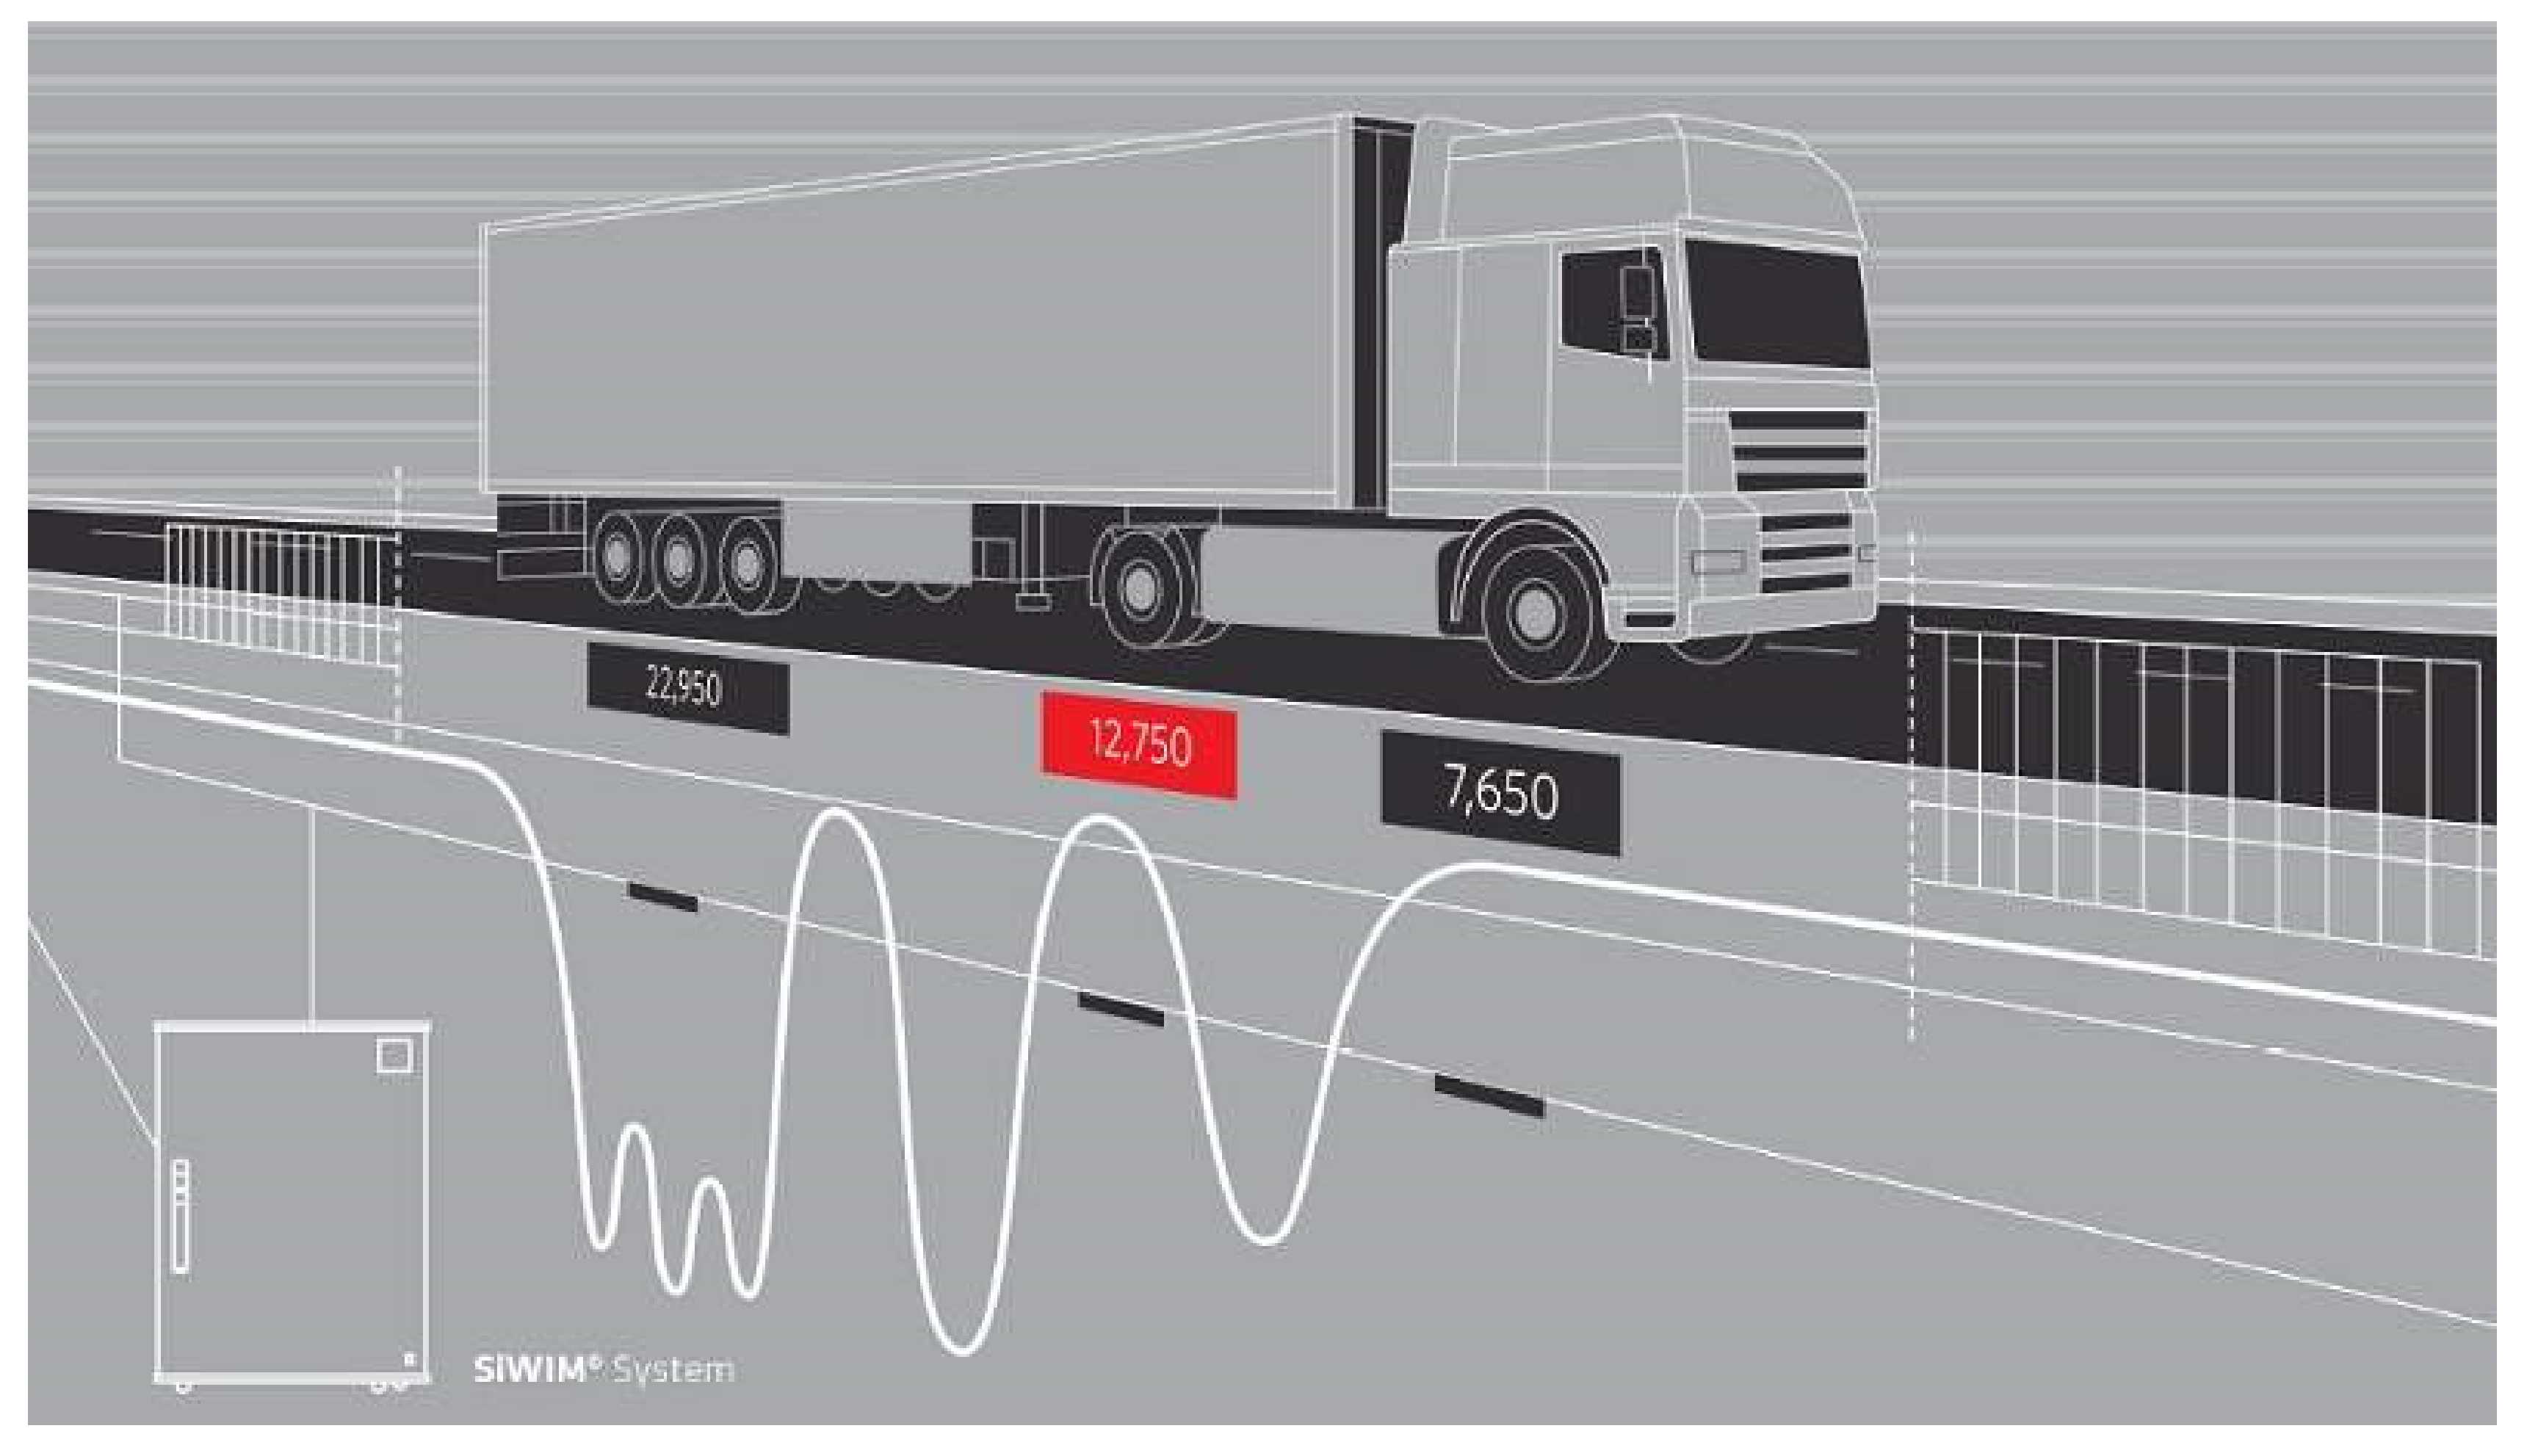
The bridge weigh-in-motion system (B-WIM) is another measurement technique based on instrumenting a bridge and treating it as a large scale that measures vehicles’ attributes. Typically, sensors measure strain in structural components, and dedicated software calculates the axle weights and axle spacings using influence lines/surfaces and calibration factors. B-WIM system is used as a weighing scale to monitor the axle weights of the vehicles passing through the bridge. The initial work relating to the B-WIM system was carried out in the US. In 1979 Moses [5] published an article with a methodology based on bridge strain history analysis to estimate vehicle axle weight. In Australia, Peters [6] developed and proposed the AXWAY system to determine vehicle axle load and GVW. In Europe, research in the field of WIM techniques started in the 1990s under the COST 323 program and later the WAVE (Weighing-in-motion of Axles and Vehicles for Europe) [7] project, which supported the B-WIM research development [8]. Those studies were used to create a commercially available B-WIM system. Nowadays, the system is widely used in Europe [1,9]. B-WIM systems are non-invasive and non-destructive techniques for traffic measurement that are based on monitoring strains in the bridge superstructure induced by vehicles passing over a structure. Measurements are usually conducted with strain gauges and strain transducers. The measured strains are converted into axle weights based on the selected algorithm [10]. The first algorithm [5] using bridge influence lines was improved and supplemented by [11]; the comparative analysis of algorithms in B-WIM is described in [12].
B-WIM systems are available in the literature [11,13,14]. The advantage of the B-WIM system is the reduction of the dynamic effects due to the fact that the bridge deck is used as a large weighing scale [2]. The accuracy of the measurement depends on the bridge deck condition and surface smoothness, which may induce excessive bridge vibration. The B-WIM installation and equipment itself do not affect the structure of the bridge. Furthermore, the B-WIM system also informs about traffic and provides a realistic response of the structure.
There are numerous WIM stations all over the world, collecting millions of records with truck data every day. Many researchers have utilized the traffic data collected by WIM systems for efficient bridge design and evaluation. The truck traffic volume, axle weights, and vehicle configurations have changed during recent decades, and systematic traffic data collection and evaluation provides a rational basis to update the design and evaluation provisions for bridges. The traffic varies from site to site, hence, the WIM data can serve as a source to modify the live load factor for site-specific traffic. AASHTO LRFD provides the protocols to update the live load factor for local traffic. The AASHTO provisions are based on a set of protocols developed by Sivakumar [15]. The truck traffic data was collected at different WIM sites around the US, and a reliability-based procedure was designed to determine the site-specific load factors. The method involves a list of requirements for WIM collection, quality, and quantity.
Traffic data can also be used to identify overloaded vehicles in order to assess their effect on infrastructure. Some studies have used WIM data to capture overloaded vehicles in the traffic flow [16]. The overloaded vehicle evaluation may be essential in bridge posting decisions, and overloaded permit vehicles crossing the bridge can significantly contribute to the damage. Hence, permit vehicles’ short-term and long-term effect was studied to assess their impact [17]. An increasing number of special permit vehicles, due to the escalated freight demand, can induce fatigue damage and reduce the bride load-carrying capacity. The development of rules that envelope the special vehicle load effects is very important to ensure infrastructure safety [18]. Understanding the impact of overloaded heavy trucks is the key to proposing rational design and management provisions [19]. Several studies have been conducted to determine the damage caused by permit vehicles to ensure the structures’ safety. The damage assessment criteria, traffic data collection, load effects computations were studied, and simulation techniques were used to optimize provisions for permit vehicles [20,21,22]. The bridge evaluation, under existing traffic, utilized the notional design, legal, and permit vehicles, hence, the WIM data can be utilized to verify standard rating vehicles’ adequacy to check the existing bridges’ live load-carrying capacity. To maintain the bridge’s safety, a live load analysis is required, therefore, several studies have used WIM data to update the live load model to site-specific traffic characteristics. Moses provided a simplified method to compute live load factors for bridge evaluation for the site-specific traffic [23]. The WIM system collects the majority of the traffic data utilized for the bridge live load development [24,25]. The live load models were then created to assess the traffic-induced effects and provide a rational basis to update the live load provisions and give optimum safety levels [26,27].
This study presents data collection and analysis for measured vehicles using portable scales, truck weigh station, WIM, and B-WIM systems. The statistical analysis of four different weighing systems were compared to assess static and dynamic systems’ accuracy.

2. Material and Methods

To verify the accuracy of vehicle weight measurements, the same vehicles needed to be measured by all tested weighing systems. Therefore, it was necessary to find a location that has in close proximity a truck weigh station and additional space to evaluate the weight by portable scales and the WIM system. The selected weigh station in Alabama is located close to the WIM system and allows collecting data for three measuring techniques. Next, the bridge had to be selected to install the B-WIM system. Figure 1 presents (a) an overview of weigh station and B-WIM locations, and more closely, (b) the weigh station, designated space for portable scales measurements, and the Alabama Department of Transportation (ALDOT) WIM system.
First, vehicles were captured by the WIM station; then heavy trucks stopped at the weigh station. The most typical 5-axle vehicles were considered and were recorded by truck weigh station and then portable scales. Alabama State Troopers conducted the measurements. Lastly, the vehicles were recorded by the B-WIM system. The vehicles measured by weigh station and portable scales were selected from WIM and B-WIM databases. The matching procedure was based on time envelope, plate number, and USDOT number of the vehicles since B-WIM and WIM are equipped with cameras, which take pictures of every vehicle passing the WIM site.

B-WIM Instrumentation

The B-WIM measurement technique relies on using the space under a bridge to install measuring devices to not interfere with the flow of traffic measurements. It requires the installation of necessary instruments. The bridge’s selection was based on its proximity to the Cleburne truck weigh station and a WIM station. The bridge located at kilometer 327.242 of interstate highway I-20 in Cleburne County, Alabama, was selected. The exact location of the bridge is 33°38′12.5′′ N 85°31′46.8′′ W. The bridge was built in 1970, and it consists of 11 spans, eight of them are reinforced concrete, and the remaining three are steel girders. The total width of the bridge is 13.28 m, and its total length is 132.6 m. Figure 2 presents the side view of the instrumented bridge.
The utilized measurement system was a portable bridge weigh-in-motion (B-WIM), of which more information about it can be found in [28]. The B-WIM was installed and calibrated on the bridge, and the scheme of the B-WIM installation is shown in Figure 3. The B-WIM is measuring set consisted of the following elements: ten strain transducers ST-503, one temperature sensor STS-13, two distributor collectors (spiders) SSP-83, one external router EXR-03, one camera, one equipment cabinet with an SPU-23 processor unit equipped with SAM-43 amplifiers, CTU-03 control unit, GCP-33, and SPS-23 power supply, 12 V battery with charger, and one power cell cabinet with an ethanol power generator. The sensors were installed in a tension zone of the slab and beams. The strain transducers ST-503 were equipped with four strain gauges. The deformation from the extensometer was transformed into an electrical signal and sent through the distributor manifold SSP-83 to the SAM-43 amplifiers. The amplifiers were installed in the SPU-23 processing unit. The signals were continuously recorded during the measuring period of three days, and the signal offsets occurred due to the extreme amplification of signal and temperature effects. If offset exceeded predefined thresholds, the signal was nulled. A STS-13 temperature sensor was used during measurements. The weight of a passing vehicle was calculated based on recorded deformations adjusted for the thermal material deformations; the calibration was necessary to set the specific material parameters and arrange a sensor suitable for a particular bridge structure. The layout was adjusted for two lanes and selected girders (Figure 4a,b).
The ST-503 sensors located under the girders measured the weight of individual vehicle axles, while the sensors situated directly beneath the deck measured the number of axles and vehicle speed. A simplified measurement scheme is shown in Figure 5. The strain transducers were bolted into steel anchors on the bottom surface of selected elements. Six sensors were attached to all beams and four directly to the bottom side of all beams (6 sensors).
The whole measurement process was fully automated and worked almost maintenance-free. Thanks to the use of batteries and power generators, it could also operate in areas where it is not possible to connect it to a stationary electrical supply. The power generator was automatically started when the battery power decreased below the defined minimum level to recharge it. As a result, the service consisted almost exclusively of periodic refueling, every 20 days, for the power cell, which in this case ran on ethanol. For remote transmission and access to a collected data, the measuring set was also equipped with an external router EXR-03. It enabled data transfer and constant control over the system. Based on the collected vehicle data, there was a possibility to analyze cross-sectional forces acting on selected elements of the bridge. However, the assessment of these options was not part of this study.
The three days of measurements were performed on 6, 16, and 18 March 2020. Approximately 50 trucks were measured per day, and in total, the sample data was nearly 150 vehicles. All measured vehicles were class 9 vehicles, with 5-axles, and typically with a steering axle and two tandem axles (two neighboring axles with spacing between them not exceeding 6 ft.). From the ALDOT WIM data analysis, it was concluded that over 43% of all collected data were class 9 vehicles, and it was decided to perform the analysis for the most typical trucks in Alabama traffic. The ALDOT WIM data was continuously recorded, and the decrypted WIM data was transferred for all three days of measurement.
The static measurements were conducted by the State Troopers, and the data was given in a printed version, including vehicle parameters, time stamps, and plate number. The collected traffic data by static scales were as follows: 6 March—42 trucks, 16 March—48 trucks, and 18 March—50 trucks. The weigh station measured the steering axle and two tandems, but the portable scales weighted every axle separately. The weigh-in-motion data was then analyzed to find the measured vehicles by the number of axles, the time stamp, plate number, and US DOT number. All the statically measured vehicles were captured in the WIM database. Afterward, the B-WIM system was analyzed to find the measured vehicles. To capture the vehicles, the vehicle class, a number of axles, timestamp estimation, the distance, and the speed limit were considered to match those vehicles. The B-WIM was located further from other truck weigh station, with exit 205 to route 46 located between them. Thus, some of the vehicles were able to exit I-20. Therefore, a few of them were not found in the B-WIM system—they did not pass the weighting system in the predicted time window or, the truck was not recognized while passing with another similar vehicle. Figure 6 presents the traffic data collection flowchart. The data analysis captured 34 trucks on 6 March, 46 trucks on 16 March, and 49 trucks on 18 March. An overall number of considered vehicles measured by portable scales is 140, truck weigh station—139, WIM—136, and 127 by B-WIM system. The matching vehicles were taken into consideration in the accuracy analysis.
All four measuring techniques captured different vehicle parameters. The following vehicle attributes were considered during the analysis: GVW, axle weight, and tandem axle weight. Figure 7 shows the symbols of attributes used in this study. The attributes available for considered weighing systems are summarized in Table 1.
The measurement accuracy was assessed by comparing the results of measurements by static and dynamic weighing systems. The analysis of measurement accuracy involved the following:
  • statistical analysis of the considered parameters,
  • multiple t-tests for paired means,
  • vehicle attributes tolerances, according to ASTM E1318-09 2009 (Table 2, WIM Type I),
  • correlation coefficient calculations.

3. Results

The collected vehicle measurements from static and dynamic scales were compared to determine the weighing systems’ accuracy. The statistical analysis was conducted to find evidence to claim if there was a difference in considered weighing methods. The vehicle attributes such as GVW, single, and tandem axle weight were verified.
The analysis compares measured vehicles’ mean and standard deviation to determine the measurement techniques’ divergences. The multiple t-tests for paired means were conducted to determine the mean difference between the truck weigh station and other measurement techniques, that is, the certified portable scales and the rest of the considered weighing systems. The mean difference for a 95% confidence interval was checked; according to ASTM 1318E-09 requirements [29]. This is the primary US standard used for weigh-in-motion performance requirements. The 95% compliance of measurements is needed to be within specified tolerances. The t-test analysis was to check if there was a difference in the measured weight by considered measurements for GVW, axle, and tandem axle weights.
Additionally, the measurement tolerances established by [29] were verified for vehicle attributes. Table 2 summarizes the ASTM E1318 requirements for WIM systems. There are four WIM types Type I–Type IV. The Type I and Type II were used for regular data collection, where Type I has more rigorous tolerances in comparison to Type II. Type III is used to collect data about overloaded vehicles. Type IV is not yet approved in the US. In this analysis, WIM Type I’s tolerance requirements are used to validate the accuracy of analyzed weighing systems.
Table 2. Summary table of WIM system requirements as per ASTM E1318 [29].
FunctionTolerance for 95% Compliance of Conformity
(All Percentage Is Shown ±) A
Type IType IIType IIIType IV
Value lb (kg) B±lb (kg)
Wheel Load25%-20%5000 (2300)300 (100)
Axle Weight20%30%15%12,000 (5400)500 (200)
Axle-Group Load15%20%10%25,000
(11,300)
1200
(500)
Gross Vehicle Weight10%15%6%60,000 (27,200)2500 (1100)
Speed±1 mph (2 km/h)
Axle-Spacing and Wheelbase±0.5 ft (0.15 m)
A 95 % of the respective data items produced by the WIM system must be within the tolerance. B Lower values are not usually a concern in enforcement.
Moreover, the linear correlation between vehicle attributes measured by the considered weighing system is examined using the correlation coefficient. The statistical analysis is used to determine if there is enough evidence to prove a difference between considered measuring systems.

3.1. Statistical Parameters

For all four measuring techniques and available vehicle attributes, the sample’s mean and standard deviation are summarized in Table 3, Table 4 and Table 5. GVW was the first considered vehicle attribute. The mean values and standard deviations (SD) of GVW values measured by each technique are presented in Table 3.
The axle weight was the next considered vehicle attribute. The statistical parameters of each measured axle weight are presented in Table 4.
Tandem axles were verified for considered weighing systems. Statistical parameters of tandem axles 2 + 3 (the second and the third axle) and 4 + 5 (the fourth and the fifth axle) are shown in Table 5.

3.2. Multiple t-Tests for Paired Means

The multiple t-tests for paired means were chosen to compare the measurements from considered four weighing systems. Different scales measured the same vehicles, so the mean values could be considered as paired. The summary of the results is presented in Table 6. The mean difference was computed for the certified portable scales and compared to the weigh station, WIM, and B-WIM systems. The weigh station was also used as a reference point in t-test analysis and compared to portable scales, WIM, and B-WIM. The mean difference was used to calculate the standard error and then the t-value. The t-valued were computed for all cases and compared with the tcrit (1.98) value, using a 95% confidence interval. The t-test was conducted to verify if there is evidence to claim the difference between the static and dynamic measurements for a 95% confidence interval, without considering the measurement tolerances.

3.3. Measurement Tolerances

Measurement tolerances established by the American Society of Testing and Materials ASTM 1318E-09 for WIM systems were used to determine if the measured vehicle attributes meet the ASTM requirements. The comparison with WIM Type I requirements was considered in this study. Type I allows ±10% tolerance for GVW measurements, ± 20% for individual axle weight, and ±15% for a group of axles. The tolerances were verified to check if more than 95% of the results meet ASTM 1318E-09 requirements for WIM Type I listed in Table 2.

3.3.1. Gross Vehicle Weight

All four weighing systems measured Gross Vehicle Weight. Figure 8a shows the results of GVW measurements recorded by the certified portable scales and compared to the other measurement techniques: weigh station, WIM, and B-WIM, and Figure 8b, where the GVW results are compared to truck weigh station. As was expected, the tolerance for GVW measurements for more than 95% results was in the range ±10%.

3.3.2. Axle Weight

The portable scales’ axle weight measurements were compared with B-WIM and WIM measurements. The weight station did not measure the weight of individual axles. The tolerances for individual axle weight for more than 95% results were expected to be in the range ±20%. The spatial restriction and visual comparison were not presented, but all the results are described in the discussion section.

3.3.3. Tandem Axle Weight

All systems measured tandem axle weight. The results of tandem axle weight measurements were compared to portable scales and weigh station measurements. The tandem axle weight tolerance was classified as a group of axles, so for more than 95% results, the obtained results should be in the range ±15%. Figure 9 presents the first tandem axle weight measurements: (a) compared to portable scales, (b) compared to weigh station. It can be noticed that the comparison to the weigh station shows more variability, and more records were outside of the tolerance range. The summary of the results is thoroughly described in the discussion.

3.4. Correlation Coefficient

The linear correlation between vehicle attributes was examined using the correlation coefficient. A strong correlation was defined by the coefficient between 0.68–1.00, a modest and moderate correlation was between 0.36–0.67, and a low and weak correlation <0.35. Table 7 presents the summary of the correlation coefficients calculated for the portable scales compared with B-WIM, weigh station, and WIM. The weigh station’s correlation coefficient was also calculated and compared to B-WIM, portable scales, and WIM measurements. The results are shown in subsequent columns for GVW, axle weight, and tandem axle weight.

4. Discussion

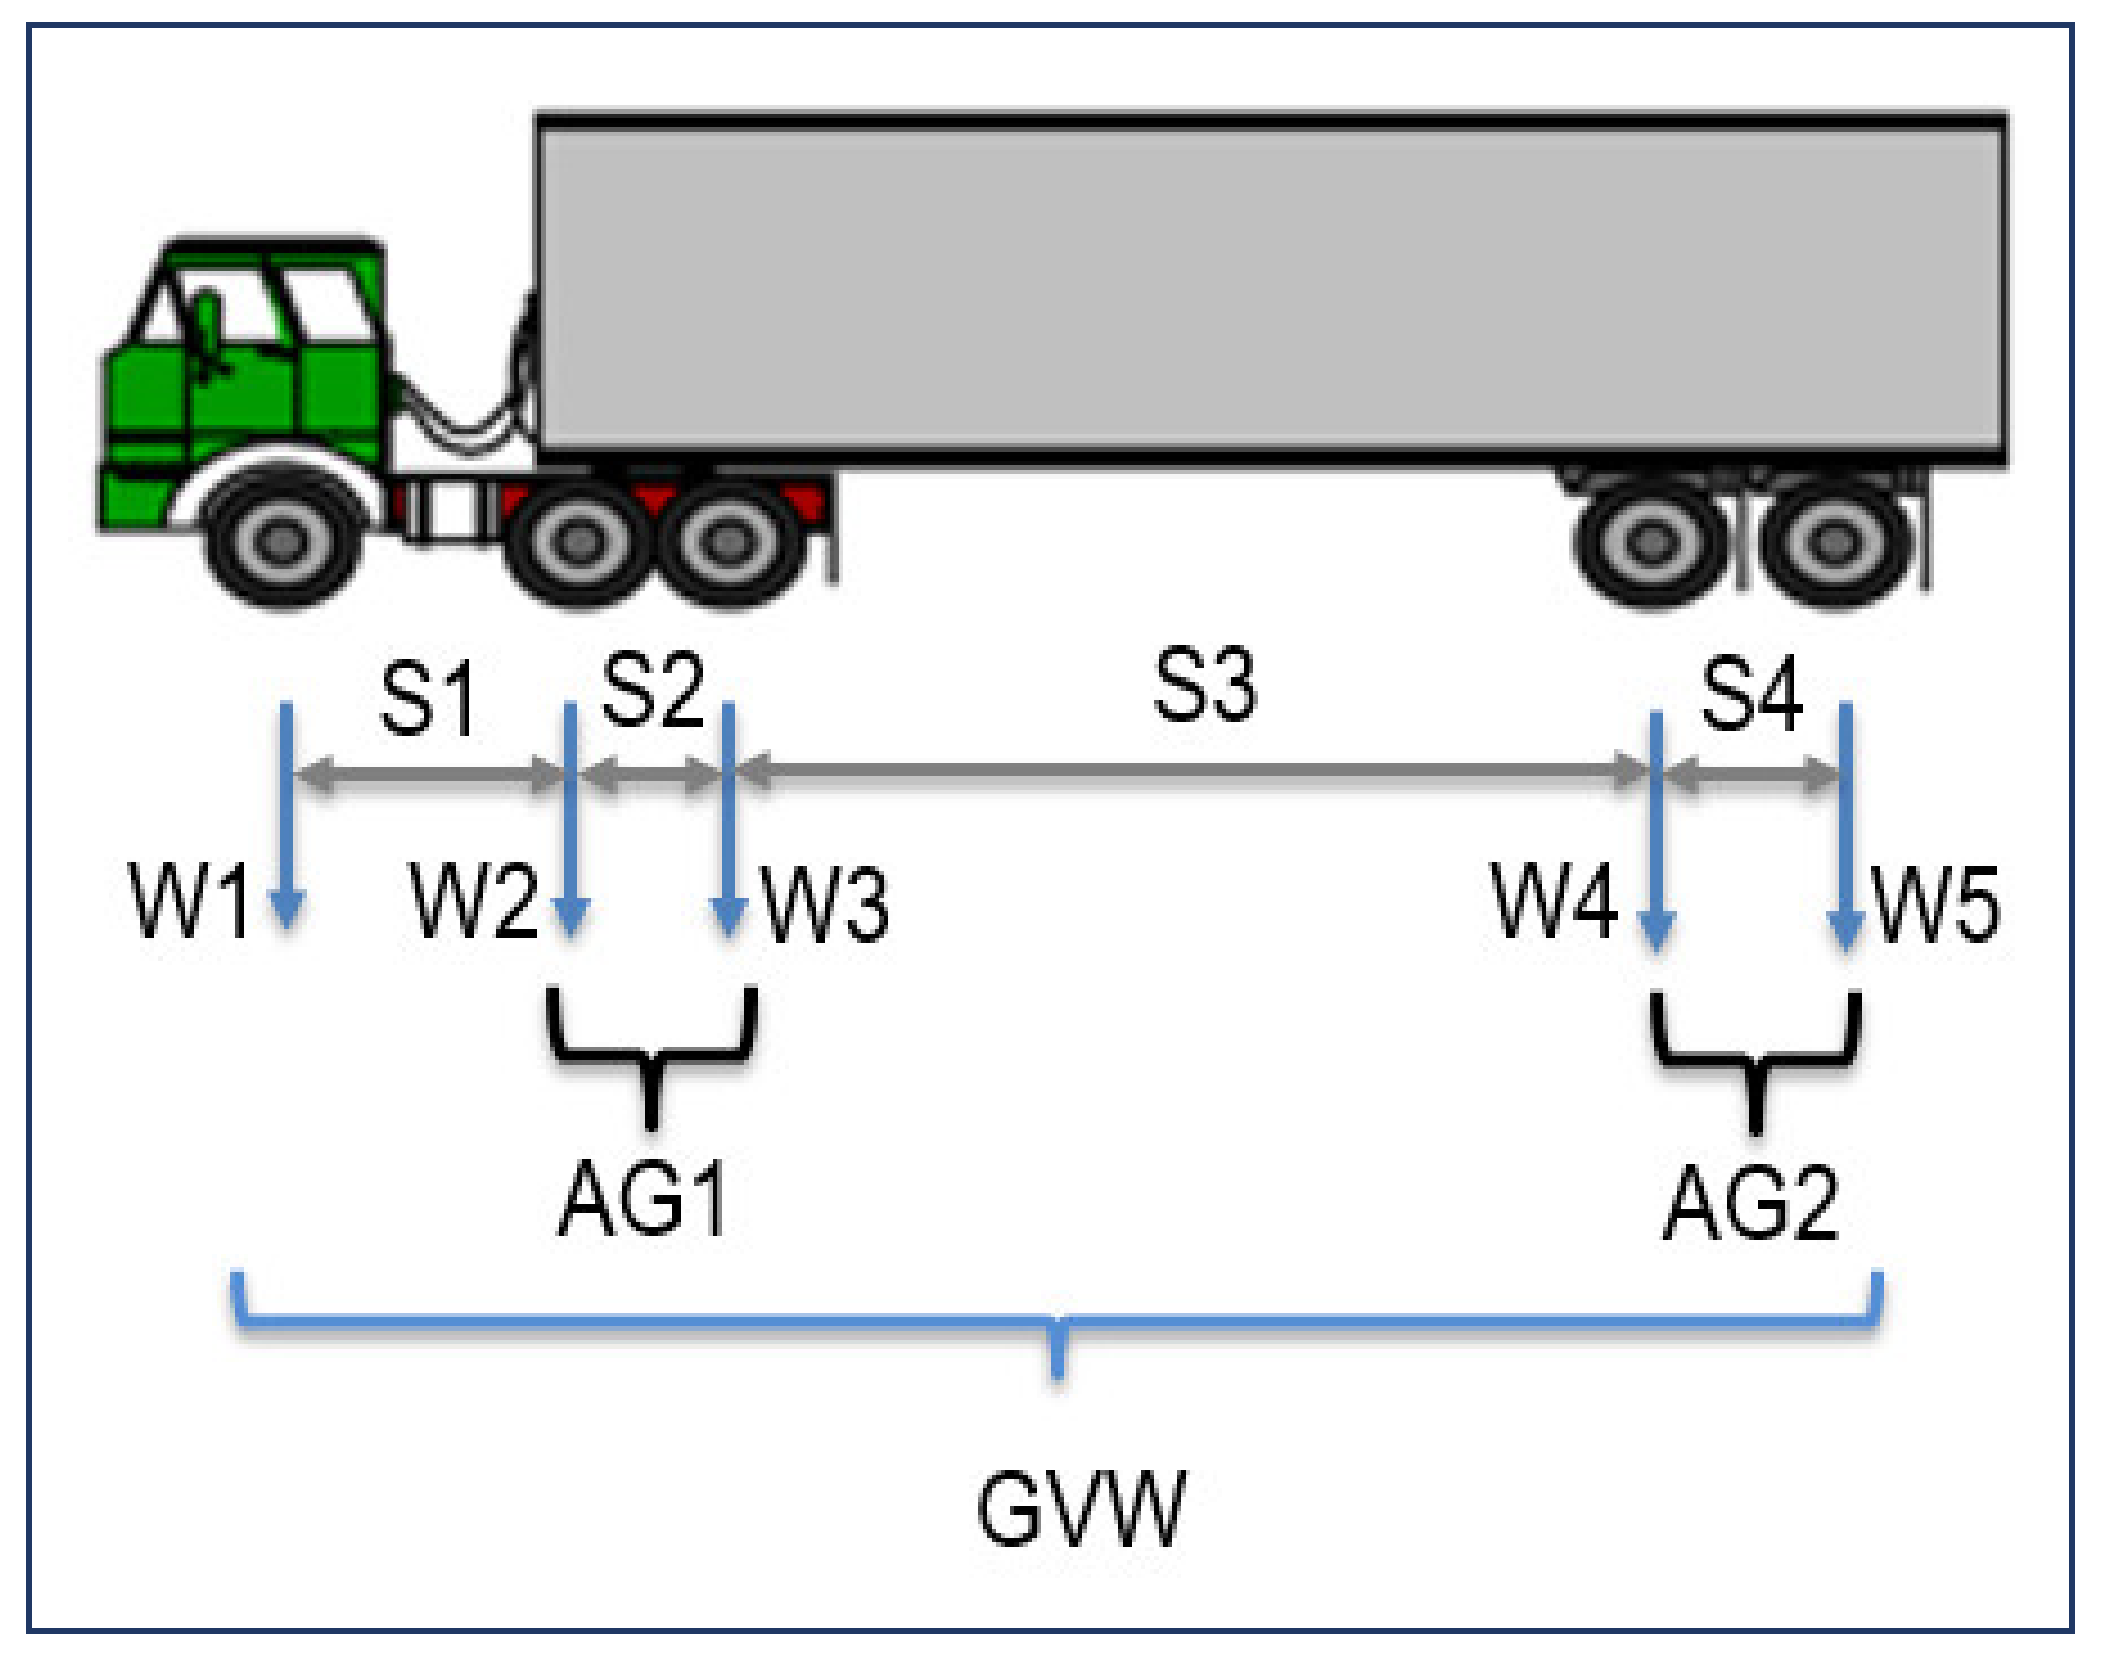
The statistical parameters, such as mean and standard deviation, were calculated for all four weighing systems. For GVW, the minimum difference between the mean values of GVW recorded by portable scales and B-WIM system was 0.8 kips, and the standard deviation of the results was 5.6 kips for portable scales and 6.5 for B-WIM system. In contrast, the highest difference between the mean values of GVW was observed for WIM, with the highest standard deviation of 8.8 kips. For the axle weight measurements, the largest difference between the mean and standard deviation values was observed for the WIM measurement data set. It can be noticed that in the case of axles one to three loads, the difference in statistical parameters was relatively low. The most significant difference was for axle four and five. The average axle 1–3 loads were almost the same (around 16 kips), but in the case of axle four and five loads, the values of standard deviation are over 2.0 kips. Tandem axle weight analysis showed that in comparison to the certificated portable scales, the lowest difference between the mean and standard deviation values was observed in the case of the static scale’s measurements data, the set for both the first tandem (axle 2 and 3) and the second one (axle 4 and 5). B-WIM measurement results mean that standard deviation values were slightly lower than the portable scales, but the statistical parameters’ difference is relatively low. However, the most significant differences were noticed in WIM measurements. The standard deviation value was almost three times higher, and then the value of the standard deviation was obtained by the portable scale measuring technique. It means that the results of measurements varied much more.
The multiple t-tests for paired means were conducted to check whether there was enough evidence to claim a difference in vehicle weight attributes for a 95% confidence interval. The mean difference and standard deviation of difference were computed. Table 8 summarizes the results of the mean and standard deviation of difference, compared to portable scales and weigh station measurements. Based on the comparison to portable scales measurements, it could be noticed that the mean difference was the smallest for weigh station measurements. The mean difference for GVW, AG1, AG2 was larger for WIM measurements than B-WIM. On the other hand, in comparison to weigh station measurements, it can be concluded that the mean difference was the smallest for portable scales but the largest for WIM measurements. Only, the first axle weight (W1) is larger for B-WIM measurements in comparison to the weigh station. The next step was to calculate the standard error for the compared measurements and find the t-value. Table 6 showed the calculated t-values for compared weighing systems. It can be concluded that t_stat was greater than t_crit. Therefore, the null hypothesis can be rejected, which means that with 95% confidence, there was enough evidence to claim there was a difference in the static and dynamic measurements. In the t-test analysis, the measurement tolerances were not taken into account.
Since the 
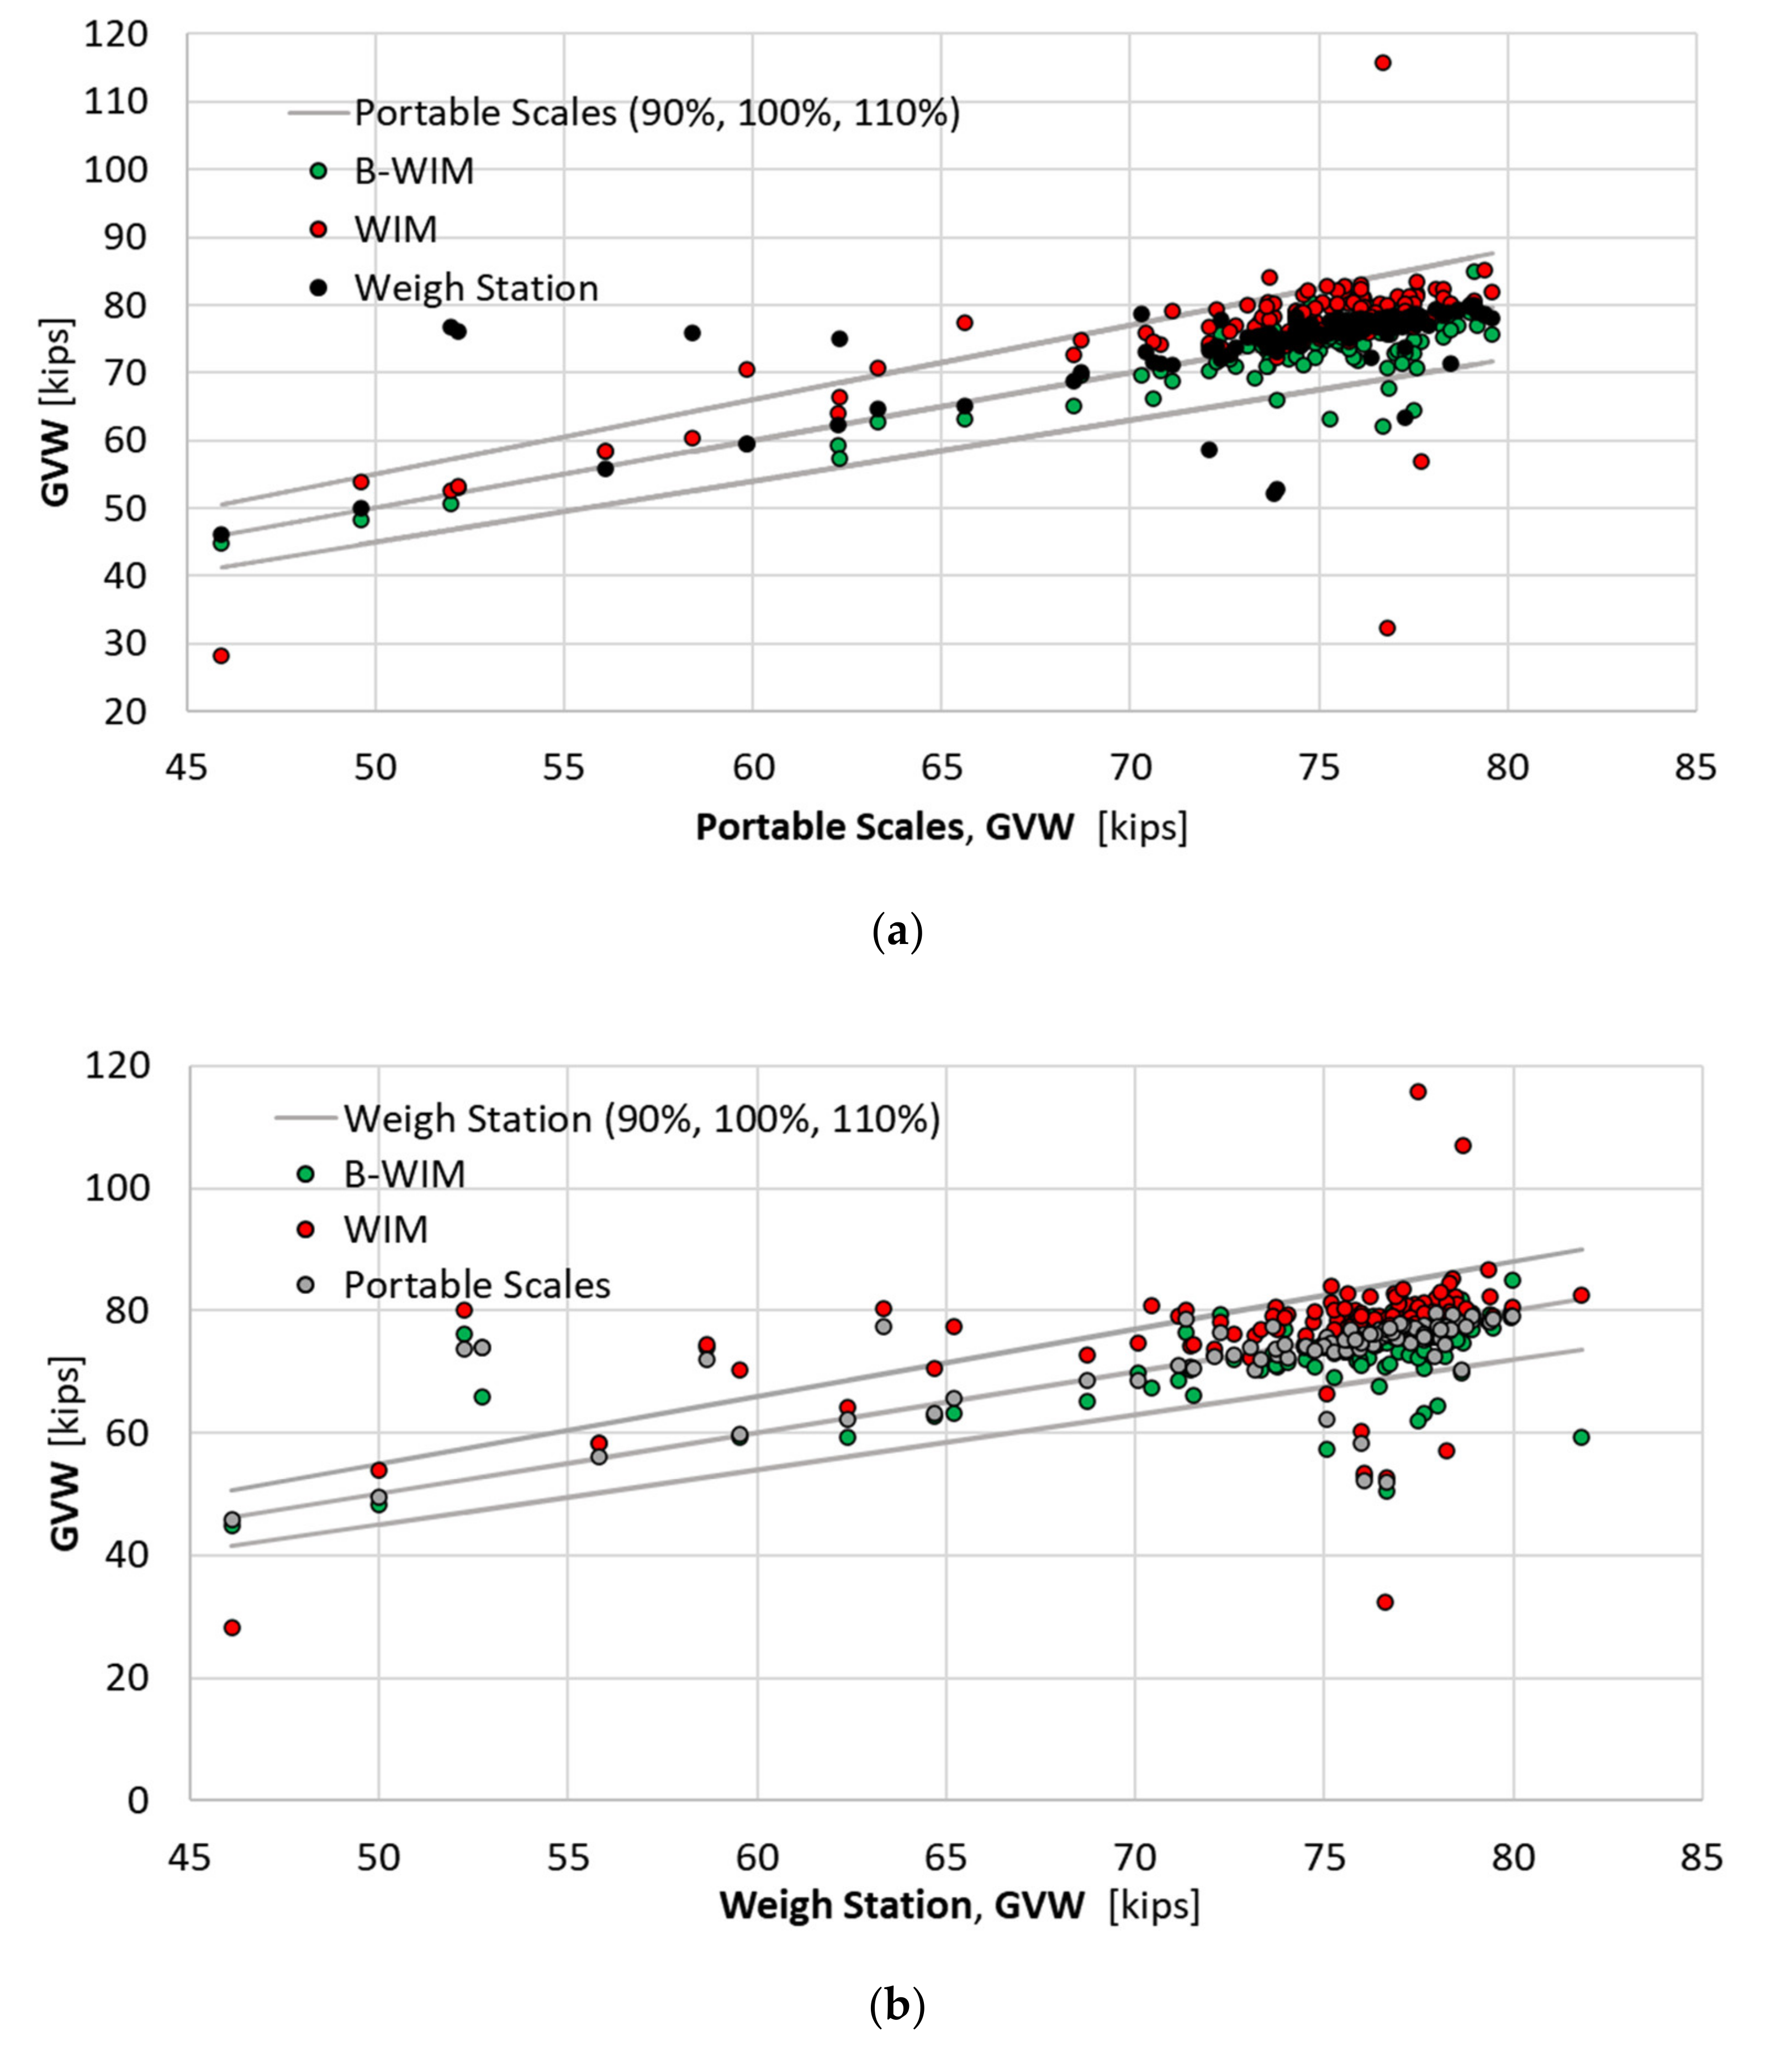
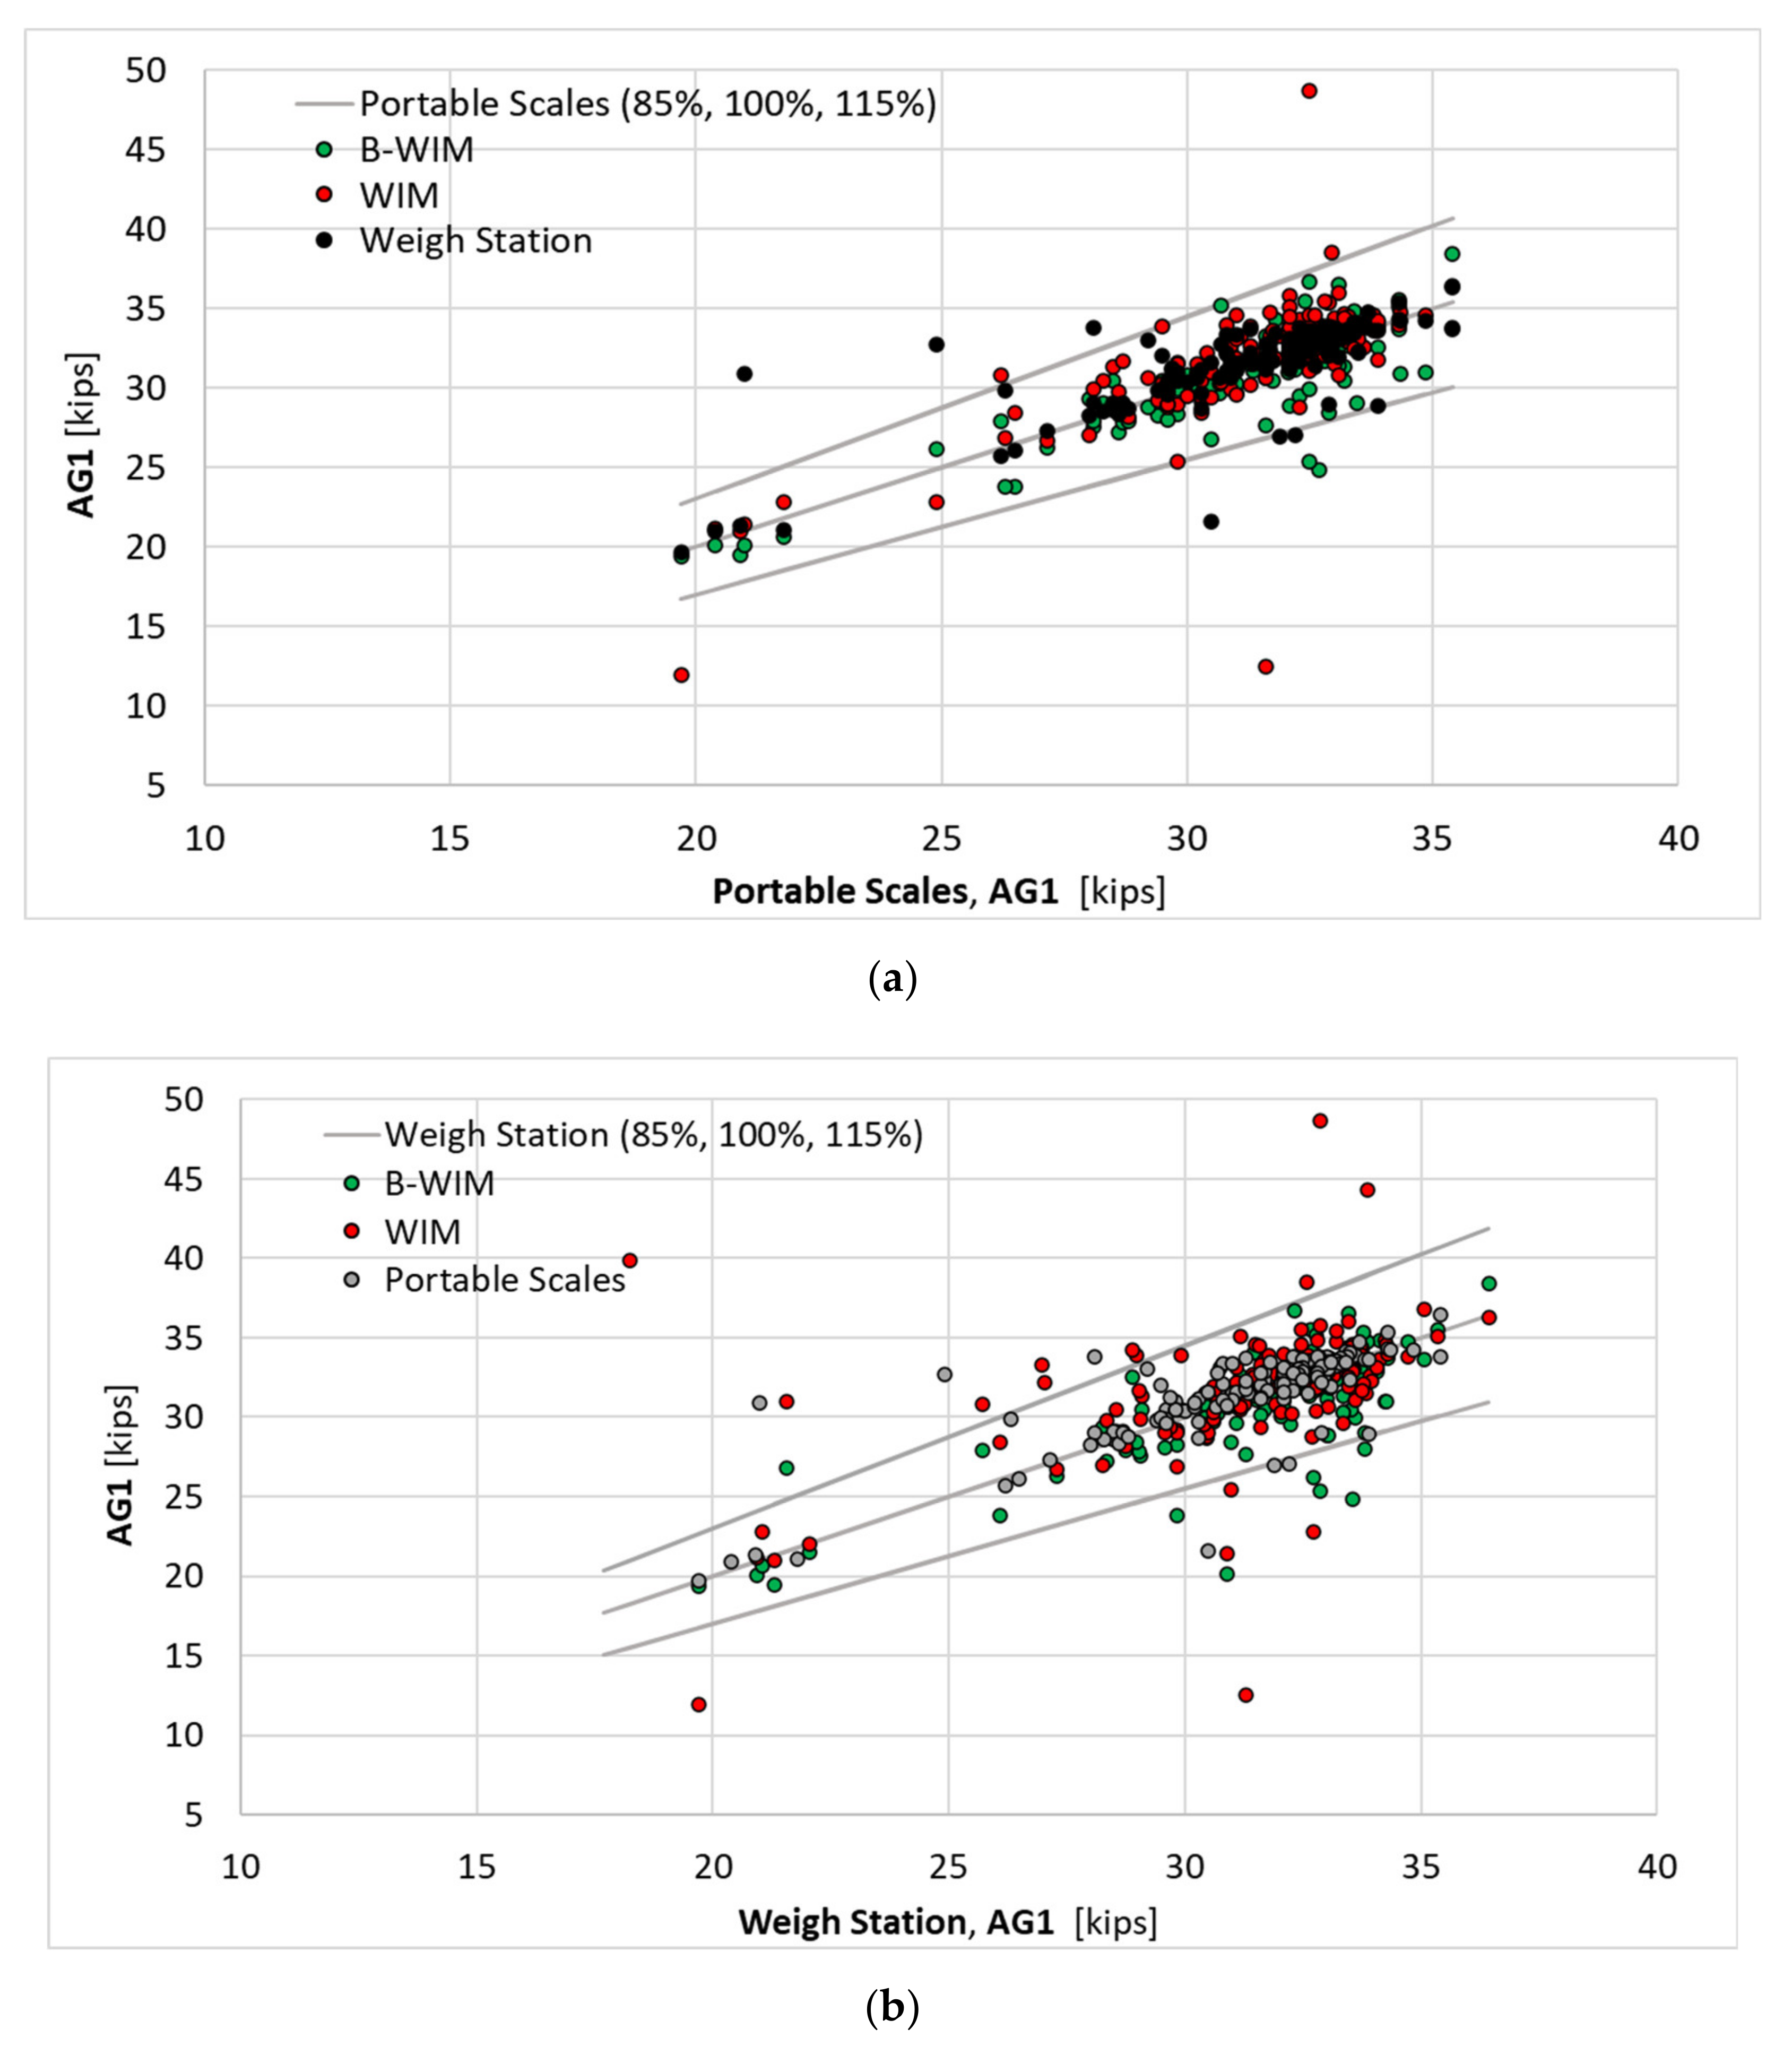
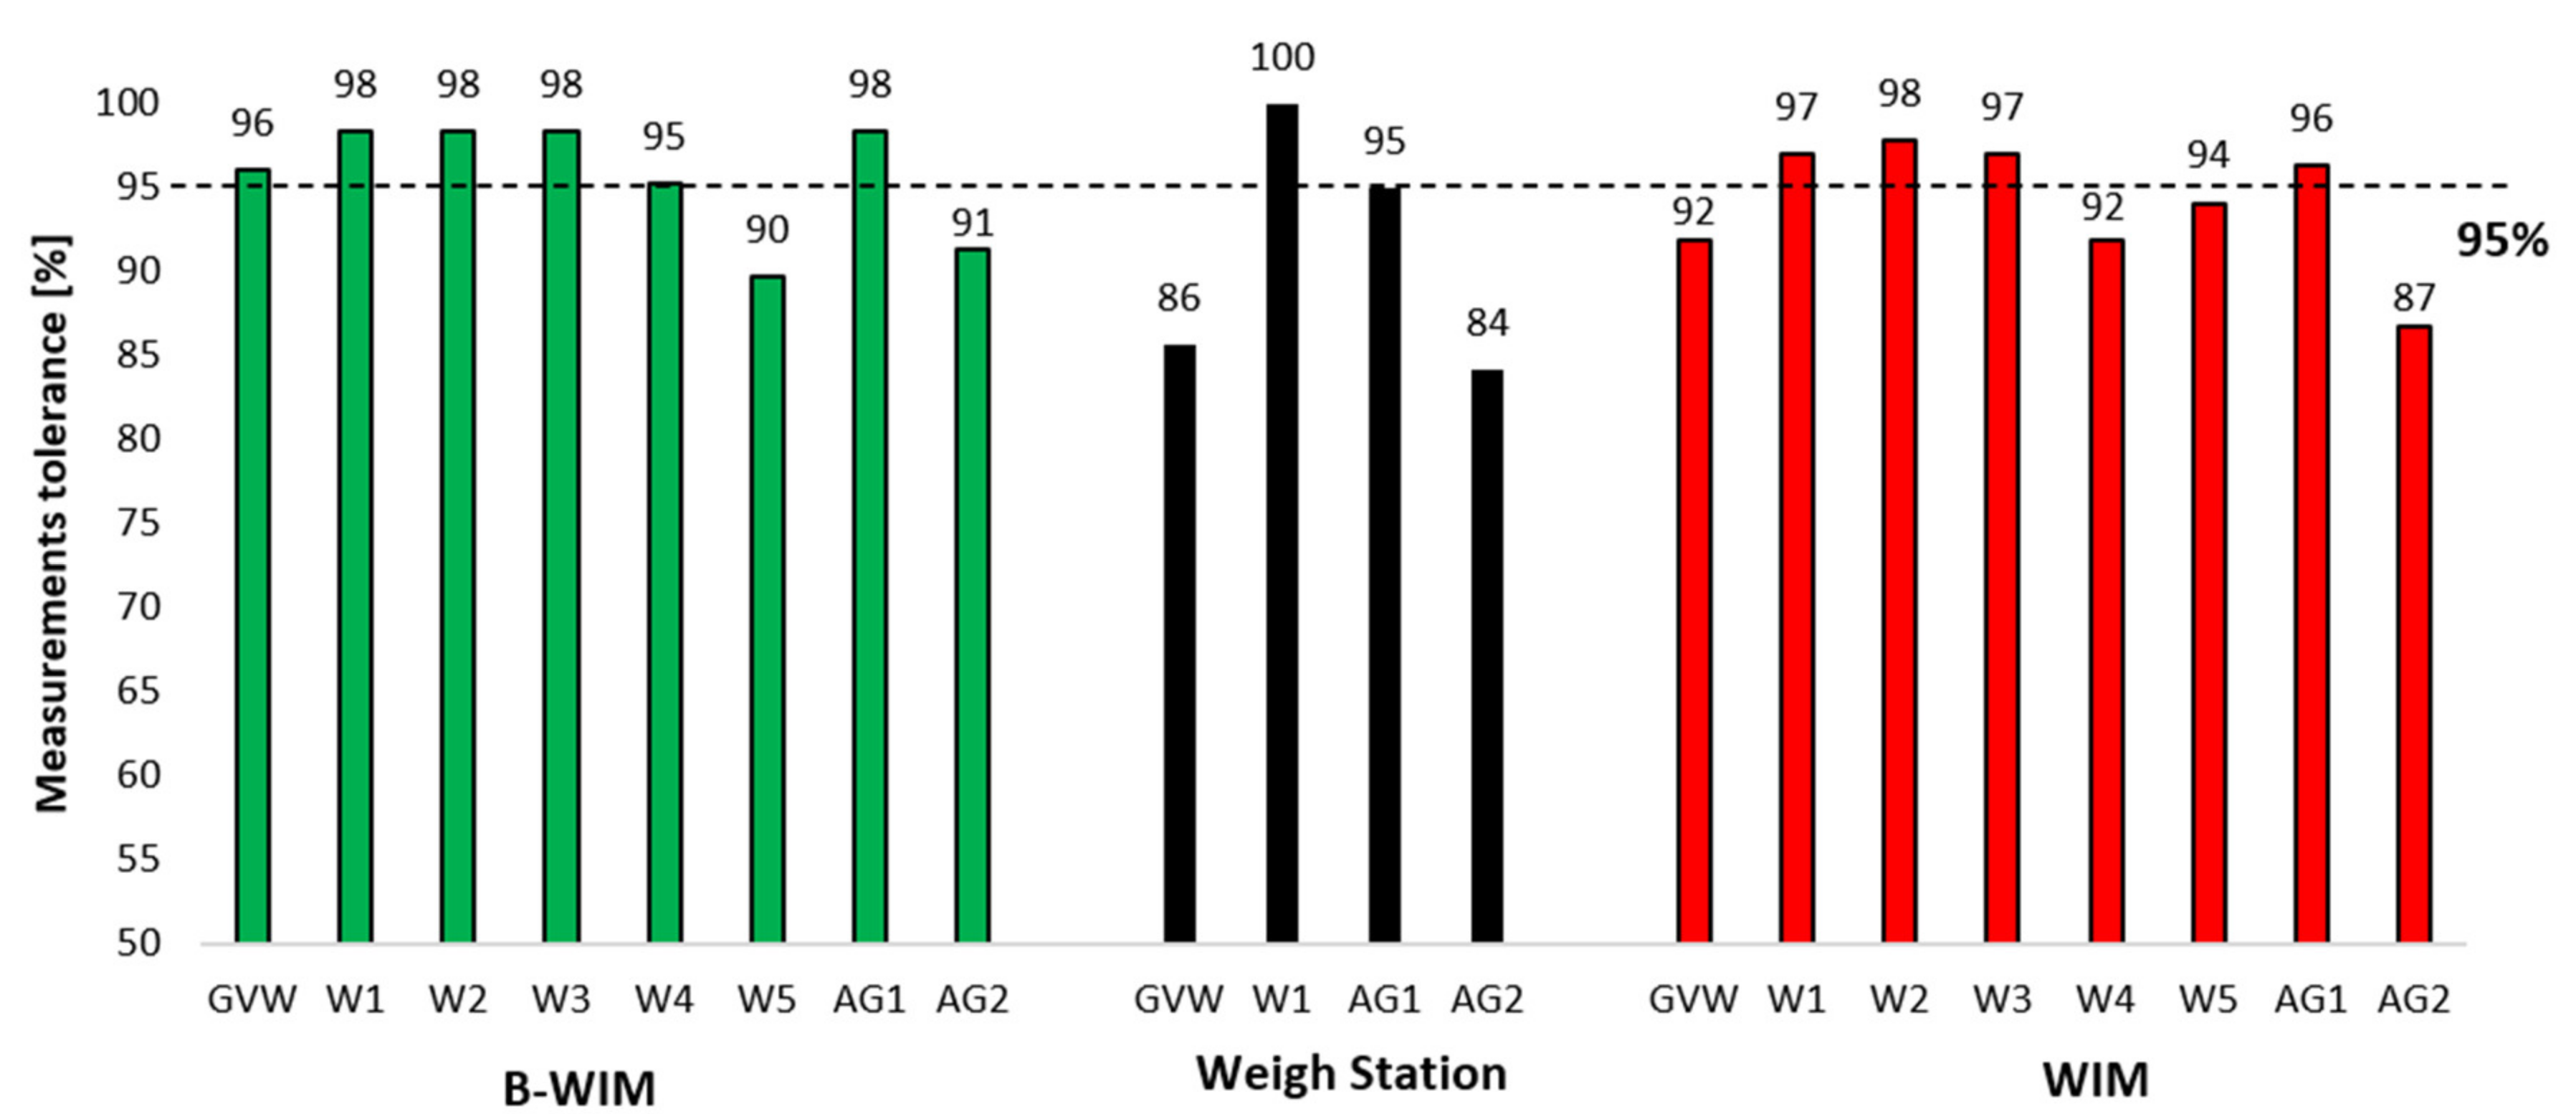
t-test concluded that the measurements are statistically different, it is crucial to account for the allowable tolerances specified by ASTM 1318E-09 WIM Type I. The traffic weight measurement tolerances established by ASTM WIM Type I indicated ±10% tolerance for GVW measurements, ±20% for individual axle weight, and ±15% for a group of axles. The tolerances needed to be within 95% of the respective data items recorded by the WIM system. The analysis was conducted for portable scales, where those certified scales were compared to weigh station, WIM, and B-WIM measurements. Figure 10 shows the results of the analysis of available measured vehicle attributes. For B-WIM measurements, almost all measured attributes are with the tolerance requirements. Only the 5th axle weight and second tandem axle (axle 4 + 5) provide the results at 90% tolerance, which is very close to the desired safety level. For the truck weigh station, the 1st axle weight measurements indicated 100% of the tolerance level measurements. But GVW and second tandem axle weight was below the required 95% compliance, and the tolerance was at 84–86%. Most of the measured vehicle attributes fulfilled the WIM measurements’ requirements, but in the case of GVW, the 4th axle weight and second tandem axle provided a tolerance that varied between 87–92%. It was in very close proximity to the anticipated safety level. For all three weighing systems compared to the certified portable scales, it could be noticed that the last two axles, and therefore the second tandem axle, provided the lowest tolerance level.
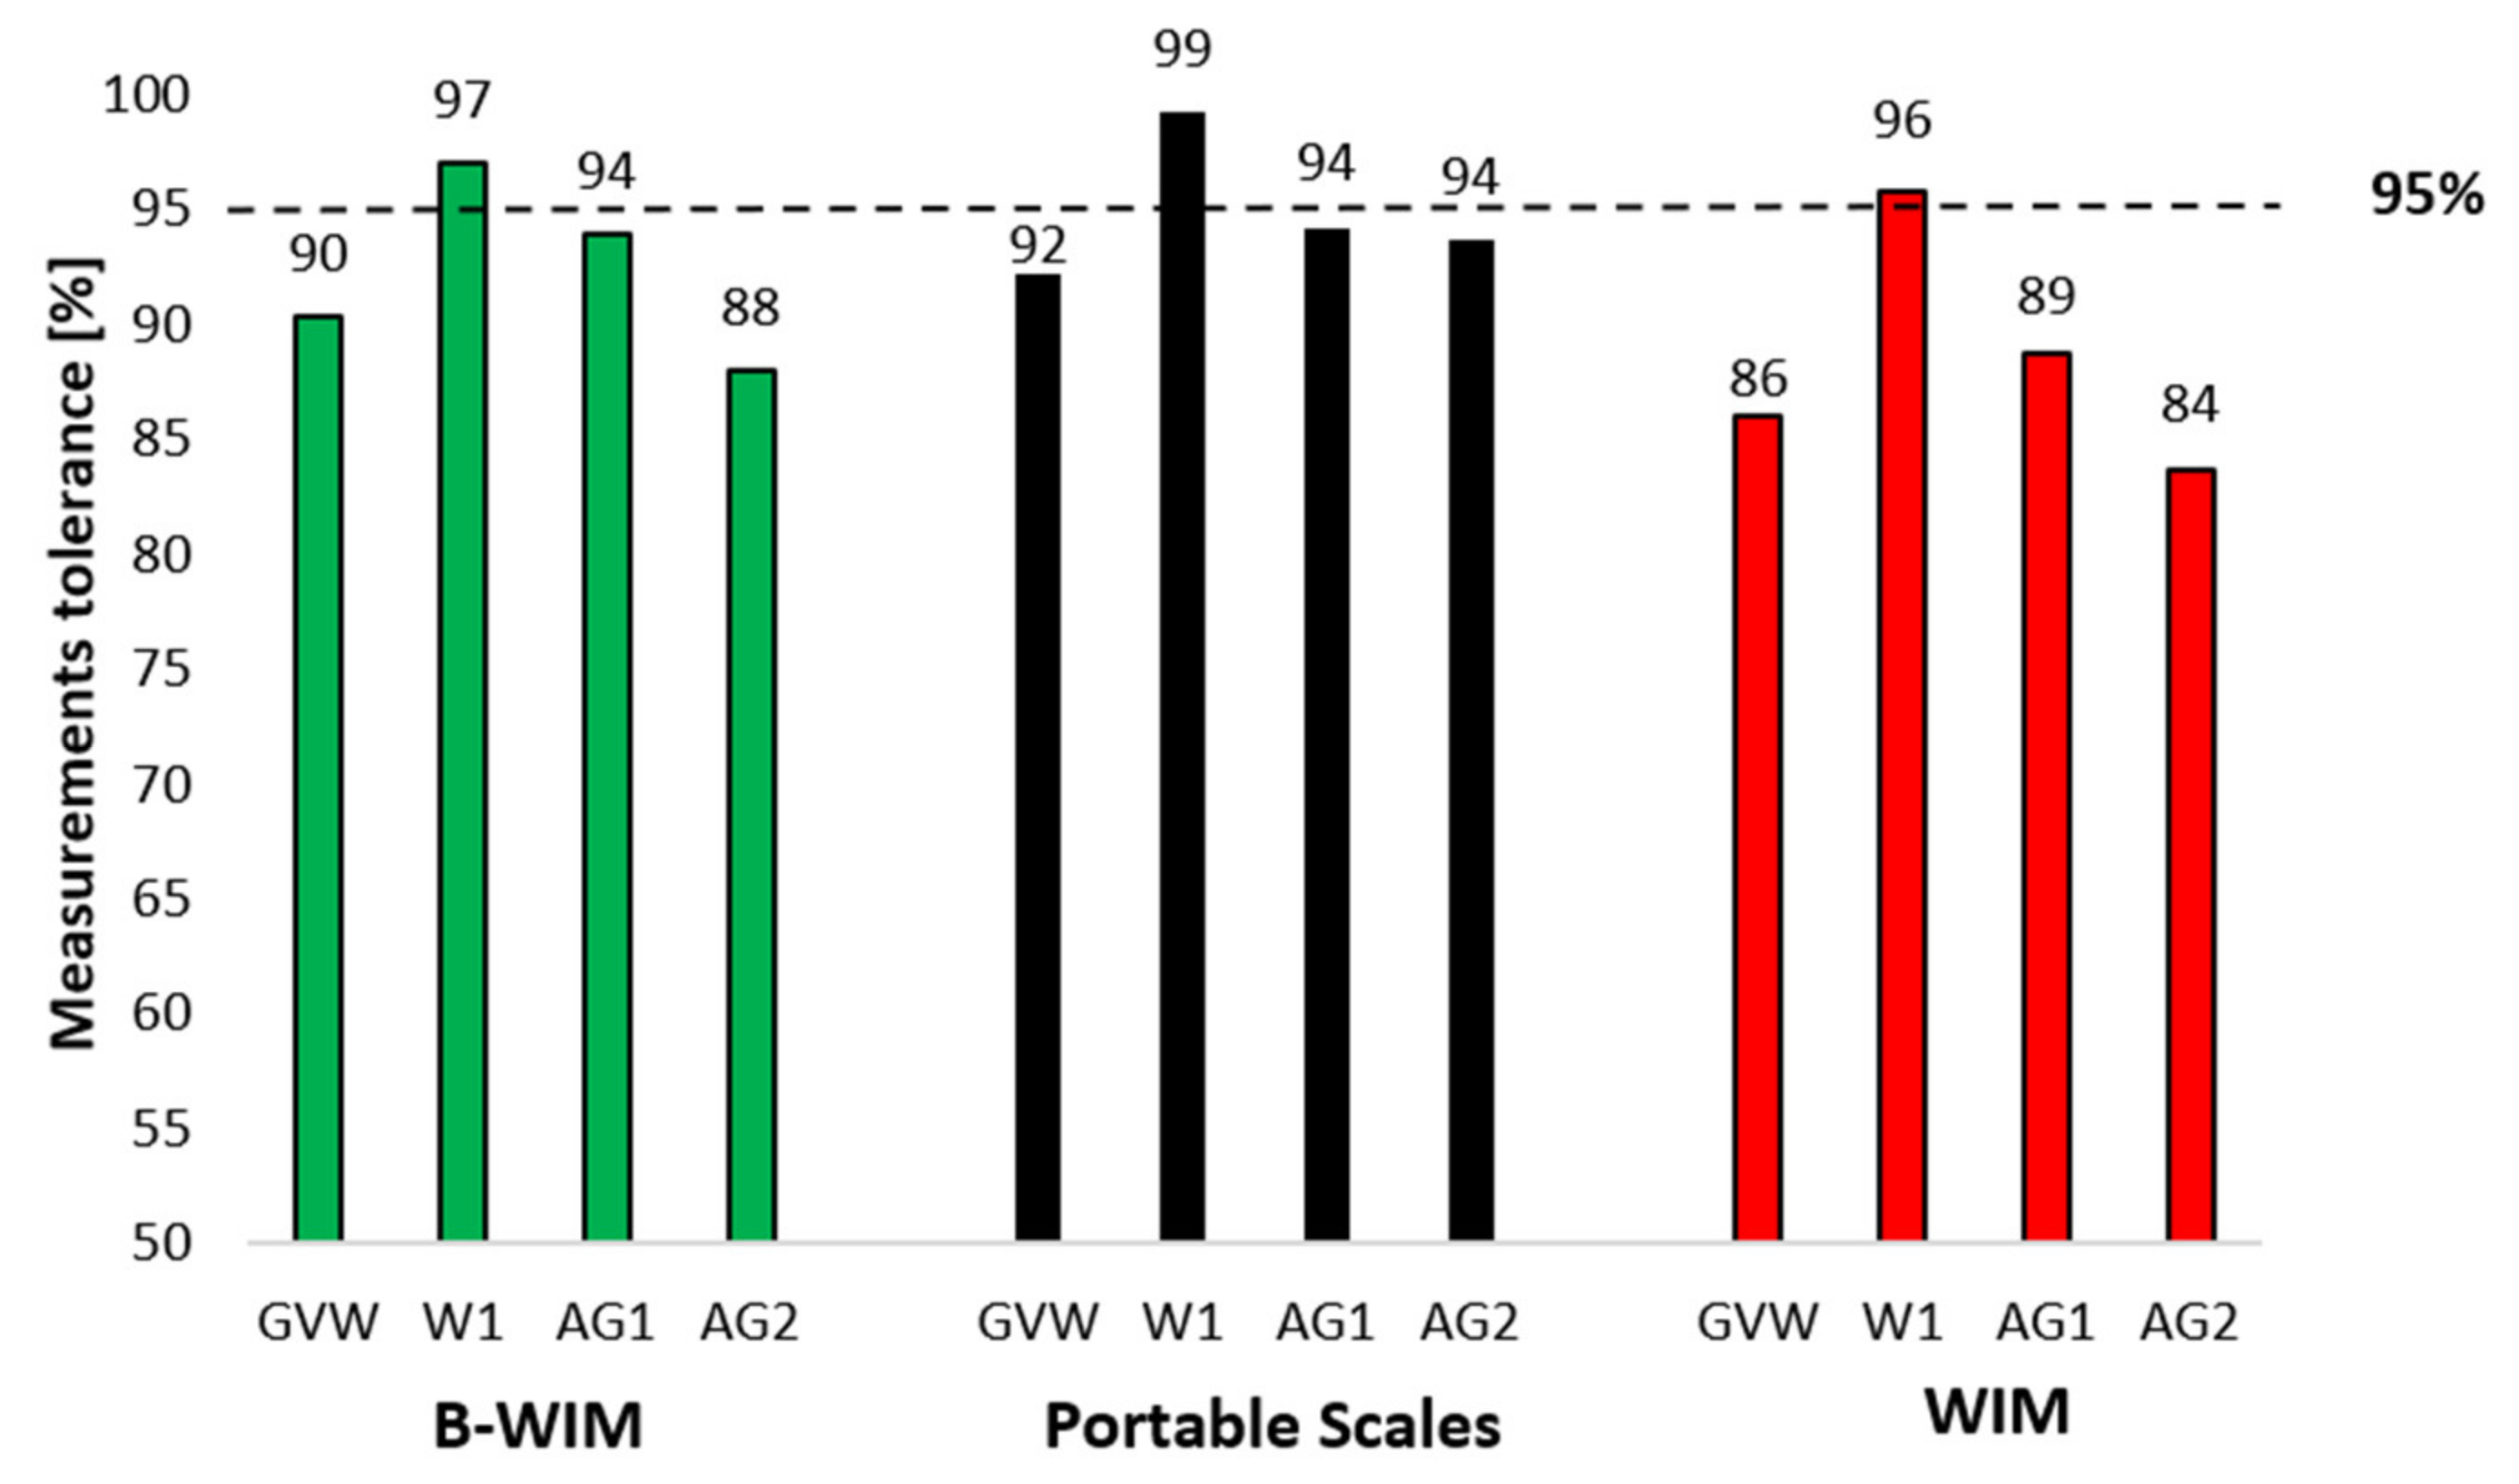
The tolerance check was conducted for the truck weigh station, which captured: GVW, 1st axle weight, and two tandems. Those vehicle attributes were compared to B-WIM, portable scales, and WIM measurements. Figure 11 presents a summary of the tolerance analysis. B-WIM’s tolerance level varied from 88–97%, which was close to the required safety. For portable scale measurements, the tolerance varied between 92–99%, which gave good results while comparing static weight measurements. The WIM data tolerances were between 84–96%, where the GVW and two tandems were below the required safety level. Also, in comparison to the tolerances with truck weigh station, it was noticed that the second tandem axle measurements provided the lowest tolerance to meet the 95% compliance.
Correlation coefficients were calculated for the portable scales data set and three other data weighing systems. The results are shown in Table 7. The correlation coefficient for B-WIM measurements varied from 0.67 to 0.87. The weigh station’s correlation coefficient values varied from 0.64 to 0.80. This shows a high correlation between the portable scales, and B-WIM, and weigh stations. The lowest values of the correlation coefficient ranging from 0.60 to 0.76, which were moderate correlations, are obtained in the case of the WIM data set. On the other hand, the correlation coefficient was calculated in comparison to truck weigh station measurements for GVW, 1st axle weight, and two groups of tandem axles. The strongest correlation was noticed with portable scales, where the value of the correlation coefficient was between 0.64–80 (moderate/high correlation). The B-WIM and truck weigh station correlation varied between 0.59–0.77, which was also a moderate/high correlation. The WIM measurement correlation was the weakest, providing a correlation coefficient between 0.45–52 (modest/moderate correlation). The stronger linear correlation was reported by comparing the measurements to portable scales. A high linear correlation coefficient was noticed for the first axle weight and first tandem axle, but the weakest for GVW and the second tandem axle.
This study can be beneficial for state agencies, bridge owners, consulting companies, weight measurement equipment producers, and researchers. The comparative analysis of measurement techniques provides the advantages and disadvantages of considered techniques. Accurate traffic measurements are critical for all stakeholders involved. Therefore, the same vehicles’ comparative measurements can help verify the measuring systems, calibrate them, and improve the performance. Systematic static weight comparison between the truck weigh station, and portable scales allow maintaining the good accuracy of the heavy traffic measurements. Similarly, in pavement and bridge WIM systems, measurements can be calibrated by the comparative analysis. The efficient, scheduled calibration of weighing systems is vital to maintain infrastructure safety and adequately manage the repair and replacement work. The traffic measurements are critical for the bridge and road inspections, live load model development, a site-specific update of safety factors for design and evaluation. The weigh-in-motion technology continuously monitors traffic-induced loads and allows us to assess their impact on bridge and pavement conditions. Accurate measurements allow improving the infrastructure life cycle analysis.
In this study, it was noticed for all considered measurement techniques that the further from the steering axle, the bigger error was captured. It may be concluded, the more significant number of axles, the more probable to have a larger measurement error. The analysis indicated that axle 4 and 5 measurements, and accordingly, the second tandem provided the biggest variation and tolerance error.

5. Conclusions

The development of weighing vehicle systems provides a tool to measure the impact of live load on road infrastructure. This knowledge is helpful in the management of roads and bridges, in the design, evaluation, maintenance, and improvement. Accurate and reliable measurements allow for a better estimation of the traffic-induced effects. There are new opportunities to use non-invasive weigh-in-motion systems, which do not interrupt and delay traffic and road infrastructure. Weigh-in-motion systems can continuously collect traffic weight data. In this study, the static and dynamic vehicle weight measurements were compared to assess the accuracy of the measurements. Four weigh measuring systems were considered: portable scales, truck weigh station, WIM, and B-WIM. About 150 trucks were measured, and statistical analysis was conducted to compare the differences between the measuring systems by multiple t-tests, ASTM E1318-09 [29] tolerance check, and correlation coefficient calculation.
Based on this study, it can be concluded that the certificated portable scales are accurate but cumbersome in operation, and the measurements are time-consuming. Furthermore, operators and drivers have to be involved. This is a selective method that only captures selected vehicles, however, because of accuracy, they were used as a reference point in t-test and tolerance analysis. The portable scale measurements were compared to the truck weigh station. The tolerance comparison indicated 92–99% of tolerance for measured attributes. The linear correlation coefficient varies from 0.64–0.80, proving the strong correlation between the measurement by both static scales.
Truck weigh stations also provide accurate results, but their operation is expensive and, therefore, inefficient. Moreover, their location is well known, and haulers of illegally overloaded vehicles can find alternative routes and avoid being ticketed. The weigh station measurement was used as a reference point for weigh-in-motion measurements. Additionally, truck weigh station measurements were compared with portable scales, where tolerances between the analyzed vehicle attributes vary from 84–100%. It provided good results, but some of the measurements are below the required 95% compliance level.
Weigh-in-motion data can continuously measure vehicle attributes, which allows the collection of massive traffic data. The WIM data measurement tolerances were compared to portable scales, where 92–98% of the measurements were within the tolerance level. Only the second tandem axle provides 87% tolerance of the measurements. Throughout the analysis, axle 4th and 5th, and accordingly, the second tandem axle provide the lowest tolerance margin. The tolerance measurements in comparison to truck weigh stations were between 84–96%. Compared to portable scales, the linear coefficient of correlation varies between 0.60–0.76, which provides a moderate/high correlation. For the truck weigh station, its coefficient is 0.45–0.52, which presents a modest correlation.
B-WIM system is an efficient tool to measure bridge response to truck traffic. The results show that B-WIM provides reliable measurement data. The measured tolerances are between 90–98% compared to portable scales and 88–97% compared to truck weigh station. The correlation coefficient is 0.67–0.87 for portable scales and 0.59–0.77 to weigh station. That shows a high correlation and proves weight measurement’s reliability.
Moreover, the multiple t-test analysis was conducted to verify whether the measurements are different for a 95% confidence interval. It was proved that, for 95% confidence, the results are statistically different. If the tolerances are considered, it can be concluded that most of the measured vehicle attributes provide accurate results that meet the ASTM requirements.
This study’s constraints include the sample size, consideration of only 5-axle vehicles. It may be essential to consider more distinguished vehicle weights and configurations to recognize any possible measurement technique limitations. In addition, different WIM type tolerances presented by ASTM could be considered to define the accuracy of measured vehicle parameters. The traffic weight measurement accuracy is crucial for the safety and management of infrastructure. Continuous traffic measurements can help maintain roads and bridges’ good condition and improve safety and economic growth.

Author Contributions

The authors confirm contribution to the paper as follows: Study conception: S.S., J.C., M.B., K.B., and A.N., Analysis, and interpretation of results: S.S., J.C., and M.B., draft manuscript preparation: S.S., J.C., A.N., M.B., and K.B. All authors reviewed the paper and approved the final version of the manuscript.

Funding

This research was partially sponsored by Taylor Consulting Group LLC.

Institutional Review Board Statement

Not applicable.

Informed Consent Statement

Not applicable.

Data Availability Statement

The data presented in this study can be available on request from the corresponding author.

Acknowledgments

The presented research was partially sponsored by Taylor Consulting Group LLC, with Robert Taylor, which is gratefully acknowledged. Thanks are due to Matija Mavrič, Bajko Kulauzović, Matjaž Sokol of Cestel d. o. o. for fruitful discussions and valuable comments. The opinions and conclusions expressed or implied are those of the authors.

Conflicts of Interest

The authors declare no conflict of interest.

References

  1. Schmidt, F.; Jacob, B. Experimentation of a Bridge WIM System in France and Applications to Bridge Monitoring and Overload Screening. In Proceedings of the 6th International Conference on Weigh-In-Motion (ICWIM 6), Dallas, TX, USA, 4–6 June 2012; Available online: https://trid.trb.org/view/1265588 (accessed on 29 June 2020).
  2. Hallenbeck, M.E.; Weinblatt, H. National Cooperative Highway Research Program. In Equipment for Collecting Traffic Load Data; NCHRP 509; Transportation Research Board: Washington, DC, USA, 2004. [Google Scholar]
  3. White, R.; Song, J.; Haas, C.; Middleton, D. Evaluation of Quartz Piezoelectric Weigh-in-Motion Sensors. Transp. Res. Rec. J. Transp. Res. Board 2006, 1945, 109–117. [Google Scholar] [CrossRef]
  4. Al-Qadi, I.; Wang, H.; Ouyang, Y.; Grimmelsman, K.; Purdy, J. LTBP Program’s Literature Review on Weigh-in-Motion Systems. 2016. Available online: https://trid.trb.org/view.aspx?id=1412575 (accessed on 7 July 2017).
  5. Moses, F. Weigh-in-Motion system using instrumented bridges. J. Transp. Eng. 1979, 105, 233–249. Available online: https://trid.trb.org/view/91638 (accessed on 29 June 2020).
  6. Peters, R.J. Axway—A System to Obtain Vehicle Axle Weight; Australian Road Research: Melbourne, Australia, 1984; Volume 12, Available online: https://trid.trb.org/view/211555 (accessed on 29 June 2020).
  7. Jacob, B. WAVE: Weigh-in-Motion of Axles and Vehicles for Europe. 2002. Available online: https://trid.trb.org/view/1160490 (accessed on 10 November 2020).
  8. O’Brien, E.J.; Znidaric, A.; Baumgärtner, W.; González, A.; McNulty, P.; Al, E. Weighing-In-Motion of Axles and Vehicles for Europe (WAVE) WP1.2: Bridge WIM Systems; Technical Report; University College Dublin: Dublin, Ireland, 2001; Available online: https://researchrepository.ucd.ie/handle/10197/9140 (accessed on 29 June 2020).
  9. Ieng, S.S.; Zermane, A.; Schmidt, F.; Jacob, B. Analysis of B-WIM Signal Acquired in Mullau Orthotropic Viaduct Using Statistical Classification. 2012. Available online: https://www.researchgate.net/profile/Franziska_Schmidt4/publication/281923473_Analysis_of_B-WIM_Signals_acquired_in_Millau_Orthotropic_Viaduct_Using_Statistical_Classification/links/567a5bab08ae361c2f6963f2/Analysis-of-B-WIM-Signals-acquired-in-Millau-Orthotropic-Viaduct-Using-Statistical-Classification.pdf (accessed on 15 December 2020).
  10. Lydon, M.; Taylor, S.E.; Robinson, D.; Mufti, A.; Brien, E.J.O. Recent developments in bridge weigh in motion (B-WIM). J. Civil. Struct. Health Monit. 2016, 6, 69–81. [Google Scholar] [CrossRef] [Green Version]
  11. Rowley, C.W.; Brien, E.J.O.; Gonzalez, A.; Žnidarič, A. Experimental Testing of a Moving Force Identification Bridge Weigh-in-Motion Algorithm. Exp. Mech. 2009, 49, 743–746. [Google Scholar] [CrossRef]
  12. Yu, Y.; Cai, C.; Deng, L. State-of-the-art review on bridge weigh-in-motion technology. Adv. Struct. Eng. 2016, 19, 1514–1530. [Google Scholar] [CrossRef]
  13. Žnidarič, A.; Kalin, J.; Kreslin, M. Improved accuracy and robustness of bridge weigh-in-motion systems. Struct. Infrastruct. Eng. 2018, 14, 412–424. [Google Scholar] [CrossRef]
  14. Žnidaric, A.; Kulauzovic, B. Innovative use of bridge-WIM as an efficient tool for optimized safety assessment of bridges. In Proceedings of the ARRB International Conference, Brisbane, Australia, 28 May 2018; Available online: https://trid.trb.org/view/1538135 (accessed on 29 June 2020).
  15. Sivakumar, B.; Ghosn, M.; Moses, F. Protocols for Collecting and Using Traffic Data in Bridge Design; NCHRP Report 683; Transportation Research Board: Washington, DC, USA, 2008. [Google Scholar] [CrossRef] [Green Version]
  16. Fiorillo, G.; Ghosn, M. Procedure for Statistical Categorization of Overweight Vehicles in a WIM Database. J. Transp. Eng. 2014, 140, 04014011. [Google Scholar] [CrossRef]
  17. Bae, H.-U.; Oliva, M.G. Bridge Analysis and Evaluation of Effects under Overload Vehicles-Phase II; CFIRE 02-03; University of Wisconsin-Madison: Madison, WI, USA, 2012. [Google Scholar]
  18. Deng, L.; Yan, W. Vehicle Weight Limits and Overload Permit Checking Considering the Cumulative Fatigue Damage of Bridges. J. Bridge Eng. 2018, 23, 7. [Google Scholar] [CrossRef]
  19. Wang, X.; Zhao, P.; Tao, Y. Evaluating Impacts of Overloaded Heavy Vehicles on Freeway Traffic Condition by a Novel Multi-Class Traffic Flow Model. Sustainability 2018, 10, 4694. [Google Scholar] [CrossRef] [Green Version]
  20. Correia, J.P.R.R.; Branco, F.A.B. New Methodology: Permit Checking of Vehicular Overloads. J. Bridge Eng. 2006, 11, 3. [Google Scholar] [CrossRef]
  21. Enright, B.; Brien, E.J.O.; Leahy, C. Identifying and modeling permit trucks for bridge loading. Proc. Inst. Civ. Eng. Bridge Eng. 2016, 169. [Google Scholar] [CrossRef] [Green Version]
  22. Titi, H.H.; Coley, N.; Latifi, V.; Matar, M. Characterization of Overweight Permitted Truck Routes and Loads in Wisconsin. Transp. Res. Rec. 2014, 2411, 1. [Google Scholar] [CrossRef]
  23. Moses, F. Calibration of Load Factors for LRFR Bridge Evaluation; National Academy Press: Washington, DC, USA, 2001. [Google Scholar]
  24. Ramachandran, A.N.; Taylor, K.L.; Stone, J.R.; Sajjadi, S.S. NCDOT Quality Control Methods for Weigh-in-Motion Data. Public Work. Manag. Policy 2011, 16, 1. [Google Scholar] [CrossRef]
  25. Pelphrey, J.; Higgins, C.; Sivakumar, B.; Groff, R.L.; Hartman, B.H.; Charbonneau, J.P.; Rooper, J.W.; Johnson, B.V. State-Specific LRFR Live Load Factors Using Weigh-in-Motion Data. J. Bridge Eng. 2008, 13, 4. [Google Scholar] [CrossRef] [Green Version]
  26. Brien, E.J.O.; Enright, B. Using Weigh-in-Motion Data to Determine Aggressiveness of Traffic for Bridge Loading. J. Bridge Eng. 2013, 18, 3. [Google Scholar] [CrossRef]
  27. Nowak, A.S.; Rakoczy, P. WIM-based Live load for Bridges. KSCE J. Civ. Eng. 2013, 17, 568–574. [Google Scholar] [CrossRef]
  28. Bridge Weigh in Motion System Cestel Siwim. Available online: https://www.cestel.eu/113/more-about-siwim-system (accessed on 29 June 2020).
  29. ASTM International. ASTM E1318—09—Standard Specification for Highway Weigh-in-Motion (WIM) Systems with User Requirements and Test Methods; ASTM International: West Conshohocken, PA, USA, 2009. [Google Scholar]
Figure 1. Considered truck weigh systems: (a) overview, (b) specific locations (https://www.bing.com/maps).
Applsci 11 00745 g001
Figure 2. Side view of the bridge.
Applsci 11 00745 g002
Figure 3. Scheme of the measuring apparatus arrangement.
Applsci 11 00745 g003
Figure 4. Considered truck weigh systems: (a) overview, (b) specific locations.
Applsci 11 00745 g004
Figure 5. Simplified measurement scheme [28].
Applsci 11 00745 g005
Figure 6. Traffic data collection flowchart.
Applsci 11 00745 g006
Figure 7. Attributes of the vehicle considered during measurements.
Applsci 11 00745 g007
Figure 8. GVW measurement tolerances (a) compared to portable scales measurement, (b) compared to weigh station measurements.
Applsci 11 00745 g008
Figure 9. The first tandem axle weight measurement (a) compared to portable scales measurement, (b) compared to weigh station measurements.
Applsci 11 00745 g009
Figure 10. Measurement tolerances compared to portable scales.
Applsci 11 00745 g010
Figure 11. Measurement tolerances compared to portable scales.
Applsci 11 00745 g011
Table 1. Attributes considered during measurements.
Measurement Type →
↓ Attributes
#1
WIM
#2
Static Scales
#3
Portable Scales
#4
B-WIM System
Timestamp of weighing
GVW (kip)
W1 (kip)—#1 axle weight
W2 (kip)—#2 axle weight
W3 (kip)—#3 axle weight
W4 (kip)—#4 axle weight
W5 (kip)—#5 axle weight
AG_1 (kip)—Tandem axle #1√ * * *
AG_2 (kip)—Tandem axle #2 * * *
S1 (ft)—spacing axle #1 and #2
S2 (ft)—spacing axle #2 and #3
S3 (ft)—spacing axle #3 and #4
S4 (ft)—spacing axle #4 and #5
Vehicle class
Vehicle speed (mph)
Number of axles√ ** **
Plate number ** **
US DOT number ** **
* tandem axle is considered if the spacing between axles does not exceed 6 ft, it is calculated as a sum of axle weights: AG_1 = W2 + W3 and AG_2 = W4 + W5, ** tandem axle is considered if the spacing between axles does not exceed 6 ft, it is calculated as a sum of axle weights: AG_1 = W2 + W3 and AG_2 = W4 + W5.
Table 3. Statistical parameters of GVW for all weighing systems.
Weighing SystemMean [kip]SD [kip]
Portable Scales73.995.63
Weigh Station74.945.69
WIM77.158.83
B-WIM73.226.53
Table 4. Statistical parameters of Axle weight for all weighing systems.
Weighing SystemAxle Weight #1Axle Weight #2Axle Weight #3Axle Weight #4Axle Weight #5
Mean [kip]SD [kip]Mean [kip]SD [kip]Mean [kip]SD [kip]Mean [kip]SD [kip]Mean [kip]SD [kip]
Portable Scales11.530.7115.951.4515.291.4515.782.0415.442.06
weigh station11.530.67--------
WIM12.041.1715.942.1515.922.1816.642.6816.52.6
B-WIM11.361.0615.461.715.461.7115.492.1915.452.25
Table 5. Statistical parameters of tandem axle weights for all weighing systems.
Weighing SystemTandem Axle Weight 2 + 3Tandem Axle Weight 4 + 5
Mean [kip]SD [kip]Mean [kip]SD [kip]
Portable Scales31.192.7530.883.81
Weigh Station31.383.2832.034.42
WIM31.604.9929.7811.00
B-WIM30.893.4330.624.48
Table 6. Multiple t-tests for paired means compared to the portable scales and weigh station measurements.
ParametersPortable ScalesWeigh Station
B-WIMWeigh StationWIMB-WIMPortable ScalesWIM
GVW10.507.3113.709.817.3111.20
W16.594.265.966.054.266.37
W26.58-5.50---
W36.53-5.91---
W46.89-7.34---
W57.17-7.11---
AG110.765.887.877.855.887.93
AG210.507.3113.709.817.3111.20
Table 7. Summary of the correlation coefficients calculated for portable scales and weigh station measurements.
ParametersPortable ScalesWeigh Station
B-WIMWeigh StationWIMB-WIMPortable ScalesWIM
GVW0.870.640.680.590.640.45
W10.670.800.600.660.800.52
W20.80-0.72---
W30.81-0.75---
W40.72-0.60---
W50.76-0.73---
AG10.840.780.740.770.780.51
AG20.800.650.760.590.650.47
Table 8. Mean and standard deviation of difference for vehicle attributes compared to portable scales and weigh station measurements.
ParametersMean and SD of DifferencePortable ScalesWeigh Station
B-WIMWeigh StationWIMB-WIMPortable ScalesWIM
GVWMean2.251.563.272.741.563.24
SD2.422.482.763.182.483.36
W1Mean2.030.891.551.630.891.11
SD3.742.553.163.272.552.13
W2Mean2.85-1.85---
SD5.28-4.08---
W3Mean2.76-1.80---
SD5.14-3.68---
W4Mean2.95-2.54---
SD5.20-4.20---
W5Mean2.93-2.38---
SD4.97-4.05---
AG1Mean1.251.241.521.751.241.99
SD1.322.502.262.592.502.99
AG2Mean1.661.442.112.461.443.03
SD2.332.942.053.112.943.47
Publisher’s Note: MDPI stays neutral with regard to jurisdictional claims in published maps and institutional affiliations.

