
Novel Supervisory Management Scheme of Hybrid Sun Empowered Grid-Assisted Microgrid for Rapid Electric Vehicles Charging Area


Abstract
:1. Introduction
1.1. Work on Smart Fast Charging EV
1.2. Contribution
- Seamless daylight electric charging is proposed for the employees, staff, and students which facilitated the owners with less cost.
- By utilizing a shrewd energy management scheme the impact on the mains is very less and take advantage of the grid whenever the price of the grid decreases.
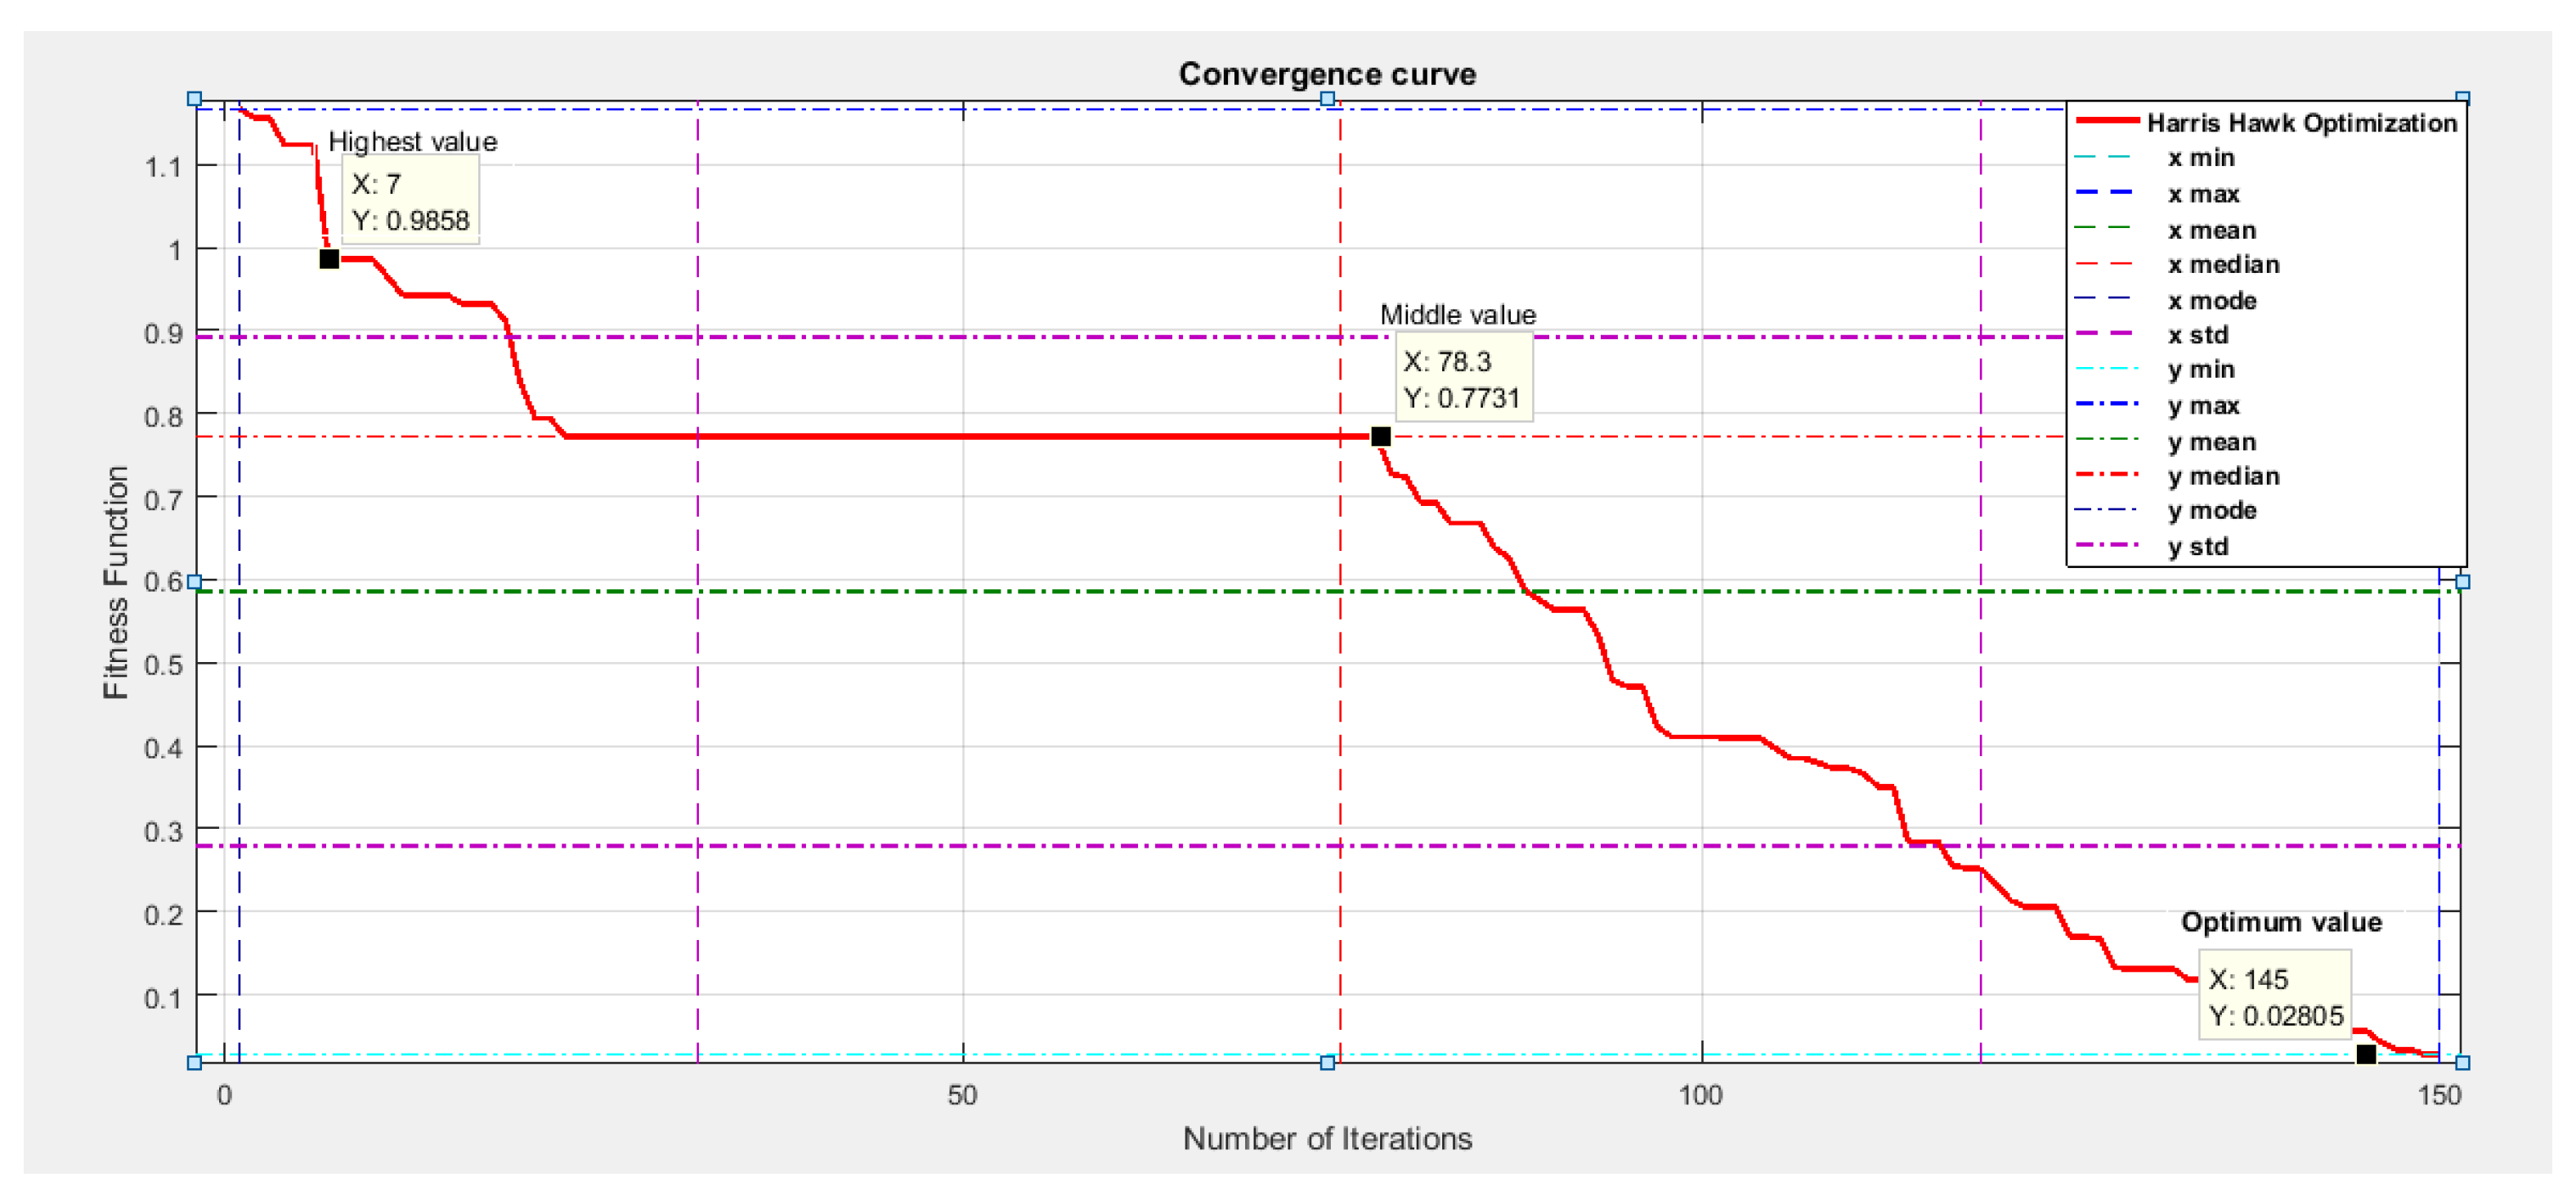
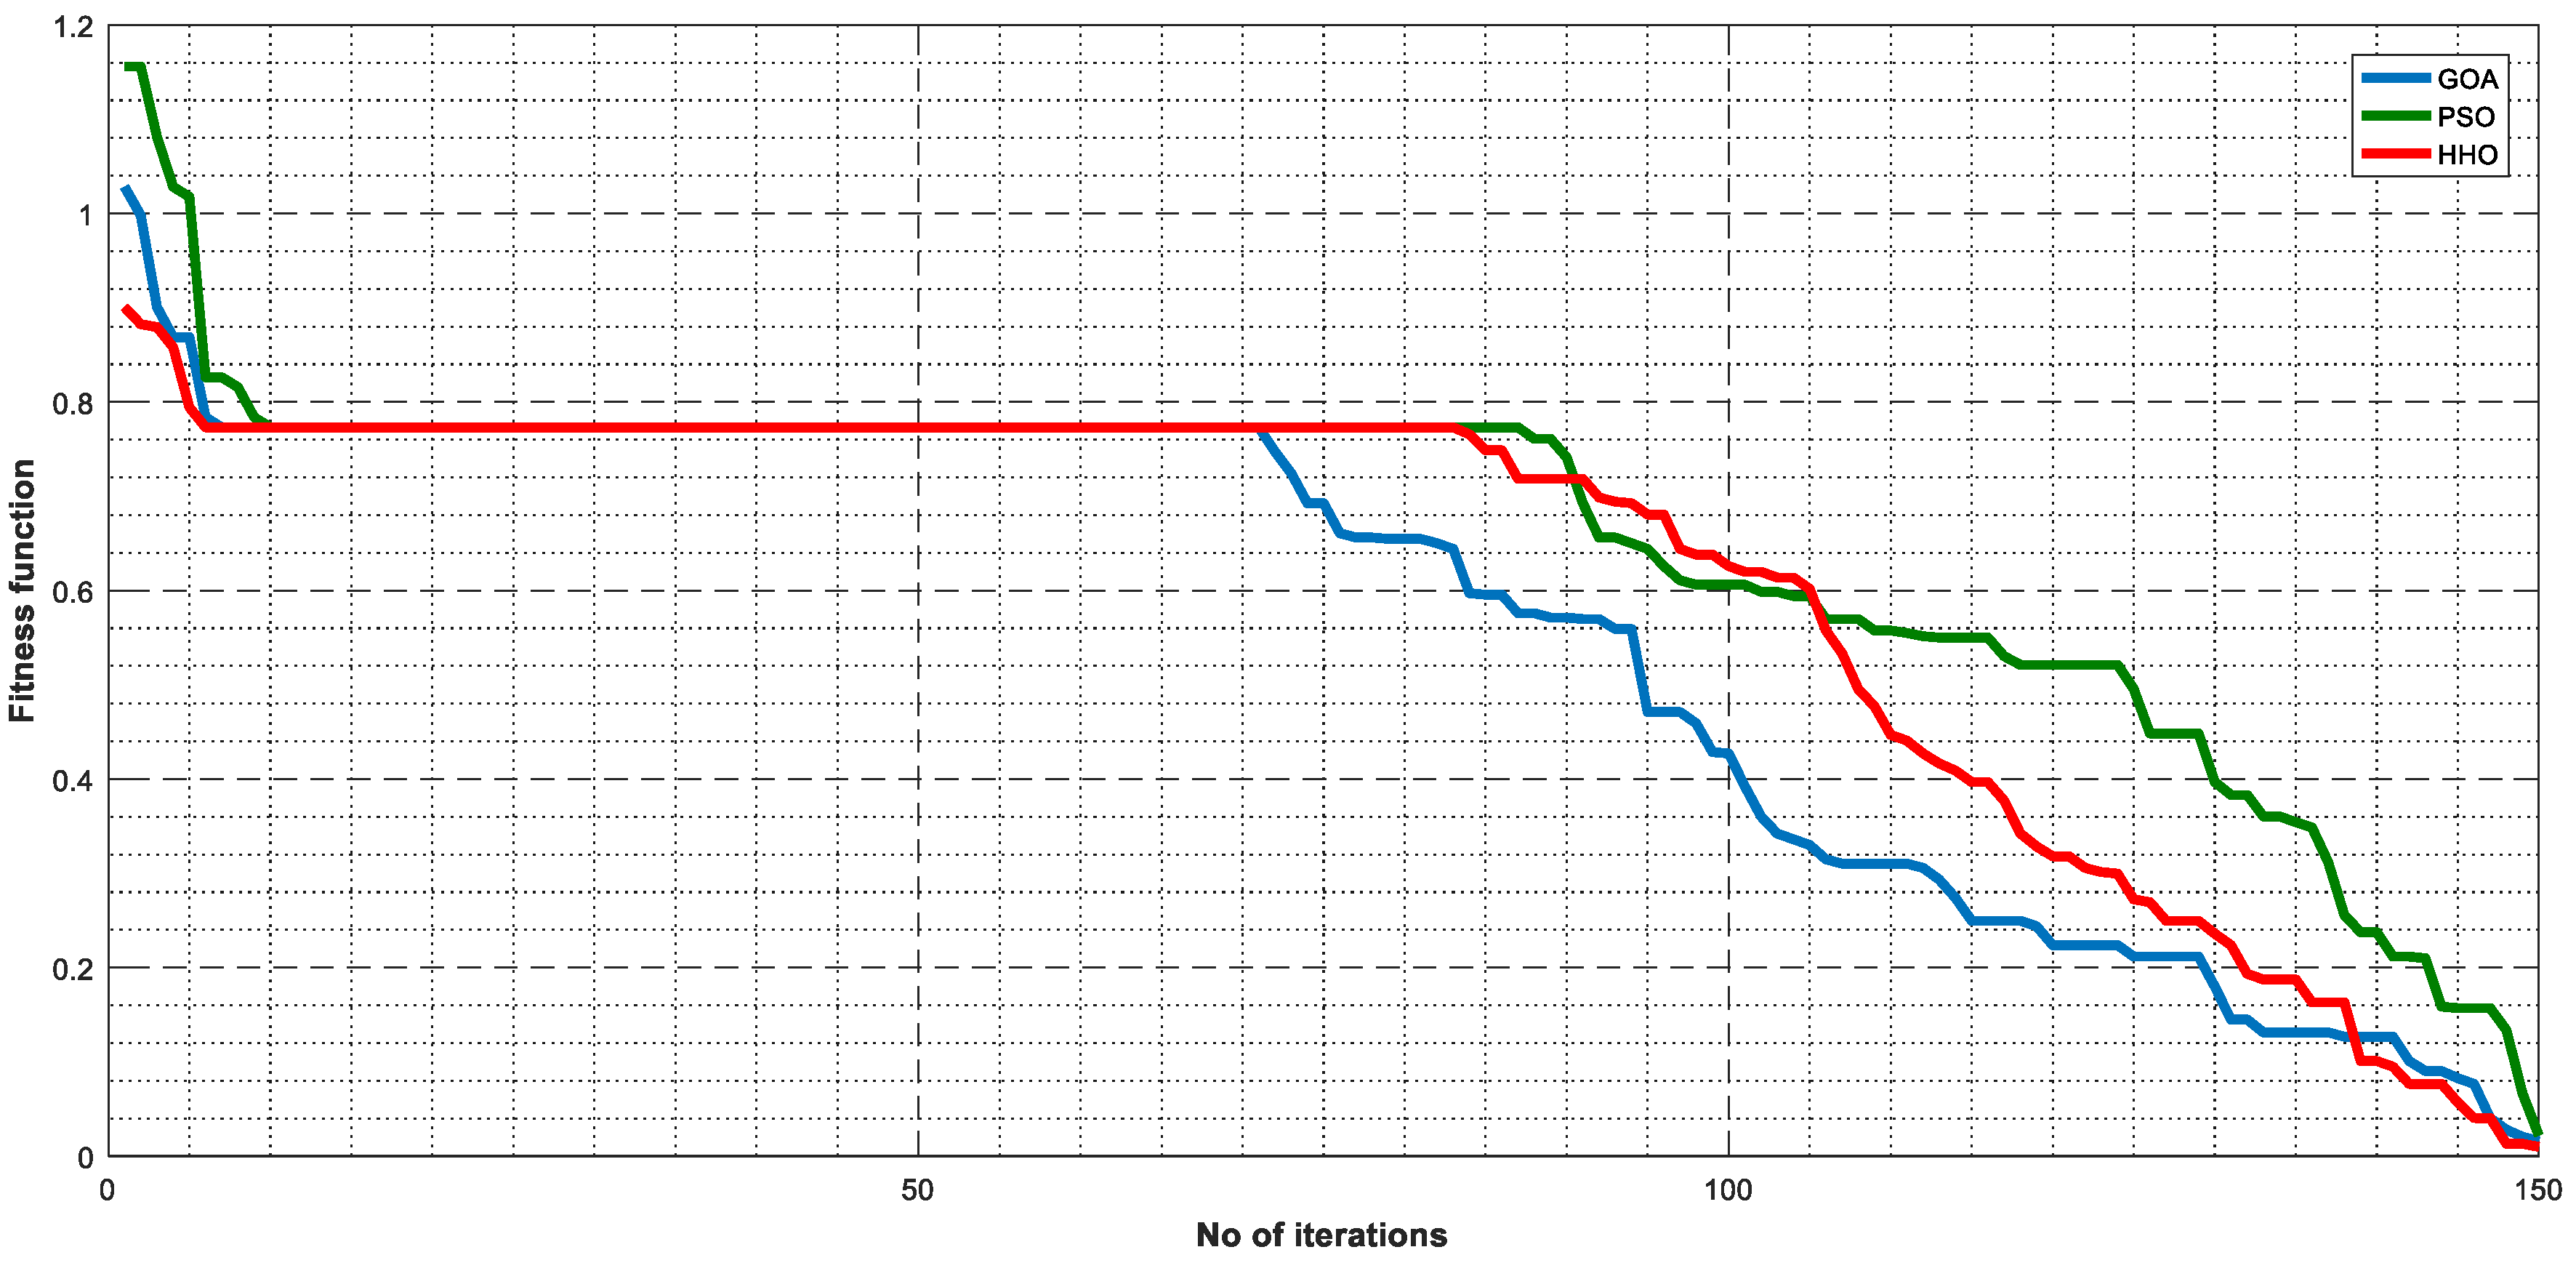
- Optimum sizing of charging station components is done by artificial indigence, metaheuristic swarm-based algorithm for an optimum number of battery units and PV panels.
- It is also validated with memetic grasshopper optimization (GOA) and canonical particle swarm optimization (PSO).
1.3. Organization of Paper
2. Mathematical Modeling of EV/DC Fast Charging Station
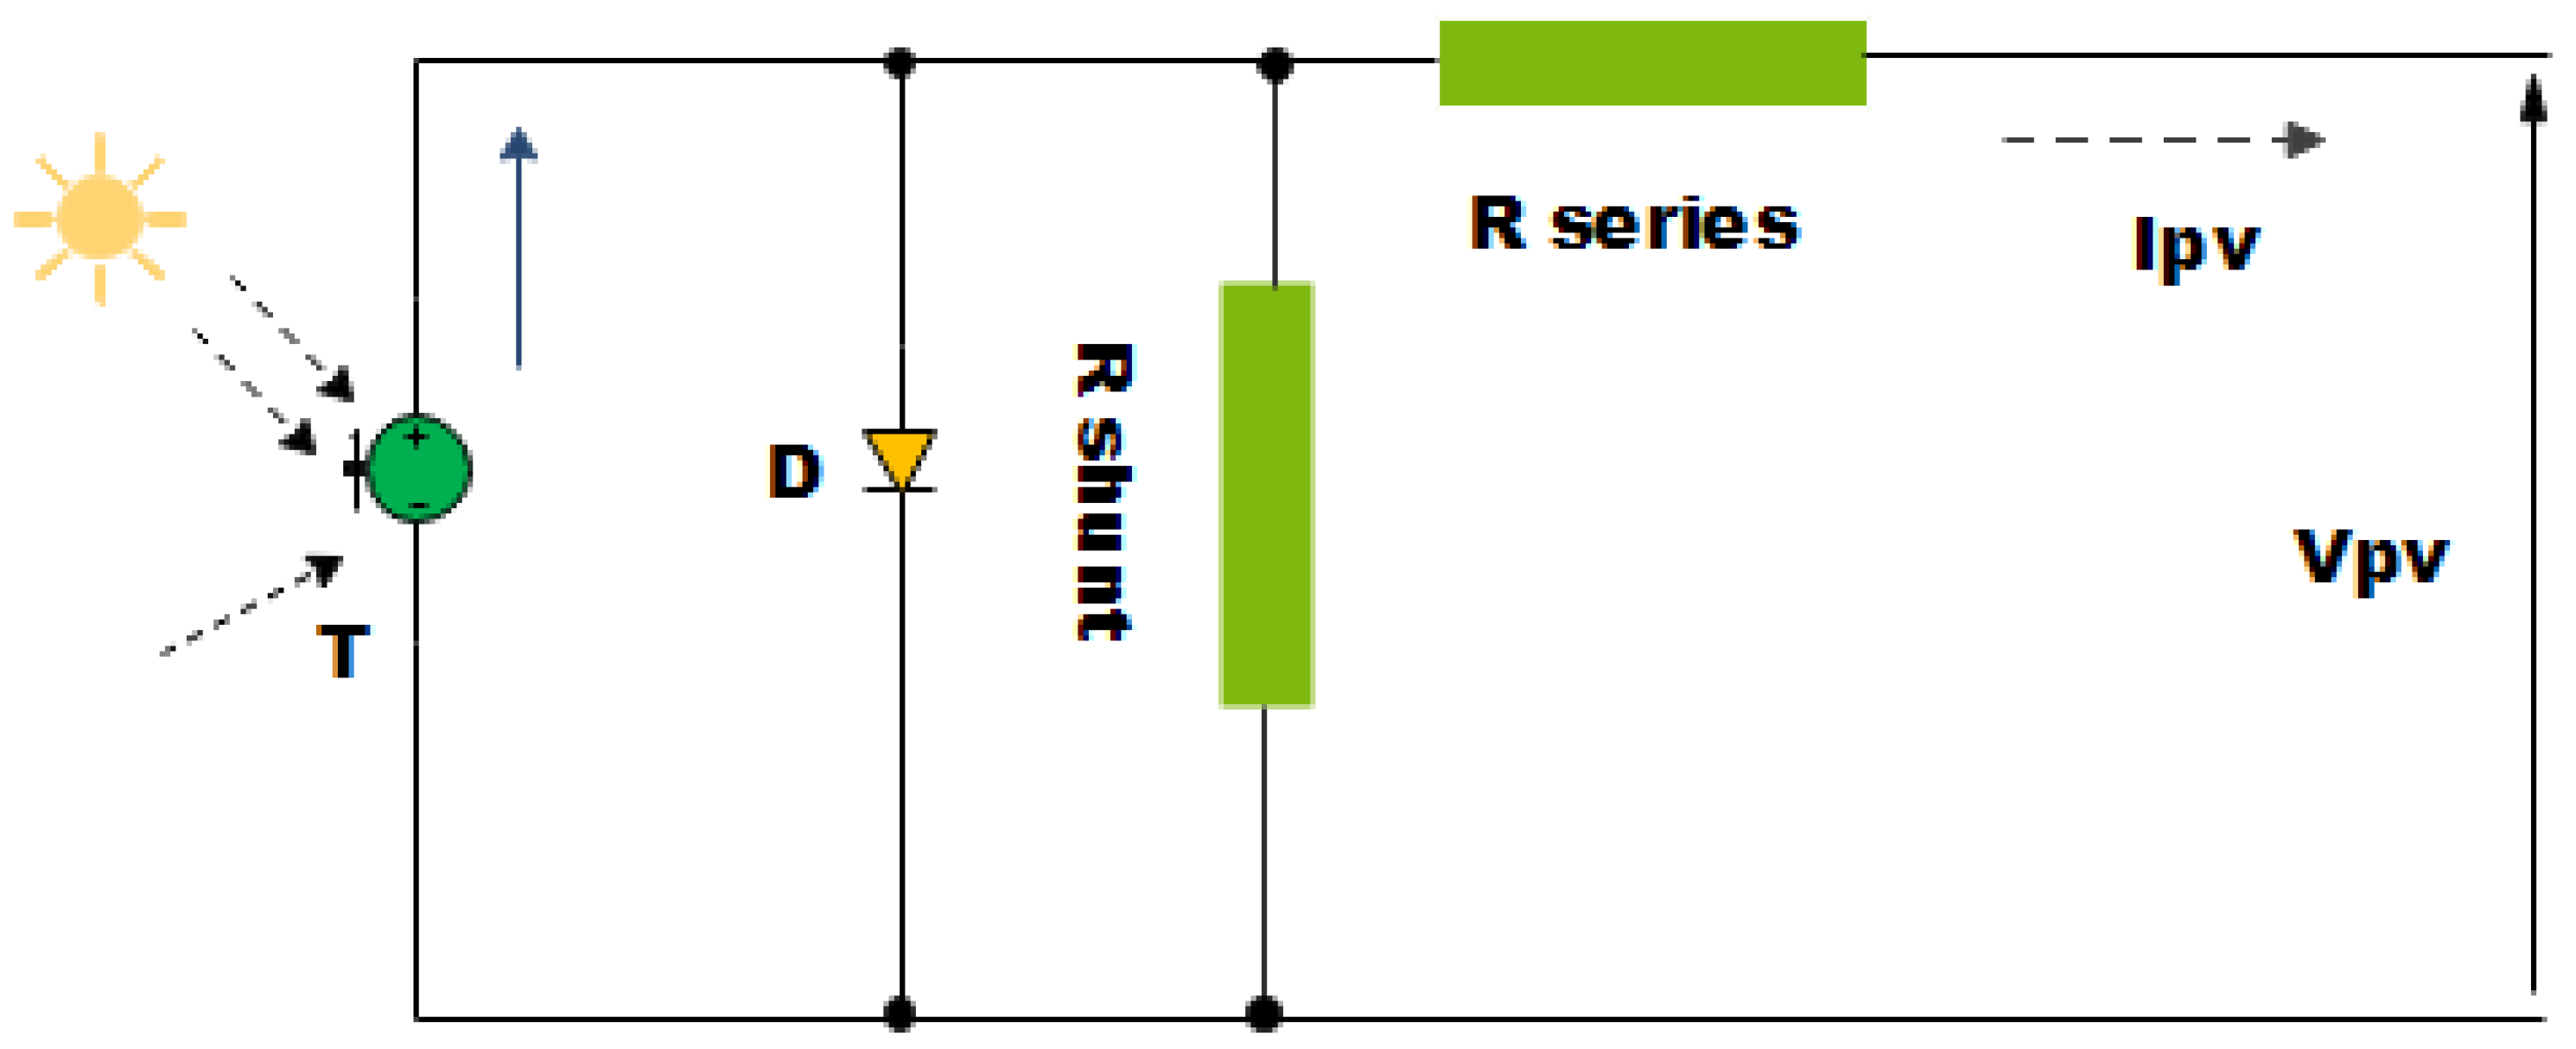
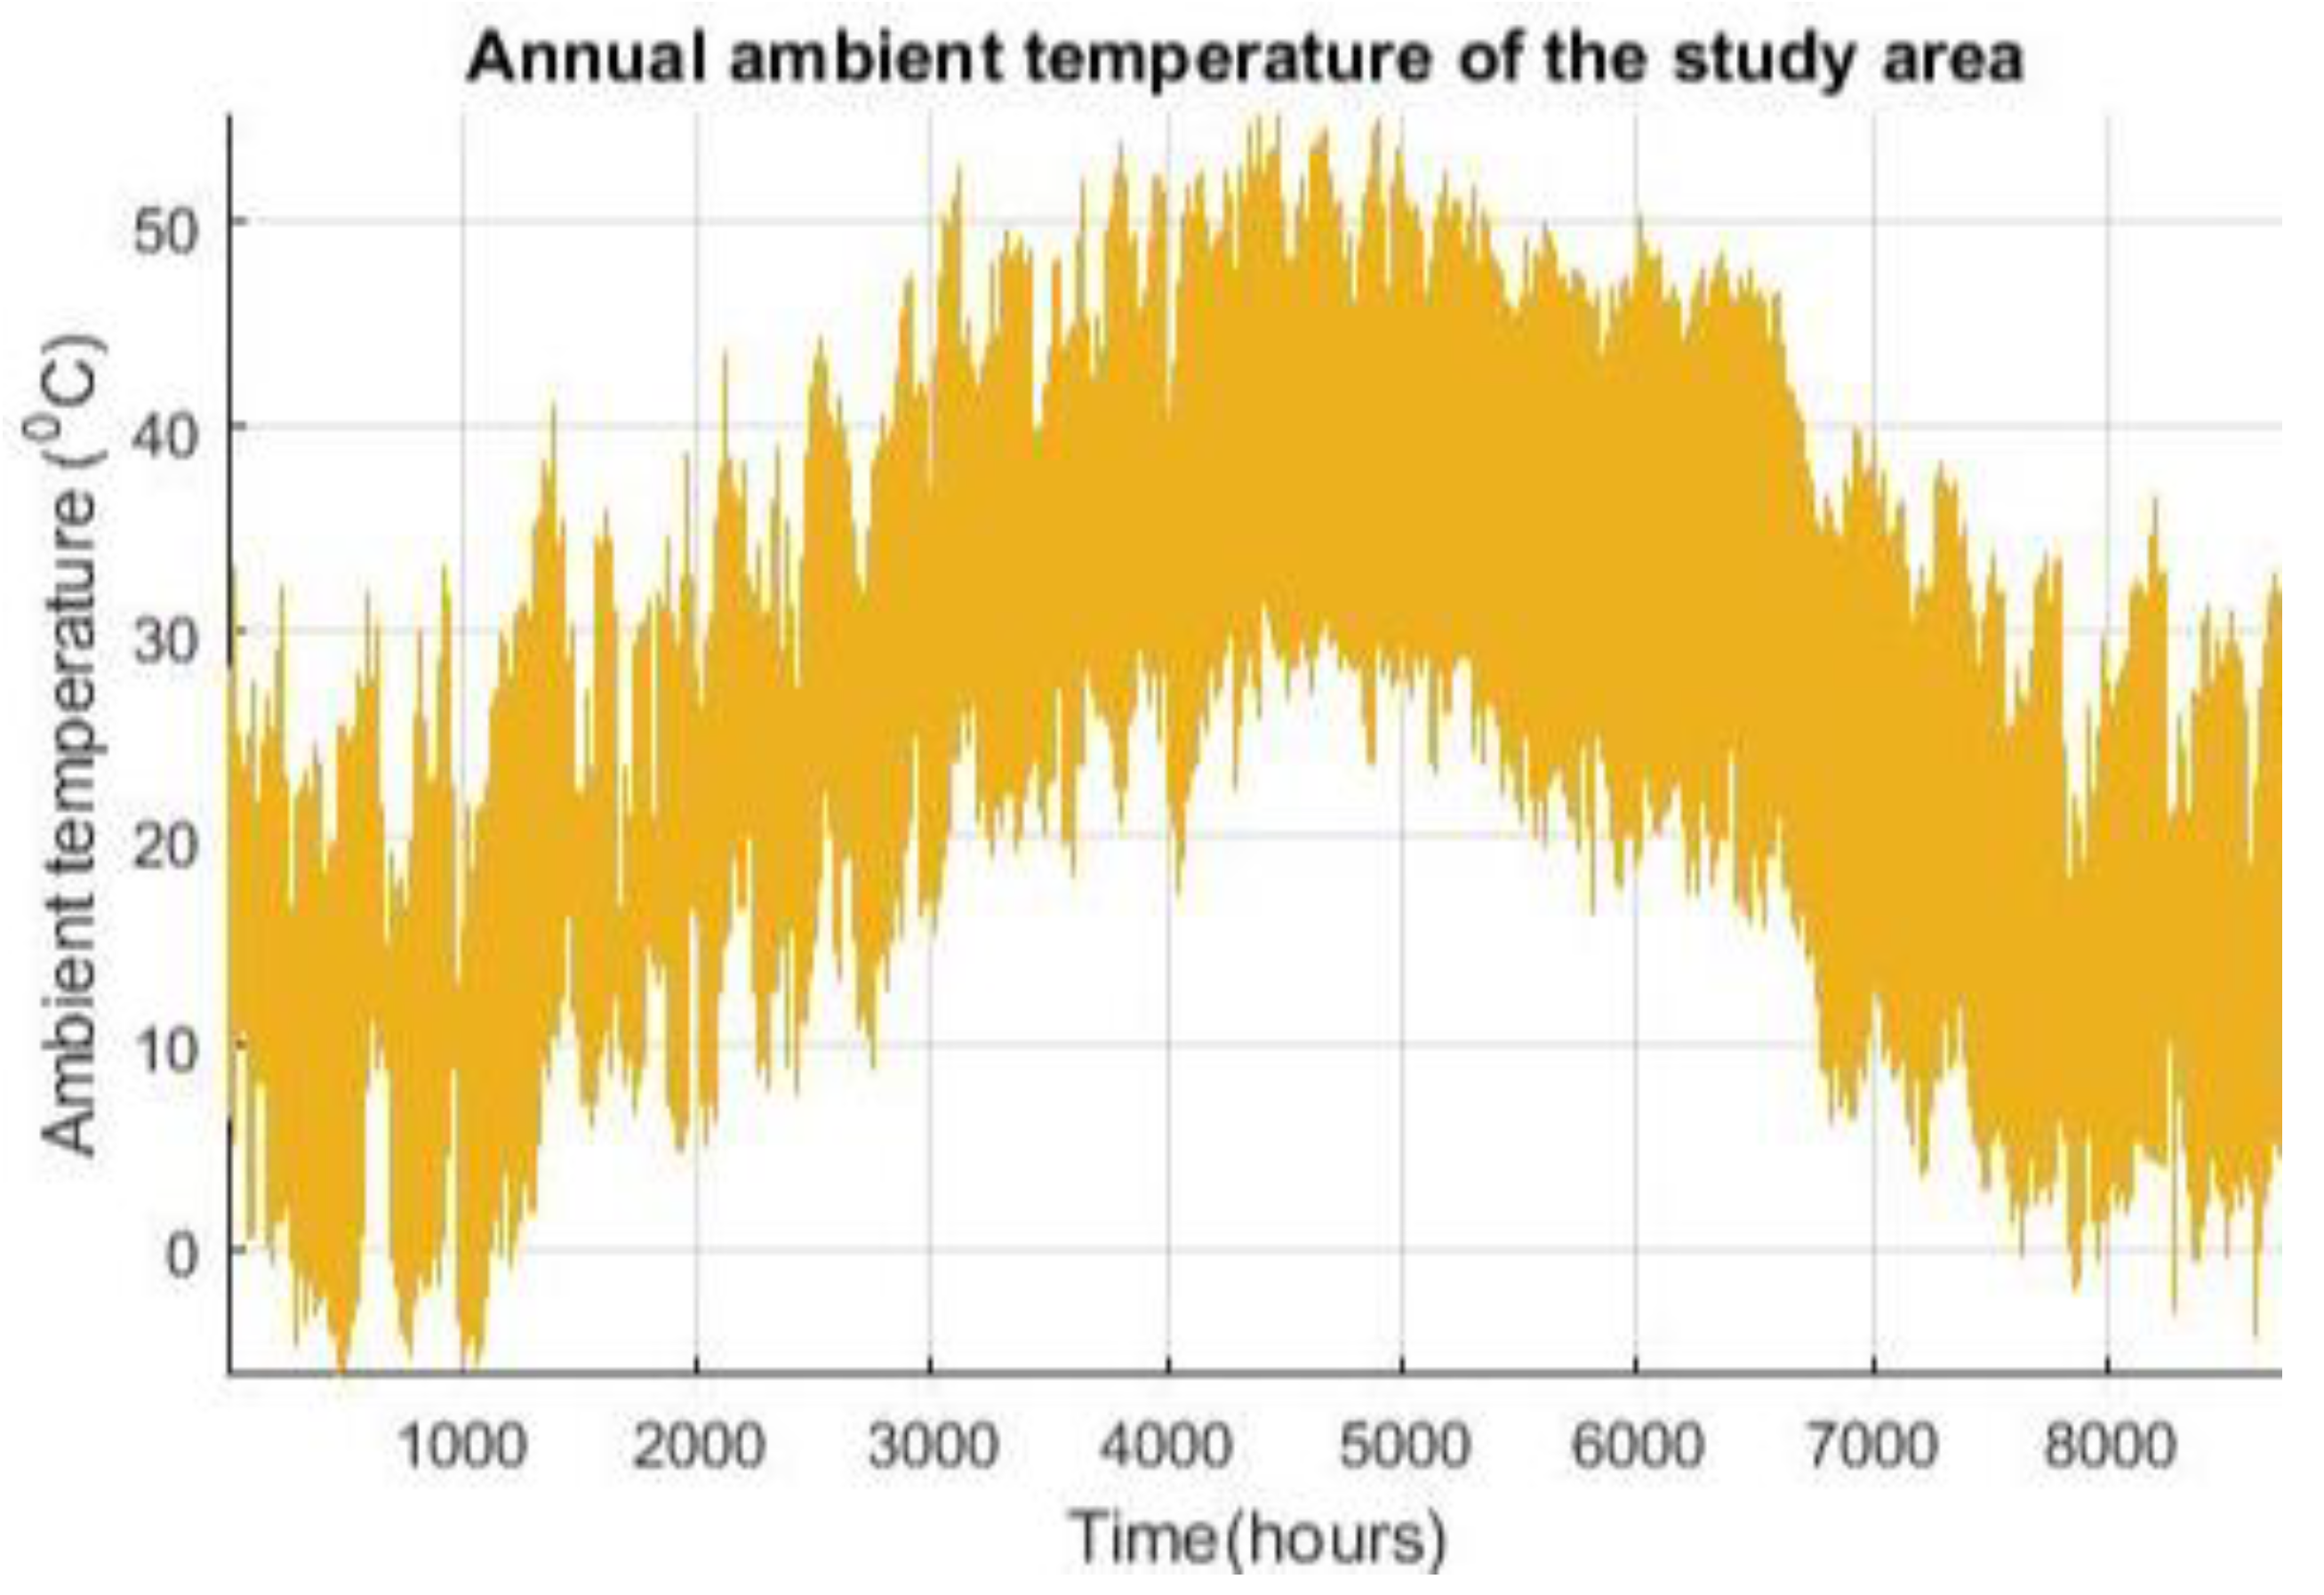
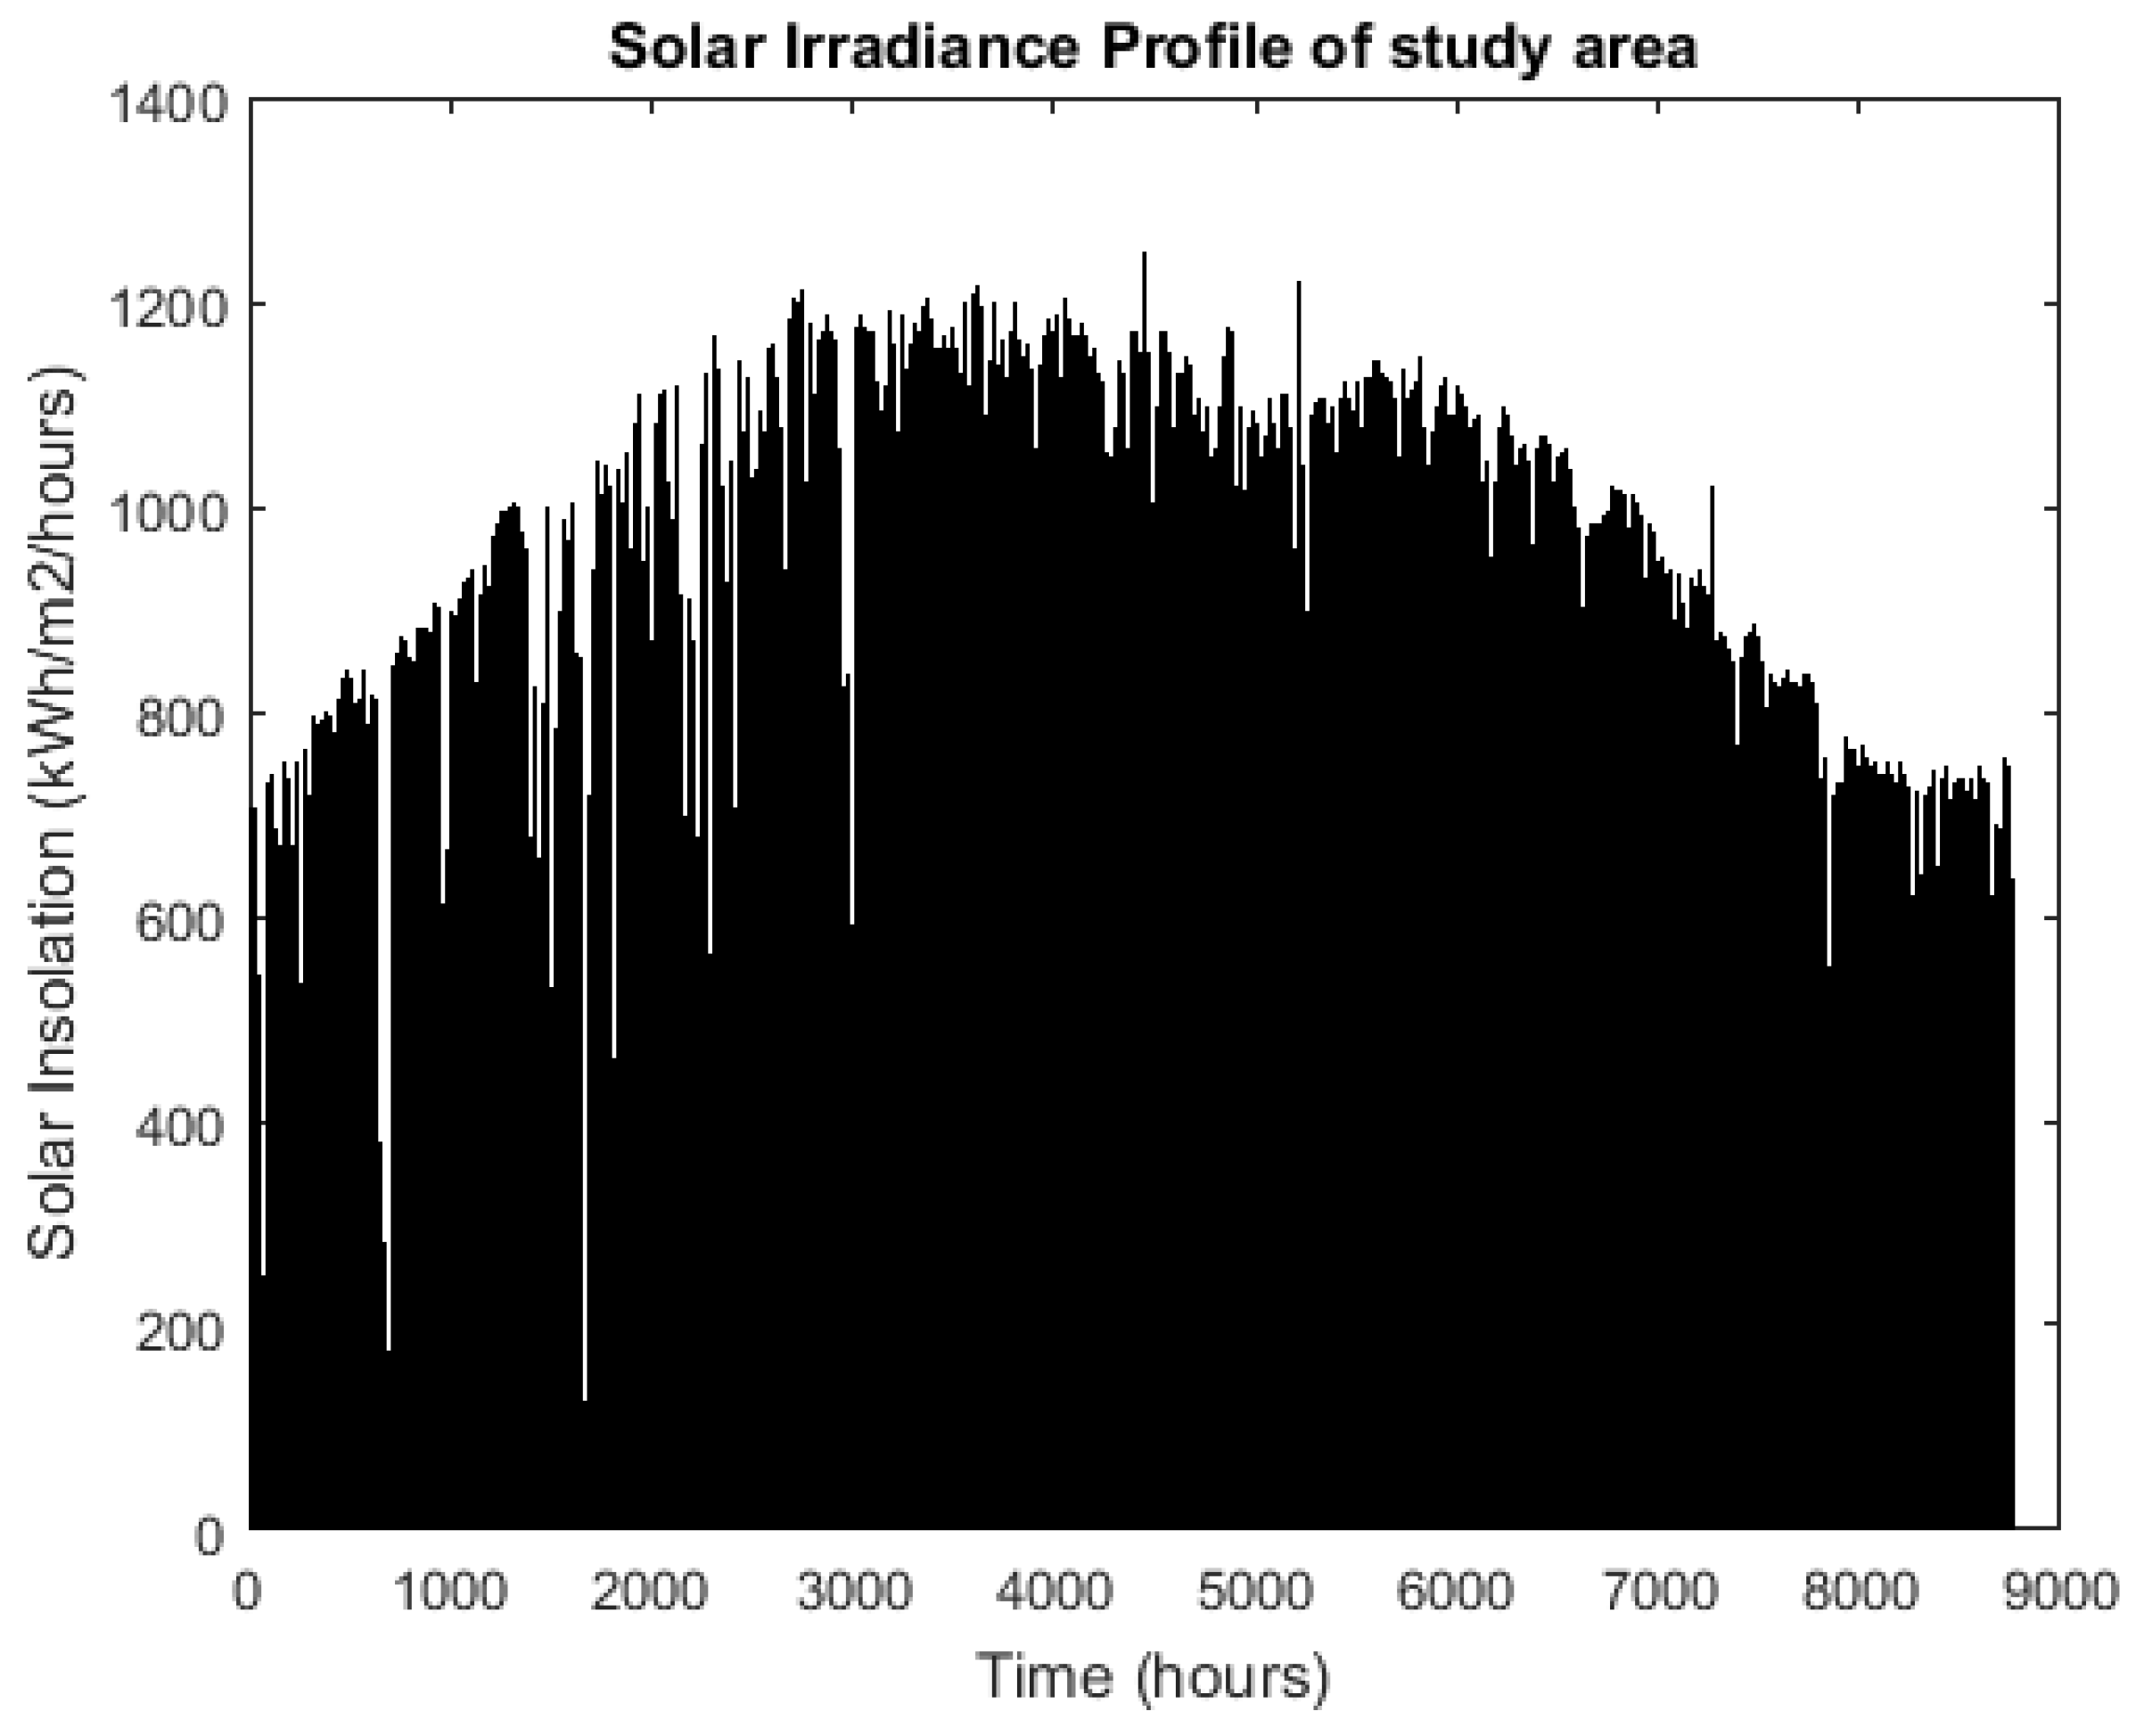
2.1. Modelling of Photovoltaic Generator
2.2. Modelling of Energy Storage Stacks
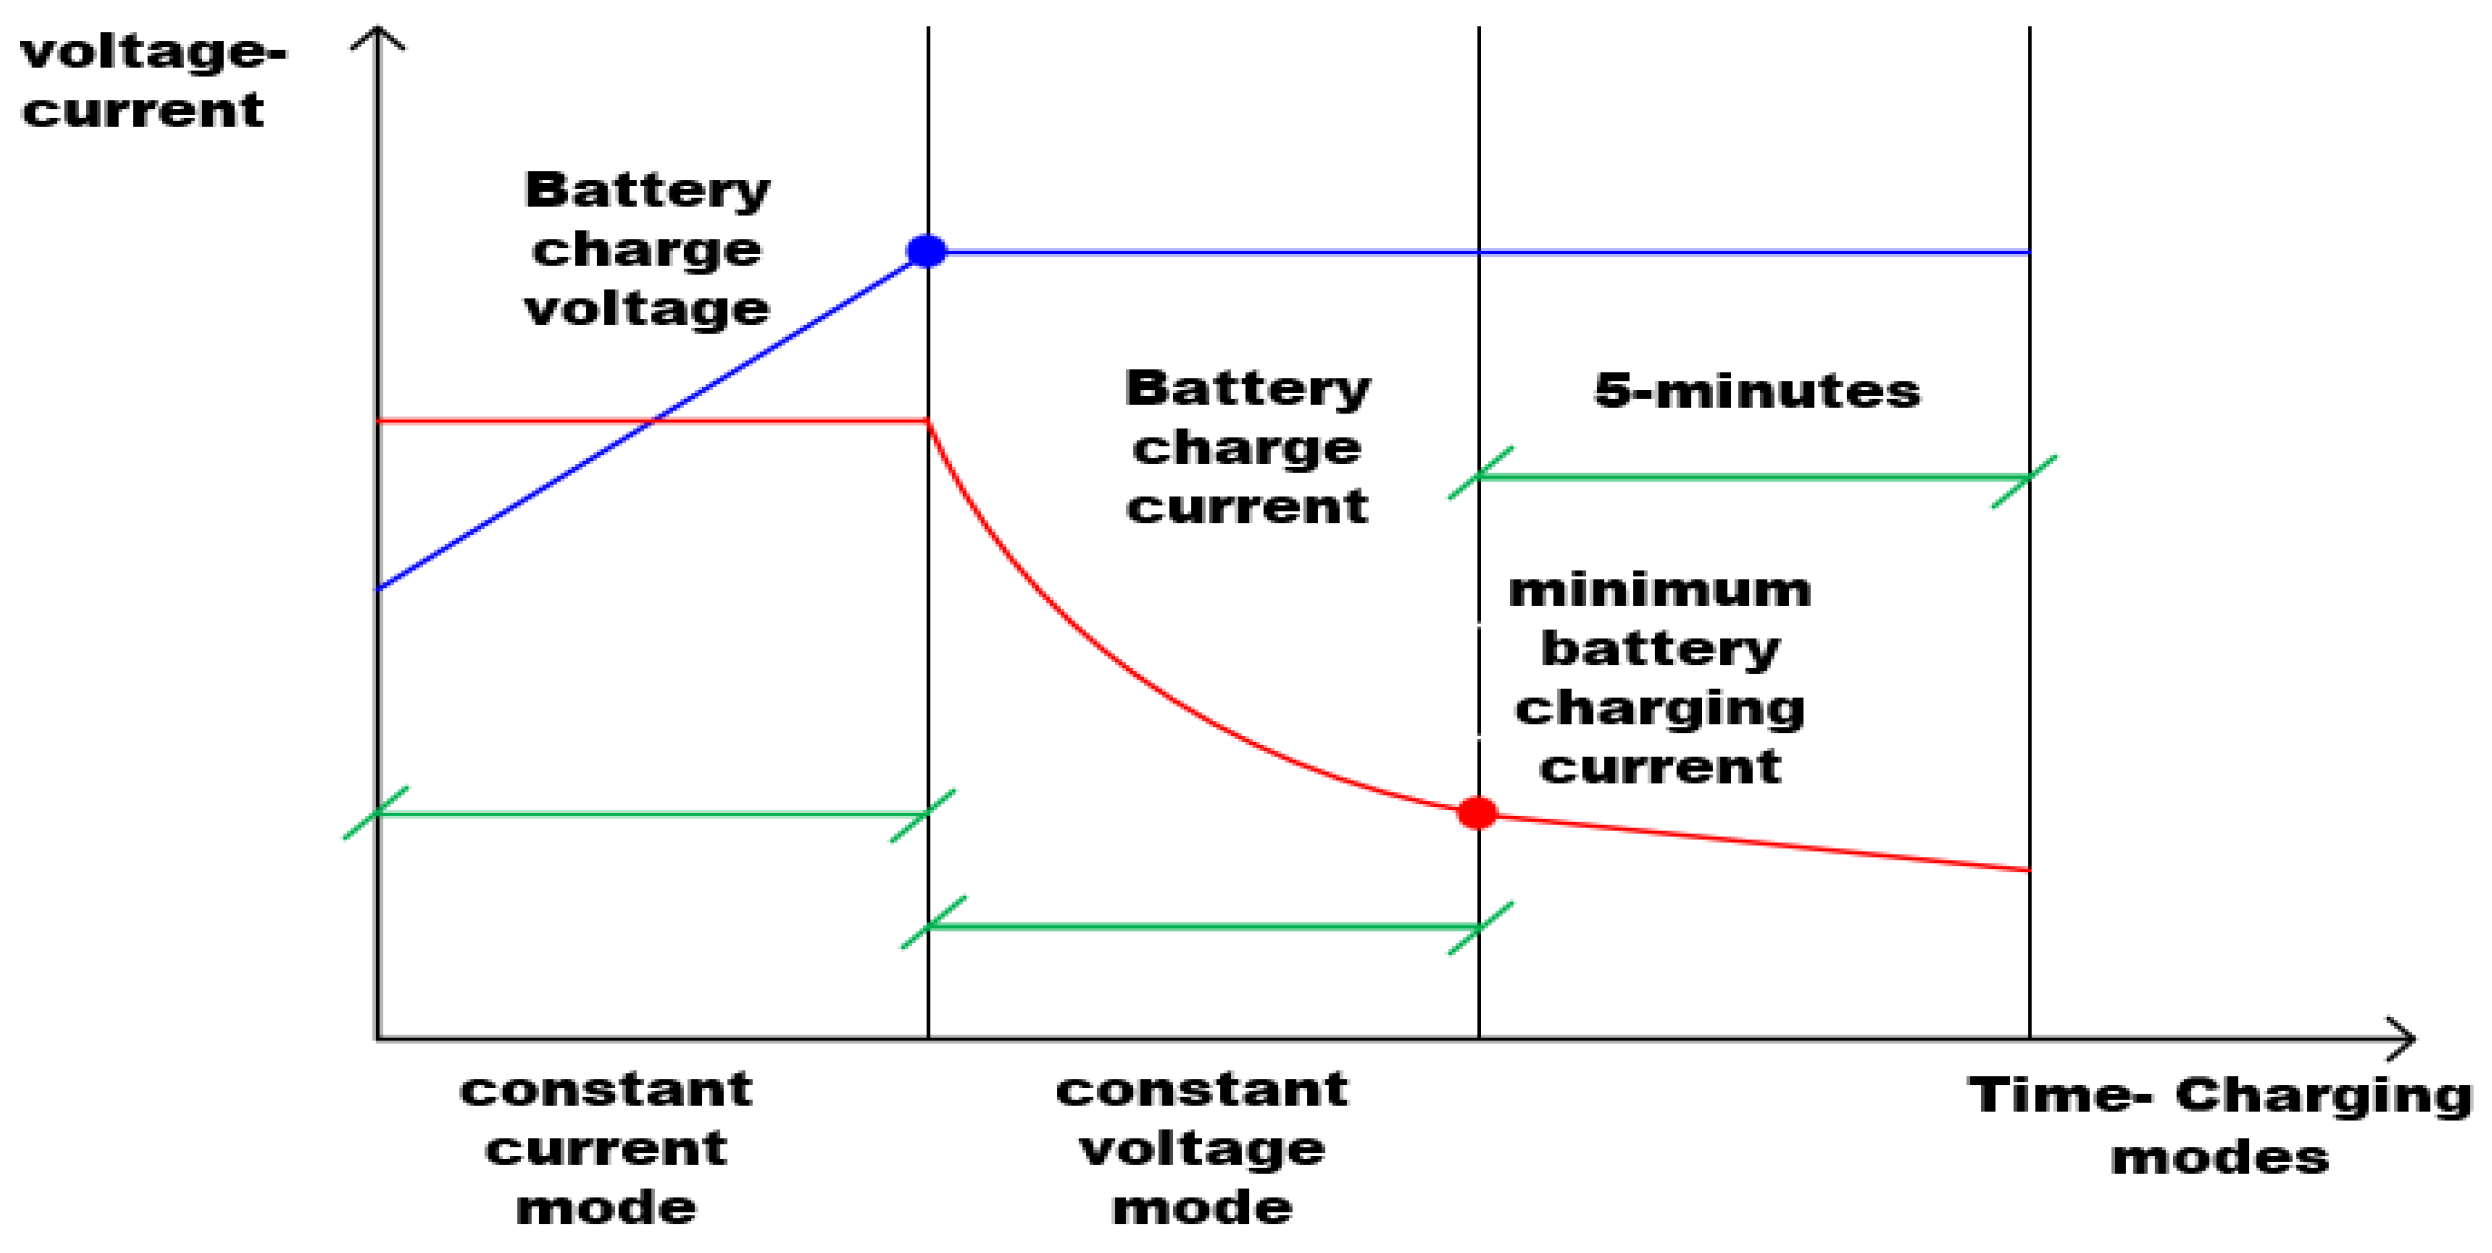
2.3. DC Fast Charger
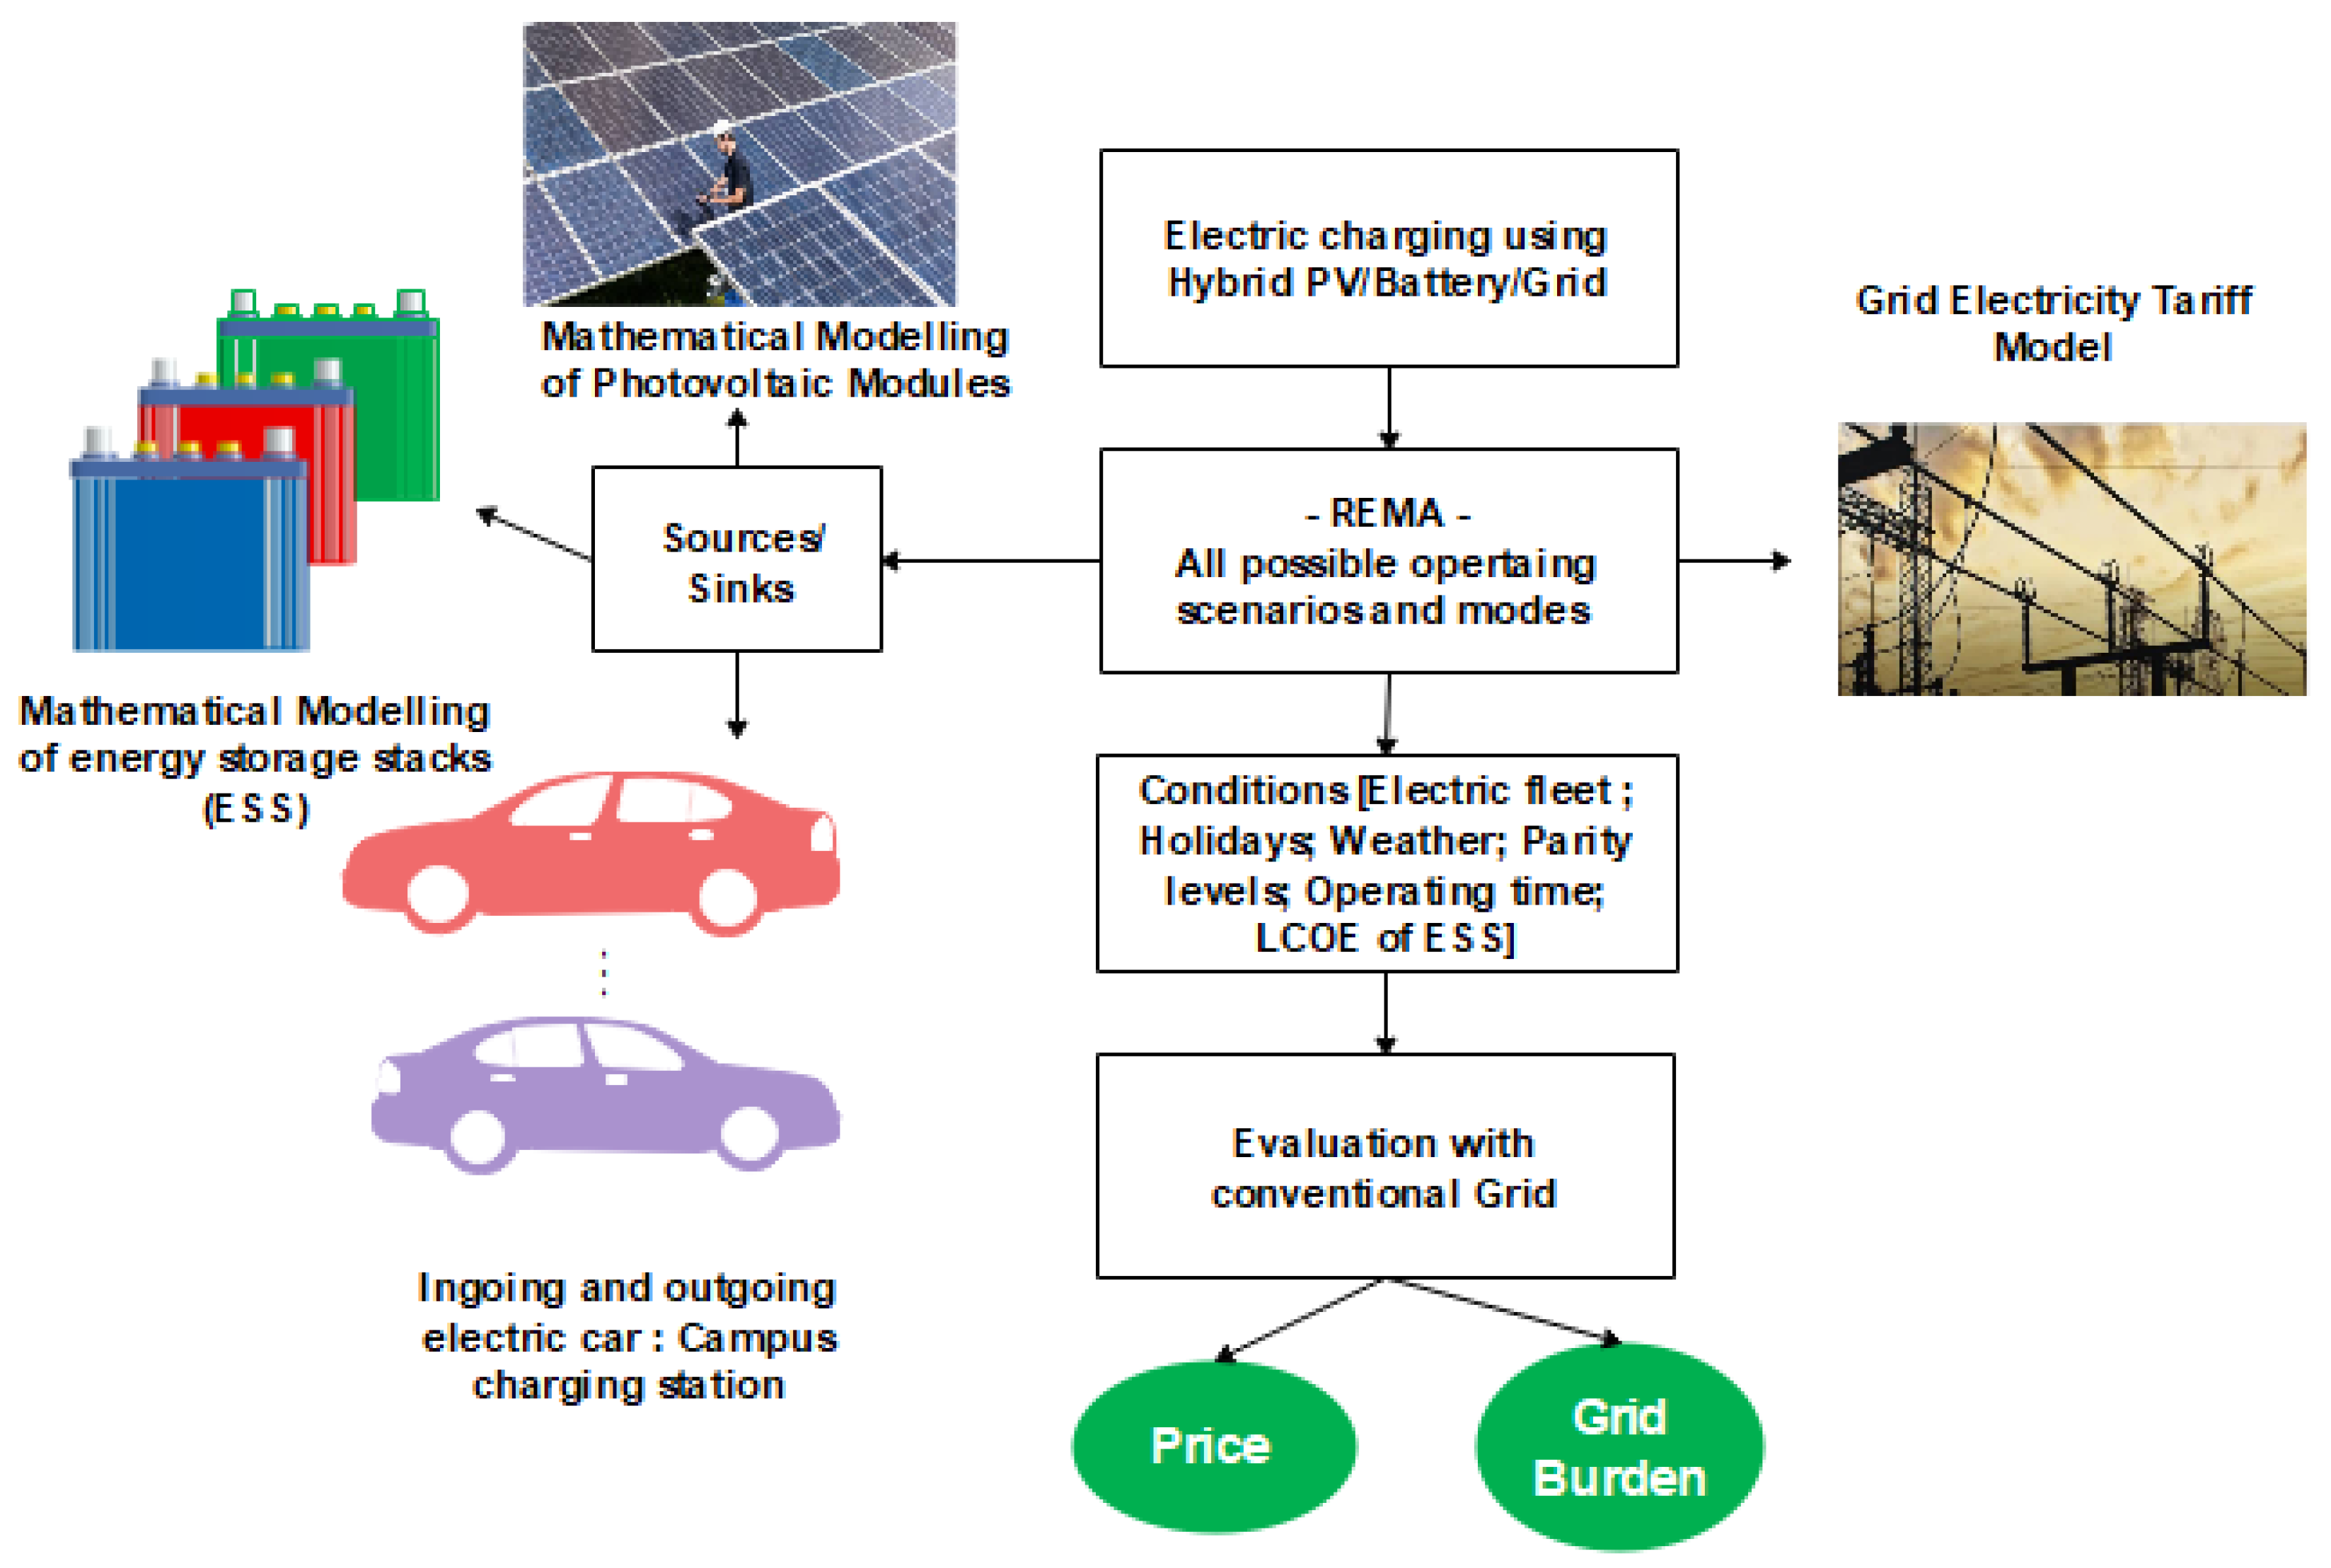
3. Research Methodology
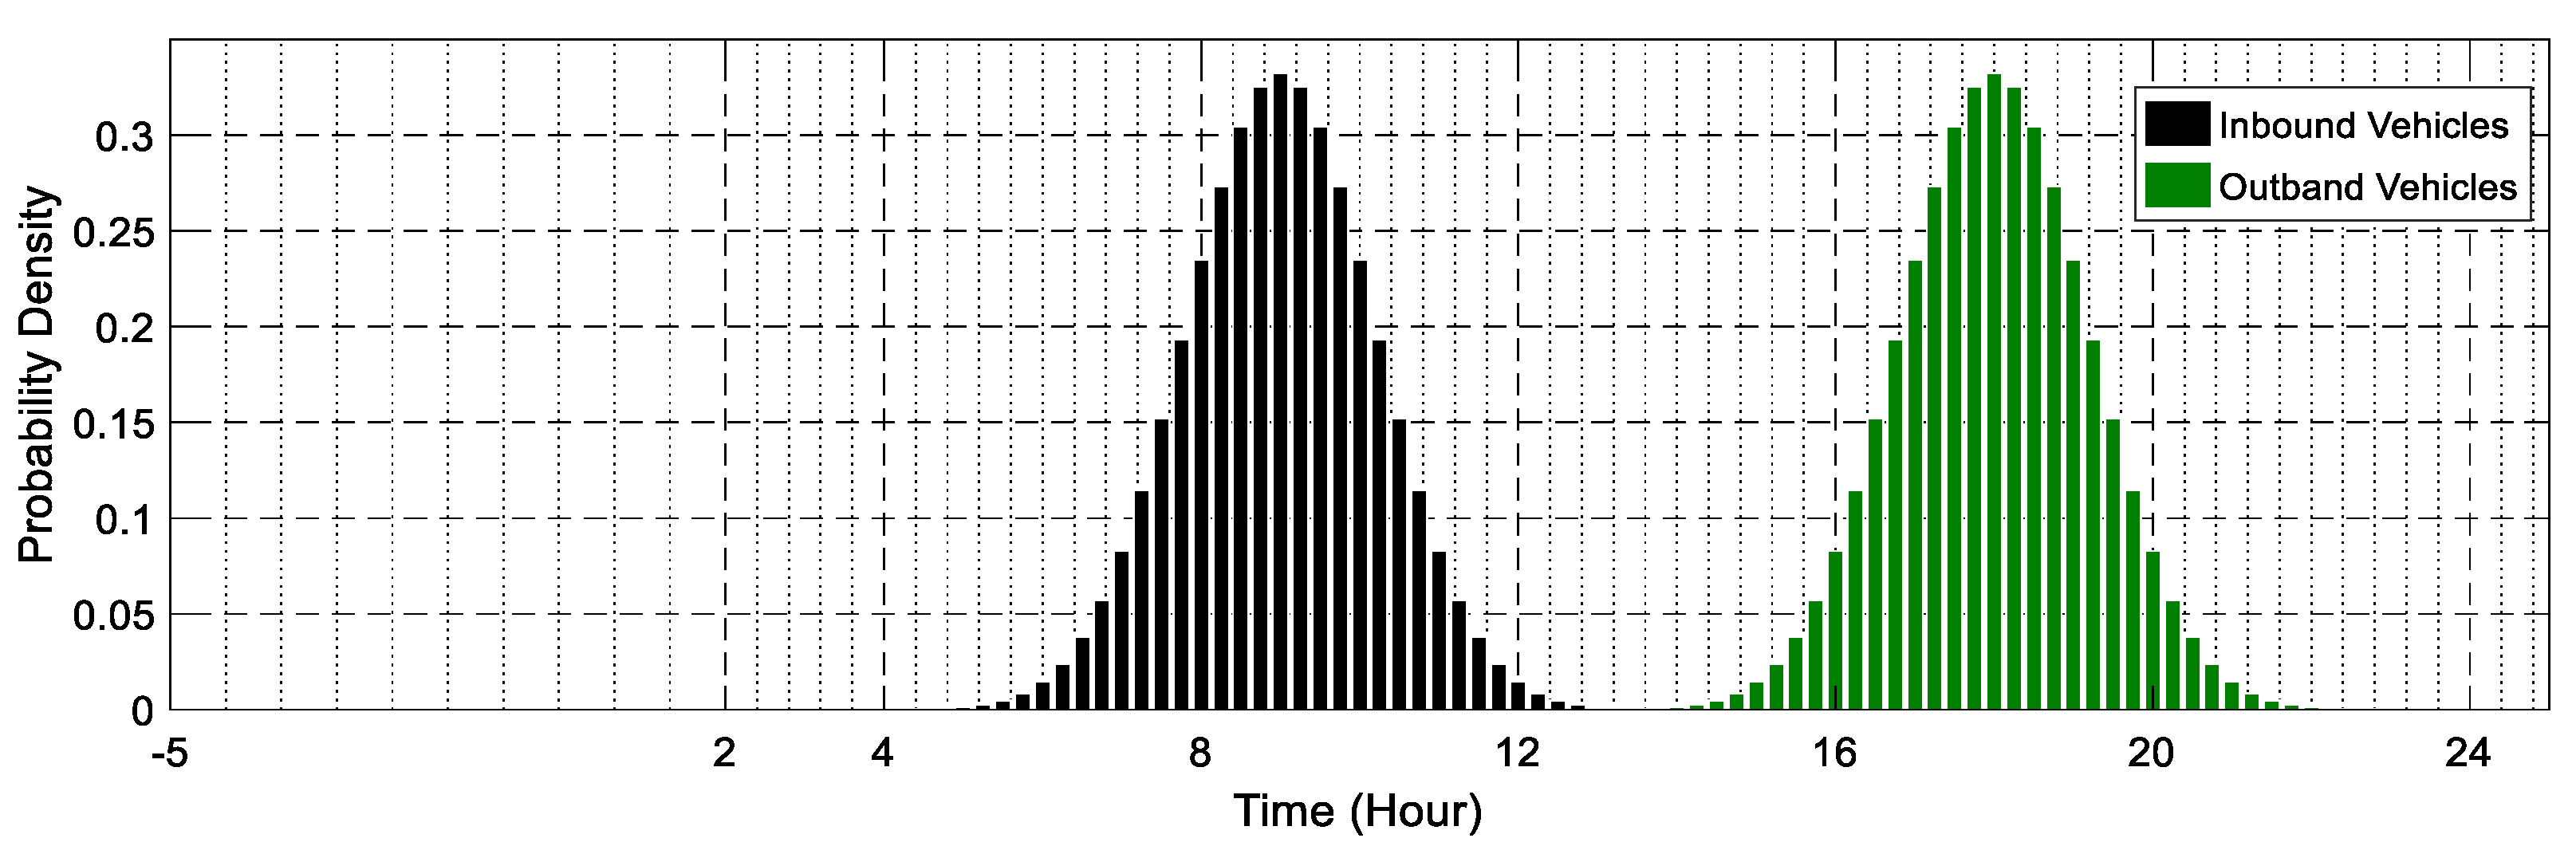
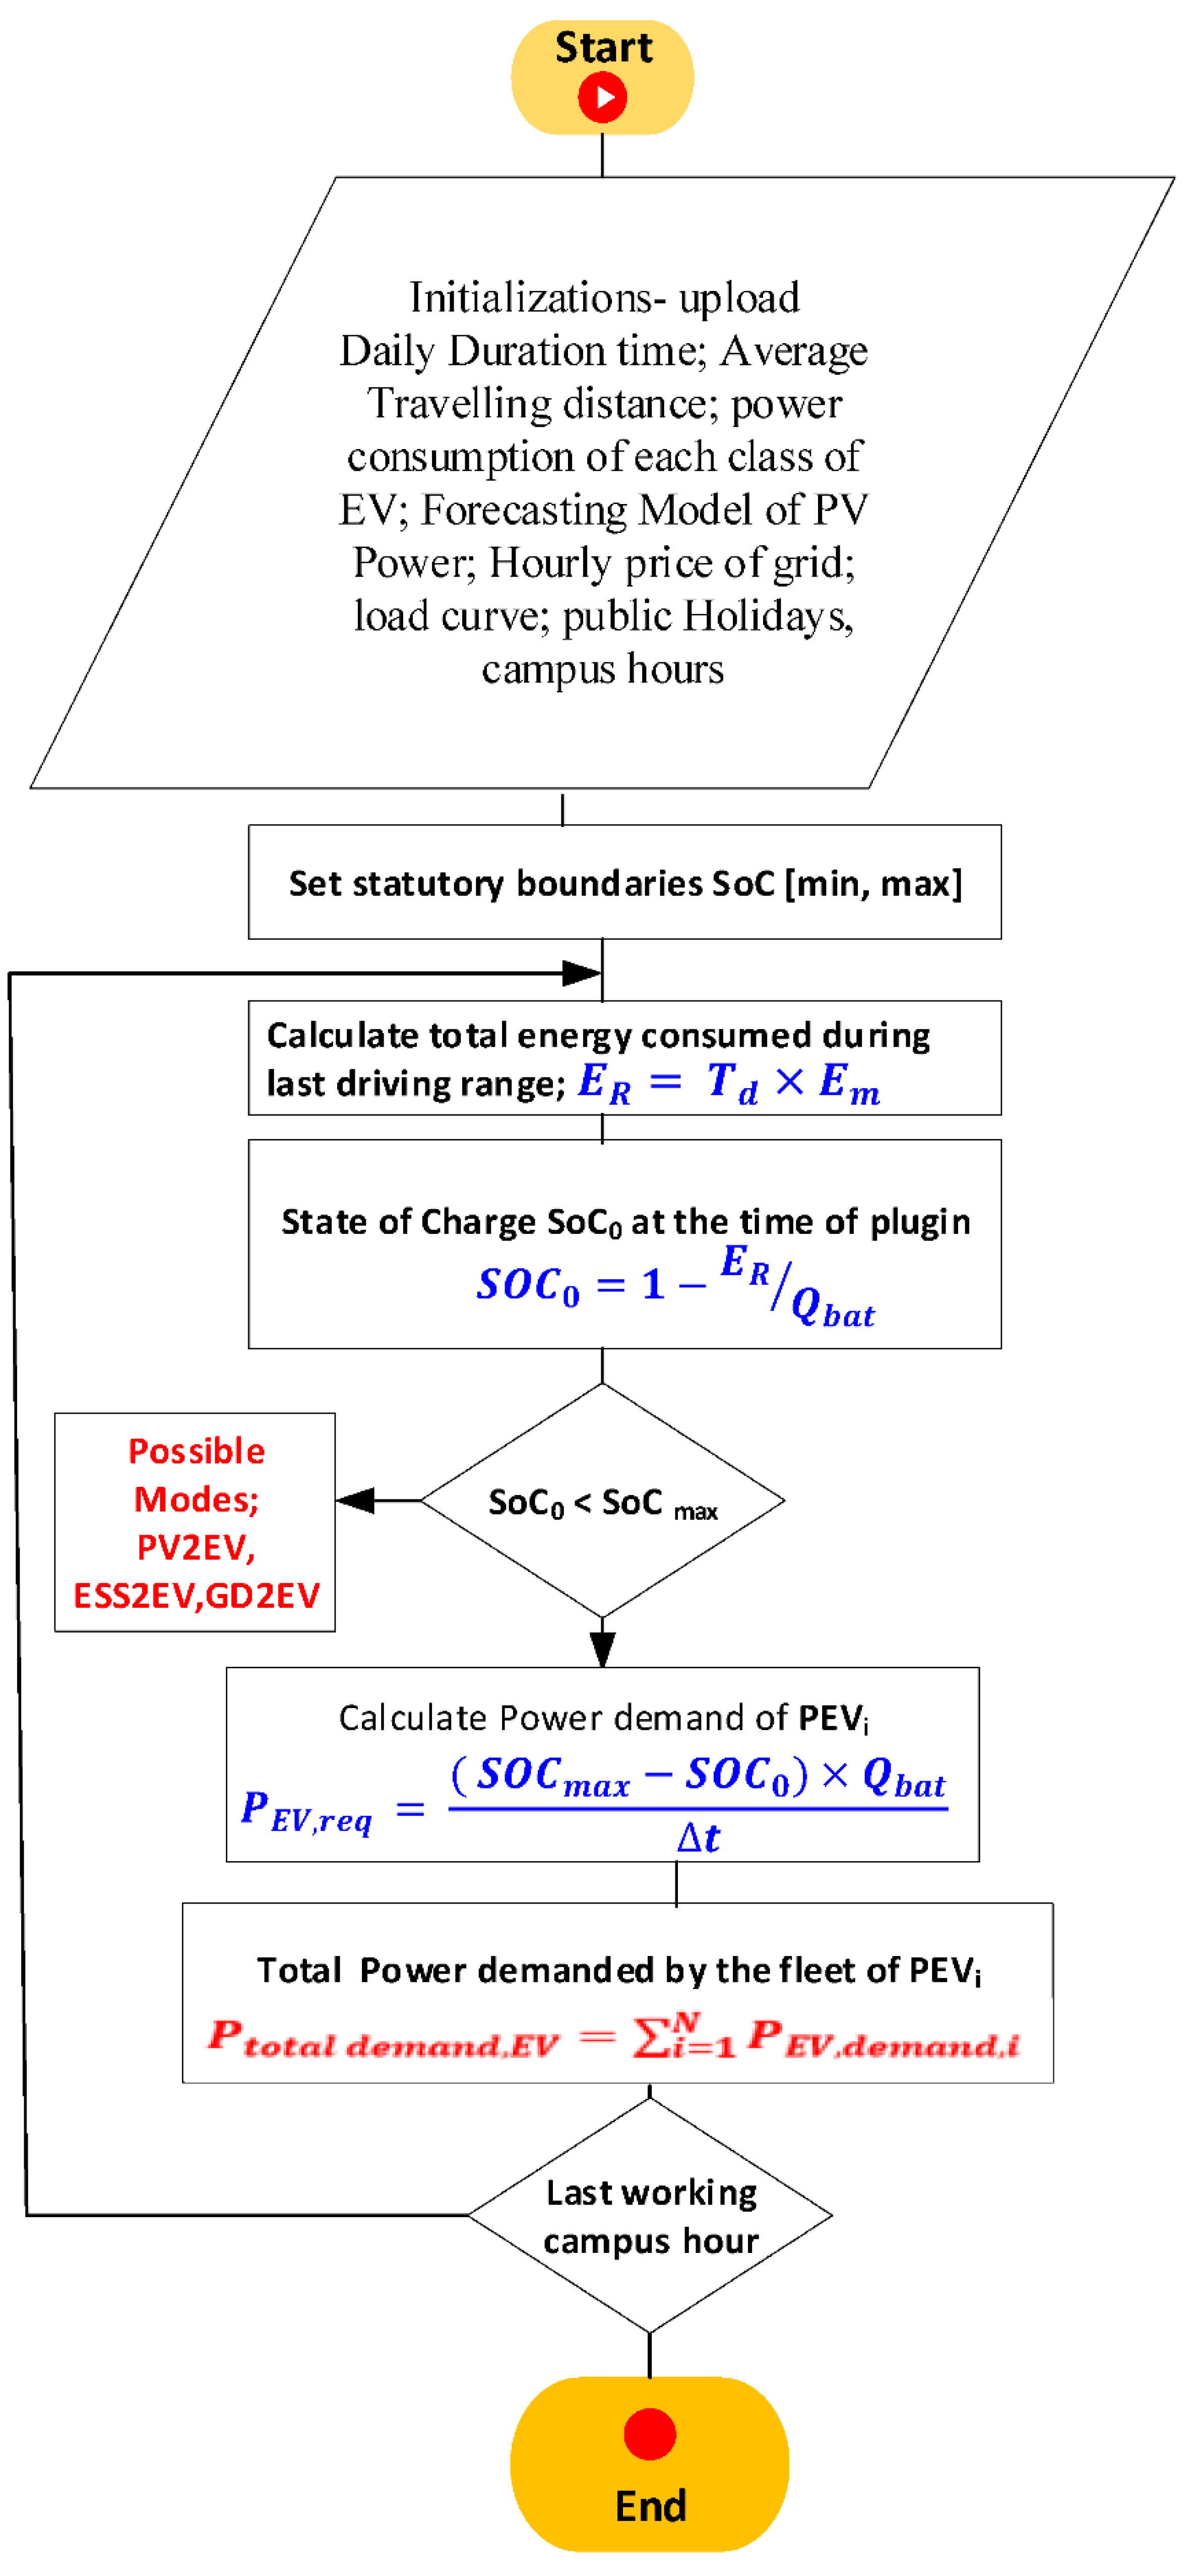
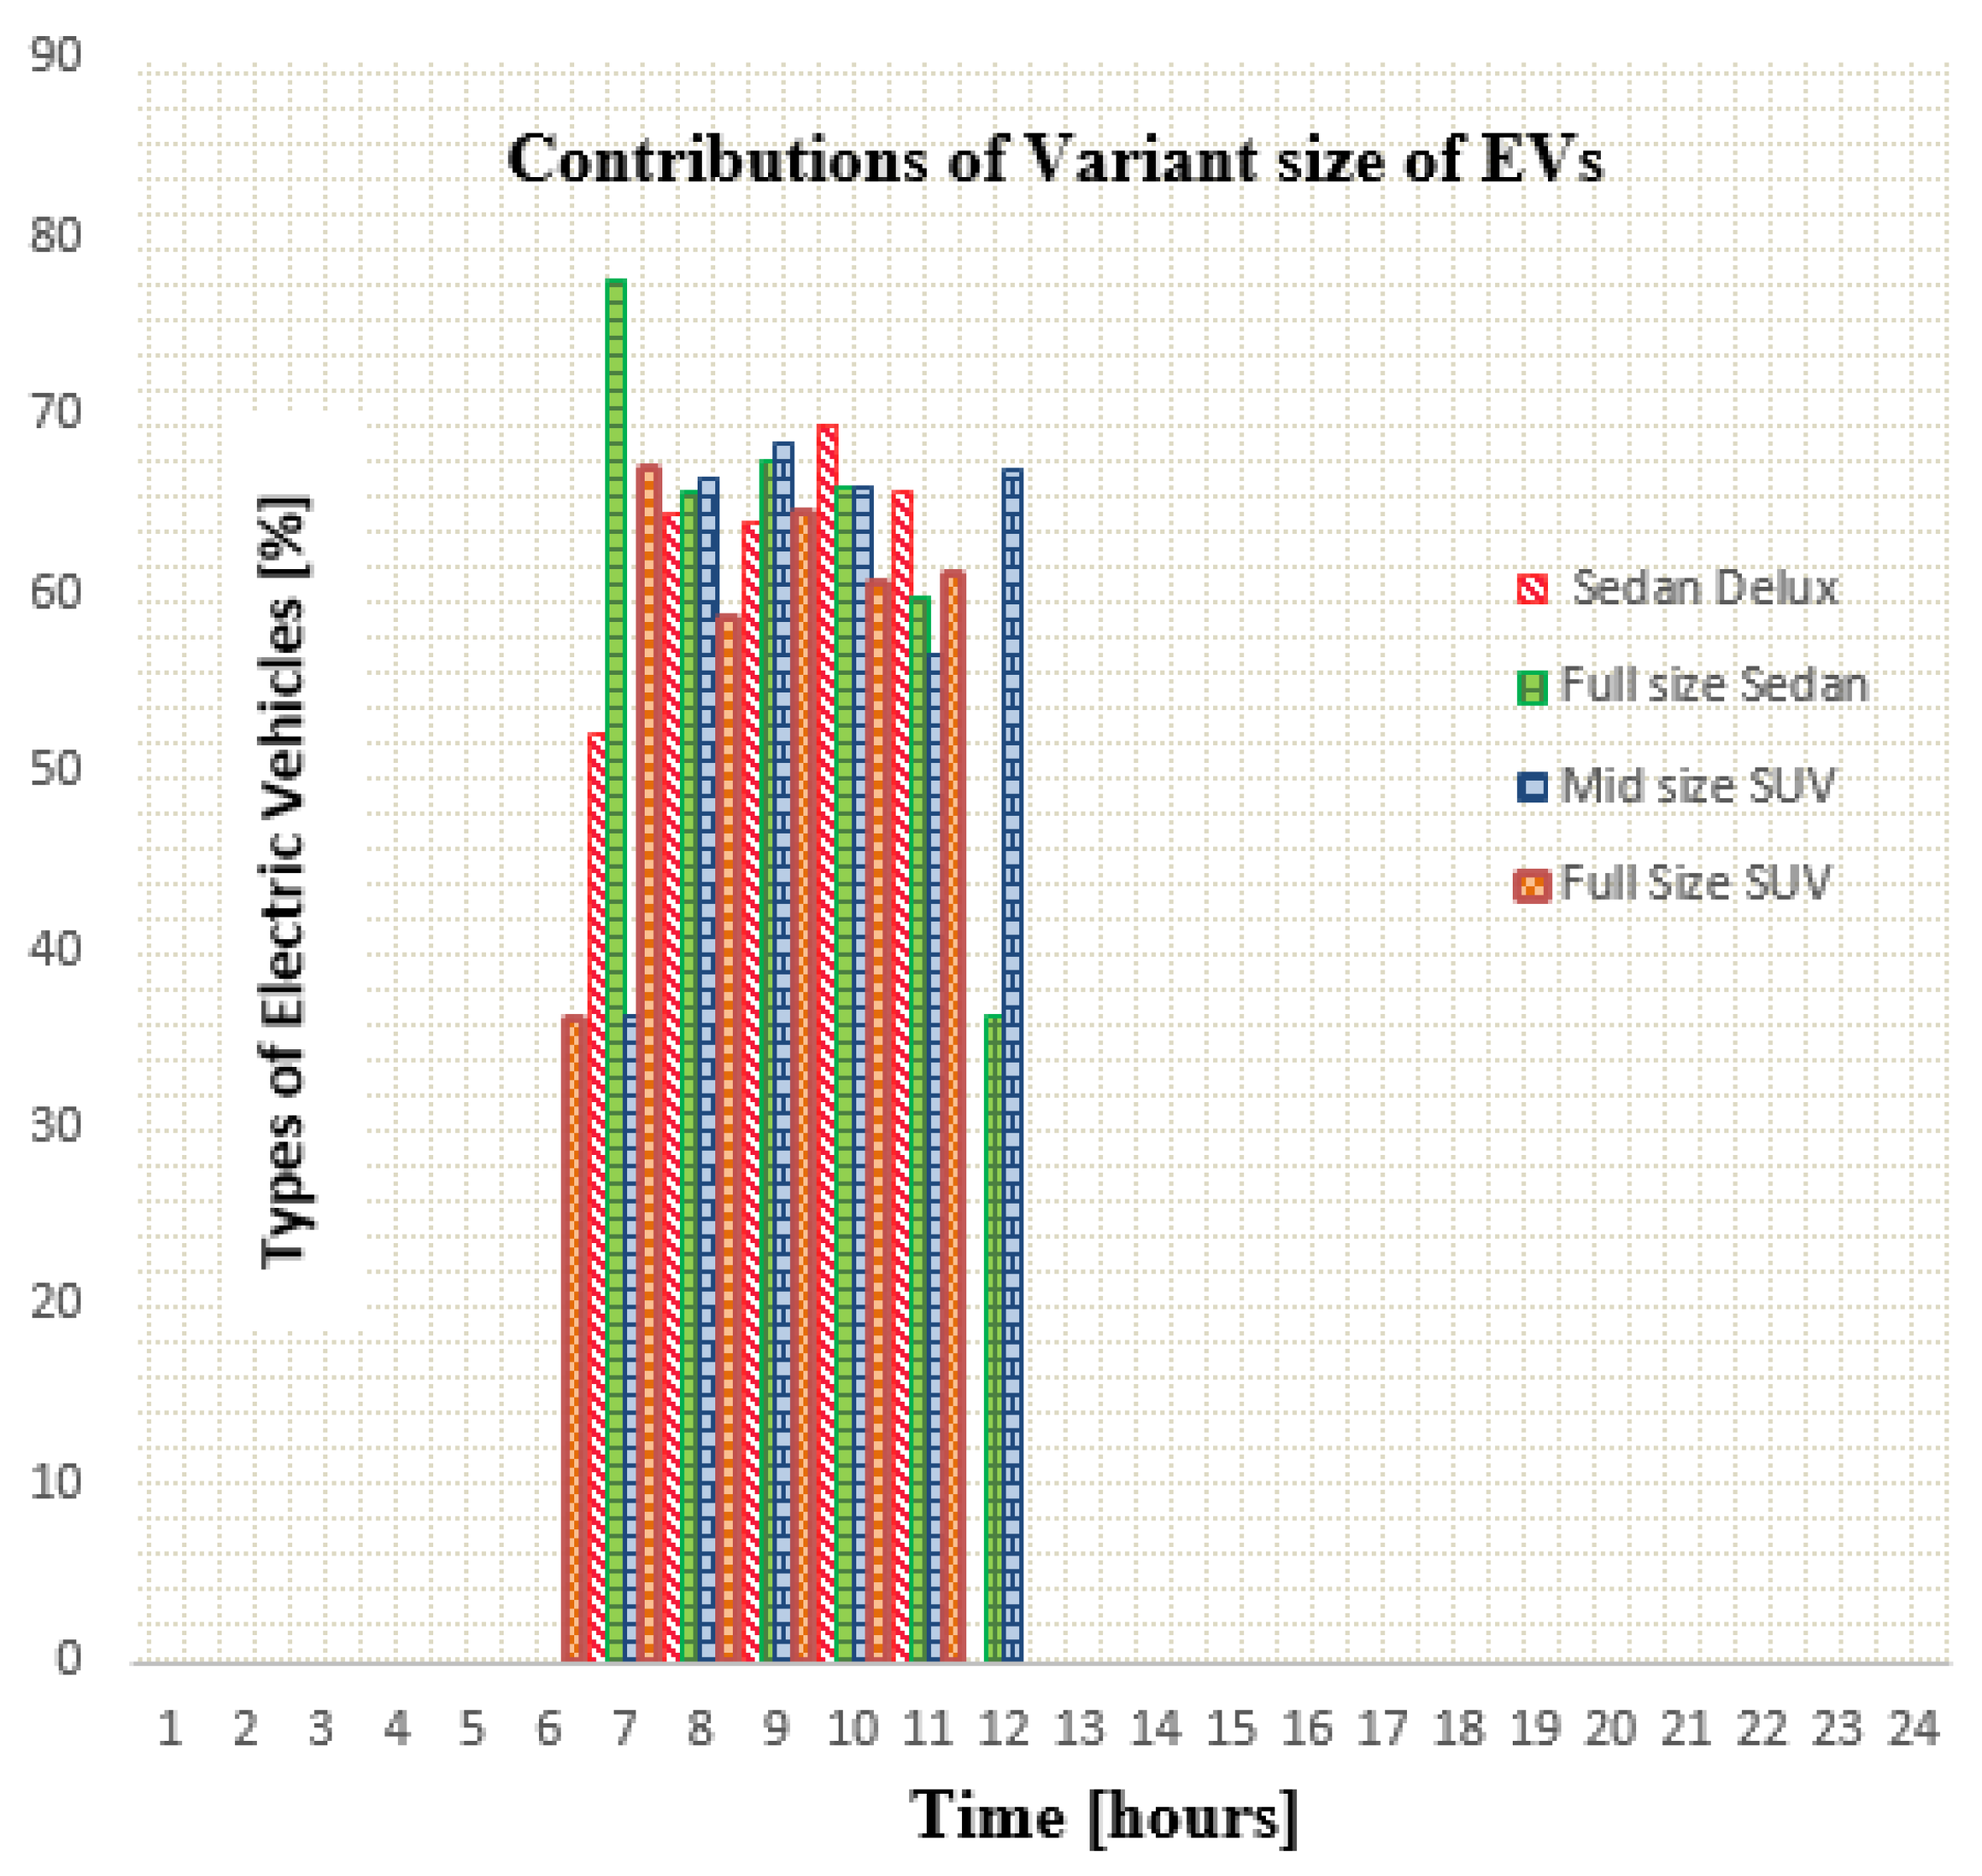
3.1. Modeling of Electric Vehicle Power Demand
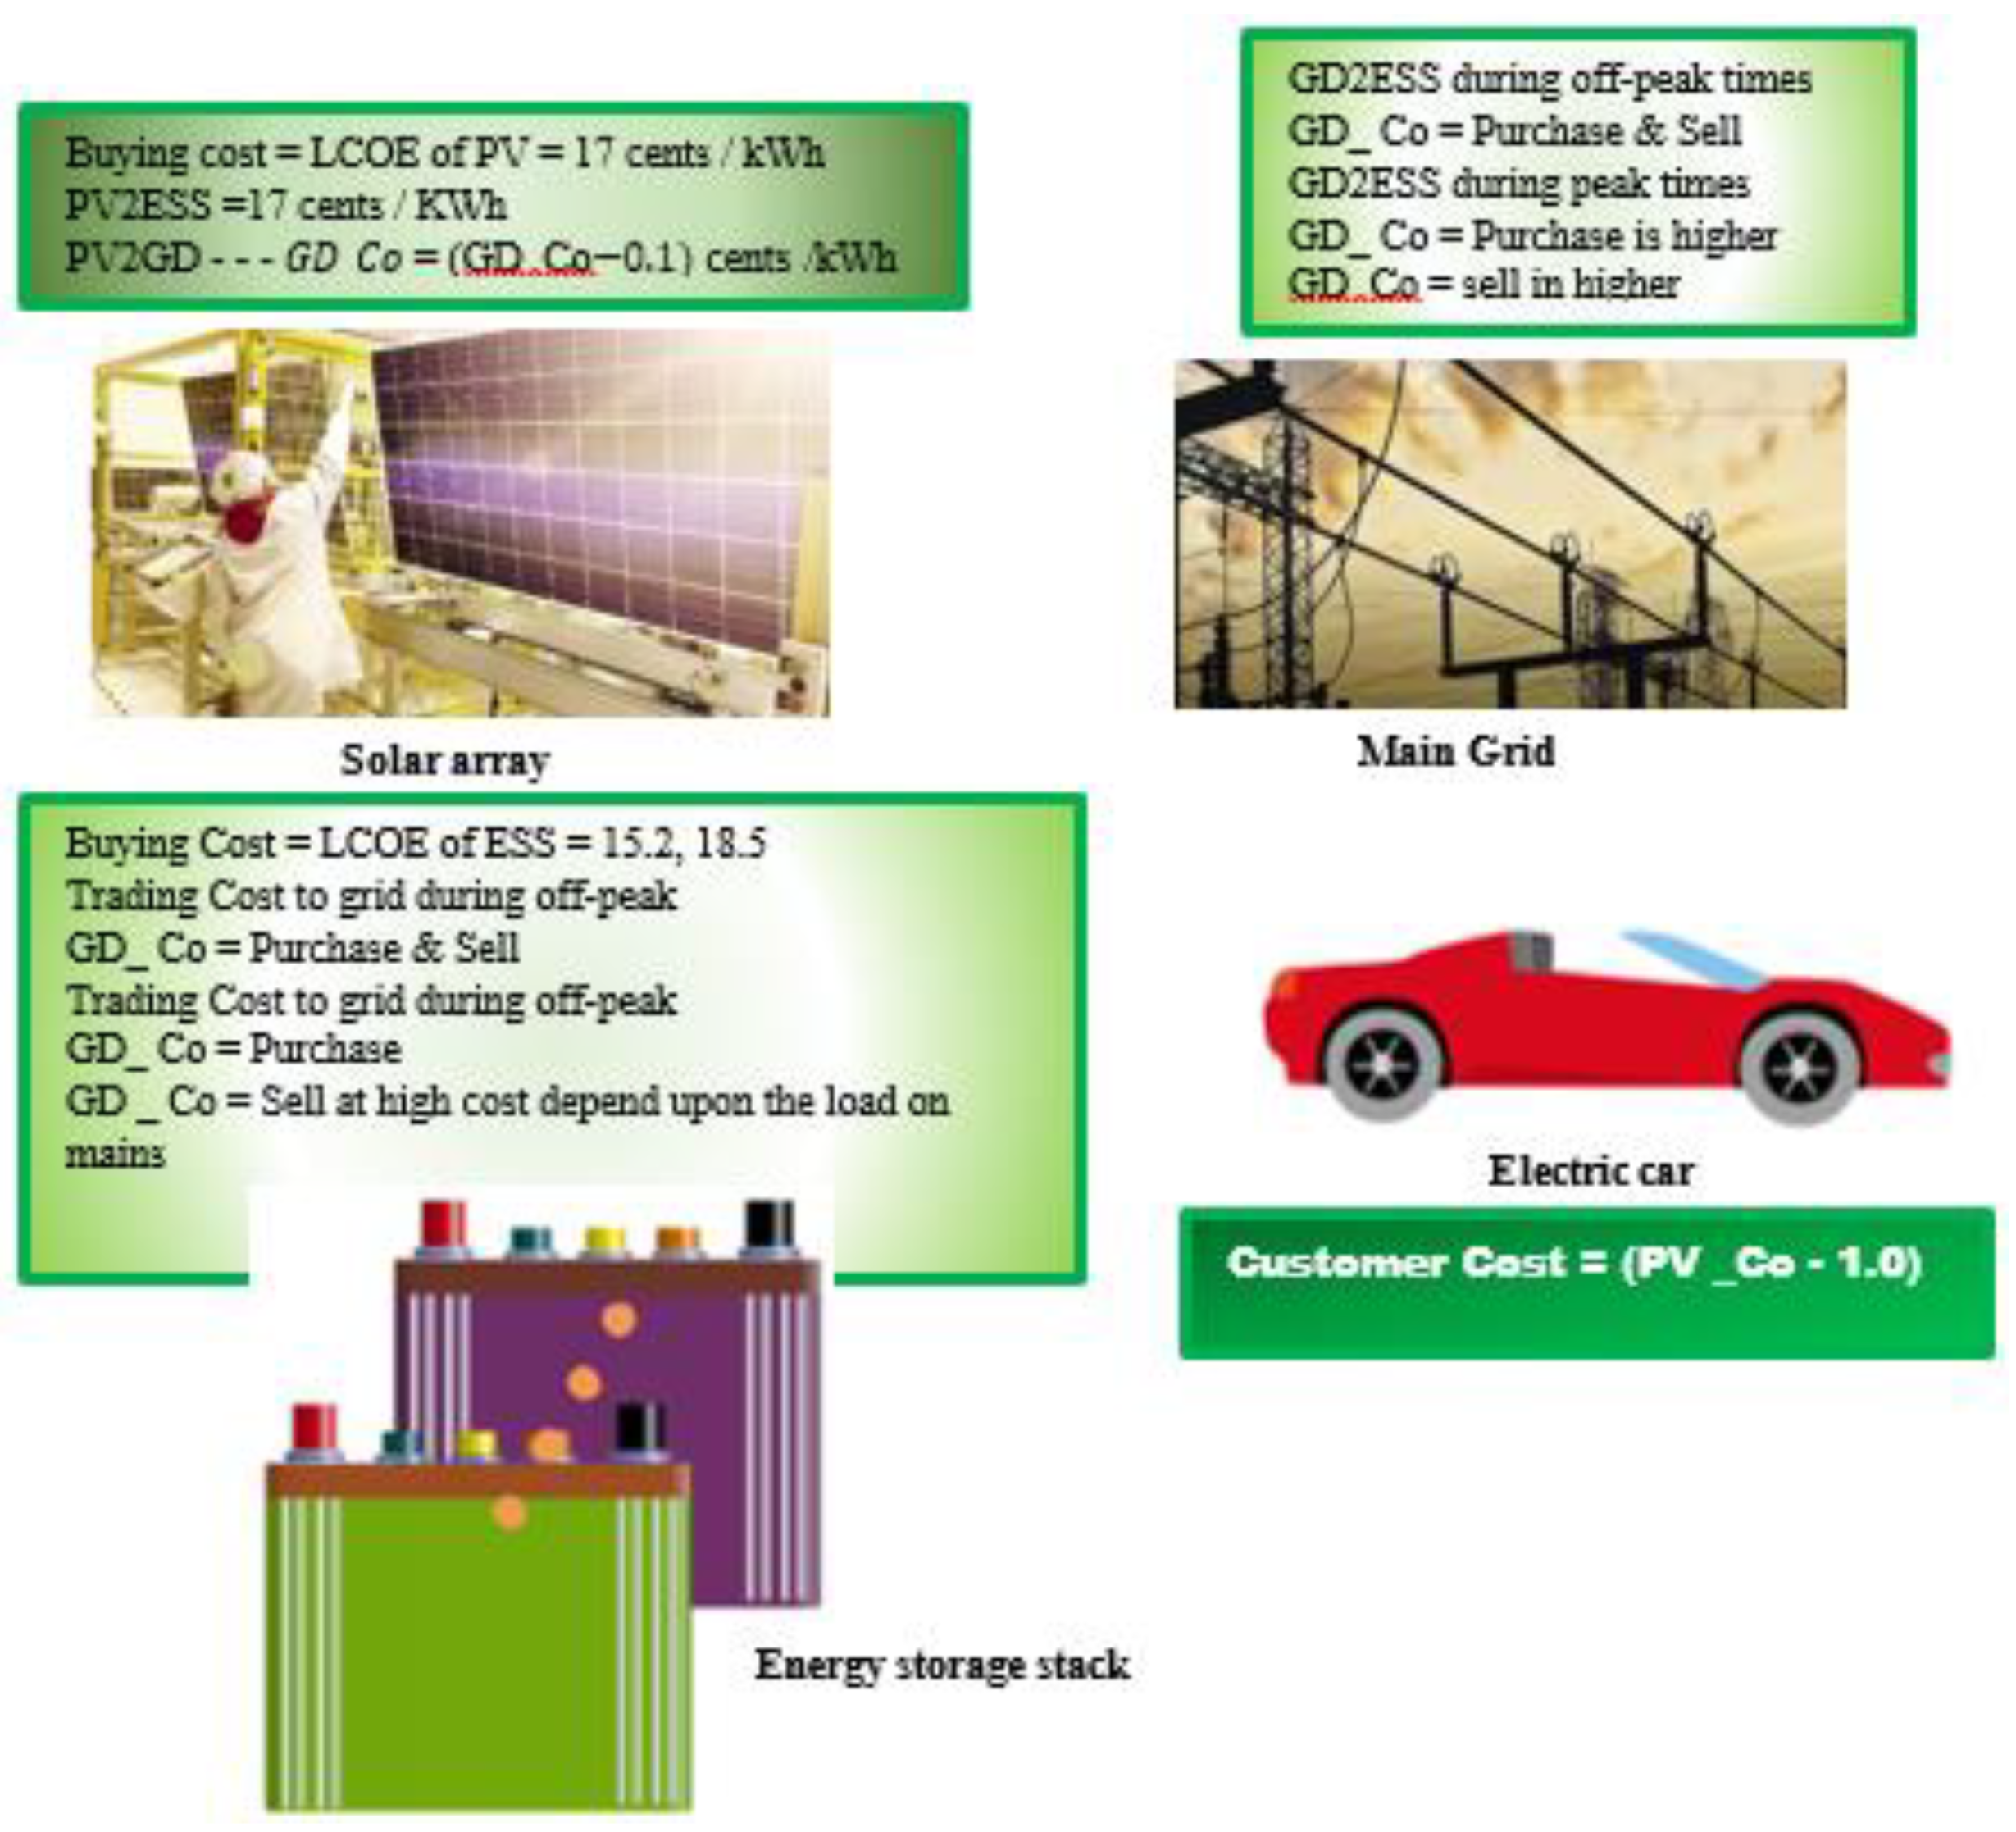
3.2. Modes of Charging
3.3. Operation of the Transactive Grid with REMA under Variant Scenarios
- (i)
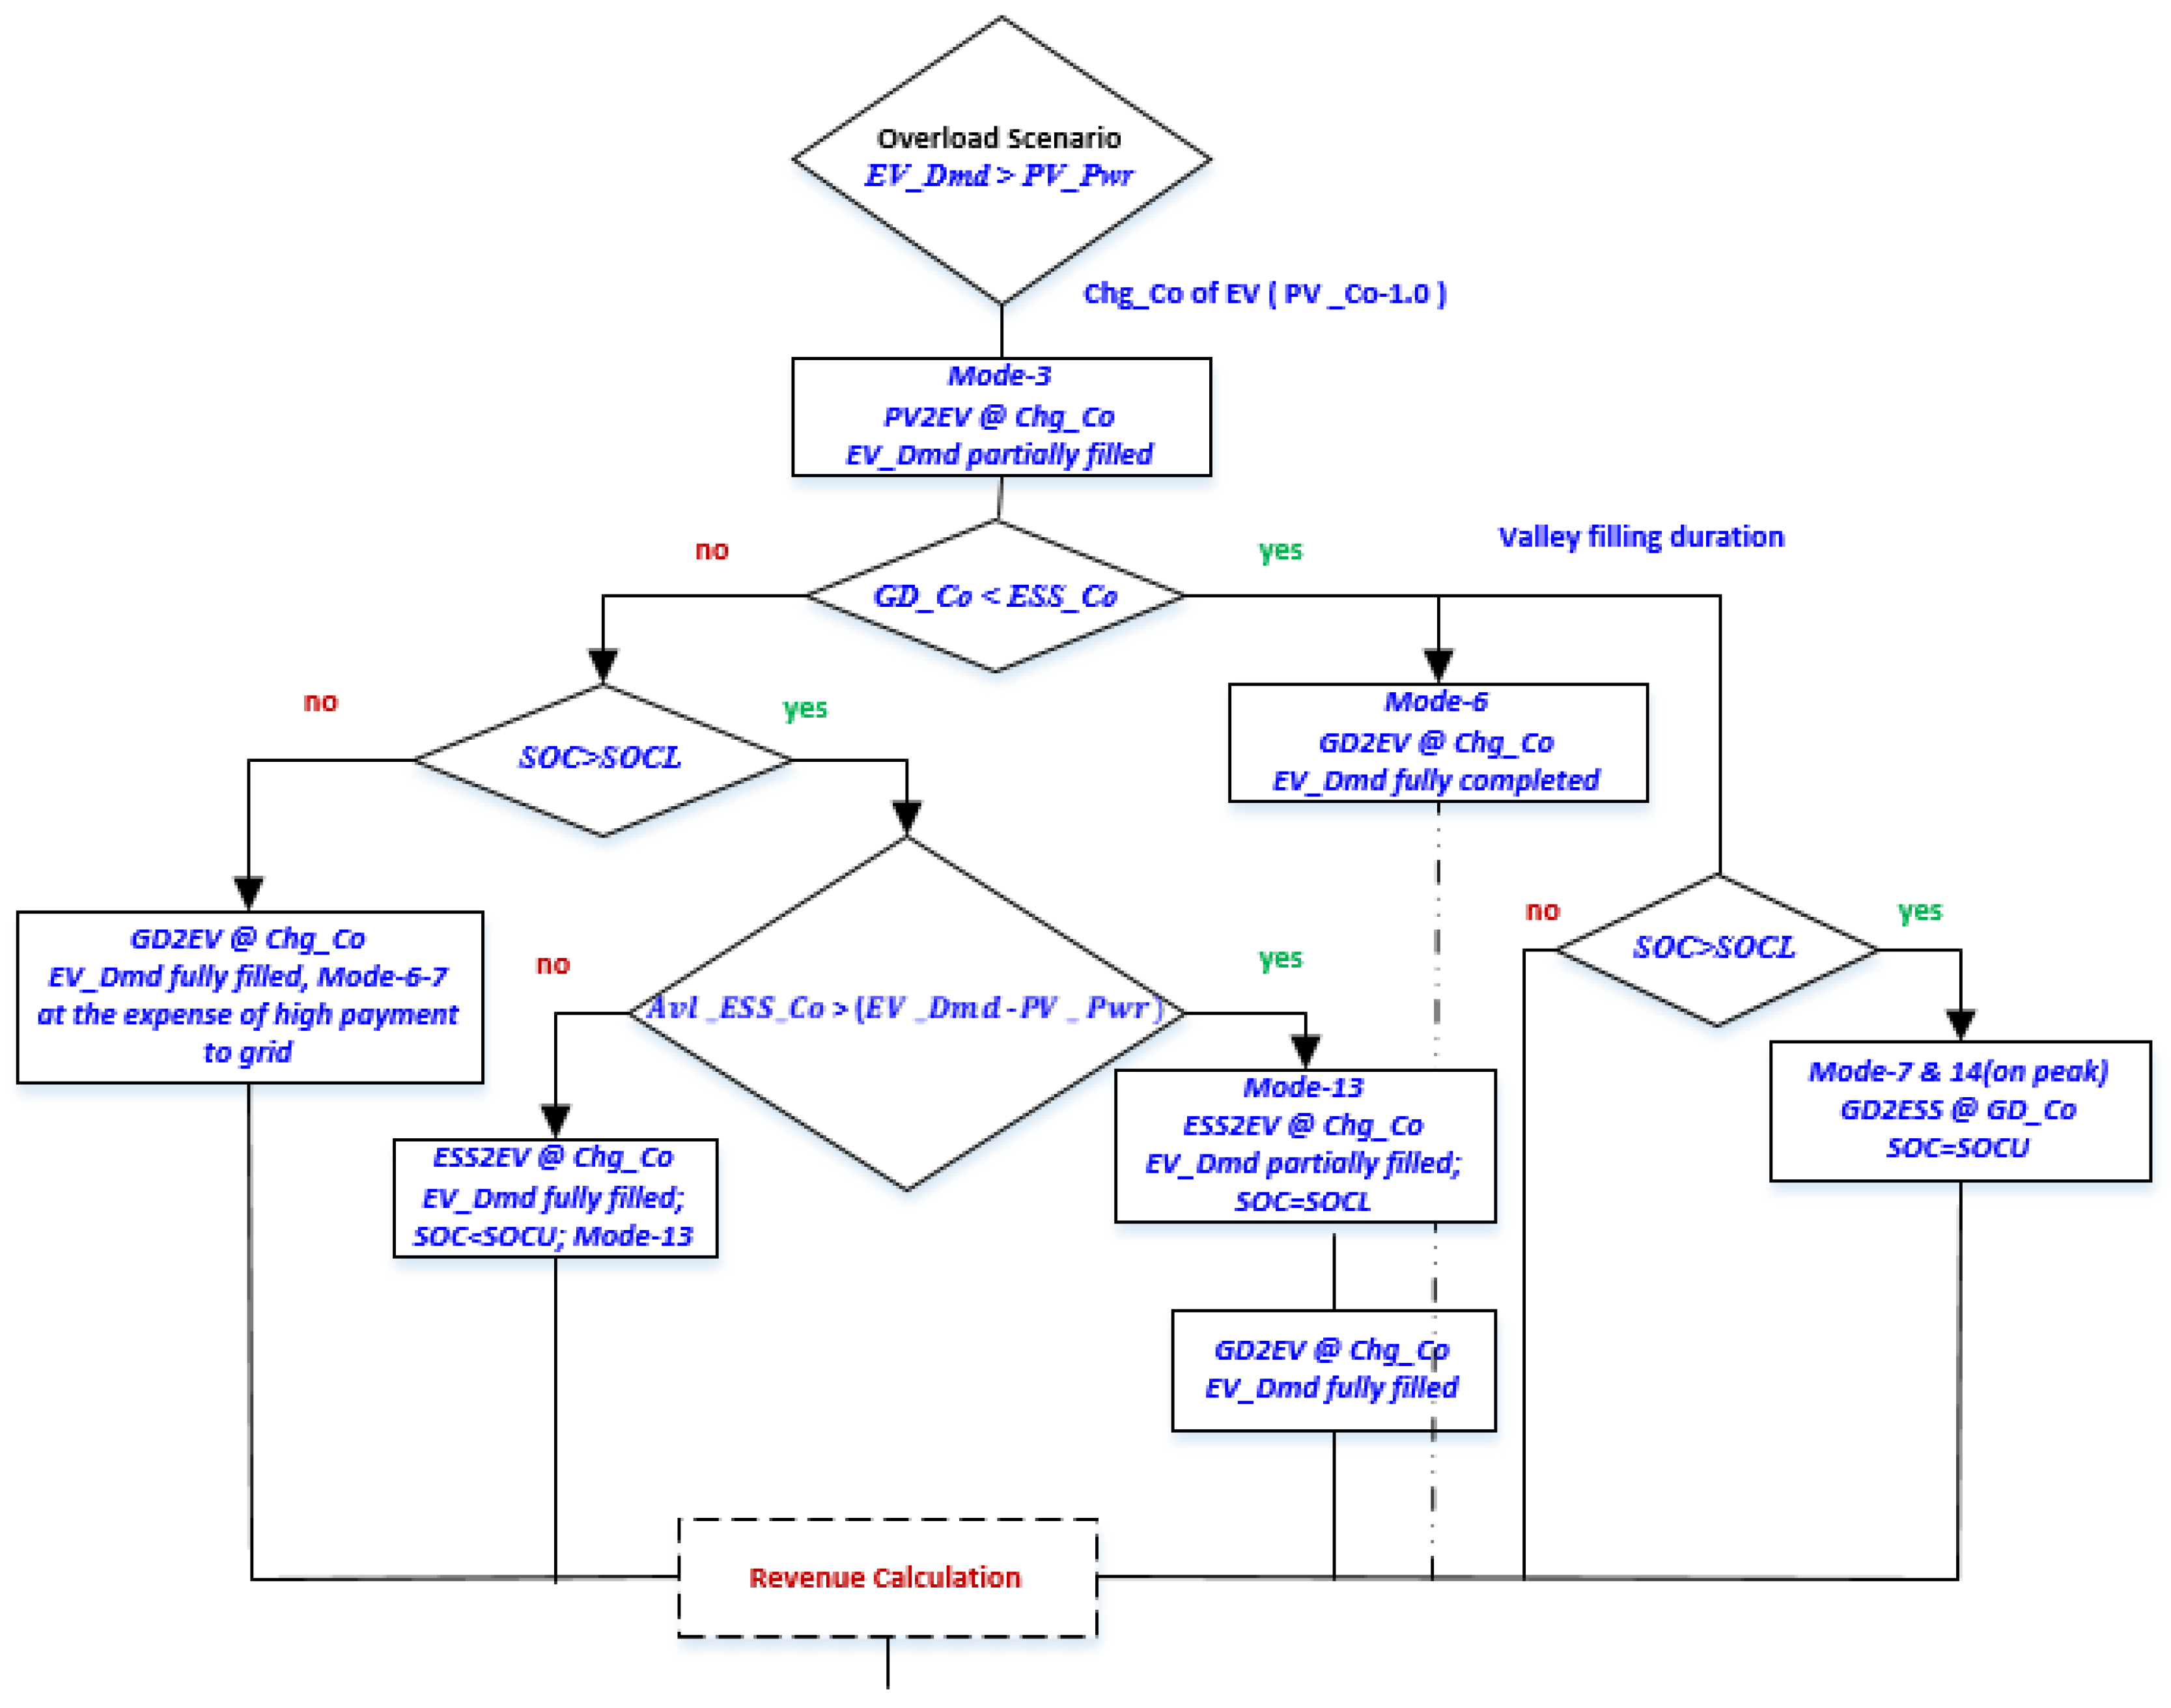
- Overload: it executes when is more than
- (ii)
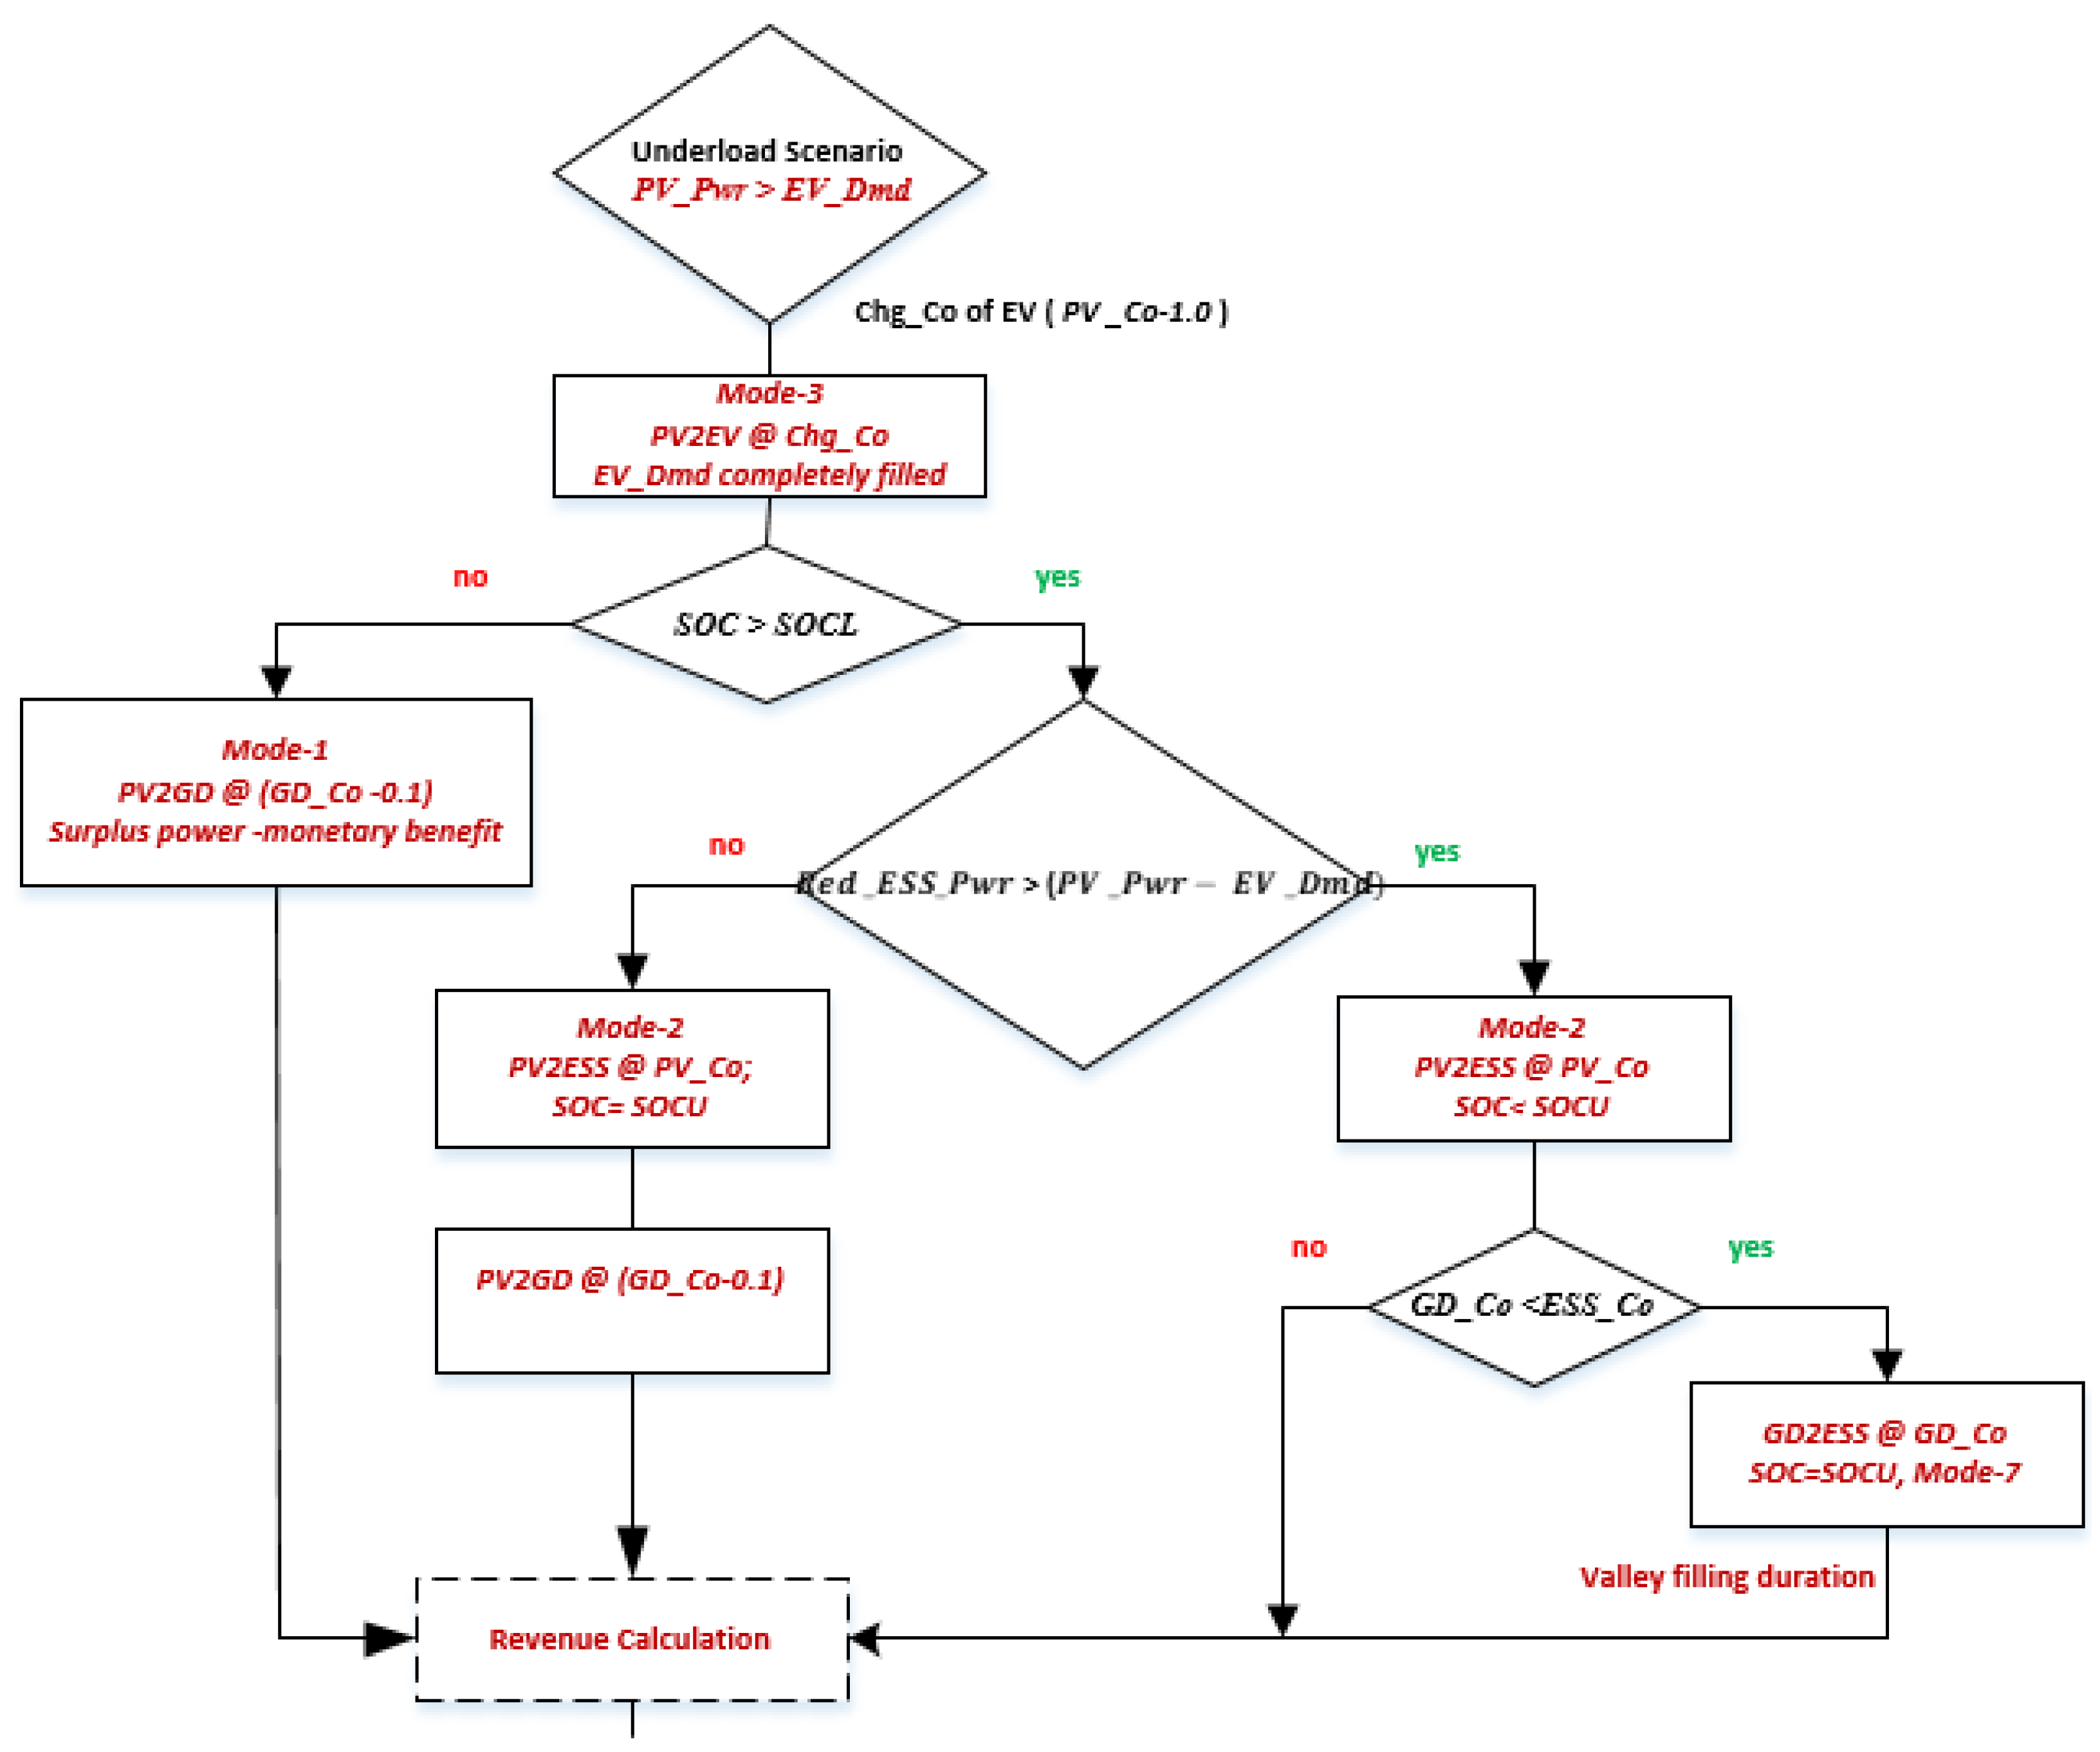
- Under load: it executes when is present but less than or equal to
- (iii)
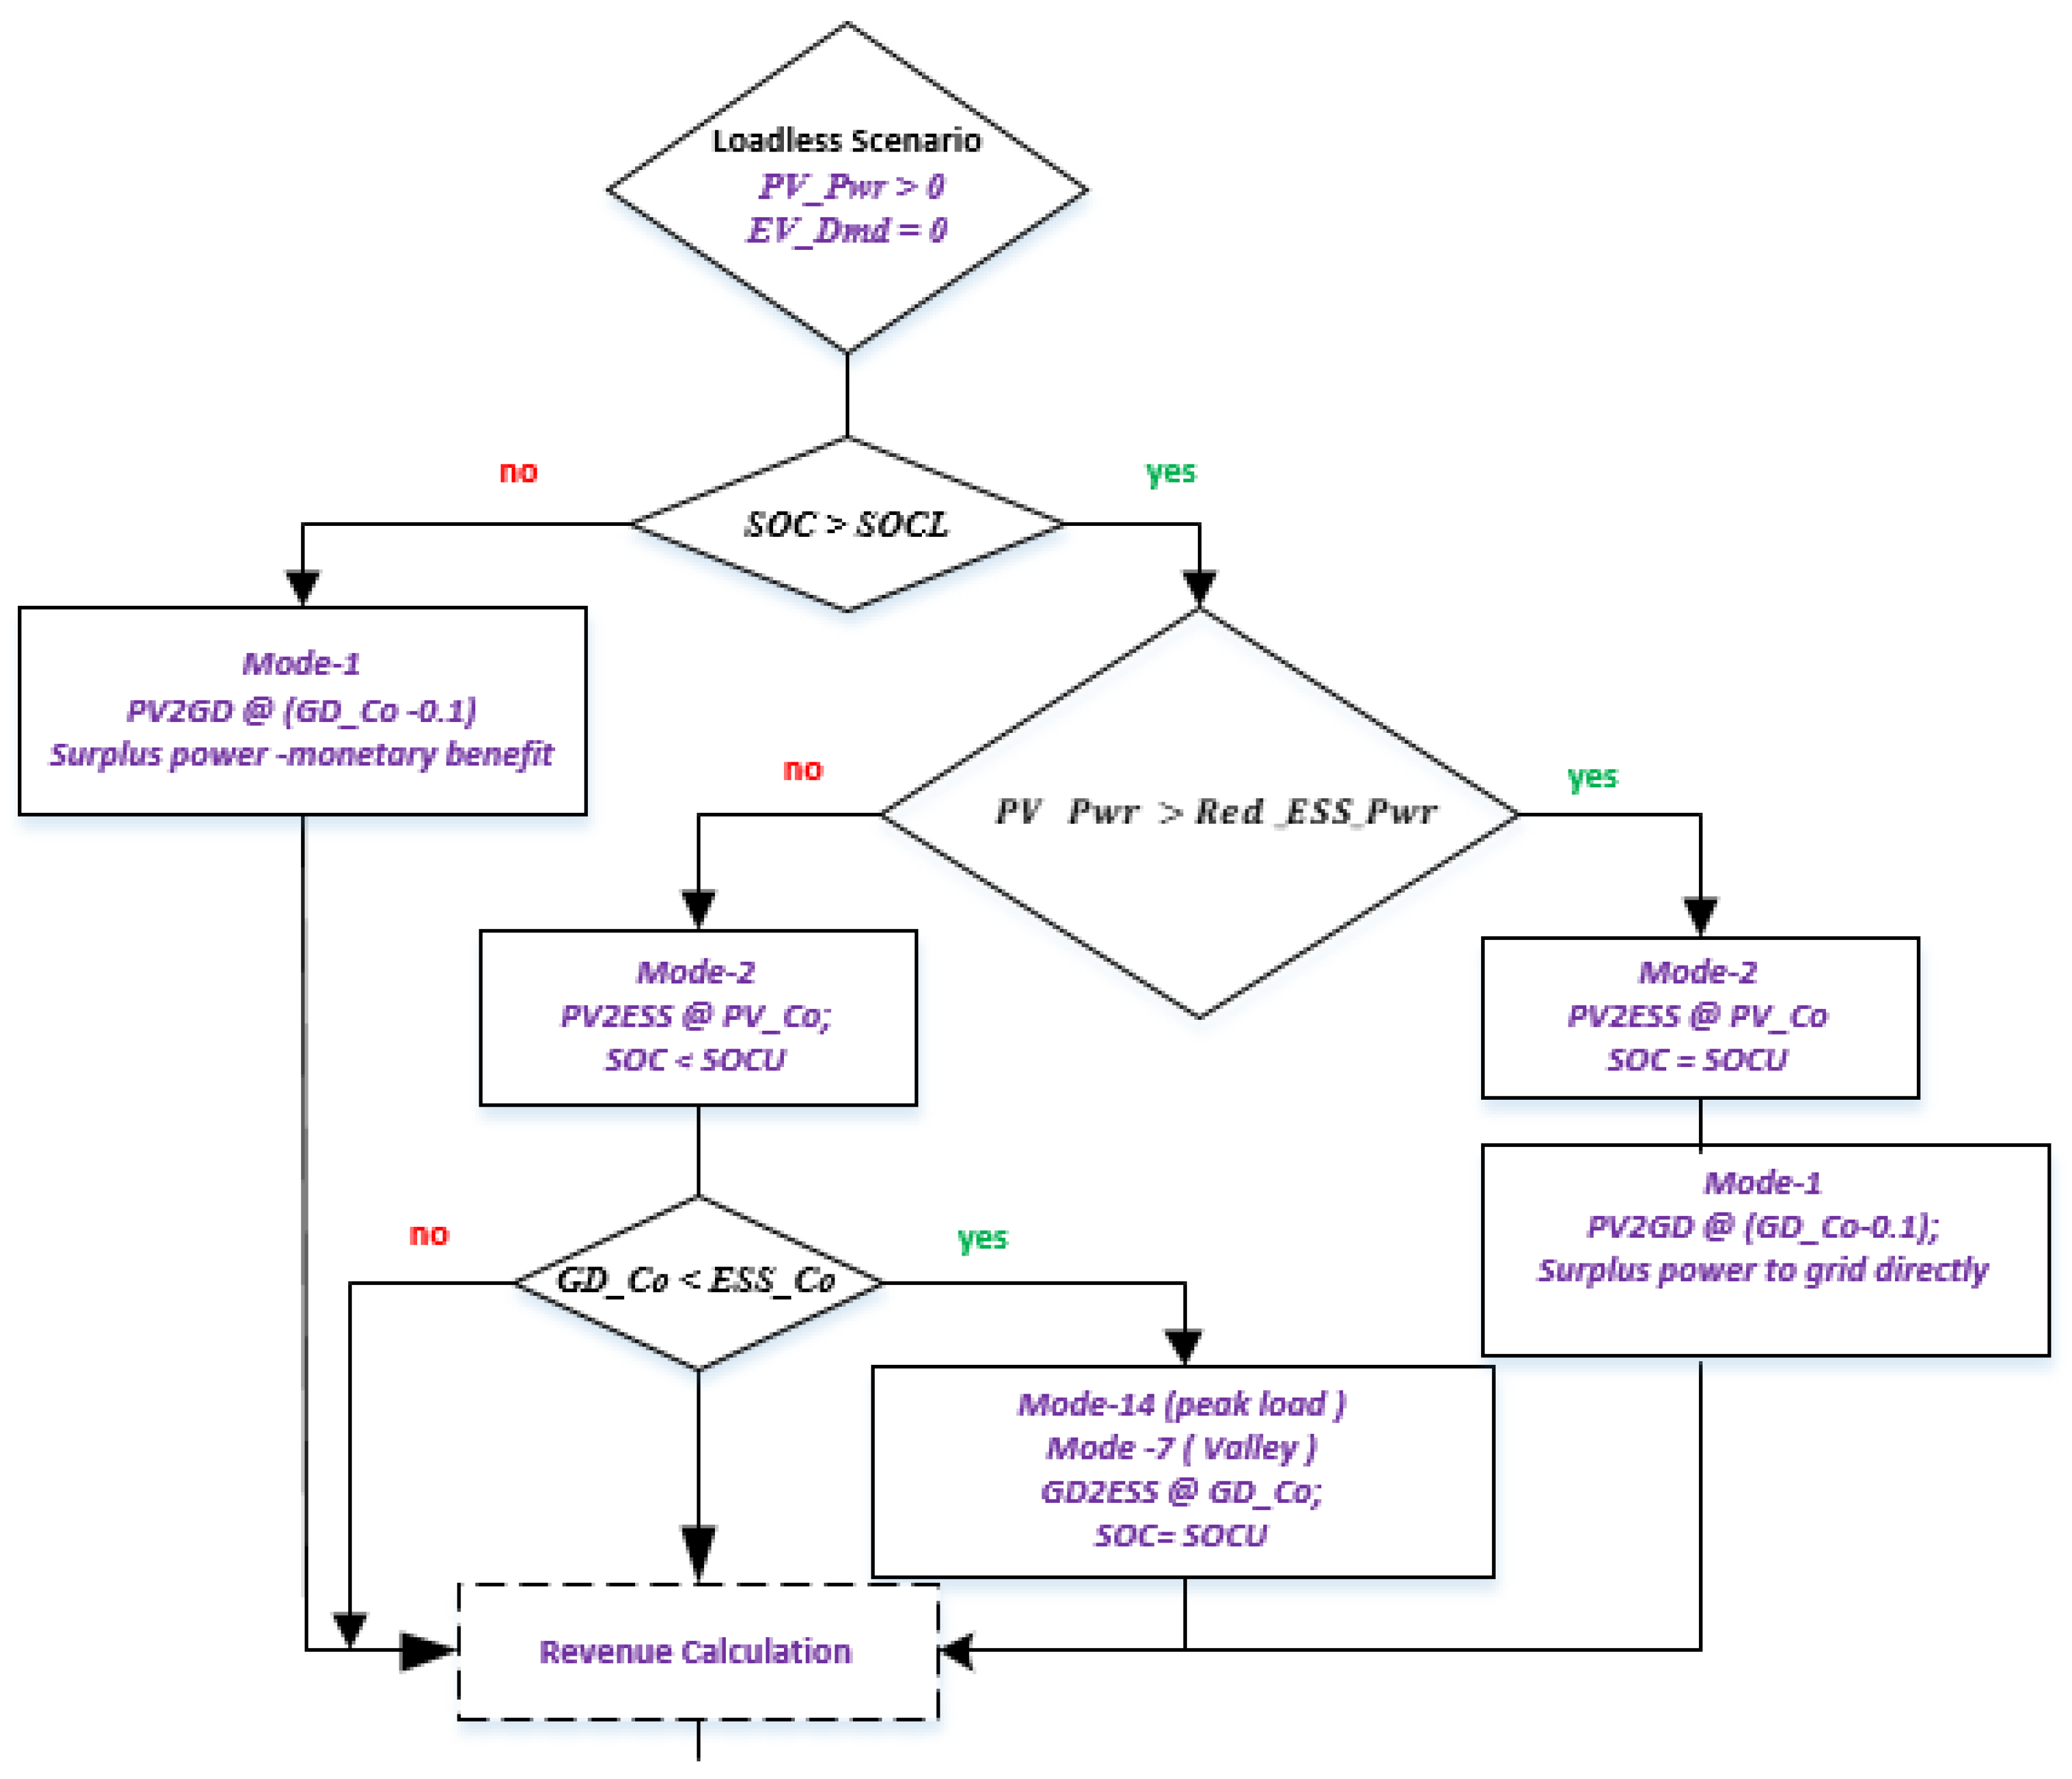
- No-load: it executes when the is available but the is zero
- (iv)
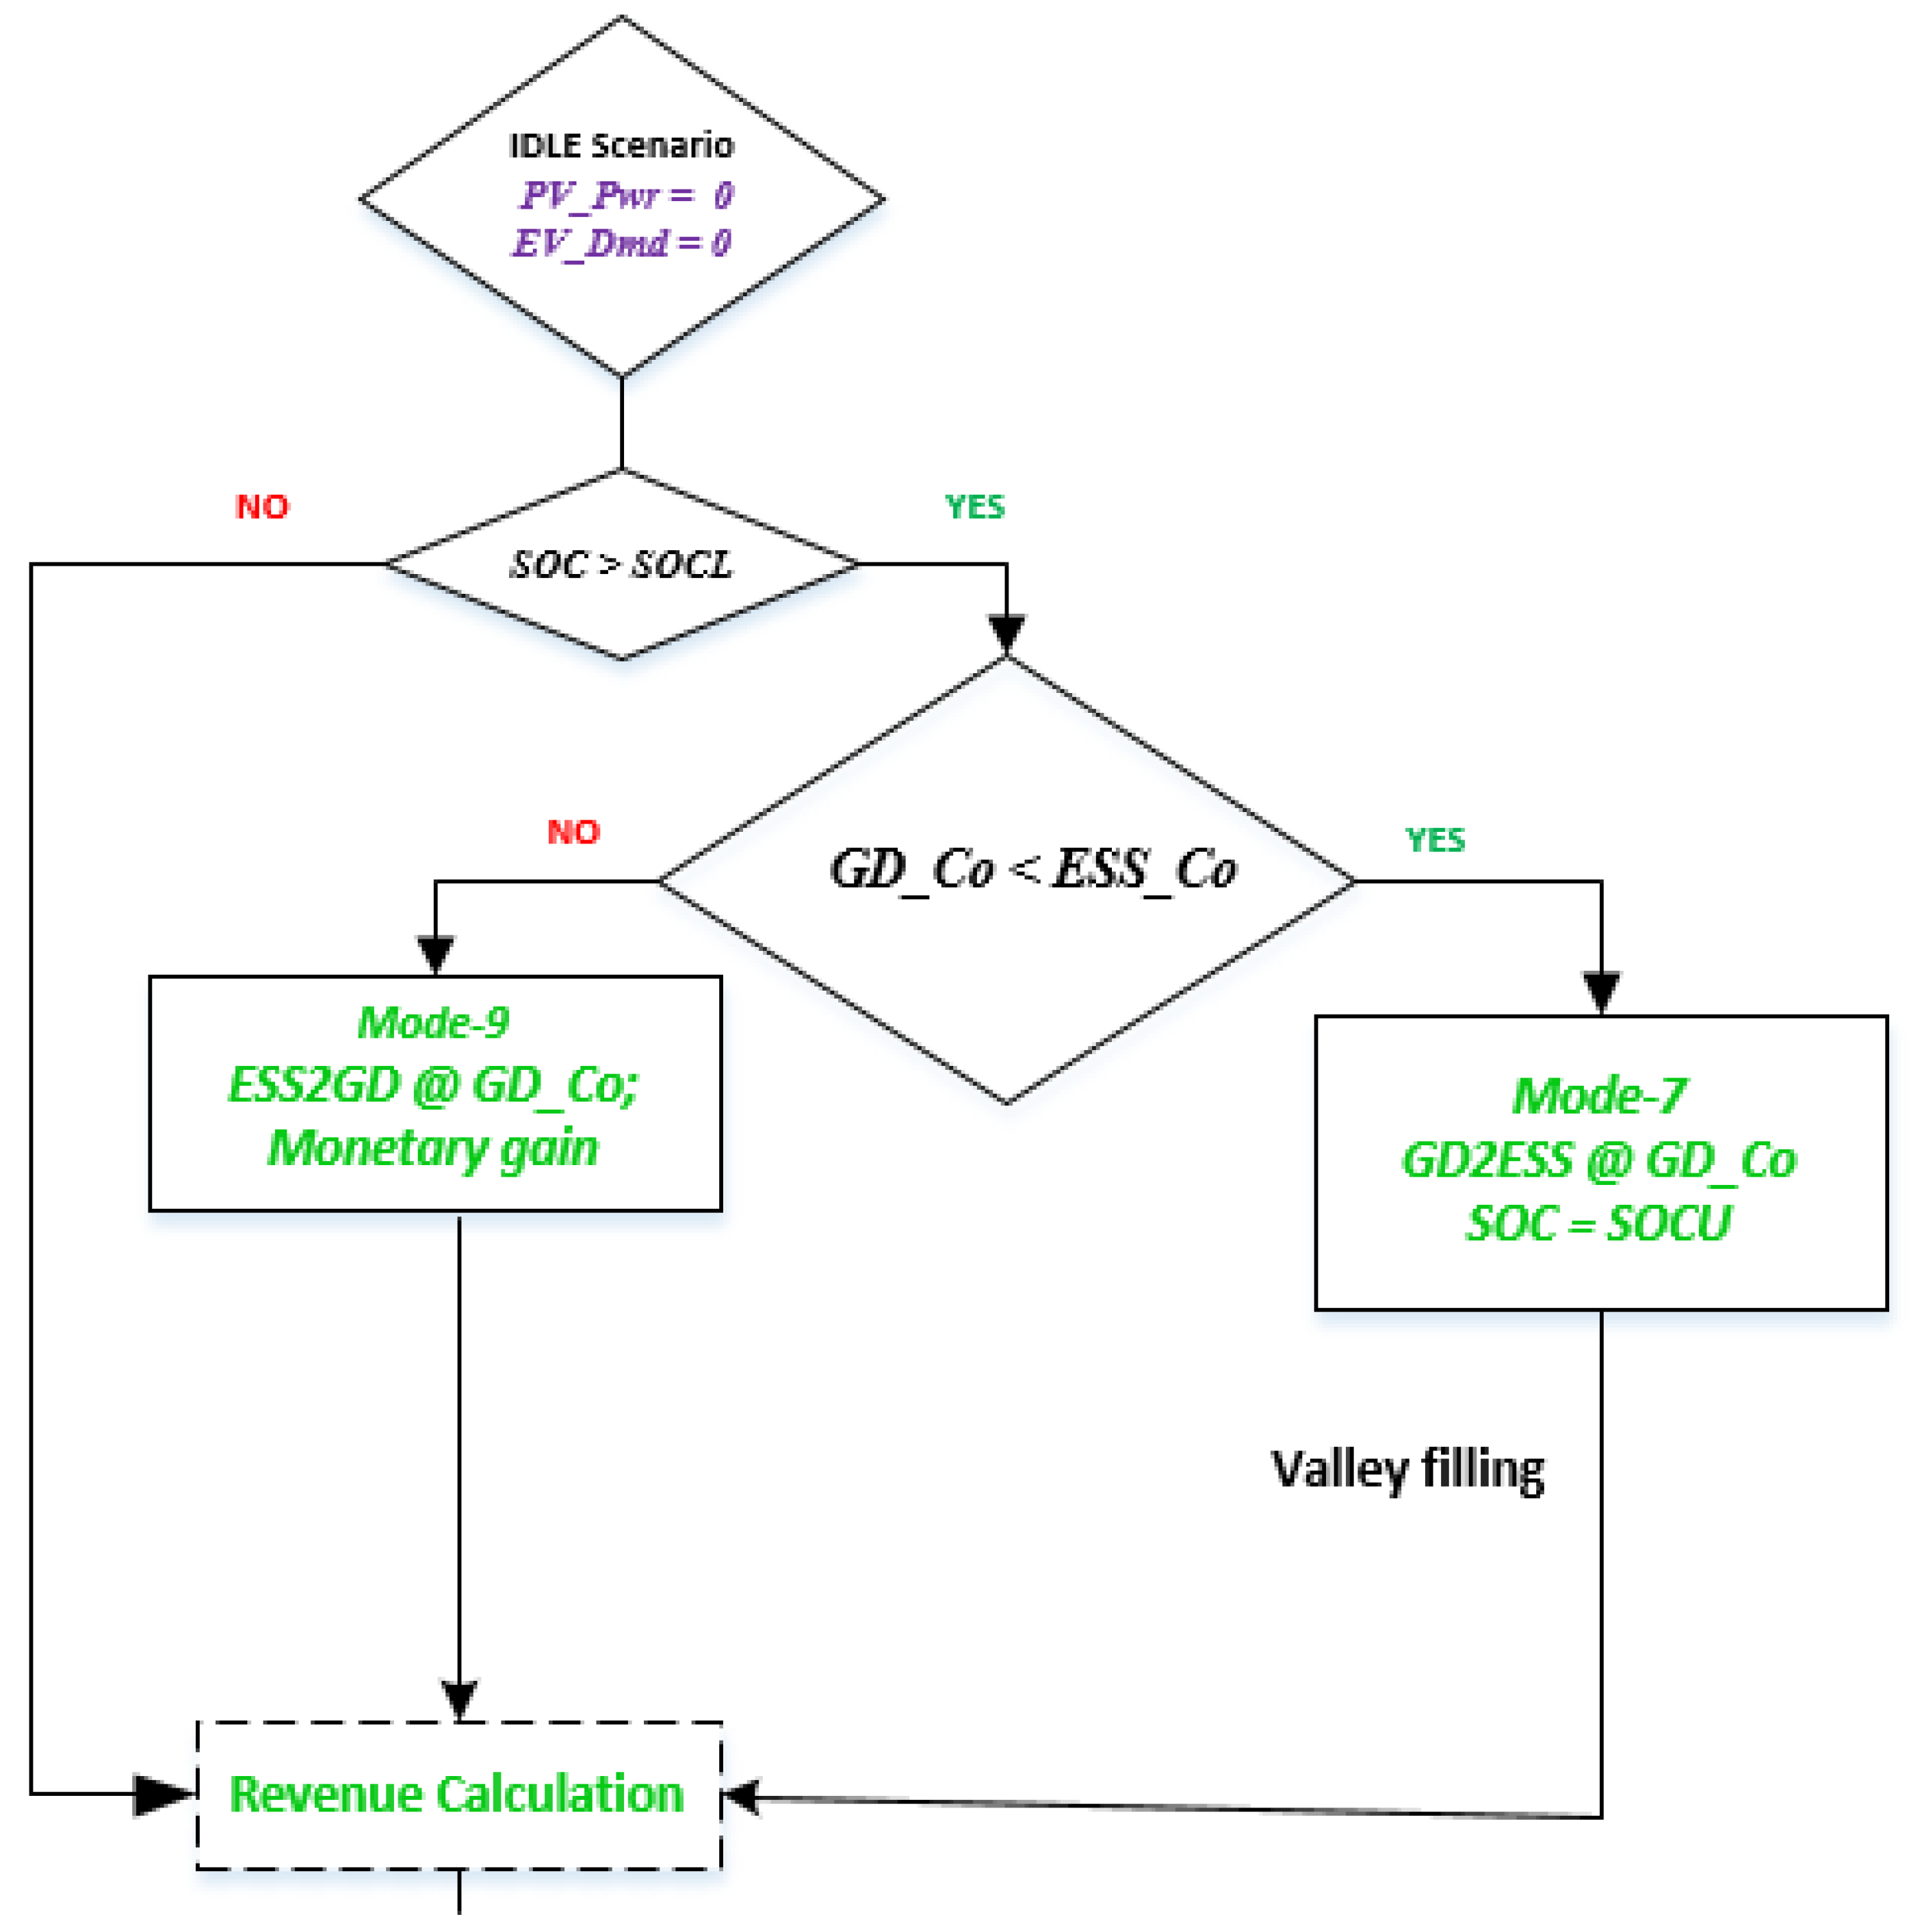
- Idle condition: it executes when both and is zero.
3.3.1. Overloaded Scenario
3.3.2. Under Load Scenario
3.3.3. No Load Scenario
3.3.4. Idle State Scenario
4. Confab and Discussion
4.1. Optimal Number of PV Arrays and Batteries in ESS
4.2. Cost Function and Constraints
4.3. Discourse of Charging Station Sizing
- (a)
- Meteorological conditions (winter, summer, normal and abnormal days)
- (b)
- Vocations (i.e., H + 2W, H + 1W, H + 0W, 0H + 0W)
- (c)
- EV fleet size (for 150 EVs)
- (d)
- Par and below parity states (PS, 0.83PS, 0.33PS)
- (e)
- LCOE of ESS (15.2 cents/kWh, 18.5 cents/kWh)
- (f)
- Operational periods of electric station (single day, 1 week, and 1 year)
4.4. Results under Diverse Climatic Conditions
4.4.1. Resiliency in Winter
4.4.2. Resiliency in Summer
4.4.3. Resiliency in Abnormal Weather
4.4.4. Resiliency during Holiday
4.4.5. Resiliency under Different Parity States
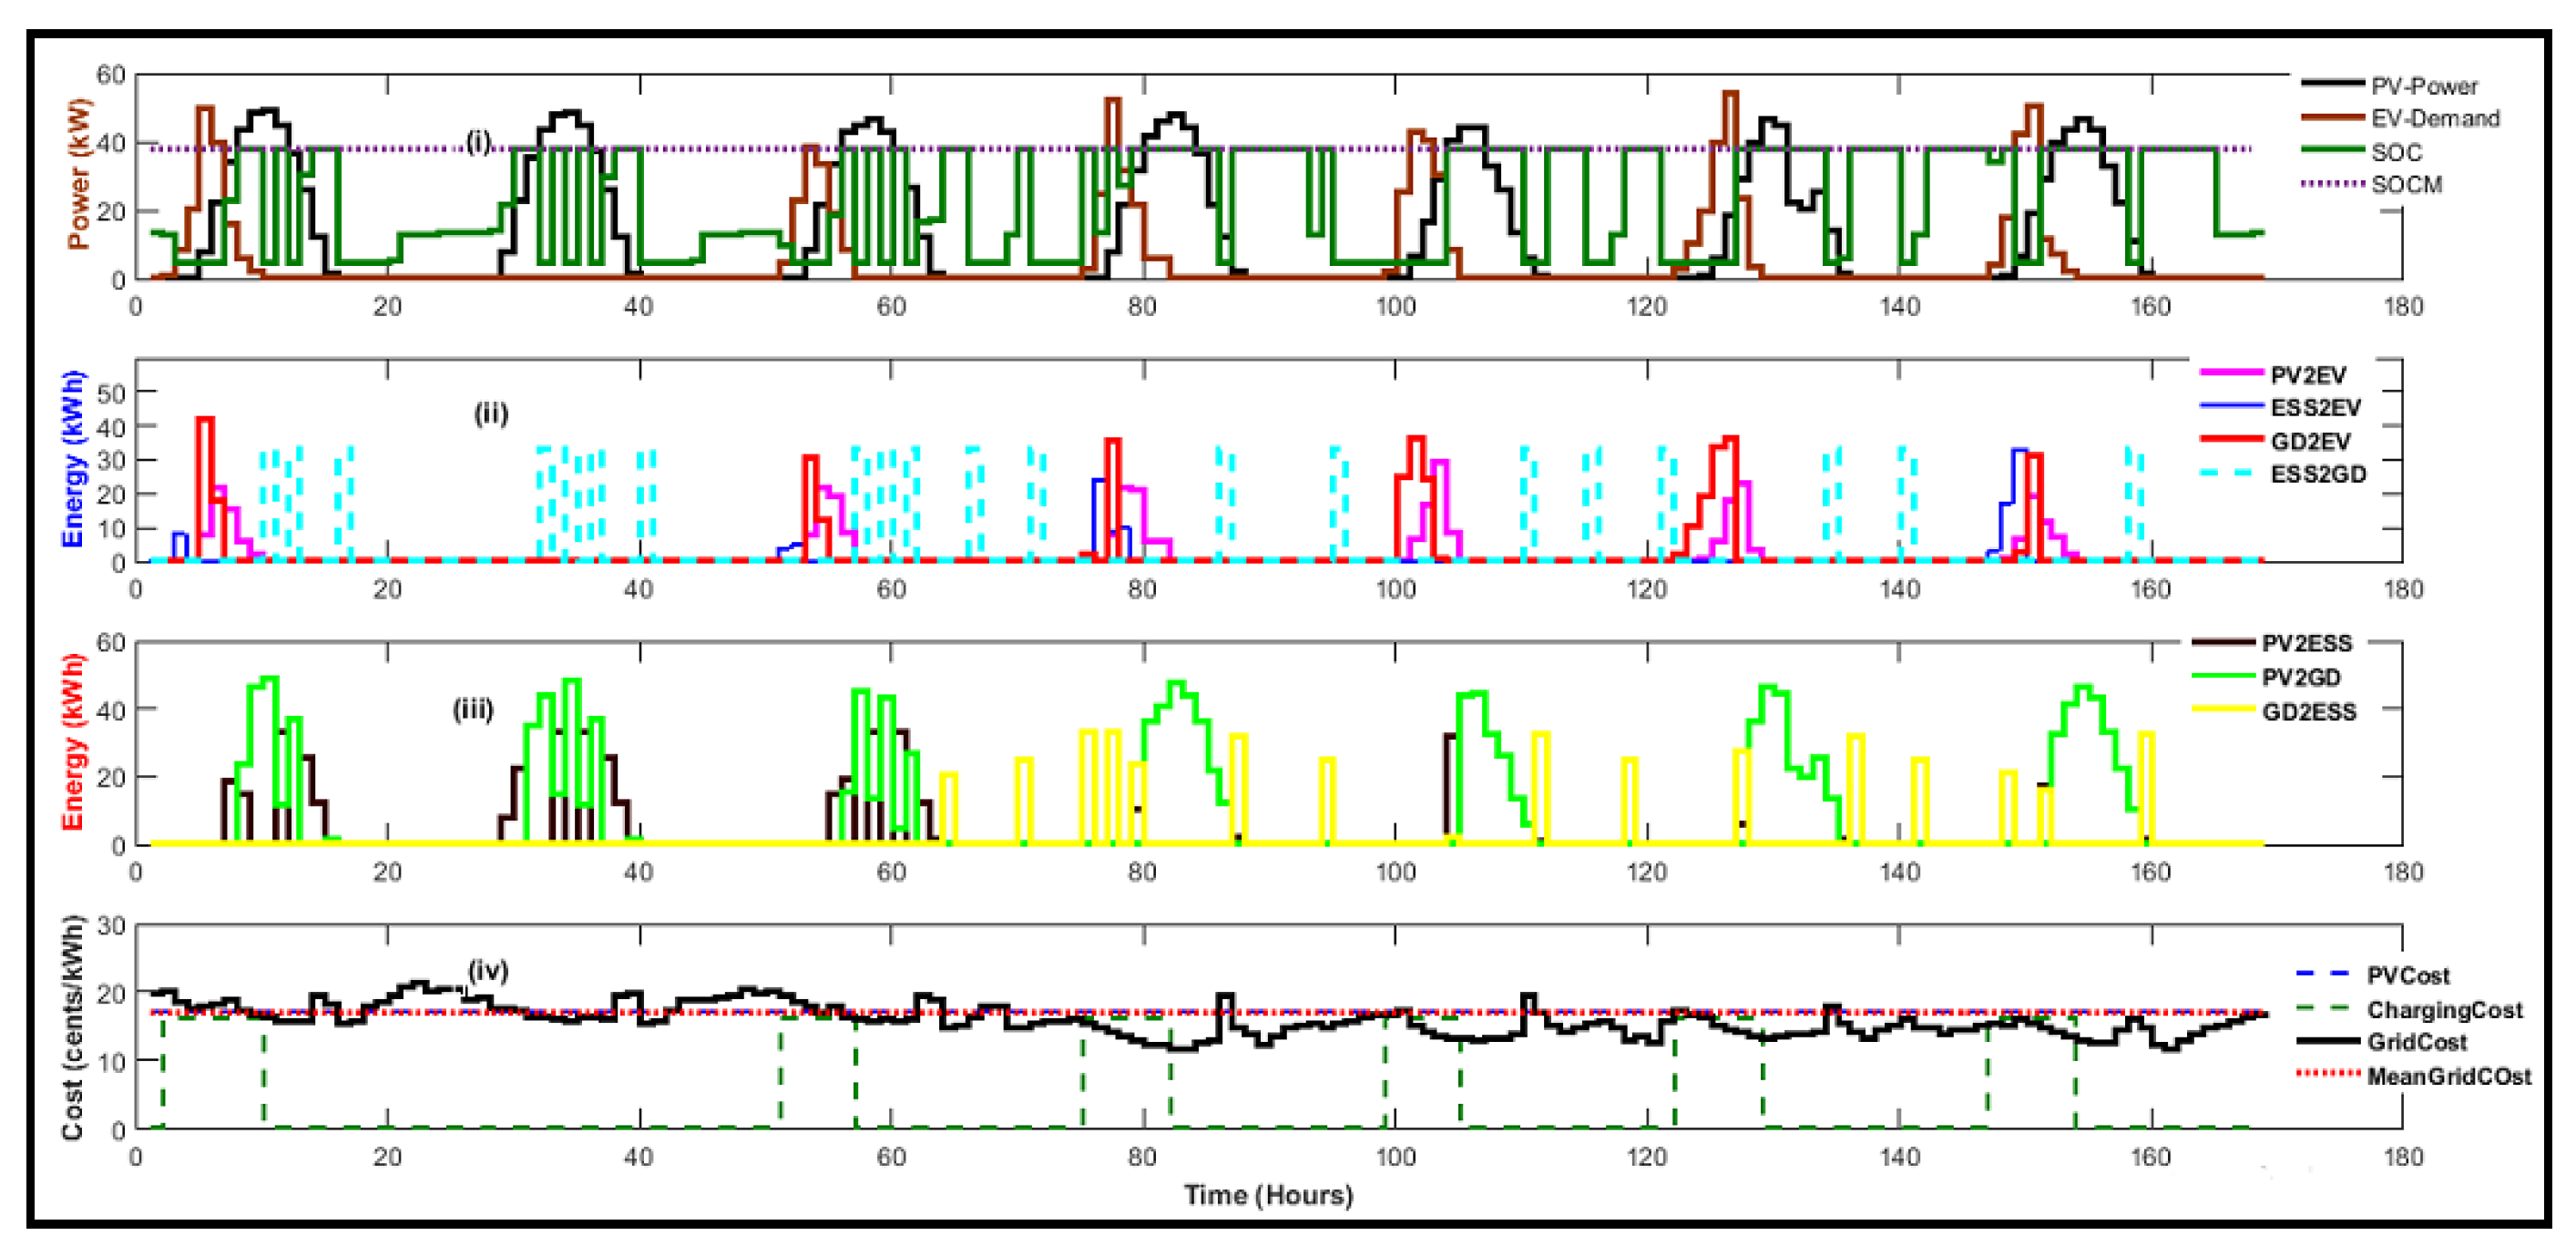
4.4.6. Resiliency in 1 Week
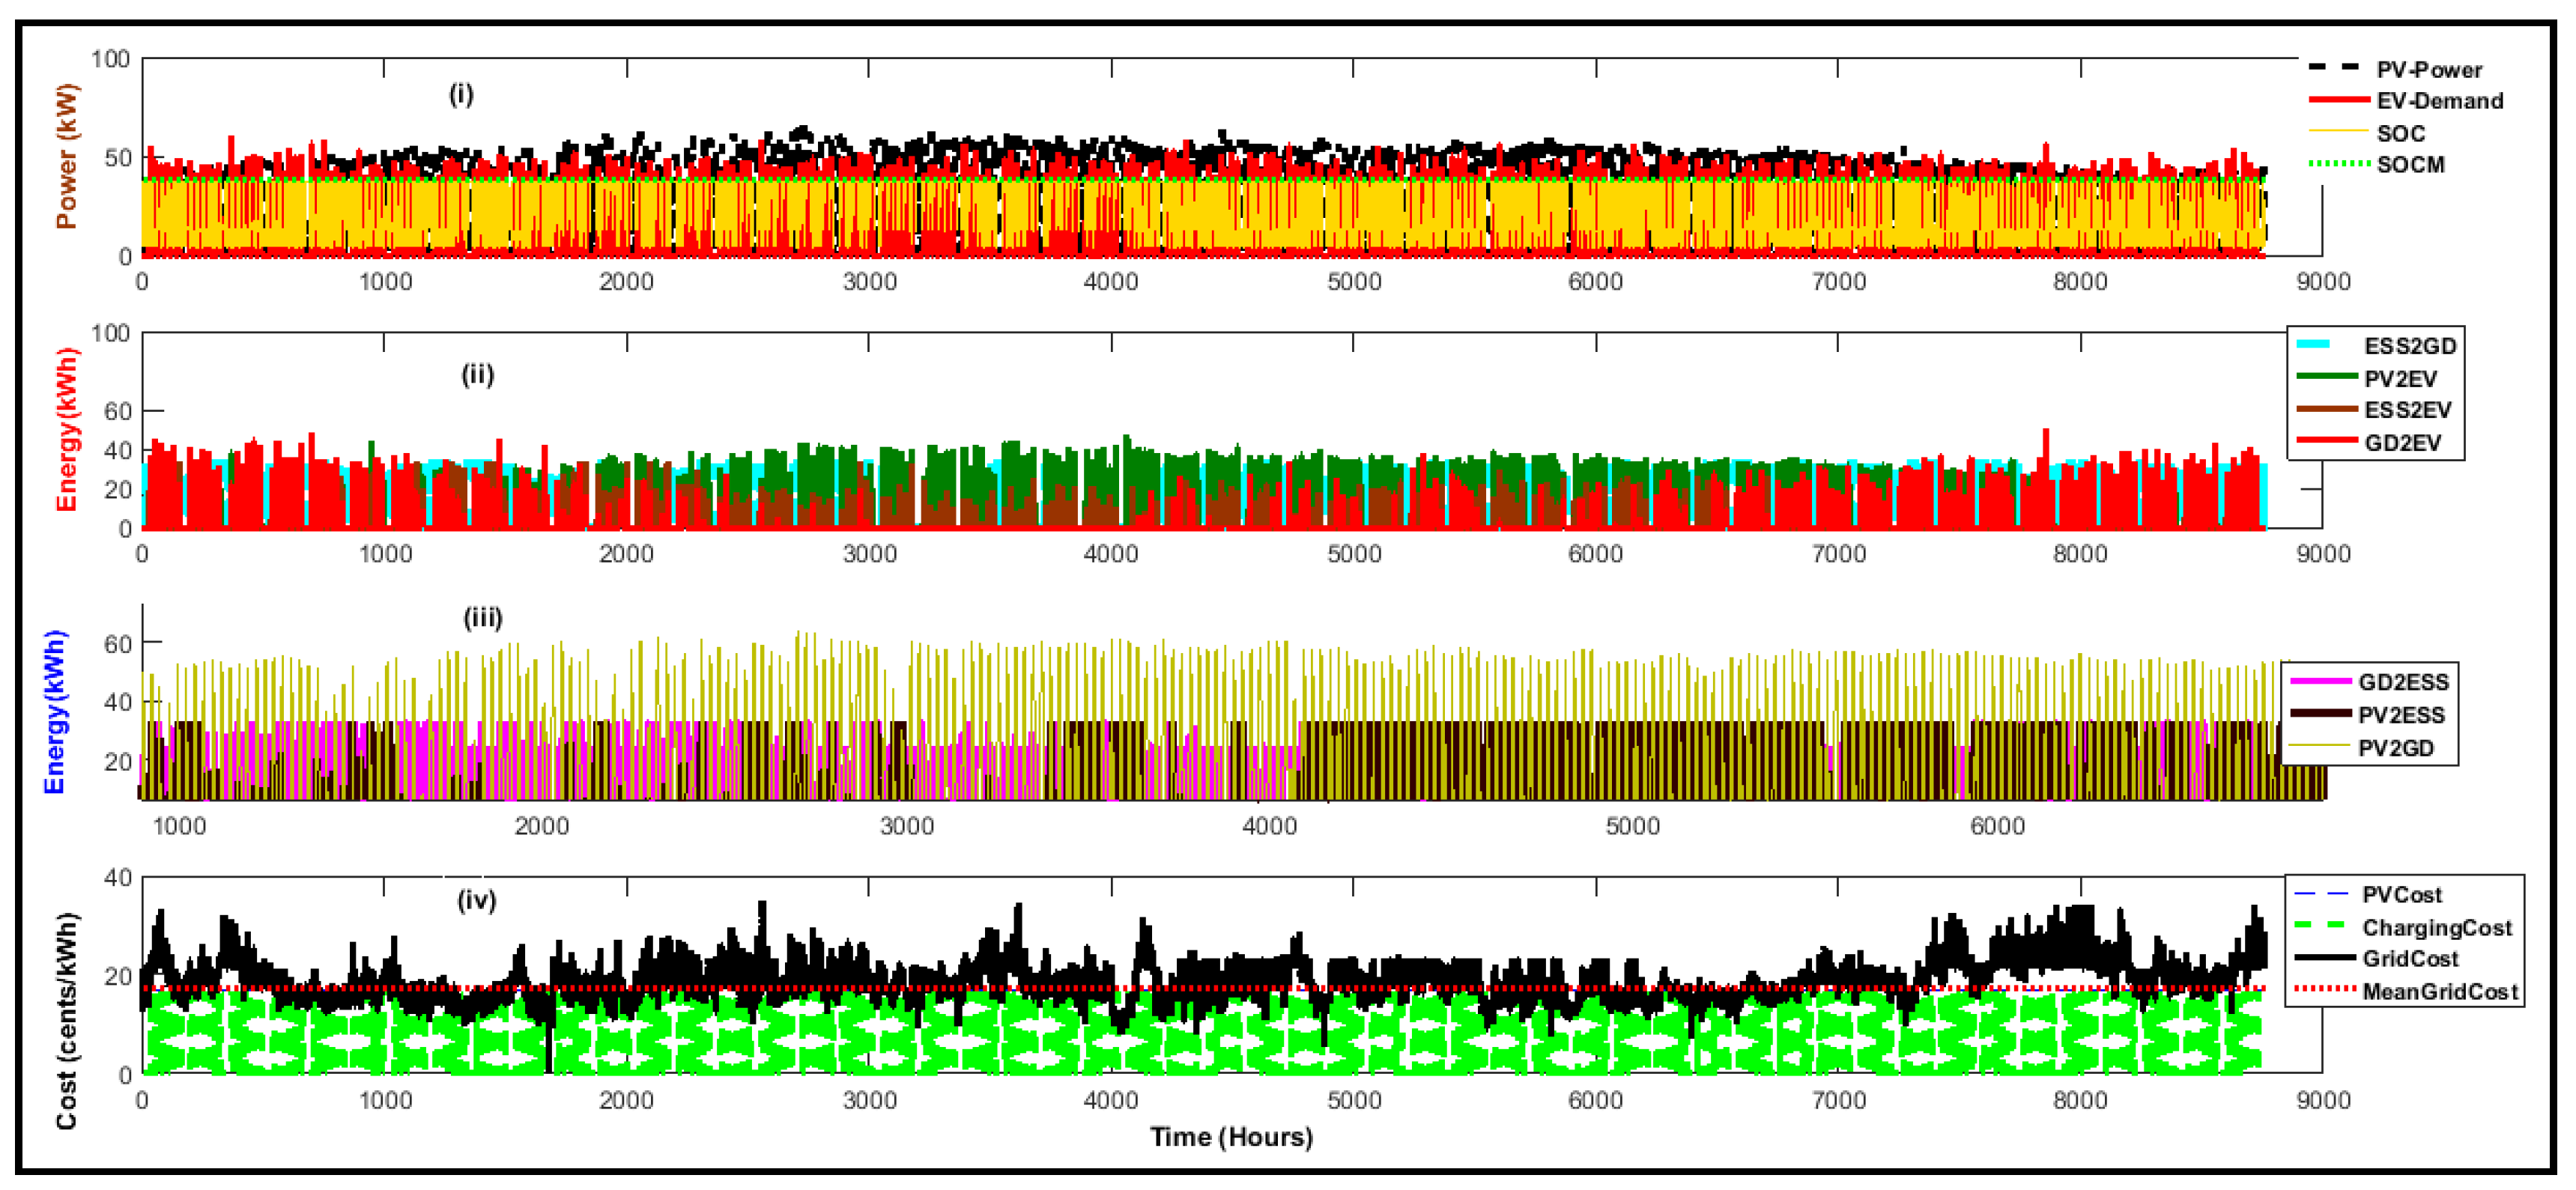
4.4.7. Resiliency in 1 Year
5. Conclusions
Author Contributions
Funding
Institutional Review Board Statement
Informed Consent Statement
Acknowledgments
Conflicts of Interest
References
- Boulanger, A.G.; Chu, A.C.; Maxx, S.; Waltz, D.L. Vehicle Electrification: Status and Issues. Proc. IEEE 2011, 99, 1116–1138. [Google Scholar] [CrossRef] [Green Version]
- Elgowainy, A.; Han, J.; Poch, L.; Wang, M.; Vyas, A.; Mahalik, M.; Rousseau, A. Well-To-Wheels Analysis of Energy Use and Greenhouse Gas Emissions of Plug-In Hybrid Electric Vehicles; Argonne National Laboratory (ANL): Argonne, IL, USA, 2010.
- Arfeen, Z.A.; Khairuddin, A.B.; Munir, A.; Azam, M.K.; Faisal, M.; Bin Arif, M.S. En route of electric vehicles with the vehicle to grid technique in distribution networks: Status and technological review. Energy Storage 2019, 2. [Google Scholar] [CrossRef]
- Chian, T.; Wei, W.; Ze, E.; Ren, L.; Ping, Y.; Bakar, N.A.; Faizal, M.; Sivakumar, S. A Review on Recent Progress of Batteries for Electric Vehicles. Int. J. Appl. Eng. Res. 2019, 14, 4441–4461. [Google Scholar]
- Arfeen, Z.A.; Abdullah, P.; Hassan, R.; Othman, B.M.; Siddique, A.; Rehman, A.U.; Sheikh, U.U. Energy storage usages: Engineering reactions, economic-technological values for electric vehicles—A technological outlook. Int. Trans. Electr. Energy Syst. 2020, 30, 12422. [Google Scholar] [CrossRef]
- Tie, S.F.; Tan, C.W. A review of energy sources and energy management system in electric vehicles. Renew. Sustain. Energy Rev. 2013, 20, 82–102. [Google Scholar] [CrossRef]
- Mahfouz, M.M.M.; Iravani, R. A Supervisory Control for Resilient Operation of the Battery-Enabled DC Fast Charging Station and the Grid. IEEE Trans. Power Deliv. 2021, 36, 2532–2541. [Google Scholar] [CrossRef]
- Jiang, Z.; Rahimi-Eichi, H. Design, modeling and simulation of a green building energy system. In Proceedings of the 2009 IEEE Power & Energy Society General Meeting, Calgary, AB, Canada, 26–30 July 2009; pp. 1–7. [Google Scholar]
- Betz, J.; Werner, D.; Lienkamp, M. Fleet Disposition Modeling to Maximize Utilization of Battery Electric Vehicles in Companies with On-Site Energy Generation. Transp. Res. Procedia 2016, 19, 241–257. [Google Scholar] [CrossRef]
- El-Bayeh, C.Z.; Alzaareer, K.; Aldaoudeyeh, A.-M.I.; Brahmi, B.; Zellagui, M. Charging and Discharging Strategies of Electric Vehicles: A Survey. World Electr. Veh. J. 2021, 12, 11. [Google Scholar] [CrossRef]
- Unger, R.; Schwan, T.; Mikoleit, B.; Bäker, B.; Kehrer, C.; Rodemann, T. “Green Building”—Modelling renewable building energy systems and electric mobility concepts using Modelica. In Proceedings of the 9th International MODELICA Conference, Munich, Germany, 3–5 September 2012; pp. 897–906. [Google Scholar] [CrossRef] [Green Version]
- Lopez, J.E. Home charge system for EVs with peak power smoothing based on renewable energy. In Proceedings of the 2013 International Conference on New Concepts in Smart Cities: Fostering Public and Private Alliances (SmartMILE), Gijon, Spain, 11–13 December 2013; pp. 1–6. [Google Scholar]
- Betz, J.; Hann, M.; Jager, B.; Lienkamp, M. Evaluation of the Potential of Integrating Battery Electric Vehicles into Commercial Companies on the Basis of Fleet Test Data. In Proceedings of the 2017 IEEE 85th Vehicular Technology Conference (VTC Spring), Sydney, Australia, 4–7 June 2017; pp. 1–7. [Google Scholar]
- Betz, J.; Lienkamp, M. Approach for the development of a method for the integration of battery electric vehicles in commercial companies, including intelligent management systems. Automot. Engine Technol. 2016, 1, 107–117. [Google Scholar] [CrossRef] [Green Version]
- Akhavan-Hejazi, H.; Mohsenian-Rad, H.; Nejat, A. Developing a Test Data Set for Electric Vehicle Applications in Smart Grid Research. In Proceedings of the 2014 IEEE 80th Vehicular Technology Conference (VTC2014-Fall), Vancouver, BC, Canada, 14–17 September 2014; pp. 1–6. [Google Scholar]
- Mathur, A.K.; Yemula, P.K. Scheduling of EV Charging in Grid-Connected Parking Lots with Renewable Sources; Indian Institute of Technology: Hyderabad, India, 2018. [Google Scholar]
- Arfeen, Z.A.; Sheikh, U.U.; Khalid, S.A.; Saeed, M.S.; Hafeez, F.; Faisal, M.; Ahmed, H.B. Energy Management Scheme for Electric Vehicles with Rapid-charging Facility Utilizing Grid Power Storage Packs and Photovoltaic Generator. In Proceedings of the 2020 IEEE International Conference on Automatic Control and Intelligent Systems (I2CACIS), Shah Alam, Malaysia, 20 June 2020; pp. 25–32. [Google Scholar]
- Arfeen, Z.A.; Khairuddin, A.B.; Larik, R.M.; Saeed, M.S. Control of distributed generation systems for microgrid applications: A technological review. Int. Trans. Electr. Energy Syst. 2019, 29, 12072. [Google Scholar] [CrossRef] [Green Version]
- Ma, T.; Mohammed, O.A. Optimal charging of plug-in electric vehicles for a car-park infrastructure. IEEE Trans. Ind. Appl. 2014, 50, 2323–2330. [Google Scholar] [CrossRef]
- Mohamed, A.; Salehi, V.; Ma, T.; Mohammed, O. Real-Time Energy Management Algorithm for Plug-In Hybrid Electric Vehicle Charging Parks Involving Sustainable Energy. IEEE Trans. Sustain. Energy 2013, 5, 577–586. [Google Scholar] [CrossRef]
- Wu, Y.; Zhang, J.; Ravey, A.; Chrenko, D.; Miraoui, A. Real-time energy management of photovoltaic-assisted electric vehicle charging station by markov decision process. J. Power Sources 2020, 476, 228504. [Google Scholar] [CrossRef]
- Jiang, T.; Putrus, G.; Gao, Z.; Conti, M.; McDonald, S.; Lacey, G. Development of a decentralized smart charge controller for electric vehicles. Int. J. Electr. Power Energy Syst. 2014, 61, 355–370. [Google Scholar] [CrossRef]
- Yong, J.Y.; Ramachandaramurthy, V.K.; Tan, K.M.; Mithulananthan, N. Bi-directional electric vehicle fast charging station with novel reactive power compensation for voltage regulation. Int. J. Electr. Power Energy Syst. 2015, 64, 300–310. [Google Scholar] [CrossRef]
- Goli, P.; Shireen, W. PV powered smart charging station for PHEVs. Renew. Energy 2014, 66, 280–287. [Google Scholar] [CrossRef]
- Preetham, G.; Shireen, W. Photovoltaic charging station for Plug-In Hybrid Electric Vehicles in a smart grid environment. In Proceedings of the 2012 IEEE PES Innovative Smart Grid Technologies (ISGT), Washington, DC, USA, 16–20 January 2012; pp. 1–8. [Google Scholar] [CrossRef]
- Faruque, M.; Zhang, Y.; Dinavahi, V. Detailed Modeling of CIGRÉ HVDC Benchmark System Using PSCAD/EMTDC and PSB/SIMULINK. IEEE Trans. Power Deliv. 2005, 21, 378–387. [Google Scholar] [CrossRef]
- Liu, Y.; Tang, Y.; Shi, J.; Shi, X.; Deng, J.; Gong, K. Application of Small-Sized SMES in an EV Charging Station with DC Bus and PV System. IEEE Trans. Appl. Supercond. 2014, 25, 1–6. [Google Scholar] [CrossRef]
- Rahbari, O.; Vafaeipour, M.; Omar, N.; Rosen, M.A.; Hegazy, O.; Timmermans, J.-M.; Heibati, S.; Bossche, P.V.D. An optimal versatile control approach for plug-in electric vehicles to integrate renewable energy sources and smart grids. Energy 2017, 134, 1053–1067. [Google Scholar] [CrossRef]
- Oliveira, D.; De Souza, A.Z.; Delboni, L. Optimal plug-in hybrid electric vehicles recharge in distribution power systems. Electr. Power Syst. Res. 2013, 98, 77–85. [Google Scholar] [CrossRef]
- Arif, M.S.B.; Hasan, M.A. 2—Microgrid architecture, control, and operation. In Hybrid-Renewable Energy Systems in Microgrids; Fathima, A.H., Prabaharan, N., Palanisamy, K., Kalam, A., Mekhilef, S., Justo, J.J., Eds.; Woodhead Publishing: Sawston, UK, 2018; pp. 23–37. [Google Scholar]
- Ayub, S.; Ayob, S.M.; Tan, C.W.; Ayub, L.; Bukar, A.L. Optimal residence energy management with time and device-based preferences using an enhanced binary grey wolf optimization algorithm. Sustain. Energy Technol. Assess. 2020, 41, 100798. [Google Scholar] [CrossRef]
- Belfkira, R.; Zhang, L.; Barakat, G. Optimal sizing study of hybrid wind/PV/diesel power generation unit. Sol. Energy 2011, 85, 100–110. [Google Scholar] [CrossRef]
- Zhang, W.; Ge, W.; Huang, M.; Jiang, J. Optimal Day-Time Charging Strategies for Electric Vehicles considering Photovoltaic Power System and Distribution Grid Constraints. Math. Probl. Eng. 2015, 2015, 1–9. [Google Scholar] [CrossRef]
- Traube, J.; Lu, F.; Maksimović, D. Photovoltaic power system with integrated electric vehicle DC charger and enhanced grid support. In Proceedings of the 2012 15th International Power Electronics and Motion Control Conference (EPE/PEMC), Novi Sad, Serbia, 4–6 September 2012; pp. LS1d.5-1–LS1d.5-5. [Google Scholar]
- Planas, E.; Andreu, J.; Gárate, J.I.; De Alegría, I.M.; Ibarra, E. AC and DC technology in microgrids: A review. Renew. Sustain. Energy Rev. 2015, 43, 726–749. [Google Scholar] [CrossRef]
- Starke, M.; Tolbert, L.; Ozpineci, B. AC vs. DC distribution: A loss comparison. In Proceedings of the 2008 IEEE/PES Transmission and Distribution Conference and Exposition, Chicago, IL, USA, 21–24 April 2008; pp. 1–7. [Google Scholar]
- Techakittiroj, K.; Wongpaibool, V. Co-existance between AC-Distribution and DC-Distribution: In the View of Appliances. In Proceedings of the 2009 Second International Conference on Computer and Electrical Engineering, Dubai, United Arab Emirates, 28–30 December 2009; Volume 1, pp. 421–425. [Google Scholar]
- Ahmed, N.A. On-grid hybrid wind/photovoltaic/fuel cell energy system. In Proceedings of the 2012 10th International Power & Energy Conference (IPEC), Ho Chi Minh City, Vietnam, 12–14 December 2012; pp. 104–109. [Google Scholar]
- Paul, A.; Subramanian, K.; Nachinarkiniyan, S. PV-based off-board electric vehicle battery charger using BIDC. Turk. J. Electr. Eng. Comput. Sci. 2019, 27, 2850–2865. [Google Scholar] [CrossRef]
- Mukherji, A.; Subudhi, P.S.; Krithiga, S. Investigation of a PV Fed Improved Smart Home EV Battery Charging System using Multi Output Hybrid Converter. Int. J. Renew. Energy Res. 2019, 9, 692–703. [Google Scholar]
- Eldeeb, H.; Faddel, S.; Mohammed, O.A. Multi-Objective Optimization Technique for the Operation of Grid tied PV Powered EV Charging Station. Electr. Power Syst. Res. 2018, 164, 201–211. [Google Scholar] [CrossRef]
- Smaoui, M.; Abdelkafi, A.; Krichen, L. Sizing of a stand-alone hybrid system supplying a desalination unit. In Proceedings of the 2014 15th International Conference on Sciences and Techniques of Automatic Control and Computer Engineering (STA), Hammamet, Tunisia, 21–23 December 2014; pp. 820–824. [Google Scholar]
- Chen, S.; Gooi, H.B.; Wang, M. Sizing of energy storage for microgrids. IEEE Trans. Smart Grid 2011, 3, 142–151. [Google Scholar] [CrossRef]
- Saponara, S.; Saletti, R.; Mihet-Popa, L. Hybrid Micro-Grids Exploiting Renewables Sources, Battery Energy Storages, and Bi-Directional Converters. Appl. Sci. 2019, 9, 4973. [Google Scholar] [CrossRef] [Green Version]
- Breyer, C.; Koskinen, O.; Blechinger, P. Profitable climate change mitigation: The case of greenhouse gas emission reduction benefits enabled by solar photovoltaic systems. Renew. Sustain. Energy Rev. 2015, 49, 610–628. [Google Scholar] [CrossRef]
- Stuart, S.; Simon, H. Redflow Investor Presentation; Redflow: Brisbane, Australia, 2015. [Google Scholar]
- Shao, S.; Jahanbakhsh, F.; Aguero, J.R.; Xu, L. Integration of pevs and PV-DG in power distribution systems using distributed energy storage Dynamic analyses. In Proceedings of the 2013 IEEE PES Innovative Smart Grid Technologies Conference (ISGT), Washington, DC, USA, 24–27 February 2013; pp. 1–6. [Google Scholar]
- NREL Transforming Energy. Available online: https://www.nrel.gov/grid/solar-integration-data.html (accessed on 16 June 2020).
- Gueye, S.; Belfkira, R.; Barakat, G.; Yassine, A. A Quadratic Model and A Heuristic for Sizing an Hybrid Renewable Energy System. In Proceedings of the Operational Research Practice in Africa (ORPA), Dakar, Senegal, 18–20 March 2010. [Google Scholar]
- Shao, S.; Pipattanasomporn, M.; Rahman, S. Development of physical-based demand response-enabled residential load models. IEEE Trans. Power Syst. 2013, 28, 607–614. [Google Scholar] [CrossRef]
- Ahmadian, A.; Mohammadi-Ivatloo, B.; Elkamel, A. A Review on Plug-in Electric Vehicles: Introduction, Current Status, and Load Modeling Techniques. J. Mod. Power Syst. Clean Energy 2020, 8, 412–425. [Google Scholar] [CrossRef]
- Rawat, R.; Kaushik, S.; Lamba, R. A review on modeling, design methodology and size optimization of photovoltaic based water pumping, standalone and grid connected system. Renew. Sustain. Energy Rev. 2016, 57, 1506–1519. [Google Scholar] [CrossRef]
- Zhang, L. Optimal Power Management of Parking-Lot Electric Vehicle Charging. Ph.D. Thesis, The University of Texas, Dallas, TX, USA, 2014. [Google Scholar]
- Yilmaz, M.; Krein, P.T. Review of Battery Charger Topologies, Charging Power Levels, and Infrastructure for Plug-In Electric and Hybrid Vehicles. IEEE Trans. Power Electron. 2013, 28, 2151–2169. [Google Scholar] [CrossRef]
- Maleki, A.; Ameri, M.; Keynia, F. Scrutiny of multifarious particle swarm optimization for finding the optimal size of a PV/wind/battery hybrid system. Renew. Energy 2015, 80, 552–563. [Google Scholar] [CrossRef]
- Arfeen, Z.A.; Abdullah, P.; Shehzad, M.F.; Altbawi, S.; Jiskani, M.A.K.; Yiran, M.A.I. A Niche Particle Swarm Optimization-Perks and Perspectives. In Proceedings of the 2020 IEEE 10th International Conference on System Engineering and Technology (ICSET), Shah Alam, Malaysia, 9 November 2020; pp. 102–107. [Google Scholar]


| Sr. No | Design Parameters | Report |
|---|---|---|
| 1 | Grid Electricity Cost () | Hypothetical value for par and below parity |
| 2 | Rated capacity of PV modules | 325 kilowatts |
| 3 | Polycrystalline PV panels | Canadian Solar CS6U-325P |
| 4 | Charging Cost of EV (Chg_Co) | (PV_Co -1.0) = 16 cents/kWhr |
| 5 | Levelized cost of electricity (LCOE) of PV panels (PV_Co) | 17 cents/kWhr [45] |
| 6 | LCOE of ESS (ESS_Co) | 15.2 cents/kWhr [46] |
| 7 | Minimum number of ESS batteries | Find by HHO, GWO, PSO |
| 8 | Minimum number of PV modules | Find by HHO, GWO, PSO |
| 9 | Maximum number of EV Fleets | 150/day |
| 10 | Location of meteorological data | California NREL |
| 11 | EV power Demand (EV_Dmd) | Using model given in [47] |
| 12 | PV Power (PV_Pwr) | By means of a single diode model with meteorological records extracted from [48] |
| 13 | At Parity state (PS) | Mean = LCOE of PV |
| 14 | Below parity @ (0.83PS) | Mean = 1.2 * LCOE of PV |
| 15 | Below parity @ (0.33PS) | Mean = 3 * LCOE of PV |
| 16 | Grid electricity cost () | Variation depend upon load |
| 17 | SOC of (ESS_Pwr) | Mathematical model from [49] |
| EV Model | Commute Percent | Capacity Consumption | Energy Mileage |
|---|---|---|---|
| % | kWh | kWh/miles | |
| Sedan Delux | 32 | 0.2 | 0.2 |
| Full size Sedan Standard | 38 | 0.3 | 0.3 |
| Average (Mid) size SUV | 20 | 0.45 | 0.45 |
| Full size SUV | 10 | 0.6 | 0.6 |
| Decision Parameters | Notation |
|---|---|
| Position of Harris Hawk, Position ofHarris Hawk | |
| Prey best position | |
| Location of a random agent | |
| Mean position of swarm | |
| Number of eagles, iteration metrics, max set-bounds | |
| Randomly value in range (0,1) | |
| Dimensions, upper and lower bounds of decision variables | |
| Escape Energy, Initial Escape Energy |
| Fleet of EVs | Optimization | Fitness Function @ Convergence | ||
|---|---|---|---|---|
| = 100, = 900, = 10, = 50 | ||||
| 150 | HHO | 765 | 43 | 0.02805 |
| 763 | 44 | 0.04194 | ||
| 760 | 42 | 0.00833 | ||
| PSO | 765 | 43 | 0.02198 | |
| 752 | 32 | 0.06610 | ||
| GOA | 765 | 43 | 0.01591 | |
| 43 | 13 | 0.2438 | ||
Publisher’s Note: MDPI stays neutral with regard to jurisdictional claims in published maps and institutional affiliations. |
© 2021 by the authors. Licensee MDPI, Basel, Switzerland. This article is an open access article distributed under the terms and conditions of the Creative Commons Attribution (CC BY) license (https://creativecommons.org/licenses/by/4.0/).
Share and Cite
Arfeen, Z.A.; Abdullah, M.P.; Sheikh, U.U.; Azam, M.K.; Sule, A.H.; Fizza, G.; Hasan, H.S.; Khan, M.A. Novel Supervisory Management Scheme of Hybrid Sun Empowered Grid-Assisted Microgrid for Rapid Electric Vehicles Charging Area. Appl. Sci. 2021, 11, 9118. https://doi.org/10.3390/app11199118
Arfeen ZA, Abdullah MP, Sheikh UU, Azam MK, Sule AH, Fizza G, Hasan HS, Khan MA. Novel Supervisory Management Scheme of Hybrid Sun Empowered Grid-Assisted Microgrid for Rapid Electric Vehicles Charging Area. Applied Sciences. 2021; 11(19):9118. https://doi.org/10.3390/app11199118
Chicago/Turabian StyleArfeen, Zeeshan Ahmad, Md Pauzi Abdullah, Usman Ullah Sheikh, Mehreen Kausar Azam, Aliyu Hamza Sule, Ghulam Fizza, Hameedah Sahib Hasan, and Muhammad Ashfaq Khan. 2021. "Novel Supervisory Management Scheme of Hybrid Sun Empowered Grid-Assisted Microgrid for Rapid Electric Vehicles Charging Area" Applied Sciences 11, no. 19: 9118. https://doi.org/10.3390/app11199118