Article

Woodworking Tool Wear Condition Monitoring during Milling Based on Power Signals and a Particle Swarm Optimization-Back Propagation Neural Network

1
College of Furnishings and Industrial Design, Nanjing Forestry University, Nanjing 210037, China
2
Co-Innovation Center of Efficient Processing and Utilization of Forest Resources, Nanjing Forestry University, Nanjing 210037, China
*
Author to whom correspondence should be addressed.
Appl. Sci. 2021, 11(19), 9026; https://doi.org/10.3390/app11199026
Submission received: 1 September 2021 / Revised: 15 September 2021 / Accepted: 18 September 2021 / Published: 28 September 2021
(This article belongs to the Topic Machine and Deep Learning)

Abstract

:
In the intelligent manufacturing of furniture, the power signal has the characteristics of low cost and high accuracy and is often used as a tool wear condition monitoring signal. However, the power signal is not very sensitive to tool wear conditions. The present work addresses this issue by proposing a novel woodworking tool wear condition monitoring method that employs a limiting arithmetic average filtering method and particle swarm optimization (PSO)-back propagation (BP) neural network algorithm. The limiting arithmetic average filtering method was used to process the power signal and extracted the features of the woodworking tool wear conditions. The spindle speed, depths of milling, features and tool wear conditions were used as sample vectors. The PSO-BP neural network algorithm was used to establish the monitoring model of the woodworking tool wear condition. Experiments show that the proposed limiting arithmetic average filtering method and PSO-BP neural network algorithm can accurately monitor the woodworking tool wear conditions under different milling parameters.

1. Introduction

Woodworking tools are one of the most important tools in the intelligent manufacturing of furniture [1,2]. The cutting edge of the tool and the material to be processed interact to produce a force that causes the tool to wear [3]. Severe tool wear will cause defects such as tearing, digging and cutting of the edge surface of the wooden furniture during cutting [4], which affects the surface roughness of the edge processing of the wooden furniture and the overall appearance of the wooden furniture [5,6,7]. Timely replacement of worn tools can improve product quality and reduce production costs [8,9,10]. Therefore, research on the monitoring technology of woodworking tool wear conditions is of great significance to improve the cutting performance of woodworking tools and promote the development of intelligent furniture manufacturing technology.
Wood-plastic composite materials (WPC) are composite materials made of wood powder and thermoplastics which are widely used in furniture manufacturing, such as decorative panels, railings, cladding, wall panels, windows and door frames [11]. WPC has extremely high corrosion resistance and a low manufacturing cost, and it is a recyclable environmentally friendly green material. With superior mechanical properties, the utilization rate and market share of WPC are gradually increasing [12]. In the process of producing WPC, the size of wood powder particles is different, which causes the internal structure of WPC to have inhomogeneity properties [13]. Inhomogeneity causes interference to the power signal of the machine tool spindle in the cutting of WPC, including periodic disturbances of current and voltage fluctuations and random disturbances of the machine tool vibration. Therefore, the monitoring signals collected during the cutting process of woodworking tools contain various forms of interference [14,15], and the monitoring signals need to be processed.
The monitoring method of tool wear conditions is mainly based on the cutting force signal [16,17,18,19]. Ma et al. collected cutting force signals in the milling of TC18 and used a convolutional bidirectional long- and short-term memory network (CNN + BILSTM) and a convolutional bidirectional gated loop unit (CNN + BIGRU) to accurately monitor tool wear conditions [20]. However, the cutting force signal is affected by the structure of the machine tool and the processing environment during the manufacturing process of wooden furniture. The power signal is directly related to the cutting force signal, and the power signal acquisition is not affected by the clamping structure of the machine tool. Dong et al. used a discrete wavelet transform to process the spindle power signal during WPC milling, and used the BP neural network optimized by the genetic algorithm to train the monitoring model to monitor the tool wear conditions [21]. Therefore, the power signal can be used in tool wear condition monitoring.
The accuracy of tool wear monitoring depends on the authenticity of the features extracted from the signal and the reliability of the monitoring model. Researchers have conducted a lot of explorations on tool wear conditions monitoring technology using power signals. In the feature extraction method, Shen et al. used the Hilbert–Huang transform (HHT) algorithm to extract two features from the spindle power signals of different machining states to detect tool wear, and found that the extracted features are highly correlated with the tool wear condition [22]. Gajewski et al. used the discrete wave transform (DWT) to process the noise of the power signal and specified the features of the power signal, which was later used as the input data of the fuzzy neural network to classify the tool wear conditions [23]. In the monitoring model, Rodrigo et al. measured and classified the cutting power and acoustic emission signals in the milling process; they then used a probabilistic neural network to establish a tool wear monitoring model, and found that the monitoring accuracy reached 91% [24]. Du et al. considered cutting parameters and tool wear values as variables and used time-frequency domain analysis to extract important features of vibration signals as input for neural network pattern recognition. They then established a wear condition monitoring model through the adaptive learning of a BP neural network [25]. Compared with a probabilistic neural network, the BP neural network has excellent ability to process classification issues, which are widely used in the field of fault diagnosis [26]. The classification accuracy of the BP neural network is affected by the weight, threshold, and the number of hidden layers [27]. Meanwhile, the BP neural network has the shortcoming of rapid convergence; it is also easy for this network to fall into the minimum value. These problems can be solved using intelligent optimization algorithms [28]. Feng et al. used the adaptive particle swarm optimization (PSO) algorithm to overcome the shortcomings of BP neural networks, which are easily trapped in the local optimum and have a long training time [29]. The particle swarm optimization (PSO) algorithm has characteristics such as rapidity and robustness, which are widely used in the optimization of the network parameters of the BP neural network.
The purpose of this research is focused on the problem of woodworking tool wear condition monitoring and proposes a limiting arithmetic average filtering method and PSO-BP neural network algorithm. The method includes three processing stages. In stage one, the spindle power signals under different spindle speeds, depths of milling and tool wear conditions were collected. In stage two, the limiting arithmetic average filtering method is used to process the spindle power signal and extract the features of the woodworking tool wear conditions. Finally, the spindle speed, depths of milling, features and tool wear conditions were used as sample vectors, and subsequently, the PSO-BP neural network algorithm was used to establish a woodworking tool wear monitoring model through the sample to achieve high-precision monitoring of woodworking tool wear conditions under different milling parameters.

2. Experimental Program

The wood-plastic composite material (WPC) prepared by Kolo Material Co., Ltd. (Hefei, China) was selected as the cutting workpiece. The size of the cutting workpiece was 960 mm × 630 mm × 8 mm. The main components and mechanical properties are shown in Table 1.
The milling test was carried out on the MGK01 high-speed wood composite machining center manufactured by Nanxing Machinery Co., Ltd. (Dongguan, China).
The carbide single-tooth shank milling cutter produced by Boshen Prigo (Shanghai) Tools Co., Ltd. (Shanghai, China) was selected as the cutting tool. The tool geometries are shown in Table 2.
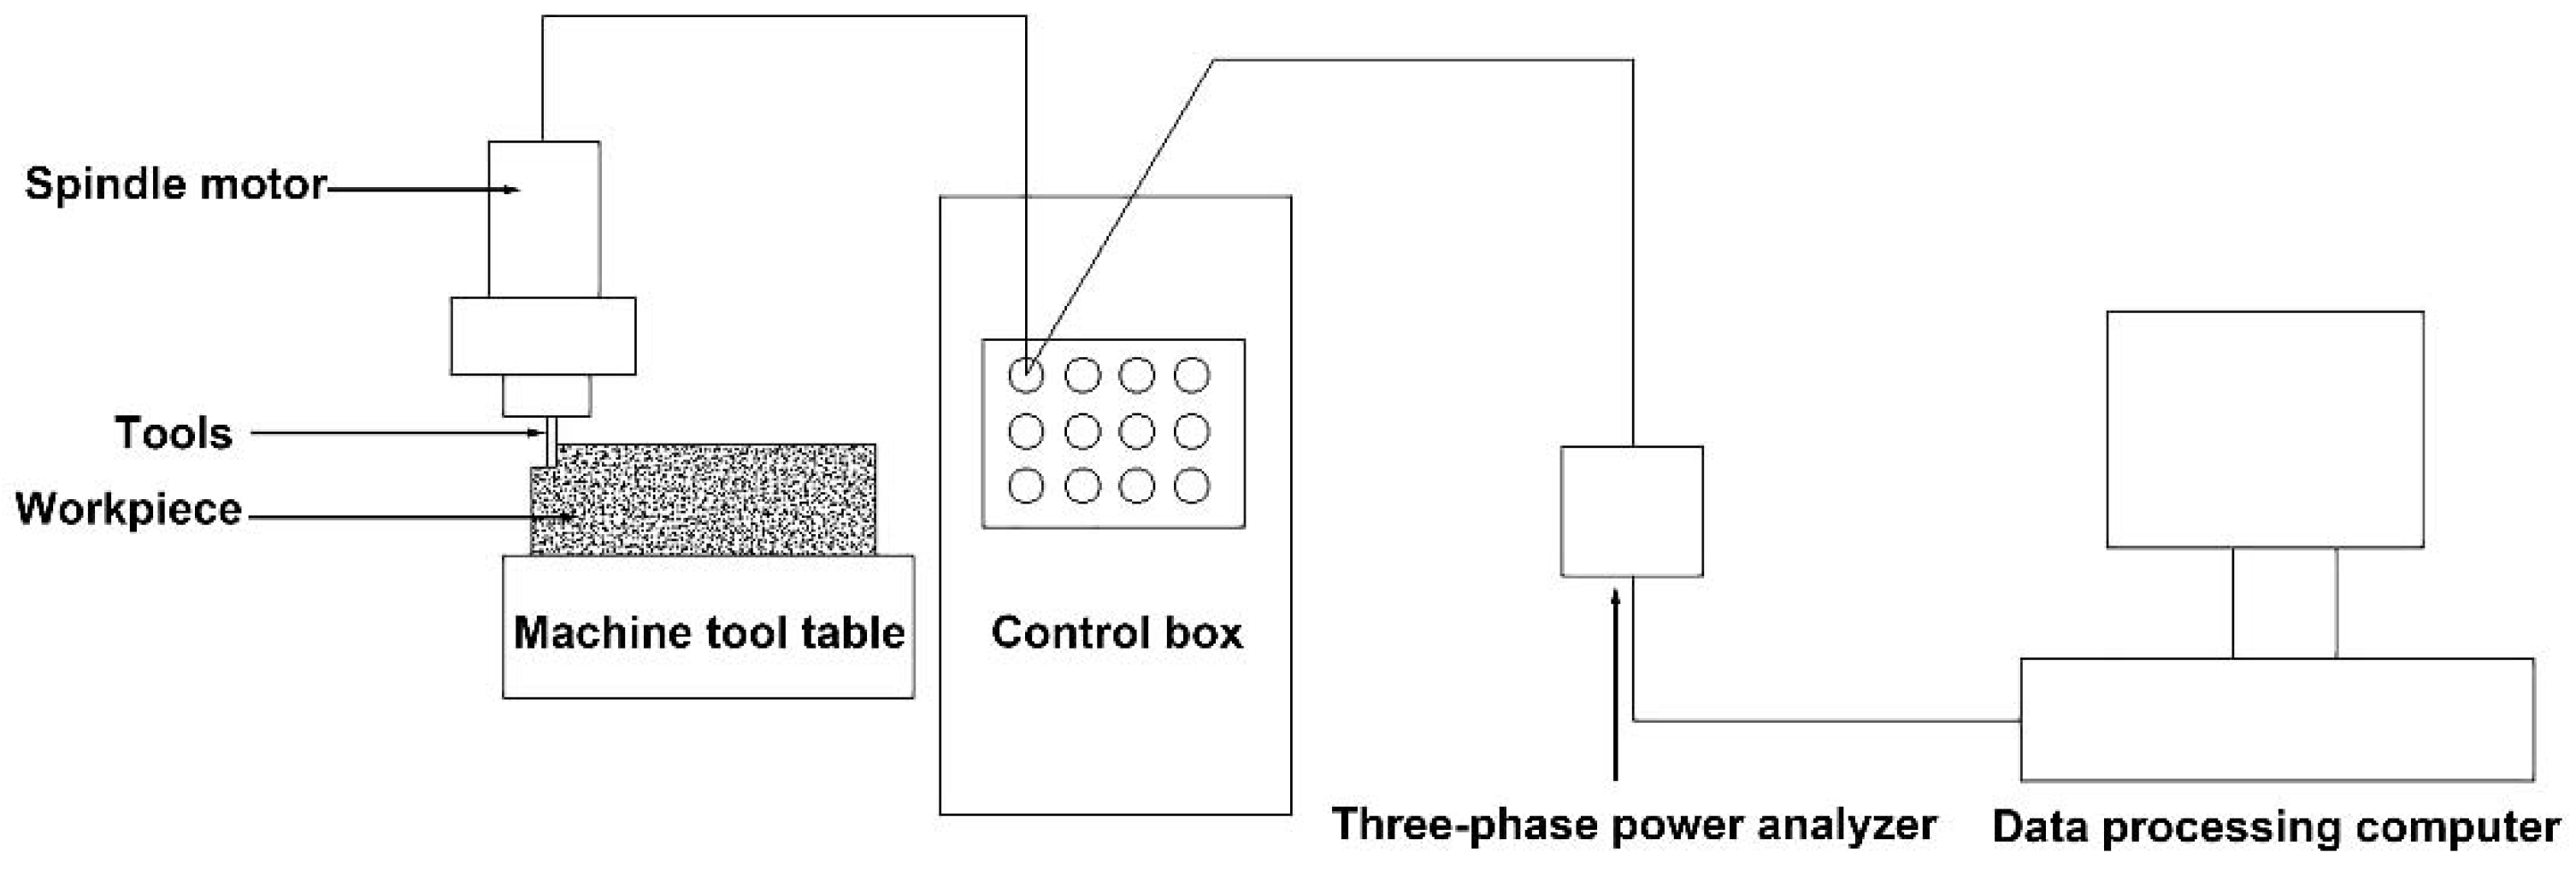
The AN87300 three-phase power analyzer produced by Ainuo Intelligent Instrument Co., Ltd. (Qingdao, China) was used to collect the power signal of the machine tool spindle. The sampling frequency of the three-phase power analyzer is the same as that of the machine tool, which is constant at 50 Hz. The power signal acquisition system is shown in Figure 1. The three-phase analyzer was connected to the input terminal of the spindle motor of the machine tool control box and the data processing computer to realize the real-time acquisition of the spindle power signal.
The plan of the spindle power signal acquisition was planned by varying the milling parameters, as shown in Table 3.

3. Description of the Proposed Method

3.1. Limiting Arithmetic Average Filtering Method

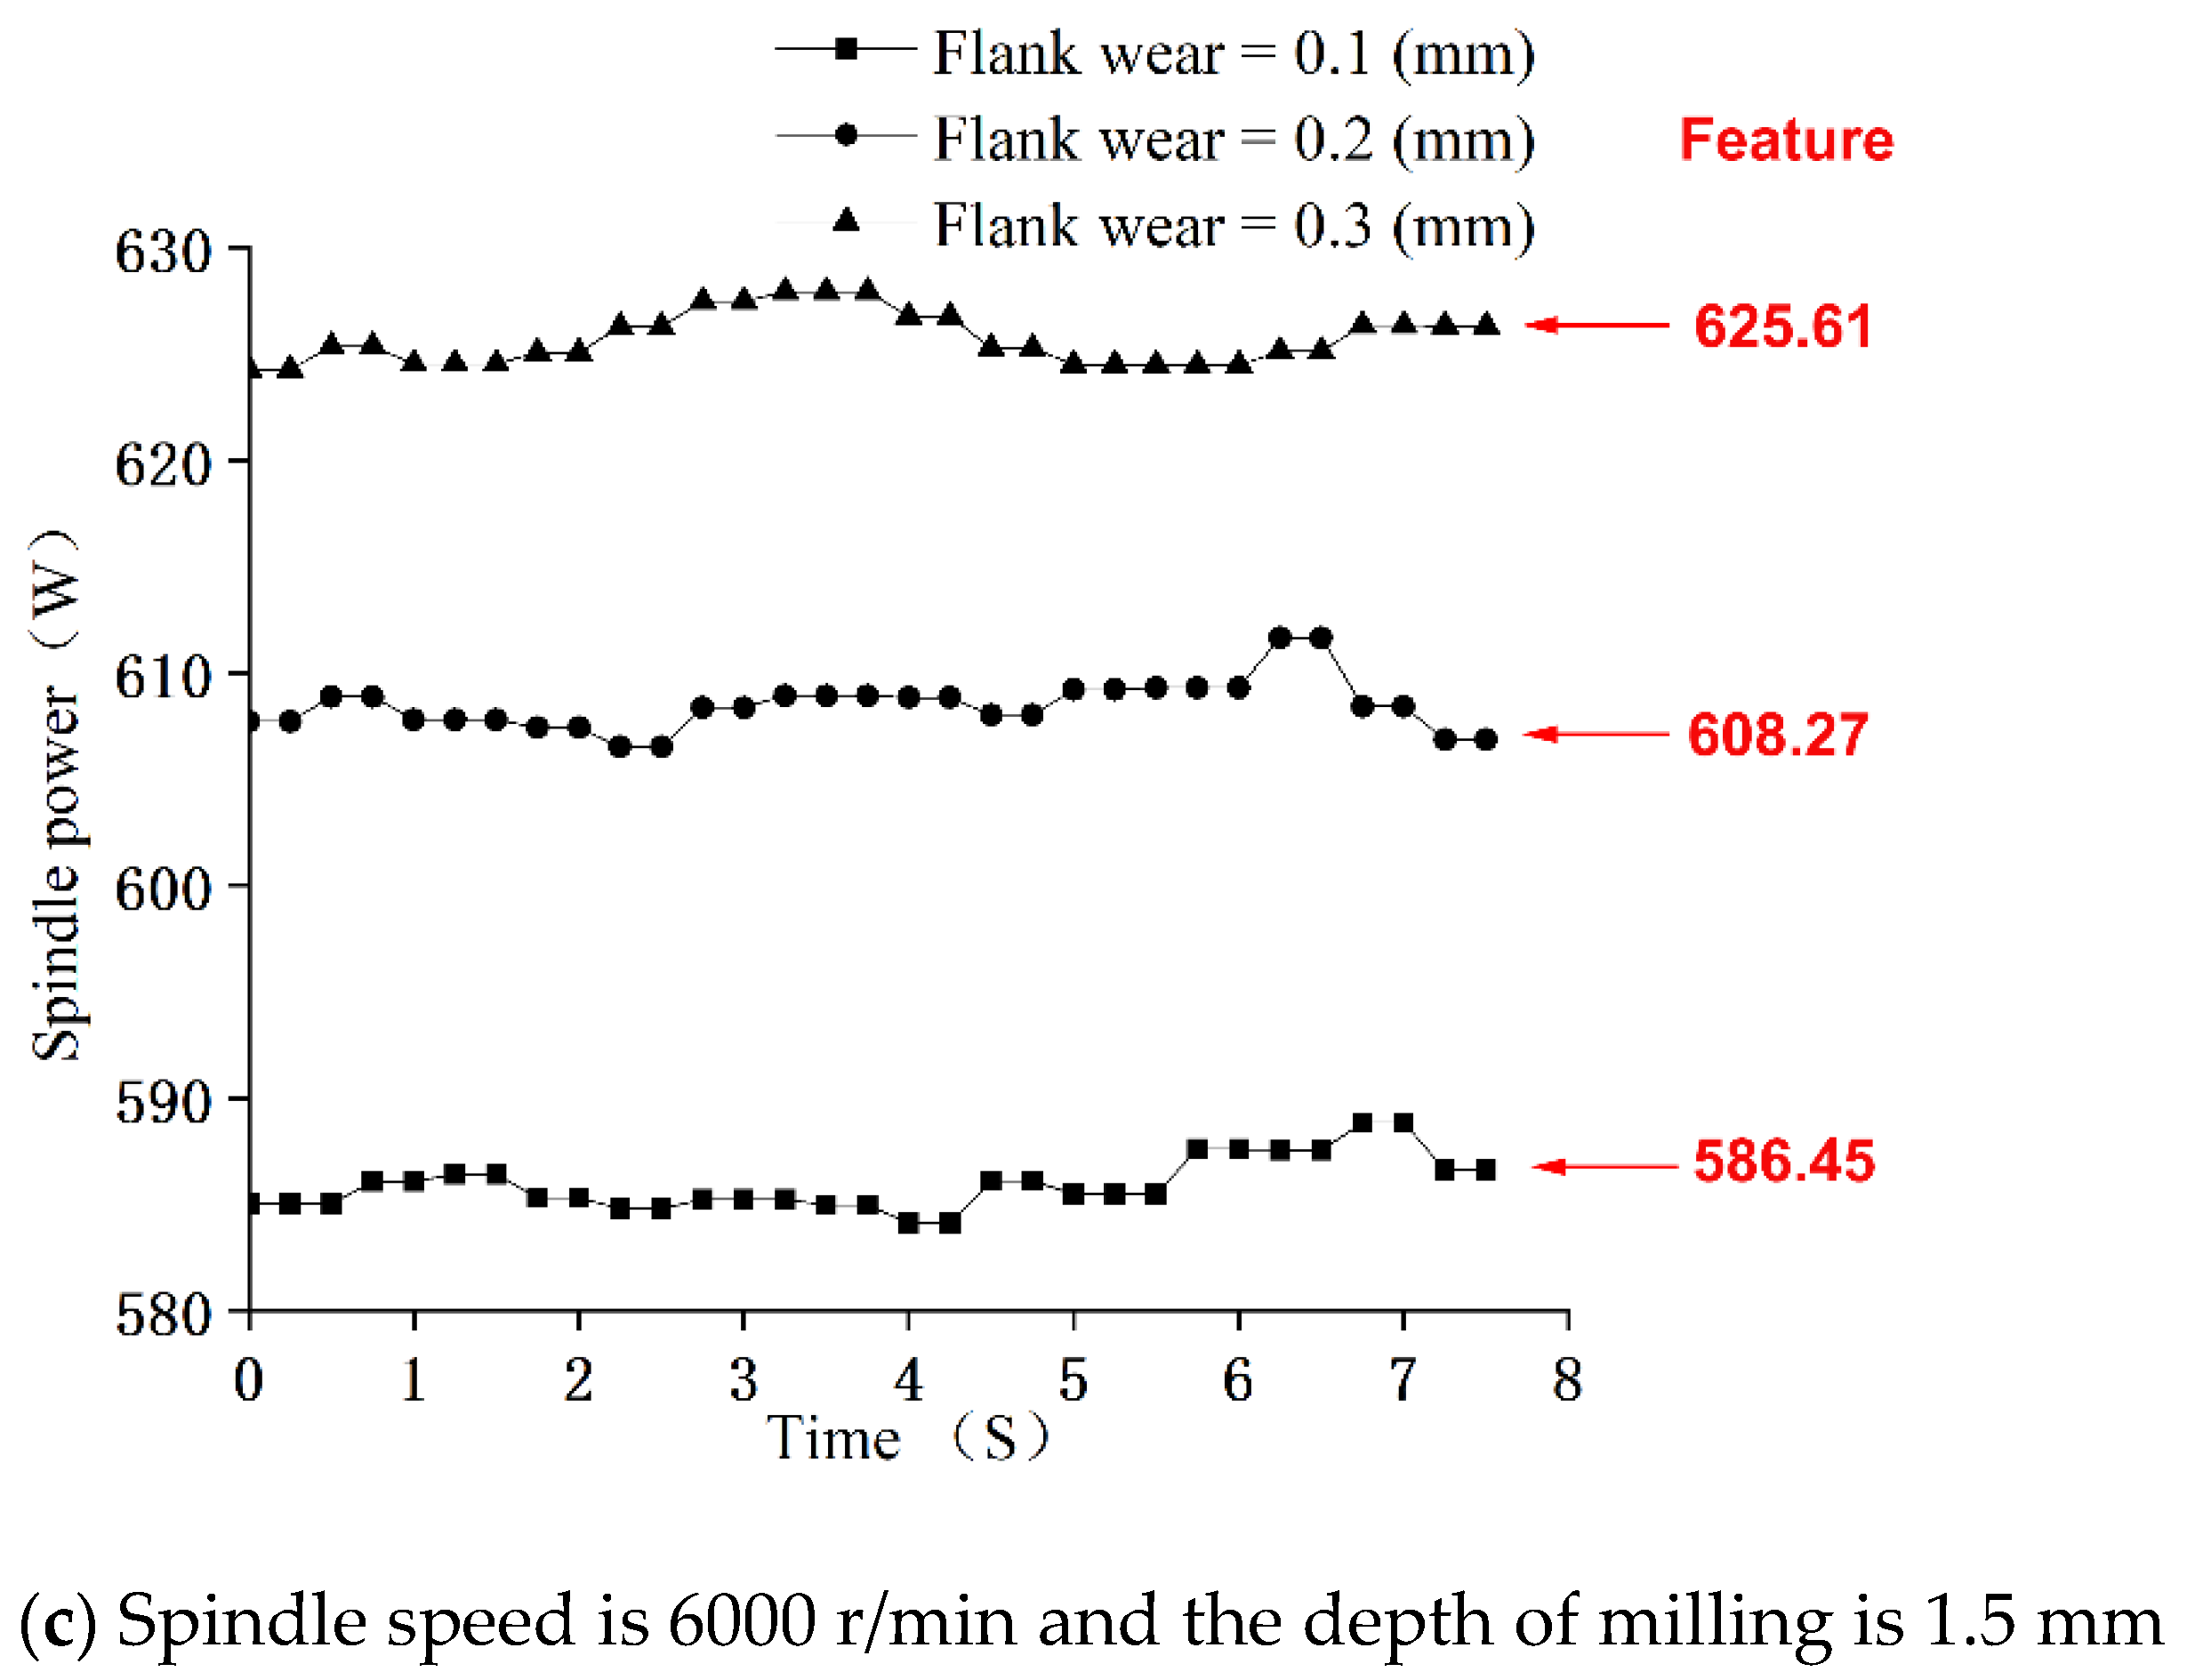
The limiting arithmetic average filtering method is a common method used to process signals. The limiting arithmetic average filtering method can process the spindle power signal and extract the features of the woodworking tool wear conditions. The steps of the limiting arithmetic average filtering method are as follows:
Step 1: Set the maximum sampling deviation (Y) of the limiting filter method.
Step 2: Use a high-precision three-phase power analyzer to collect the spindle power signal when the machine tool is cutting the workpiece.
Step 3: Determine the deviation (Xi) of the two-adjacent data of the spindle power signal according to the acquisition time sequence: When | X i Y | , the two data are retained, and when | X i > Y | , the average value of the two data is used as the output result.
Step 4: Repeat the judgment until the filtering of a group of spindle power signals ends.
Step 5: Use the arithmetic average filtering method to arithmetically average the filtered spindle power signal.
Step 6: Output the features of the woodworking tool wear conditions.

3.2. Back Propagation Neural Network

Rumelhart and McClelland proposed the back propagation neural network in 1985 [30]. The BP neural network is an effective nonlinear problem modeling algorithm which has wide applications in many research fields [31]. The performance of the BP neural network depends on the network structure, training algorithm and parameter selection. Choosing a suitable network structure and optimal weight set can make the BP neural network have higher accuracy and convergence speed.
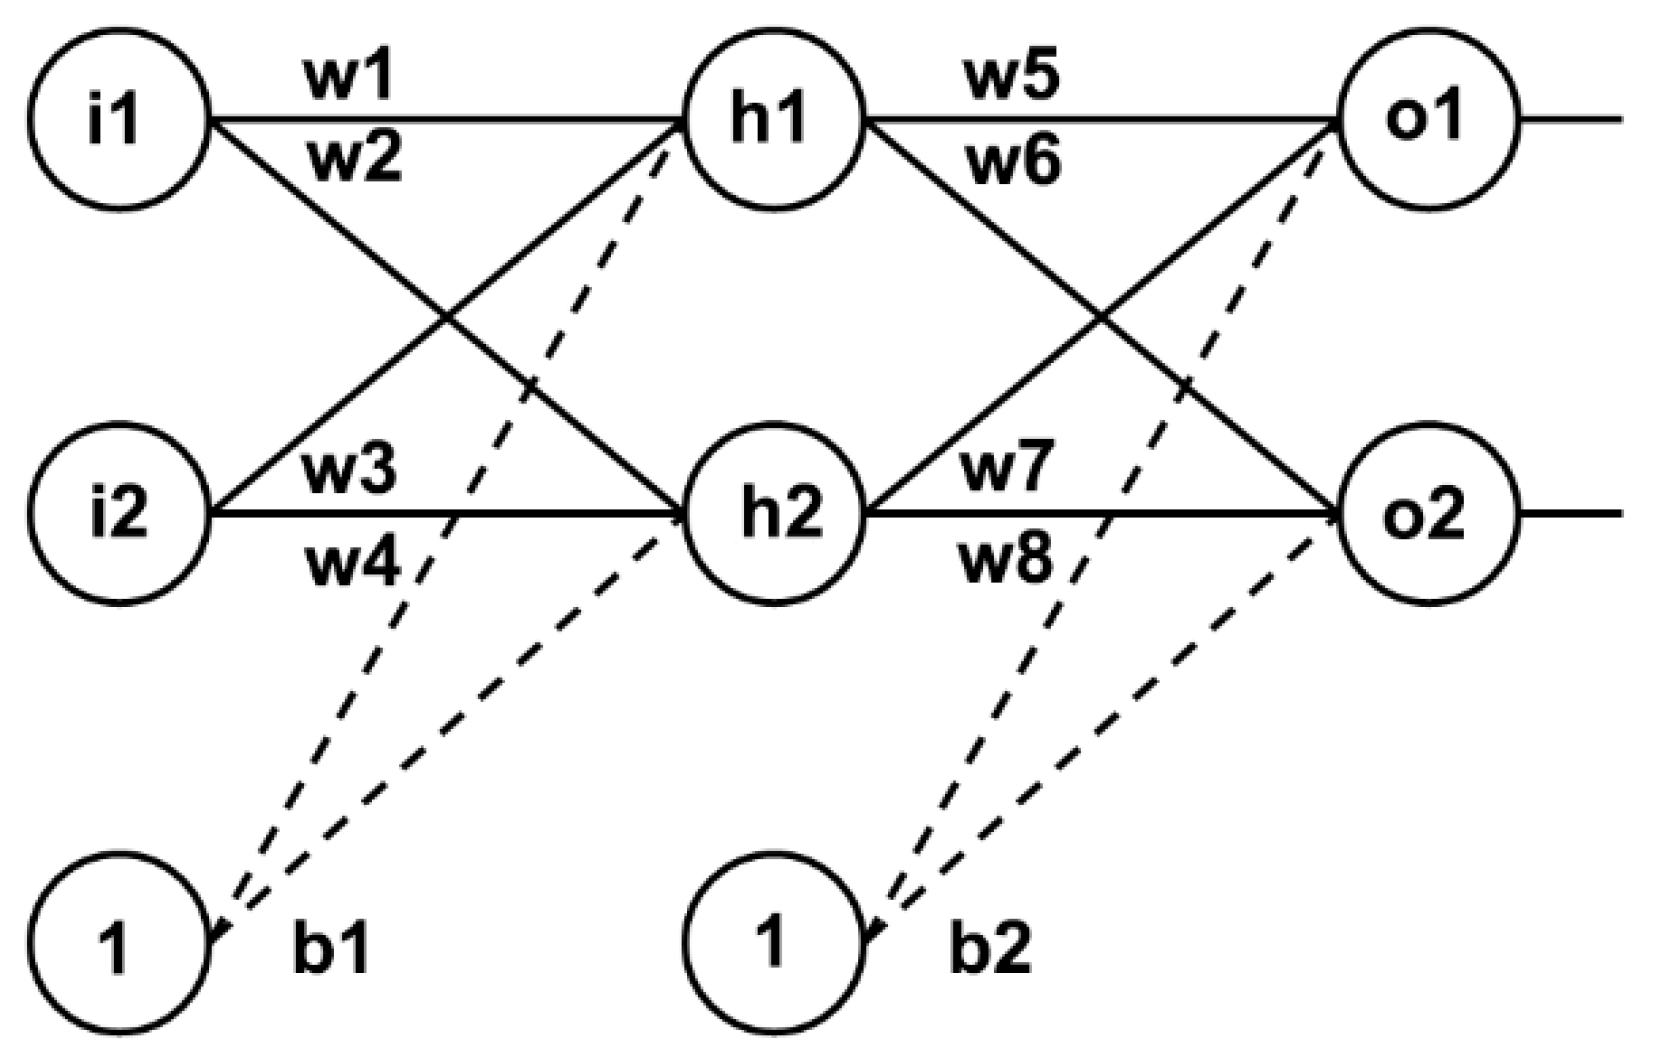
Figure 2 shows a common three-layer BP neural network structure. The BP neural network includes input layer neurons (i1, i2), hidden layer neurons (h1, h2) and output layer neurons (o1, o2). The input layer neuron and the hidden layer each contain a deviation (b1, b2), and the hidden layer, the input layer neuron and the output layer neuron also contain a weight (wi).

3.3. Particle Swarm Optimization Algorithm

The particle swarm optimization algorithm is a global random search algorithm proposed by Kennedy and Eberhart based on the bird swarm foraging phenomenon [32]. The PSO algorithm has excellent global optimization capabilities and is often used to optimize the parameters of neural networks. The PSO algorithm searches for the optimal solution by designing a particle that simulates birds. The particles have two attributes: speed and position. When each particle searches for the optimal solution, it continuously marks itself as an individual extreme value, and shares the individual extreme value with other particles until the optimal individual extreme value is found [33]. The speed and position of the particles are adjusted by searching for individual extremums and global optimal solutions [34].
The classification accuracy of the BP neural network is affected by the weight, threshold, and the number of hidden layers. The BP neural network has the shortcoming of rapid convergence; furthermore, it is easy for this algorithm to fall into the minimum value. These problems can be solved using intelligent optimization algorithms. The PSO algorithm has characteristics such as rapidity and robustness, which are widely used in the optimization of network parameters of BP neural network [35].
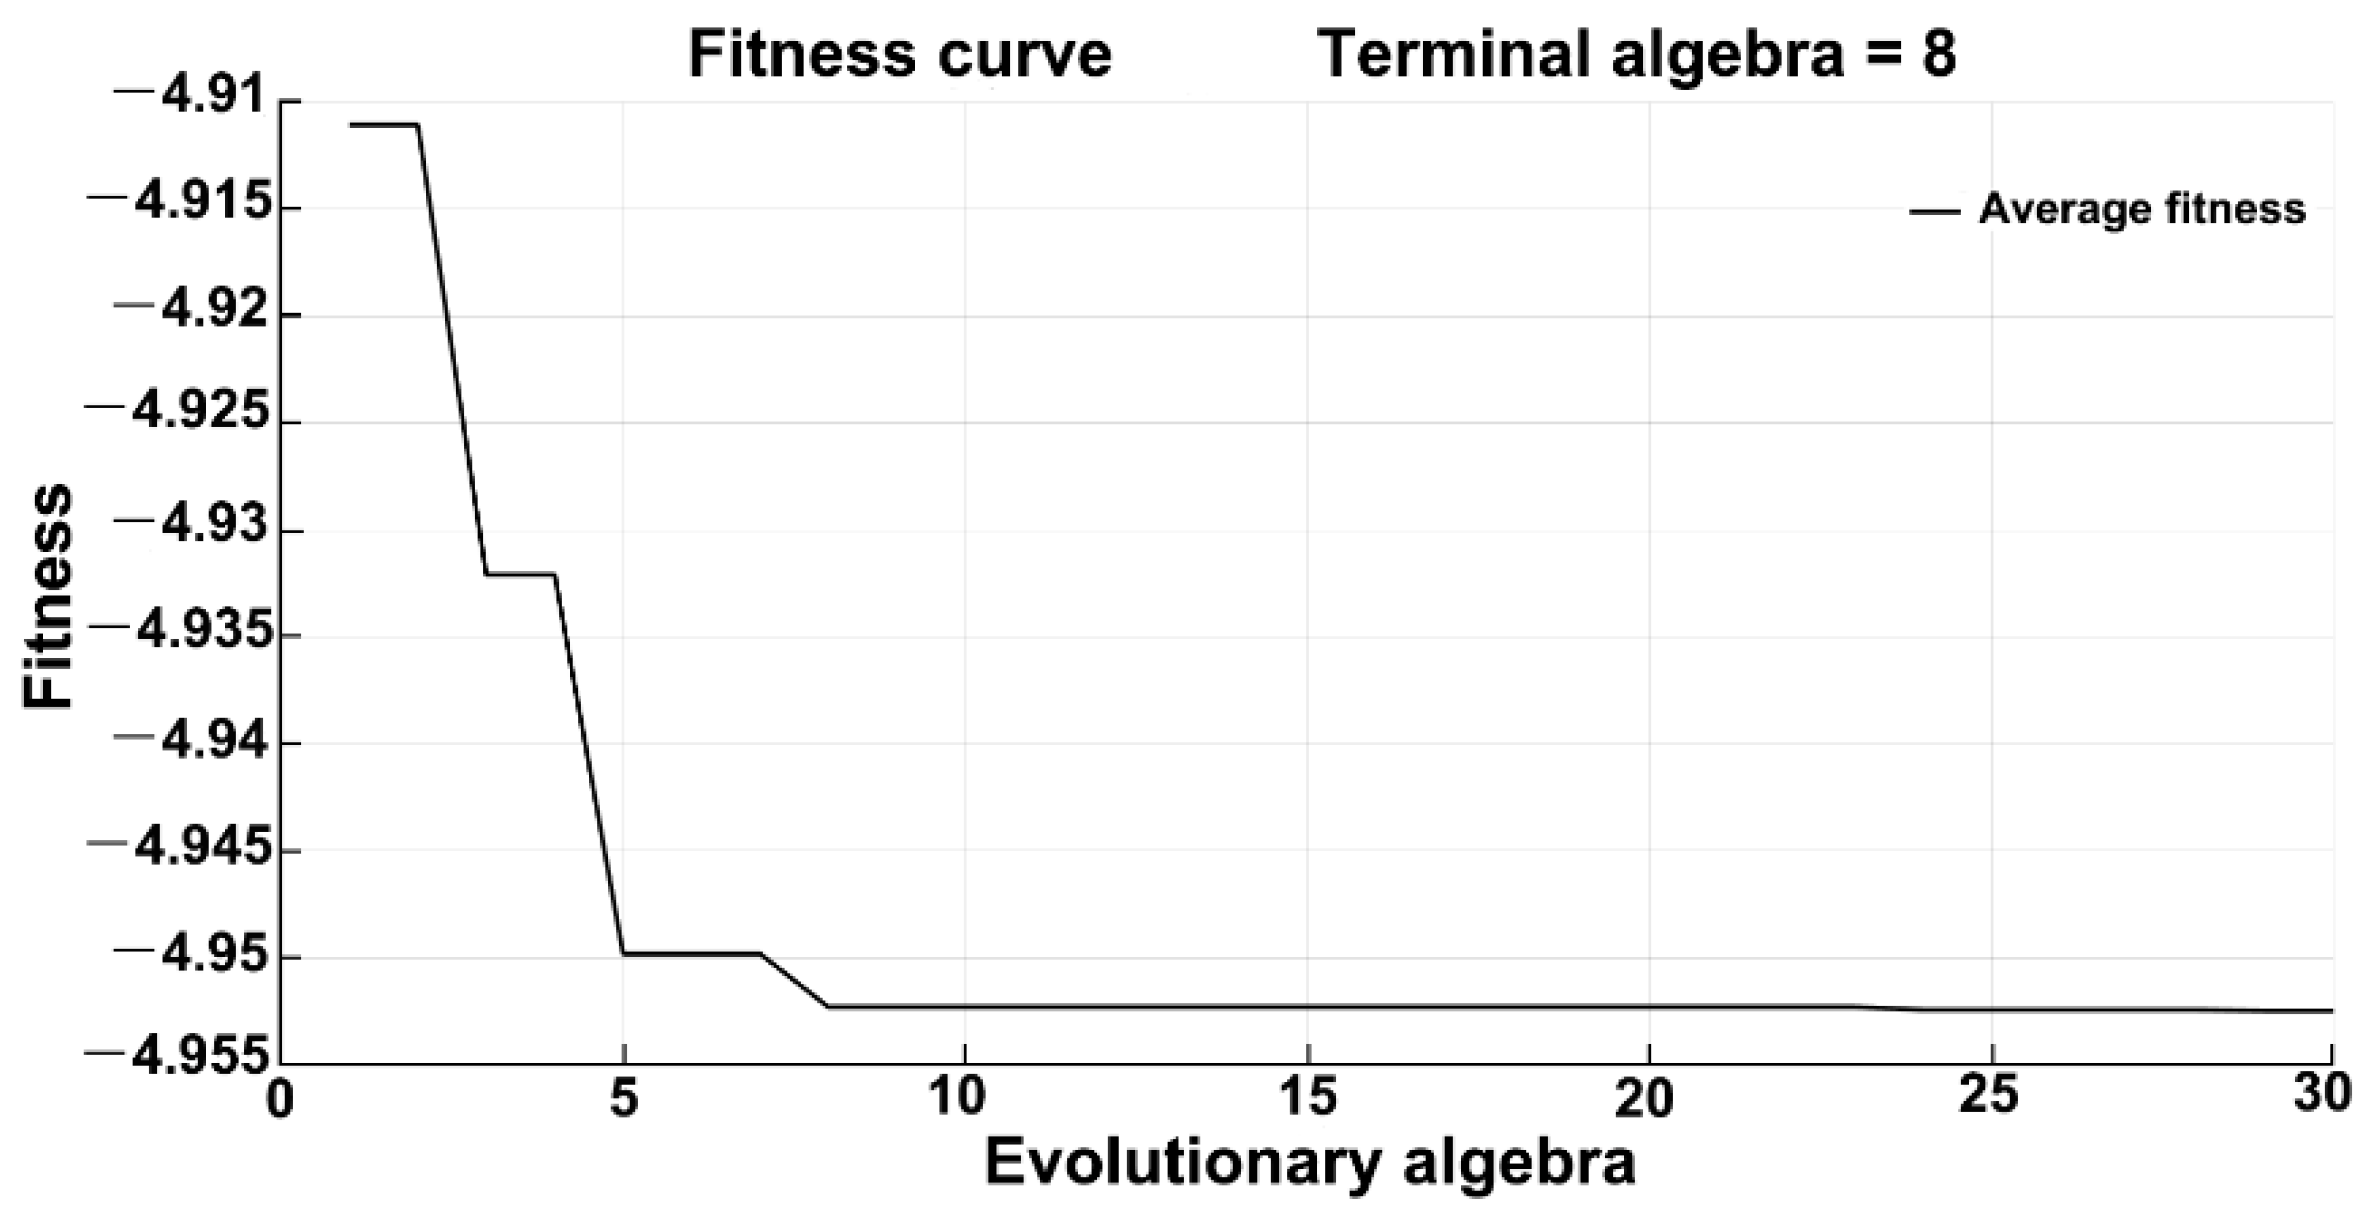
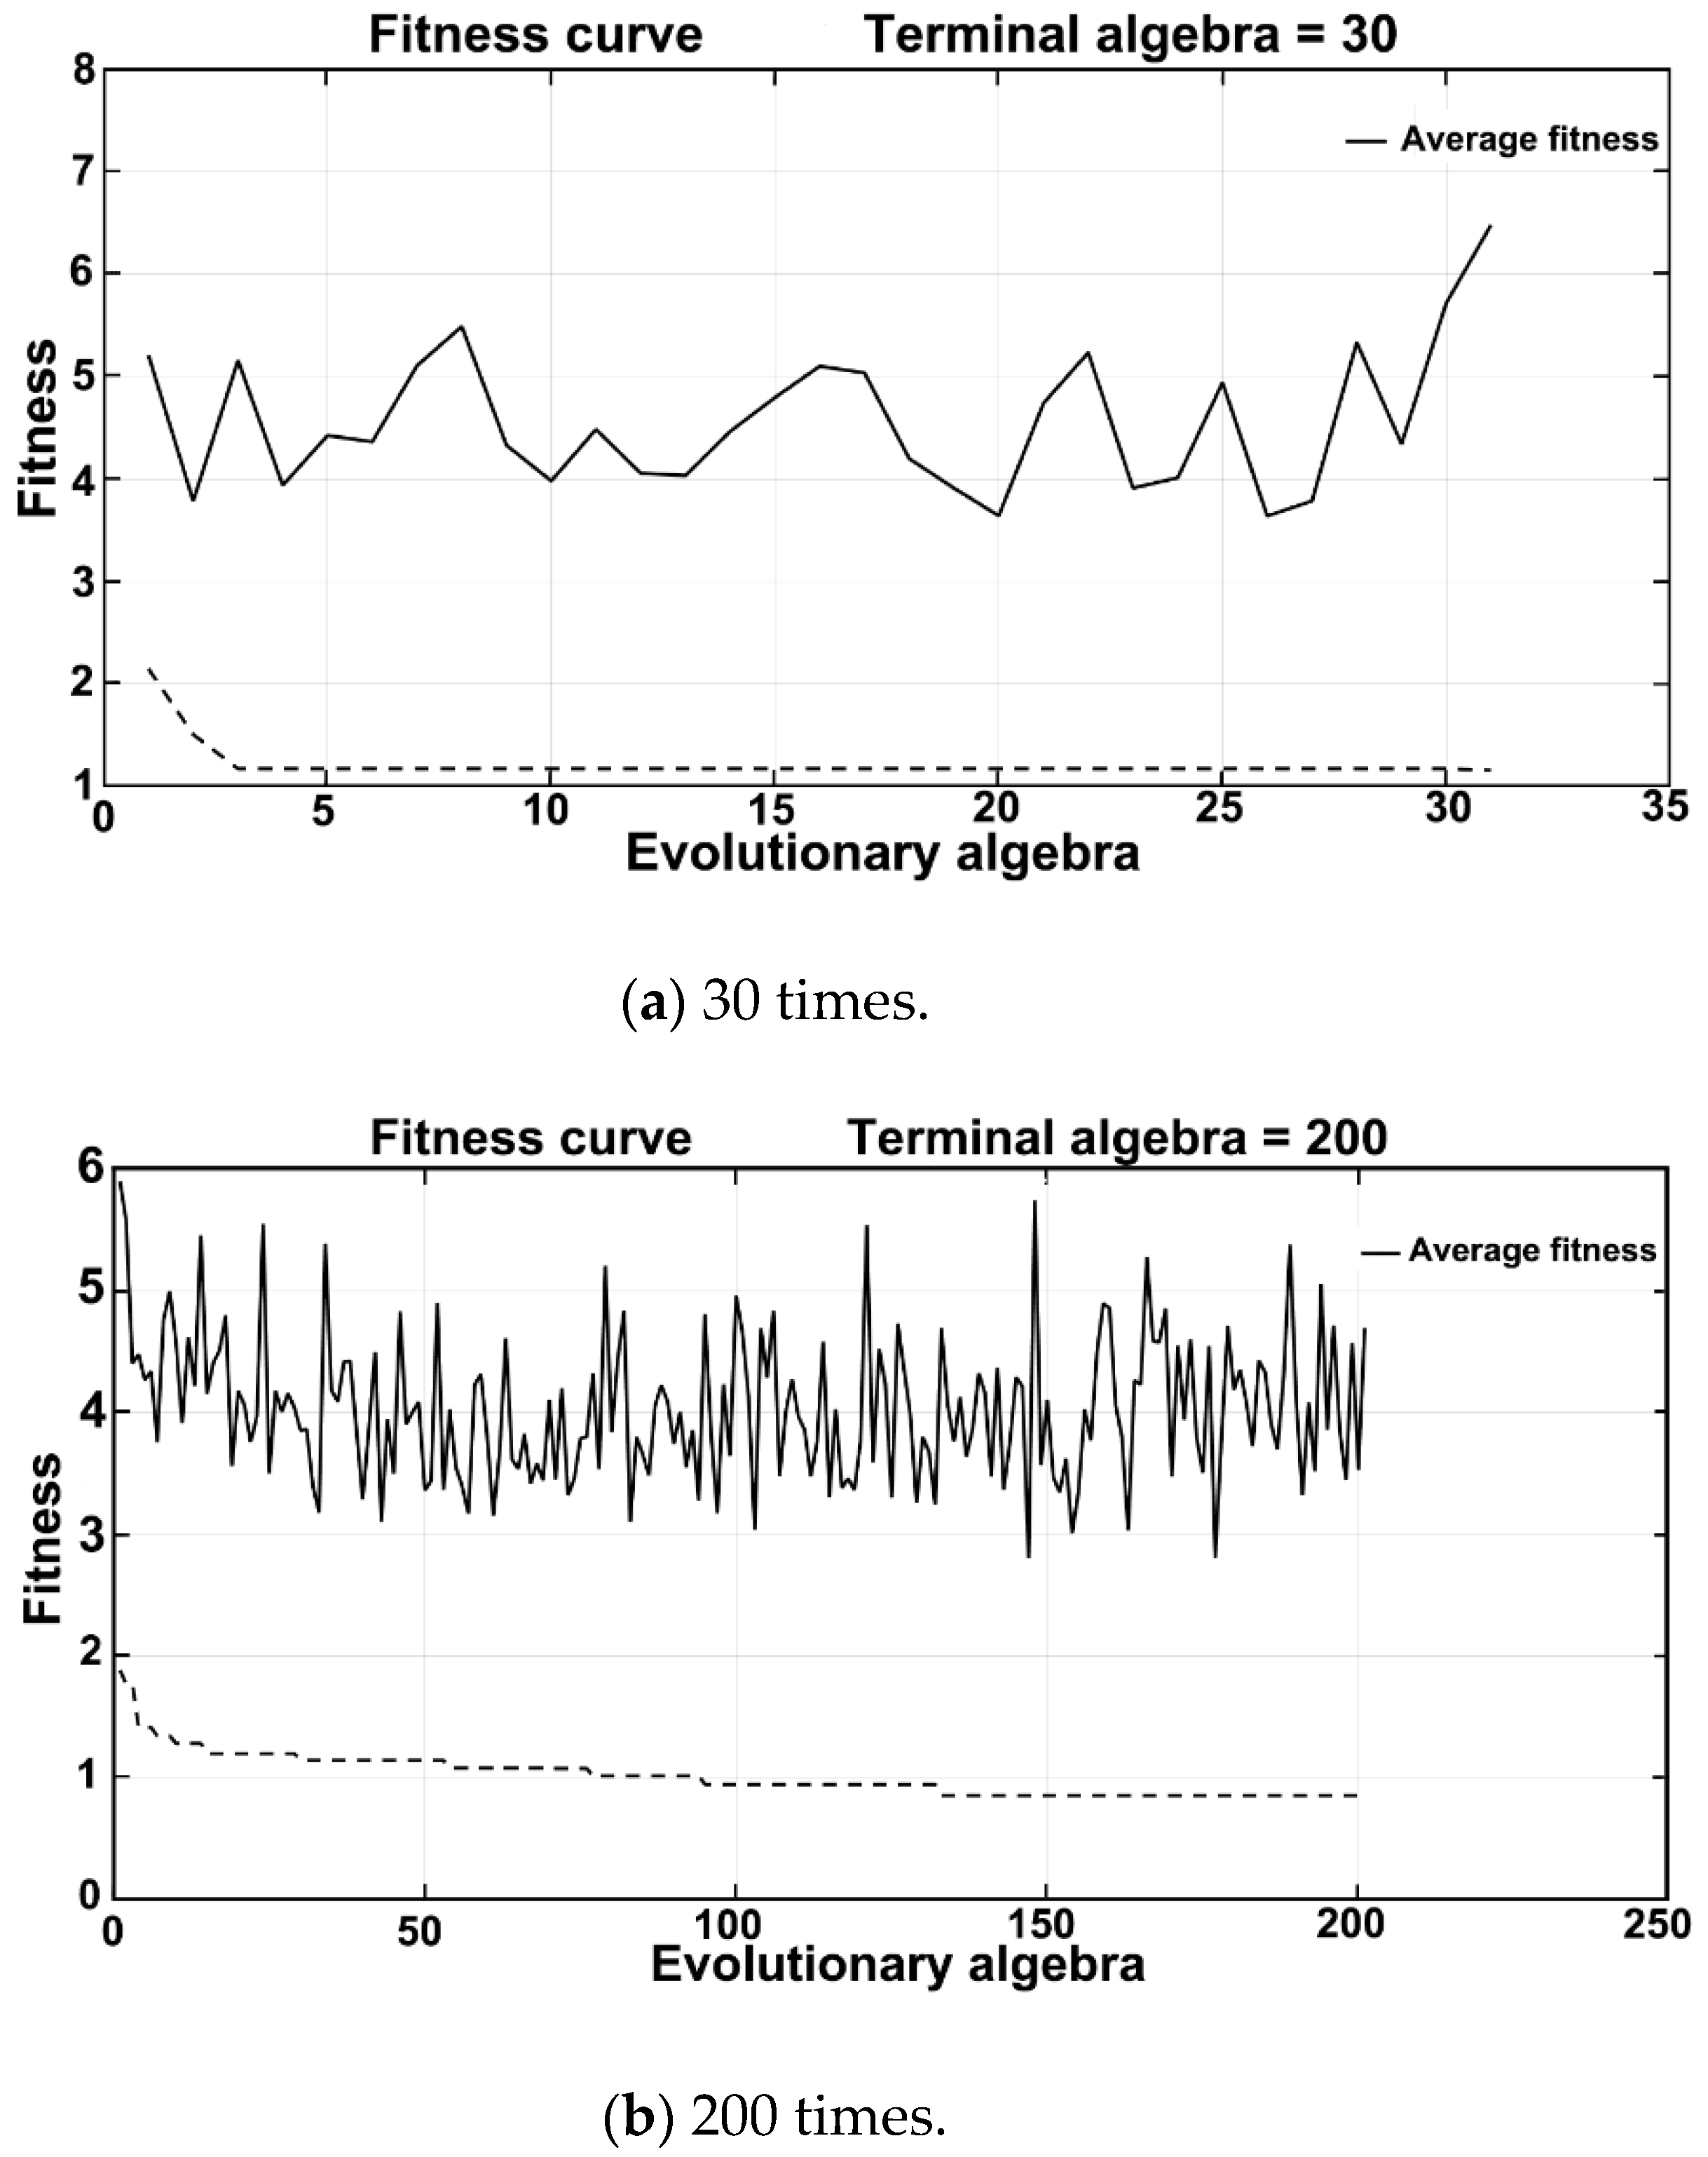
The PSO algorithm optimization of the BP neural network process is as follows:
Step 1: Initialize the parameters of the BP neural network and the relevant parameters in the particle swarm algorithm.
Step 2: Update the speed and position of individual particles in the particle swarm.
Step 3: Update the individual extremum and global extremum in the particle swarm.
Step 4: Update the fitness of the particles and the global optimal fitness.
Step 5: Cycle the optimization.
Step 6: Output the optimal extremum and the weights and thresholds of the BP neural network.

4. Monitoring Model Results

4.1. Spindle Power Data in Process Analysis

The tool wear condition is usually divided into three categories: initial wear (flank wear is 0.1 mm), normal wear (flank wear is 0.2 mm) and rapid wear (flank wear is 0.3 mm), as shown in Figure 3.
The maximum sampling deviation (Y) was selected as 0.1 to process the spindle power signal. Figure 4 shows the comparison of the features and the average value of the spindle power signal under different milling parameters. In Figure 4, the average value of the spindle power signal is numerically the same as the features of the woodworking tool wear conditions. Therefore, it is effective to use the limiting arithmetic average filtering method to extract the features of the woodworking tool wear conditions.
Table 4 shows a sample of woodworking tool wear conditions under different milling parameters. The spindle speed, depth of milling, and features of the spindle power signal were used as input vectors, and the tool wear conditions were used as the output vector.

4.2. Establishment of Monitoring Model

The PSO-BP neural network was used to establish a monitoring model for the woodworking tool wear conditions in MATLAB (MathWorks Inc., Natick, MA, USA). The evolutionary algebra of the particle swarm algorithm was 30, the minimum error was 0.001, the particle swarm size was 40, the maximum flying speed of the particle was 0.5, the maximum inertia factor was 0.9, and the minimum inertia factor was 0.3. The learning rate of the BP neural network was 0.01, the number of training times was 20, the training accuracy was 0.0001, and the number of hidden layers was 5 layers.
Figure 5 shows the fitness curve of the PSO algorithm of the monitoring model. When the evolutionary algebra was 8, the fitness remained the same. The PSO algorithm reached the state of convergence; the optimization effect of the PSO algorithm was the best, and the prediction accuracy of the BP neural network was the highest.
Figure 6 shows the prediction accuracy of the established woodworking tool wear monitoring model. The predicted output of all test samples in the figure is basically the same as the actual expected output. Combined with the prediction error analysis of the PSO-BP neural network algorithm in Table 5, it can be concluded from the table that the maximum error rate of the test sample is 7.54%, the minimum error rate is 3.55%, and the average error rate is 5.07%. Therefore, the woodworking tool wear monitoring model established by using PSO-BP neural network algorithm can monitor the woodworking tool wear conditions under variable milling parameters, and can achieve the effect of identifying the woodworking tool wear conditions under variable milling parameters.
In order to verify the reliability of the PSO-BP neural network algorithm, the established model was run 10 times. Table 6 shows the average error rate of 10 runs; the maximum average error rate is 15.93%, the minimum average error rate is 3.14%, the average error rate (10 times) is 9.48%, and the model running time is 8.59 s. It can be seen that the PSO-BP neural network algorithm has good reliability and fast calculation speed. Therefore, the proposed PSO-BP neural network algorithm can effectively establish a monitoring model for the woodworking tool wear conditions which can realize accurate monitoring of the woodworking tool wear conditions.

4.3. Comparative Results of Monitoring Model Accuracy

In order to further verify the accuracy and reliability of the monitoring model established by the PSO-BP neural network algorithm, the genetic algorithm (GA)-optimized BP neural network algorithm was selected for reliability comparative analysis.
GA is an optimization algorithm developed based on Darwin’s theory of evolution and Mendelian genetics; it is used for neural network parameter optimization and genetic mechanism biological evolution processes [21,36]. Figure 7 shows the fitness curve of the GA of the monitoring model. When the evolutionary algebra was 30 times, the genetic algorithm could not reach the state of convergence. When the evolutionary algebra was 200 times, the GA still could not reach the state of convergence.
Figure 8 shows the prediction accuracy of the monitoring model established using the GA-BP neural network algorithm. It can be seen from the figure that the predicted output of all test samples is basically the same as the actual expected output. Combined with the GA-BP neural network algorithm prediction error analysis in Table 7, it can be concluded that the maximum error rate of the test sample is 10.05%, the minimum error rate is 1.45%, and the average error rate is 6.23%.
Table 8 shows the average error rate of 10 runs of the GA-BP neural network algorithm; the maximum average error rate is 22.10%, the minimum average error rate is 6.10%, the average error rate (10 times) is 10.81%, and the GA-BP neural network algorithm training time is 91.53 s. The GA-BP neural network can effectively monitor the woodworking tool wear conditions, but the long training time of the model restricts its application. The proposed PSO-BP neural network algorithm is superior to the GA-BP neural network algorithm in terms of error rate and training time. Overall, the proposed PSO-BP neural network algorithm performs better than the GA-BP neural network algorithm.

5. Discussion

This work presents a limiting arithmetic average filtering method and a particle swarm optimization (PSO)-back propagation (BP) neural network algorithm to monitor the wear of woodworking tools during the milling process. The proposed method can accurately and quickly monitor the woodworking tool wear conditions under different milling parameters. Table 9 demonstrates the performance comparison analysis of the monitoring model established by the two algorithms. Compared with the GA-BP neural network algorithm [21], the training time of the GA-BP neural network algorithm is much longer than that of the PSO-BP neural network algorithm (91.53 s > 8.5 s), and the monitoring error is also higher than that of the PSO-BP neural network algorithm (10.81% > 9.48%). Overall, the proposed algorithm performs better than the GA-BP neural network algorithm. Therefore, the PSO-BP neural network algorithm is suitable for monitoring the woodworking tool wear conditions under variable milling parameters.
The proposed method is still in the theoretical stage. In the next stage, it will be applied in actual production.

6. Conclusions

In this paper, a limiting arithmetic average filtering method and particle swarm optimization (PSO)-back propagation (BP) neural network algorithm were used to monitor the woodworking tool wear conditions in milling processing. At present, the monitoring level of the woodworking tools wear conditions is still low, and advanced woodworking tool wear monitoring technologies urgently need to be studied to improve the cutting performance of woodworking tools and promote the development of intelligent furniture manufacturing technology. The proposed limiting arithmetic average filtering method was used to process the power signal and extracted the features of the woodworking tool wear conditions. The spindle speed, depths of milling, features and tool wear conditions were used as sample vectors. The BP neural network optimized by PSO was used to establish a monitoring model for the woodworking tool wear conditions. Compared with the genetic algorithm (
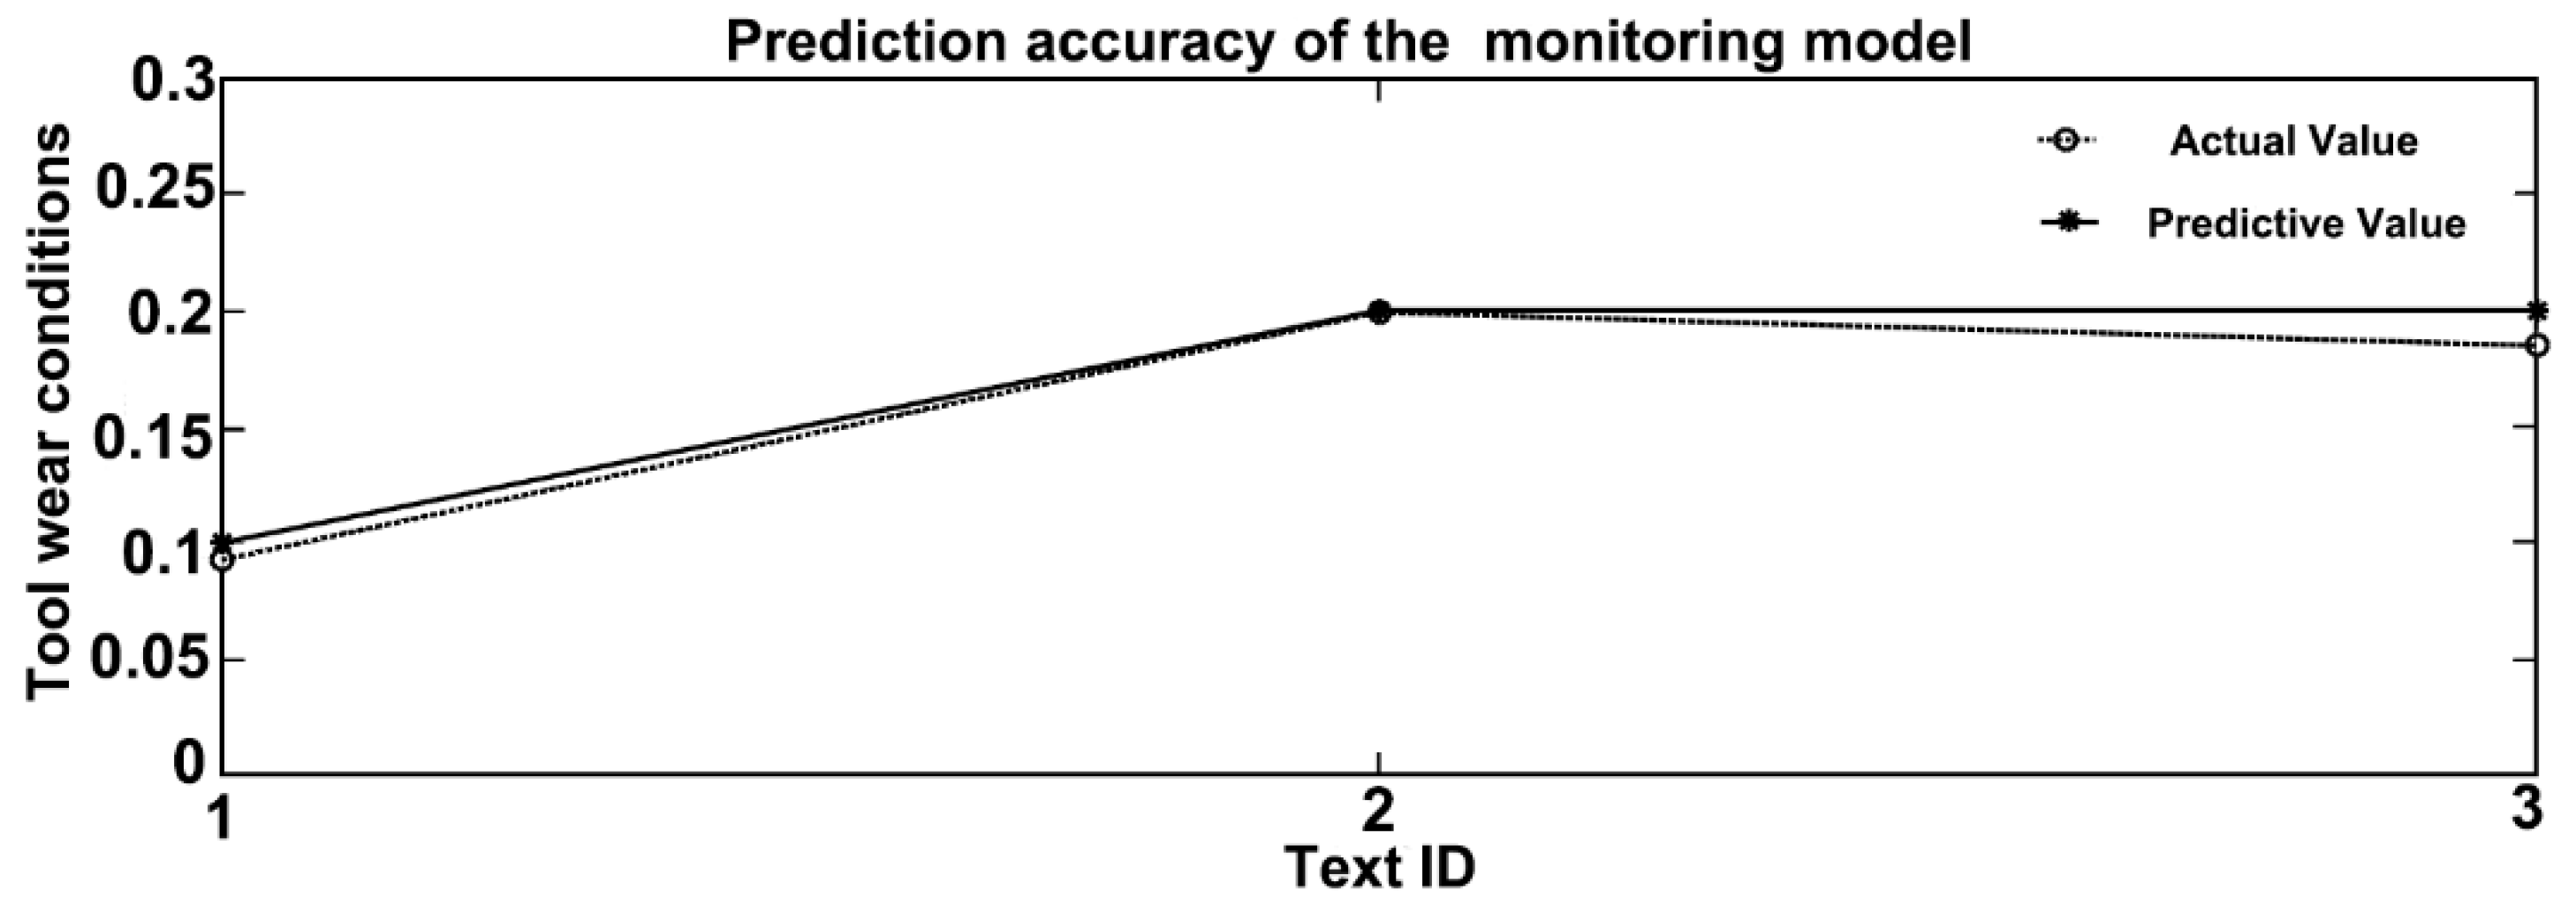
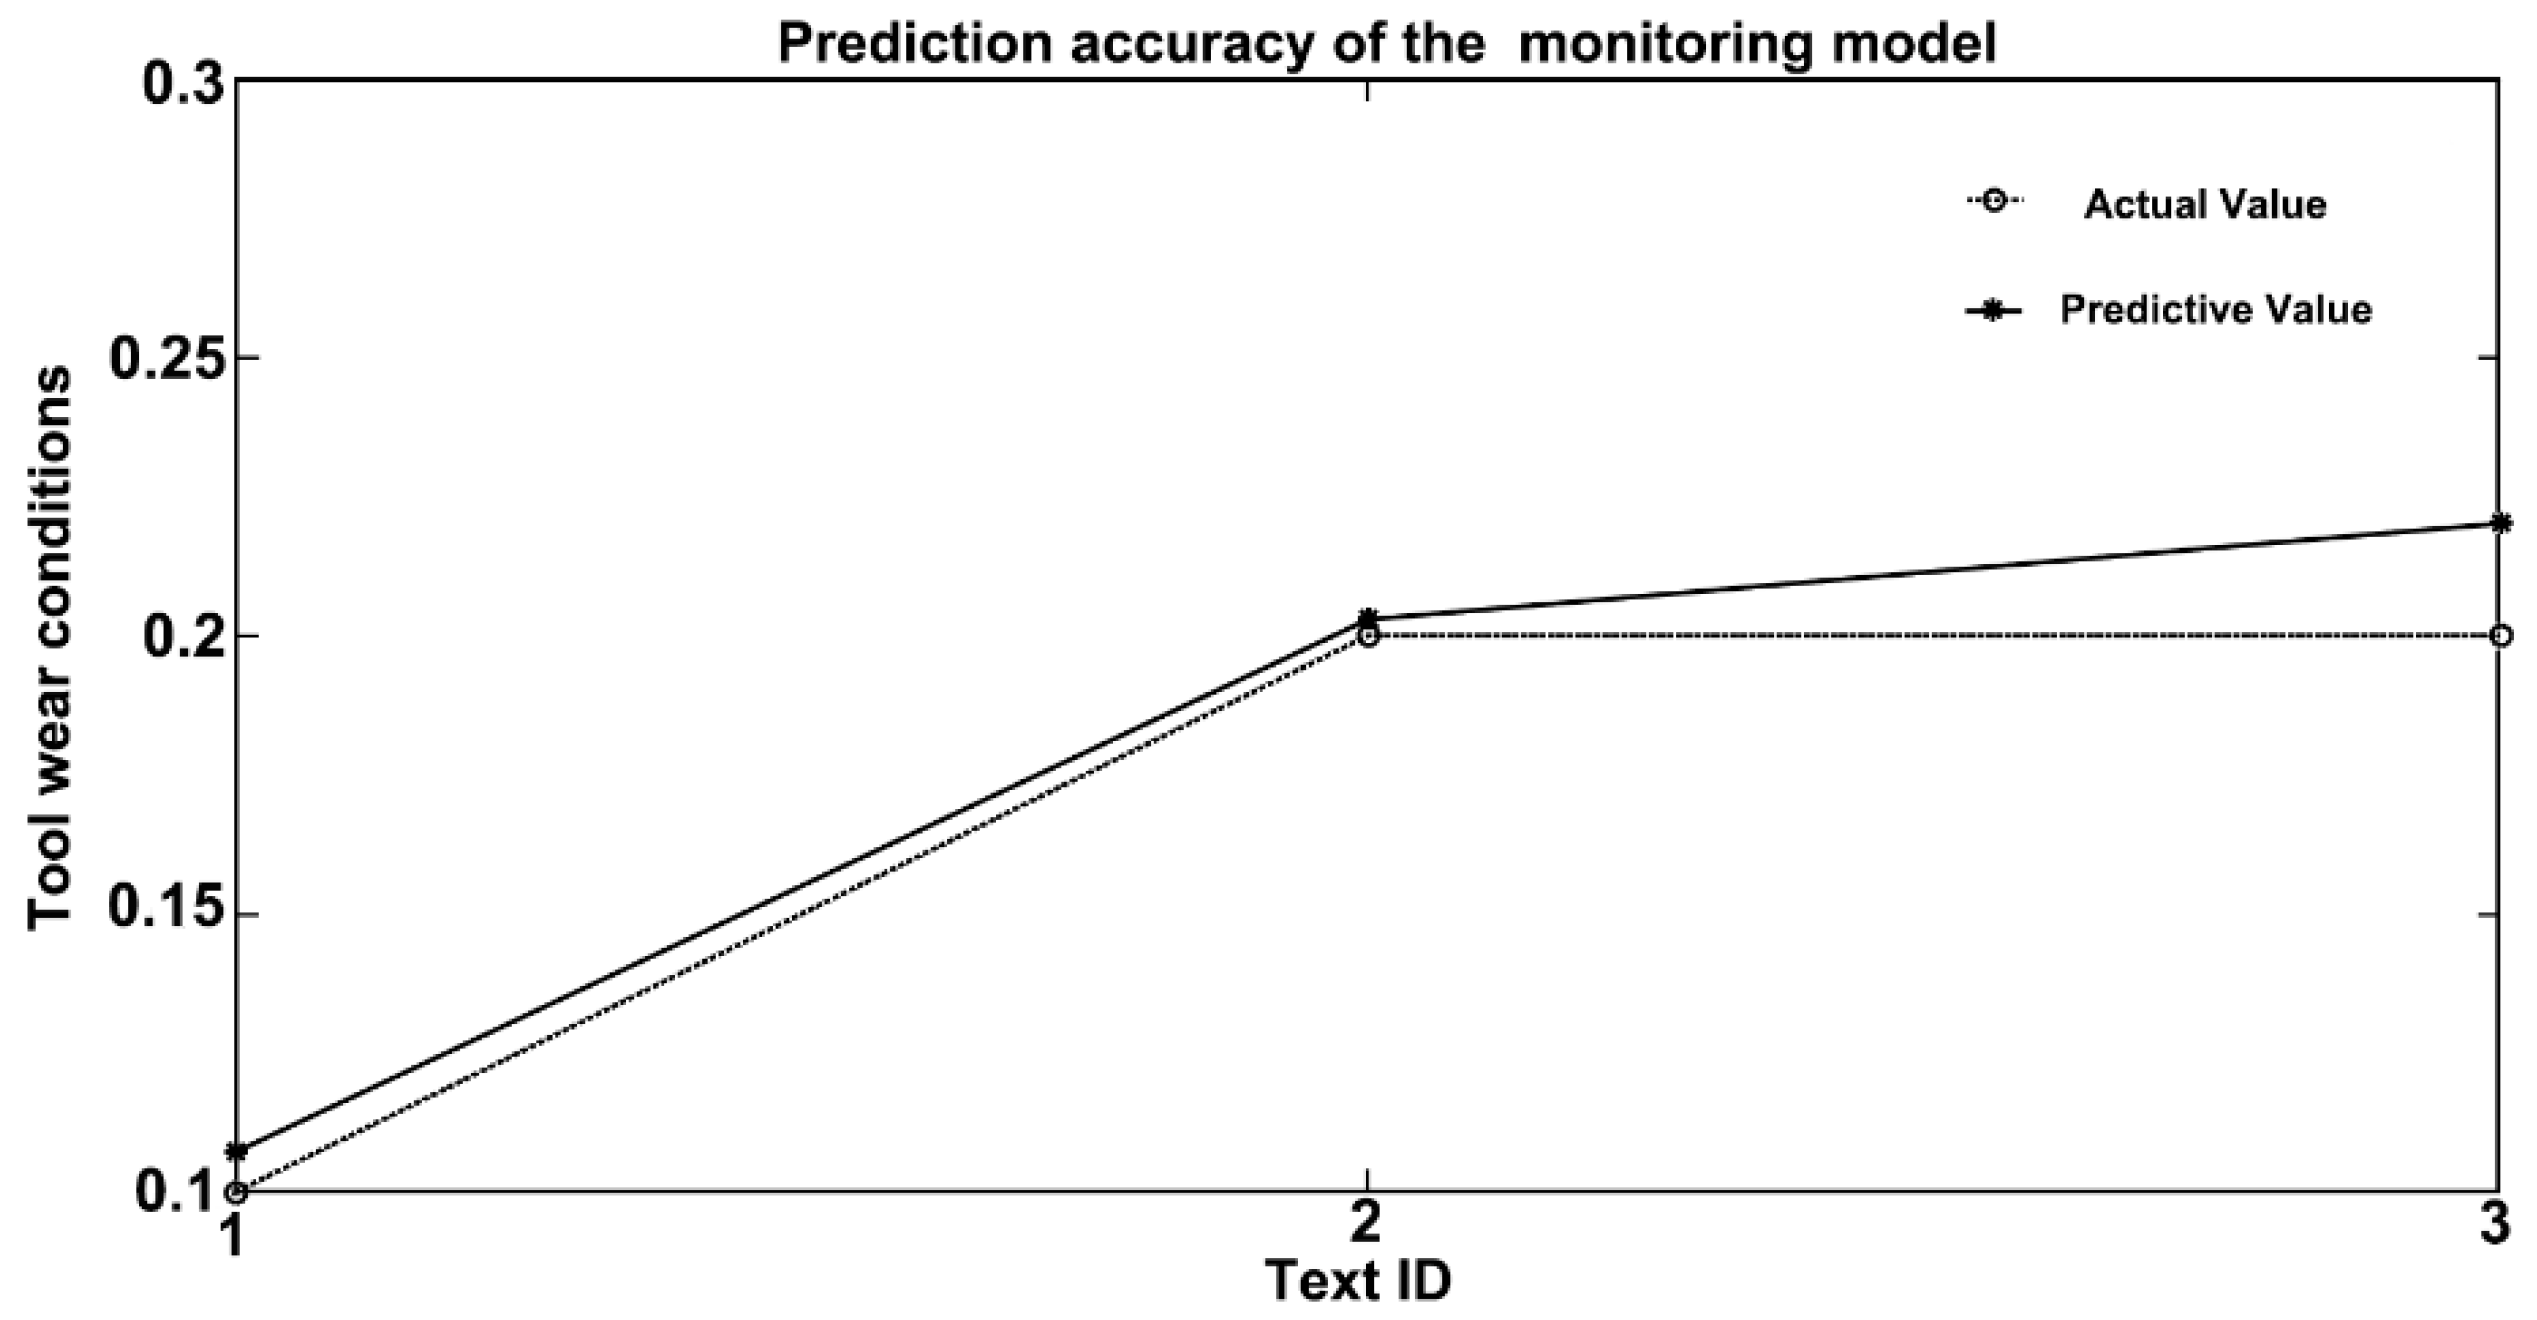
Table 9), the optimization effect of PSO on the BP neural network is obviously better than the genetic algorithm. PSO can quickly optimize the weights and thresholds of the BP neural network and reduce the training time of the BP neural network. The error of the proposed monitoring model established by the PSO-BP neural network algorithm is 9.48%, and the training time is 8.59 s. Therefore, the proposed method can accurately and quickly monitor the woodworking tool wear conditions under different milling parameters.
The proposed method speeds up the process of intelligent furniture manufacturing and reduces the cost of woodworking tool wear condition monitoring technology. However, the delay effect of the power sensor is not considered, and the hysteresis of the spindle power signal is ignored. In future research, in order to further improve the accuracy of the woodworking tool wear state monitoring model, the question of how to eliminate the hysteresis of the power signal will become the focus.

Author Contributions

Conceptualization, W.D. and X.X.; methodology, W.D. and X.X.; writing—original draft preparation, W.D. and X.Y.; writing—review and editing: W.D. and Y.M.; supervision, X.X.; funding acquisition, X.X. All authors have read and agreed to the published version of the manuscript.

Funding

This research was funded by the National Key R&D Program of China (2018YFD0600304), Postgraduate Education Reform Project of Jiangsu Province (SJCX20_0267) and Technology Innovation Alliance of Wood/Bamboo Industry (TIAWBI202010).

Institutional Review Board Statement

Not applicable.

Informed Consent Statement

Not applicable.

Data Availability Statement

Not applicable.

Acknowledgments

This research was supported by the College of Furnishings and Industrial Design of Nanjing Forestry University.

Conflicts of Interest

The authors declare no conflict of interest.

References

  1. Xu, W.; Wu, Z.; Zou, Y. Development and Application of High-Valued Wood Products Made of Fast-Growing Poplar. Adv. Mater. Process. 2011, 311–313, 117–121. [Google Scholar] [CrossRef]
  2. Liu, M.; Xu, G.; Wang, J.; Tu, X.; Liu, X.; Wu, Z.; Lv, J.; Xu, W. Effects of Shellac Treatment on Wood Hygroscopicity, Dimensional Stability and Thermostability. Coatings 2020, 10, 881. [Google Scholar] [CrossRef]
  3. Zhu, Z.; Buck, D.; Cao, P.; Guo, X.; Wang, J. Assessment of Cutting Forces and Temperature in Tapered Milling of Stone-Plastic Composite Using Response Surface Methodology. JOM 2020, 72, 3917–3925. [Google Scholar] [CrossRef]
  4. Zhu, Z.; Buck, D.; Guo, X.; Cao, P. High-quality and high-efficiency machining of stone-plastic composite with diamond helical cutters. J. Manuf. Process. 2020, 58, 914–922. [Google Scholar] [CrossRef]
  5. Li, R.; He, C.; Wang, X. Evaluation and Modeling of Processability of Laser Removal Technique for Bamboo Outer Layer. JOM 2021, 73, 2423–2430. [Google Scholar] [CrossRef]
  6. Wu, S.; Tao, X.; Xu, W. Thermal Conductivity of Poplar Wood Veneer Impregnated with Graphene/Polyvinyl Alcohol. Forests 2021, 12, 777. [Google Scholar] [CrossRef]
  7. Li, R.; He, C.; Chen, Y.; Wang, X. Effects of laser parameters on the width of color change area of poplar wood surface during a single irradiation. Eur. J. Wood Wood Prod. 2021, 79, 1109–1116. [Google Scholar] [CrossRef]
  8. Nouni, M.; Fussell, B.K.; Ziniti, B.L.; Linder, E. Real-time tool wear monitoring in milling using a cutting condition independent method. Int. J. Mach. Tools Manuf. 2015, 89, 1–13. [Google Scholar]
  9. Spinelli, R.; Glushkov, S.; Markov, I. Managing chipper knife wear to increase chip quality and reduce chipping cost. Biomass Bioenergy 2014, 62, 117–122. [Google Scholar] [CrossRef]
  10. Facello, A.; Cavallo, E.; Magagnotti, N.; Paletto, G.; Spinelli, R. The effect of knife wear on chip quality and processing cost of chestnut and locust fuel wood. Biomass Bioenergy 2013, 59, 468–476. [Google Scholar] [CrossRef]
  11. Guo, X.; Wang, J.; Buck, D.; Zhu, Z.; Guo, Y. Machinability of wood fiber/polyethylene composite during orthogonal cutting. Wood Sci. Technol. 2021, 55, 521–534. [Google Scholar] [CrossRef]
  12. Sohn, J.S.; Cha, S.W. Effect of Chemical Modification on Mechanical Properties of Wood-Plastic Composite Injection-Molded Parts. Polymers 2018, 10, 1391. [Google Scholar] [CrossRef] [Green Version]
  13. Wargula, L.; Wojtkowiak, D.; Kukla, M.; Talaska, K. Symmetric Nature of Stress Distribution in the Elastic-Plastic Range of Pinus L. Pine Wood Samples Determined Experimentally and Using the Finite Element Method (FEM). Symmetry 2021, 13, 39. [Google Scholar] [CrossRef]
  14. Zhu, Z.; Buck, D.; Guo, X.; Cao, P.; Wang, J. Cutting performance in the helical milling of stone-plastic composite with diamond tools. CIRP J. Manuf. Sci. Technol. 2020, 31, 119–129. [Google Scholar] [CrossRef]
  15. Wargula, L.; Kukla, M. Determination of maximum torque during carpentry waste comminution. Wood Res. Slovakia 2020, 65, 771–783. [Google Scholar] [CrossRef]
  16. Saglam, H. Tool wear monitoring in bandsawing using neural networks and Taguchi’s design of experiments. Int. J. Adv. Manuf. Technol. 2011, 55, 969–982. [Google Scholar] [CrossRef]
  17. Jaworski, J.; Kluz, R.; Trzepiecinski, T. Operational tests of wear dynamics of drills made of low-alloy high-speed HS2-5-1 steel. Eksploatacja i Niezawodność 2016, 18, 271–277. [Google Scholar] [CrossRef]
  18. Dou, J.; Xu, C.; Jiao, S.; Li, B.; Zhang, J.; Xu, X. An unsupervised online monitoring method for tool wear using a sparse auto-encoder. Int. J. Adv. Manuf. Technol. 2020, 106, 2493–2507. [Google Scholar] [CrossRef]
  19. Wang, Y.; Jia, X.; Li, X.; Yang, S.; Zhao, H.; Lee, J. A Machine Vision Based Monitoring System for the LCD Panel Cutting Wheel Degradation. Procedia Manuf. 2020, 48, 49–53. [Google Scholar] [CrossRef]
  20. Ma, J.; Luo, D.; Liao, X.; Zhang, Z.; Huang, Y.; Lu, J. Tool wear mechanism and prediction in milling TC18 titanium alloy using deep learning. Measurement 2021, 173, 108554. [Google Scholar] [CrossRef]
  21. Dong, W.; Guo, X.; Hu, Y.; Wang, J.; Tian, G. Discrete Wavelet Transformation and Genetic Algorithm—Back Propagation Neural Network Applied in Monitoring Woodworking Tool Wear Conditions in the Milling Operation Spindle Power Signals. BioResources 2021, 16, 2369–2384. [Google Scholar] [CrossRef]
  22. Shen, B.; Gui, Y.; Chen, B.; Lin, Z.; Liu, Q.; Liu, Q. Application of spindle power signals in tool condition monitoring based on HHT algorithm. Int. J. Adv. Manuf. Technol. 2020, 106, 1385–1395. [Google Scholar] [CrossRef]
  23. Gajewski, J.; Jedlinski, L.; Jonak, J. Classification of wear level of mining tools with the use of fuzzy neural network. Tunn. Undergr. Space Technol. 2013, 35, 30–36. [Google Scholar] [CrossRef]
  24. Lopes Da Silva, R.H.; Da Silva, M.B.; Hassui, A. A probabilistic neural network applied in monitoring tool wear in the end milling operation via acoustic emission and cutting power signals. Mach. Sci. Technol. 2016, 20, 386–405. [Google Scholar] [CrossRef]
  25. Du, M.; Wang, P.; Wang, J.; Cheng, Z.; Wang, S. Intelligent Turning Tool Monitoring with Neural Network Adaptive Learning. Complexity 2019, 2019, 8431784. [Google Scholar] [CrossRef] [Green Version]
  26. Bai, Y.; Luo, M.; Pang, F. An Algorithm for Solving Robot Inverse Kinematics Based on FOA Optimized BP Neural Network. Appl. Sci. 2021, 11, 7129. [Google Scholar] [CrossRef]
  27. Li, X.G.; Wang, J.F. Traffic detection of transmission of botnet threat using bp neural network. Neural Netw. World 2018, 28, 511–521. [Google Scholar] [CrossRef] [Green Version]
  28. Zhang, L.; Wang, F.; Sun, T.; Xu, B. A constrained optimization method based on BP neural network. Neural Comput. Appl. 2018, 29, 413–421. [Google Scholar] [CrossRef]
  29. Feng, J.; He, Y. Adaptive mutation particle swarm optimized BP neural network in state-of-charge estimation of Li-ion battery for electric vehicles. Bulg. Chem. Commun. 2015, 47, 904–912. [Google Scholar]
  30. Sun, W.; Gao, Q. Exploration of energy saving potential in China power industry based on Adaboost back propagation neural network. J. Clean. Prod. 2019, 217, 257–266. [Google Scholar] [CrossRef]
  31. Nasimi, R.; Irani, R. Combining a Neural Network with a Genetic Algorithm and Particle Swarm Optimization for Permeability Estimation of the Reservoir. Energy Sources Part A 2015, 37, 384–391. [Google Scholar] [CrossRef]
  32. Ocampo, E.; Liu, C.; Kuo, C. Performance Analysis of Partitioned Step Particle Swarm Optimization in Function Evaluation. Appl. Sci. 2021, 11, 2670. [Google Scholar] [CrossRef]
  33. Nghiem, V.T. Enhanced Forecasting Accuracy of Fuzzy Time Series Model Based on Combined Fuzzy C-Mean Clustering with Particle Swam Optimization. Int. J. Comput. Intell. Appl. 2020, 19, 2050017. [Google Scholar]
  34. Chang, J.; Juang, H.; Chen, Y.; Chang, C. Safe binary particle swam algorithm for an enhanced unsupervised label refinement in automatic face annotation. Multimed. Tools Appl. 2017, 76, 18339–18359. [Google Scholar] [CrossRef]
  35. Zhang, T.; Li, X. The Backpropagation Artificial Neural Network Based on Elite Particle Swam Optimization Algorithm for Stochastic Linear Bilevel Programming Problem. Math. Probl. Eng. 2018, 2018, 1626182. [Google Scholar] [CrossRef] [Green Version]
  36. Zhang, K.; Yuan, H.; Nie, P. Identification of Tool Wear Condition Based on Generalized Fractal Dimensions and BP Neural Network Optimized with Genetic Algorithm. Appl. Mech. Mater. 2013, 318, 71–75. [Google Scholar] [CrossRef]
Figure 1. Power signal acquisition system.
Applsci 11 09026 g001
Figure 2. Structure diagram of a 3-layer BP neural network.
Applsci 11 09026 g002
Figure 3. Woodworking tool wear conditions: (1) The tool wear region; (2) The flank wear at 0.1 mm; (3) The flank wear at 0.2 mm; (4) The flank wear at 0.3 mm.
Applsci 11 09026 g003
Figure 4. Comparison of the features and the average value of the spindle power signal under the spindle speed (a), the depth of milling (b), and the tool wear conditions (c).
Applsci 11 09026 g004aApplsci 11 09026 g004b
Figure 5. Fitness curve of the PSO algorithm of the monitoring model.
Applsci 11 09026 g005
Figure 6. Prediction accuracy of the monitoring model.
Applsci 11 09026 g006
Figure 7. Fitness curve of the GA of the monitoring model.
Applsci 11 09026 g007
Figure 8. Prediction accuracy of the monitoring model.
Applsci 11 09026 g008
Table 1. Workpiece material chemical composition and mechanical properties.
ContentMechanical Properties
PVC52.60%Moisture content0.61%
Calcium powder15.78%Flexural strength20.2 Mpa
Wood fiber15.78%Density0.81 g/cm3
Others10.58%
Table 2. Tool geometries.
DiameterRake AngleWedge Angle
12 mm10°45°
Table 3. Milling parameters.
ParametersUnitsValues
Feed Speedm/min5
Spindle Speedr/min6000, 8000, 10,000
Depth of Millingmm0.5, 1.0, 1.5
Table 4. Sample of woodworking tool wear conditions.
Sample IDSpindle Speed
(r/min)
Depth of Milling
(mm)
Flank Wear
(mm)
Feature
160000.50.1565.72
260000.50.2570.42
360000.50.3579.12
460001.00.1576.49
560001.00.2590.36
660001.00.3603.87
760001.50.1586.45
860001.50.2608.27
960001.50.3625.61
1080000.50.1647.43
1180000.50.2657.81
1280000.50.3664.42
1380001.00.1663.24
1480001.00.2683.28
1580001.00.3693.66
1680001.50.1675.63
1780001.50.2702.15
1880001.50.3718.02
1910,0000.50.1714.15
2010,0000.50.2722.81
2110,0000.50.3728.82
2210,0001.00.1734.11
2310,0001.00.2749.88
2410,0001.00.3760.90
2510,0001.50.1752.41
2610,0001.50.2772.47
2710,0001.50.3786.35
Table 5. Error values of the test sample.
Text IDActual ValuePredictive ValueError ValueError Rate
10.10.0927−0.00737.32%
20.20.1993−0.00073.55%
30.20.1849−0.01517.54%
Average 5.07%
Table 6. The analysis of error.
RunAverage Error Rate
16.46%
210.36%
33.14%
47.57%
511.61%
68.42%
715.93%
84.27%
914.86%
1012.21%
Average9.48%
Table 7. Error values of the test sample.
Text IDActual ValuePredictive ValueError ValueError Rate
10.10.10720.00727.20%
20.20.20290.00291.45%
30.20.22010.020110.05%
Average 6.23%
Table 8. The analysis of error.
RunAverage Error Rate
19.59%
212.03%
33.74%
410.86%
512.14%
622.10%
76.10%
814.40%
99.50%
107.60%
Average10.81%
Table 9. Comparative analysis of algorithm performance.
PerformancePSO-BP Neural NetworkGA-BP Neural Network
Average Error Rate9.48%10.81%
Training Time8.59 s91.53 s
Evolutionary Algebra8NO
Publisher’s Note: MDPI stays neutral with regard to jurisdictional claims in published maps and institutional affiliations.

