1. Introduction
In our day-to-day lives, we often find ourselves in situations where collaborating with other people is necessary to achieve a certain task. A social behaviour that innately occurs in group collaboration is the leader–follower dynamic, where in order to perform a collaborative task effectively, one of the partners in collaboration must assume the role of a leader whether coordination is done through verbal [
1] or non-verbal communication—through physical interaction. This dynamic has been thoroughly researched from a psychological and sociological perspective as seen in [
2,
3], however has yet to be addressed in the same amount from a physical or kinematic standpoint. Sebanz et al. [
4] reviewed aspects of developmental psychology, cognitive psychology, and cognitive neuroscience that contribute to understanding human collaboration. It turned out that role allocation is one of the important areas that has yet to be sufficiently researched. Since the publication of the review, more progress in the research area of physical human collaboration has been made. A study by Ganesh et al. found that the partners were able to improve their task performance when collaborating with each other without verbal communication or even knowing that they were collaborating. Furthermore, the study presented evidence that the task performance of both partners improved to some degree, even when the partner of the subject displayed lower task performance as an individual. This was further studied in papers by Takagi et al. [
5,
6,
7]. Similarly, a study by Batson et al. [
8] showed that the experiment group where participants were coupled together outperformed the control group in solo trials, meaning collaborating with a partner also improved future solo performance. However, there is no real consensus on whether coupled partners always outperform solo performance, as studies by Che et al. [
9] contradict the findings from the aforementioned studies. Furthermore, a study by Beckers et al. [
10] displayed that although task performance improved when the subjects were in collaboration, there was no improvement in task learning due to collaborating with a partner. This indicates that the task at hand and coupling dynamics are important factors in human collaboration.
In [
11,
12] a study on pushing or pulling on opposite ends of a crank was performed. Here they noted improved task performance during collaboration, despite the subjects reporting that their partner was a hindrance. Similarly, evidence of the existence of a haptic channel that improves the collaborative performance, either through direct contact or interactive forces over a mutually manipulated object, was reported in [
13]. Their work indicated that haptic information may be the key component to solve the leader–follower role allocation problem. In [
14] they even proposed that one partner is responsible for the plan and the other is responsible for executing the actions. On the other hand, in [
15] researchers found that rigidly coupled pairs perform tasks based on pre-programmed motion plans, independent of their partner’s behaviour, which could explain the sense of hindrance observed in [
11,
12]. The existence of an unequal control in human collaboration was further observed in [
16] and more recently investigated in [
17].
In this study we would like to build upon the aforementioned findings on human collaboration and leader–follower role allocation by investigating whether the leader–follower dynamics, or in other words the dominance of one partner in a physical collaborative task, can be predicted through the observation of the partners’ individual task performance. Based on the results of the study by Ganesh et al. [
18], which show that partners with lower individual task performance improved more than the partners with higher individual task performance, and findings presented in [
15], we hypothesise that the subject with higher task performance as an individual has a greater influence over the collaborative task, thus assuming the role of the leader. Here we further hypothesise that the method of defining the higher-/lower-performing individual has additional influence on how the leader–follower dynamics are predicted. In this context, we first examine how the definition of higher-performing and lower-performing individuals influences the allocation of leader/follower roles before further exploring influences on the leader–follower role allocation in human dyads. In addition, we examine whether the task performance increases for both partners in collaborative tasks as was reported in [
8,
18].
2. Methods
2.1. Subjects
The study included twelve healthy male and four healthy female participants, with an average height of 180.25 cm and 167.5 cm respectively. All subjects were right-handed. The average age of the subjects was 28.3 years old. The subjects were grouped together into dyads based on their height and sex, with subjects having similar height and the same sex being grouped together. All participants had no prior experience with the experimental setup, thus having the same skill level. Prior to their participation, the subjects were informed about the experimental procedure, potential risks, the aim of the study, and gave their written informed consent in accordance with the code for ethical conduct in research at Jožef Stefan Institute (JSI). This study was approved by the National Medical Ethics Committee (No.: 0120-228/2020-3).
2.2. Experimental Setup
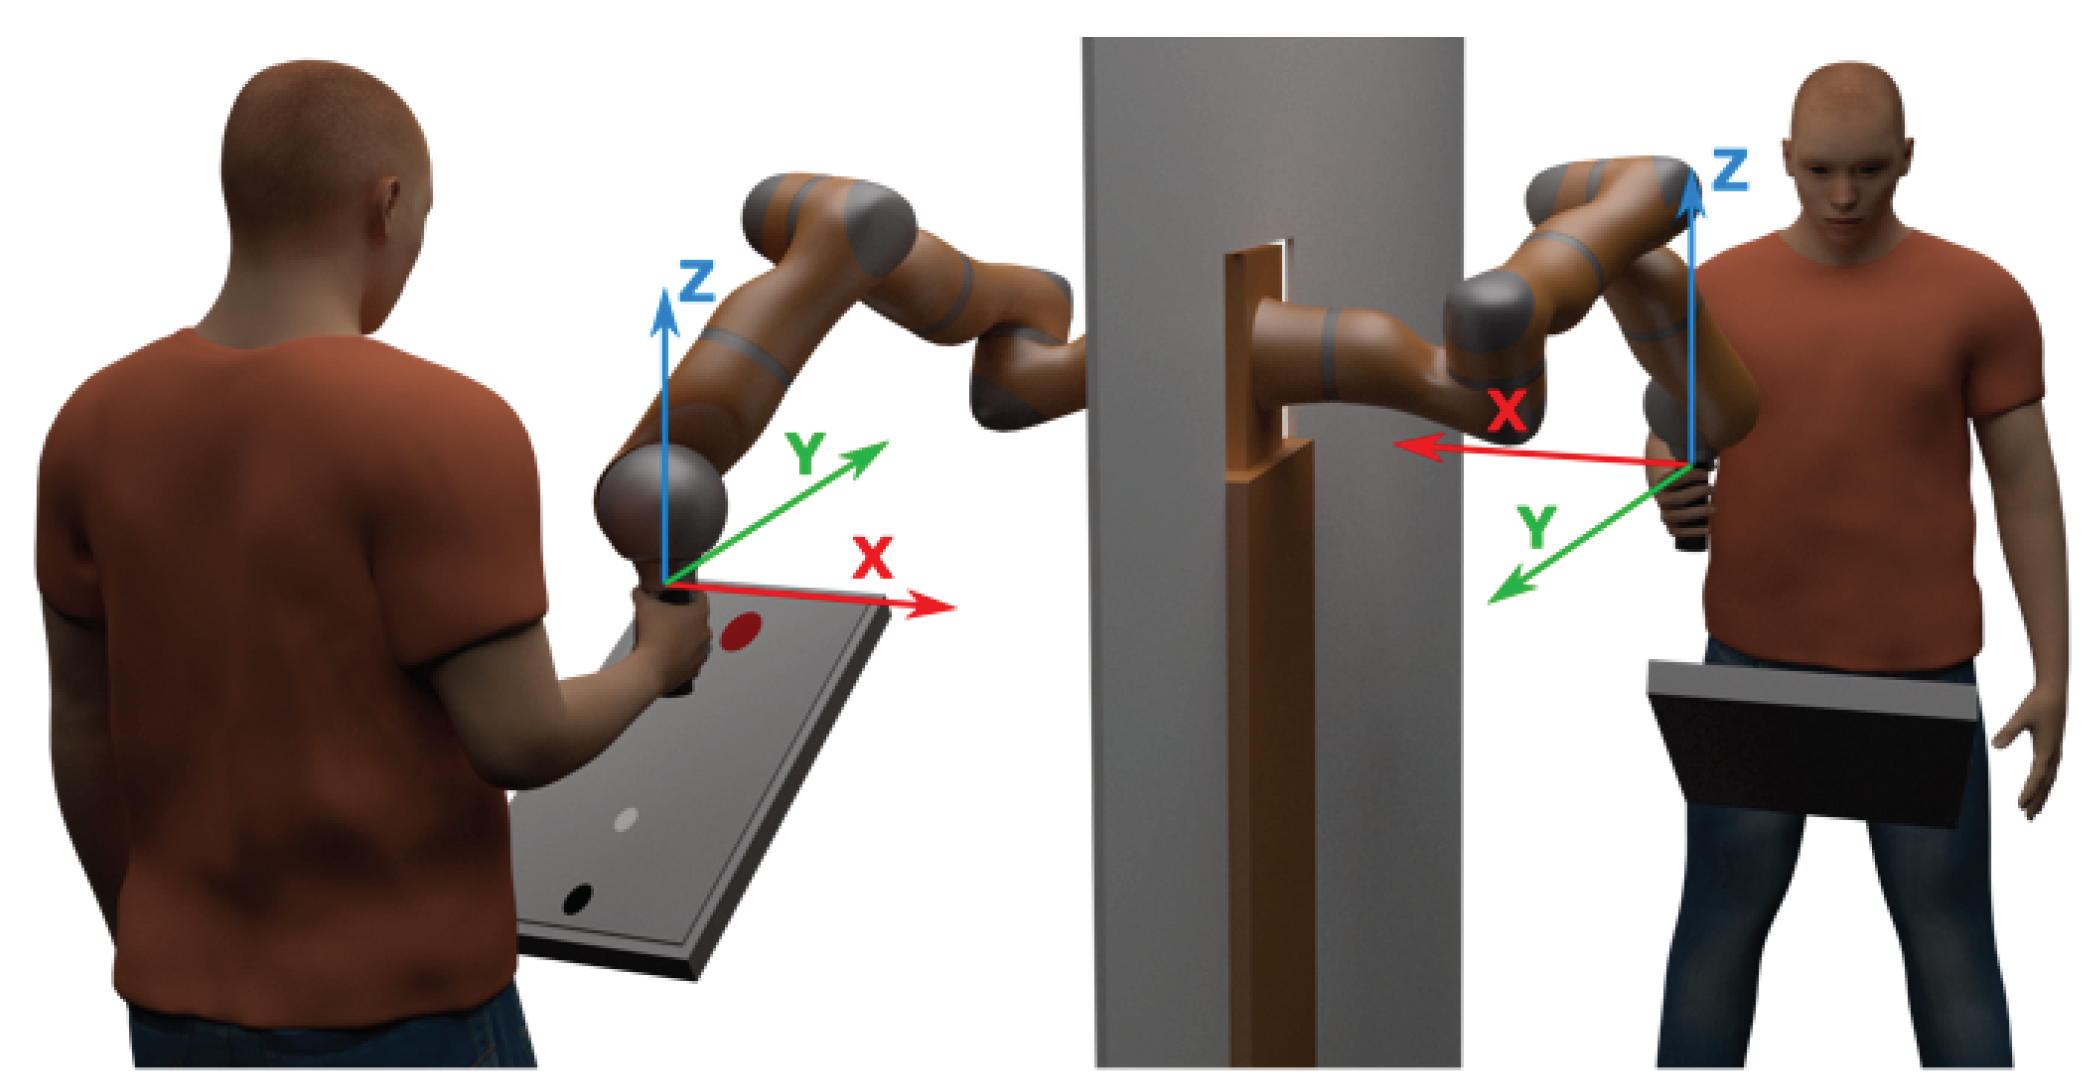
The experiments were conducted on a dual-arm Kuka LWR robot, seen in
Figure 1, which acted as a haptic interface between the subjects and the virtual environment. This was achieved using a haptic controller for the robot arms developed in [
19]. The haptic controller allows the robot arms to be used as separate haptic interfaces or to be used as one interface by coupling them together through a virtual dynamic model.
The virtual dynamic model consists of two points, each representing one end-effector of the dual-arm robot, coupled together by a virtual rod. When a force is applied to any of the two end-effectors, the dynamic model reacts by generating a proportional force to the midpoint of the rod. This proportional force is described as the sum of the forces applied to both end-effectors. Meaning, when coupled together the two partners move the same virtual rod in unison by applying their individual force to each end-effector. This allows the two partners to have an open channel of communication through haptic interaction, similar to the haptic communication channel seen in [
13].
Two monitors were used in the experiment, displaying a graphic user interface (GUI) shown in
Figure 1. Here, the red dot represents the target, whose position and size change throughout the experiment. The black dot is the starting position and the white dot is the moving point which the subjects control through the haptic interface. To match the GUI, the movement of the robot arms was limited to a 2D plane. This was done by constraining the z-axis of the robot’s end-effector (see
Figure 1) to a static position via the haptic controller. The static position of the z-axis was determined for each subject individually so that the angle between the subject’s arm and forearm was 90 degrees in the starting position.
2.3. Experimental Protocol
The leader–follower dynamics were studied on a reaching task, as it is one of the most common tasks performed by humans on a daily basis. The reaching task was repetitive so as to simulate repetitive motions commonly found in our daily lives such as the task of pick-and-placing objects. Furthermore, the repetitive motion of the reaching task helps with the implementation of Fitts’ law in the data analysis of the study.
Subjects stood in front of a screen, holding the handle of the robot with their right hand, as shown in
Figure 1. The experimental session began when the subjects moved the controlled point on the screen to its starting position by moving the robotic arm. When the controlled point was in its starting position, a random target appeared on the screen. The subjects were instructed to reach this target as fast as possible and stay inside the target for at least 0.5 s, at which point the target disappeared. By keeping the movable point inside the target for 0.5 s, we prevented the subjects from simply running over the target without aiming for it. When the target disappeared, the subjects had to return to the starting position.
Throughout the experiment, the subjects were not told whether they were performing a collaborative or an individual task. However, although the partners were not explicitly made aware of their connection, both subjects were able to sense the other partner’s physical interaction through the haptic interface only when in collaboration. This meant that, when the two subjects were coupled together, they could feel an external force that was produced by their partner. This established an open channel for non-verbal communication between the partners.
The reaching task was repeated 180 times, with subjects performing half of the tasks individually and half in collaboration by being coupled together through the virtual model. In the 180 trials, 9 different targets with varying distances (5 cm, 15 cm, and 25 cm) and sizes (small, medium, and large) were used. In total, the experiment equalled to 20 cycles in which the 9 different targets were used in random order. To exclude the influence of human learning through repetitions on the performance in individual and collaborative tasks, the subjects were separated into two groups, each consisting of four dyads—three male and one female dyad. The first group conducted the first 10 cycles individually and the last 10 cycles in collaboration, while the second group performed the first 10 cycles of the experiment in collaboration and the last 10 cycles individually. With this we were able to lower the influence of the sequence of performing individual and collaborative tasks on the overall task performance.
2.4. Data Processing
In each session, motion data of the robot and force measurements from the force sensor were collected. The target sequence and task duration for each trial were logged as well. A table of the gathered data is available as
Supplementary Material. Measurements were sorted based on the type of experiment (individual or in collaboration) and the observed subject of the dyad (higher-performing or lower-performing individual).
Determining the higher-performing and lower-performing subjects: Each dyad consists of a higher- and a lower-performing partner with their role being determined based on their performance in the individual experiment. To find the optimal method for determining a subjects role in a dyad, their performance was defined in three different ways—based on (a) the average time needed to perform the reaching task, (b) the average maximum velocity of each individual when performing the reaching task, and (c) Fitts’ law’s index of performance ().
The sorting method (a), based on the mean time needed to perform the reaching task, determines the higher- and lower-performing individual by averaging the measured time it took the subject to reach the target throughout all individual trials. This was calculated for each target separately. To calculate the overall mean time needed to perform a reaching task, the calculated mean times for each target were averaged as well. The calculated mean times were used for comparing the two individuals, where the individual with shortest mean time in the individual experiment is determined to be the higher-performing individual.
The sorting method (b), which is based on the maximum velocity in individual tasks, defines maximum velocity as the peak value of velocity during the reaching task. An average maximum velocity () of an individual is calculated by averaging the maximum velocities of each trial and target. In this method, the individual with higher is determined to be the higher-performing individual.
The sorting method (c) determines the higher- and lower-performing subject by implementing Fitts’ law’s index of performance (
). Fitts’ law describes the speed–accuracy trade-off based on the time required to reach a target. As a measure of human performance, Fitts proposed a metric called index of performance or
, which is described as:
where
is the measured movement time and
is the index of difficulty, which has several formats in literature as seen in [
20,
21]. In this study, the Shannon formulation [
22] was used, which is defined as:
Here, D is the distance of the target and W is the width of the target. The was calculated for all targets in each trial. The calculated s were then averaged within each target. The overall for each subject was then determined by calculating the average from all targets. When comparing the s of both individuals, the subject with a higher is determined to be the subject with the higher individual performance.
To find the optimal sorting method to define the higher-performing and lower-performing individual, the standard error of mean (SEM), produced by each sorting method when determining the leader in a collaborative task, was compared between the sorting methods. Here, the lower SEM that a sorting method produces, the more certain the sorting method is to use for defining the higher- and lower-performing individual as it shows that the results were more consistent throughout all dyads.
Determining the leader–follower dynamics: The leader of the collaborating task was determined by measuring and analysing the forces applied to the robot by each partner. Force measurements were used as the base for determining the leader due to the fact that the robot movement is determined solely by the force applied to its end-effector. This means that the subject applying a higher force to the end-effector has a higher influence on the robot movement. Due to this, the leader can be determined based on the difference in the forces applied by the partners in collaboration (
):
where
is the force applied by the partner with lower individual performance and
is the force applied by the partner with higher individual performance. The overall leader of each trial is defined as:
where
T is the measured time it took to reach the target. To determine the overall leader for each target an average leader value
L is calculated from all trials.
Determining task performance: The task performances of individual and collaborative experiments were evaluated to see if the task performance improves when subjects are in collaboration as was shown in [
18]. This was done by taking into account the average
IP of subjects performing the task individually and of subjects performing the task in collaboration. The average
was calculated as described in the sorting method based on the index of performance (Equation (
1)).
Statistical analysis: The statistical analysis was performed using Statistics Toolbox in MATLAB. Average movement times and average forces applied for reaching each target were used for statistical analysis. The effects of the target difficulty on the movement times, human effort, and role allocation in a dyad were investigated using two-way repeated-measures ANOVA with independent variables (target size × target distance). The differences between task performance based on individual or collaborative tasks were tested using post hoc t-tests with Bonferroni correction. The level of statistical significance used was the p-value of 0.05 for all statistical tests.
3. Results
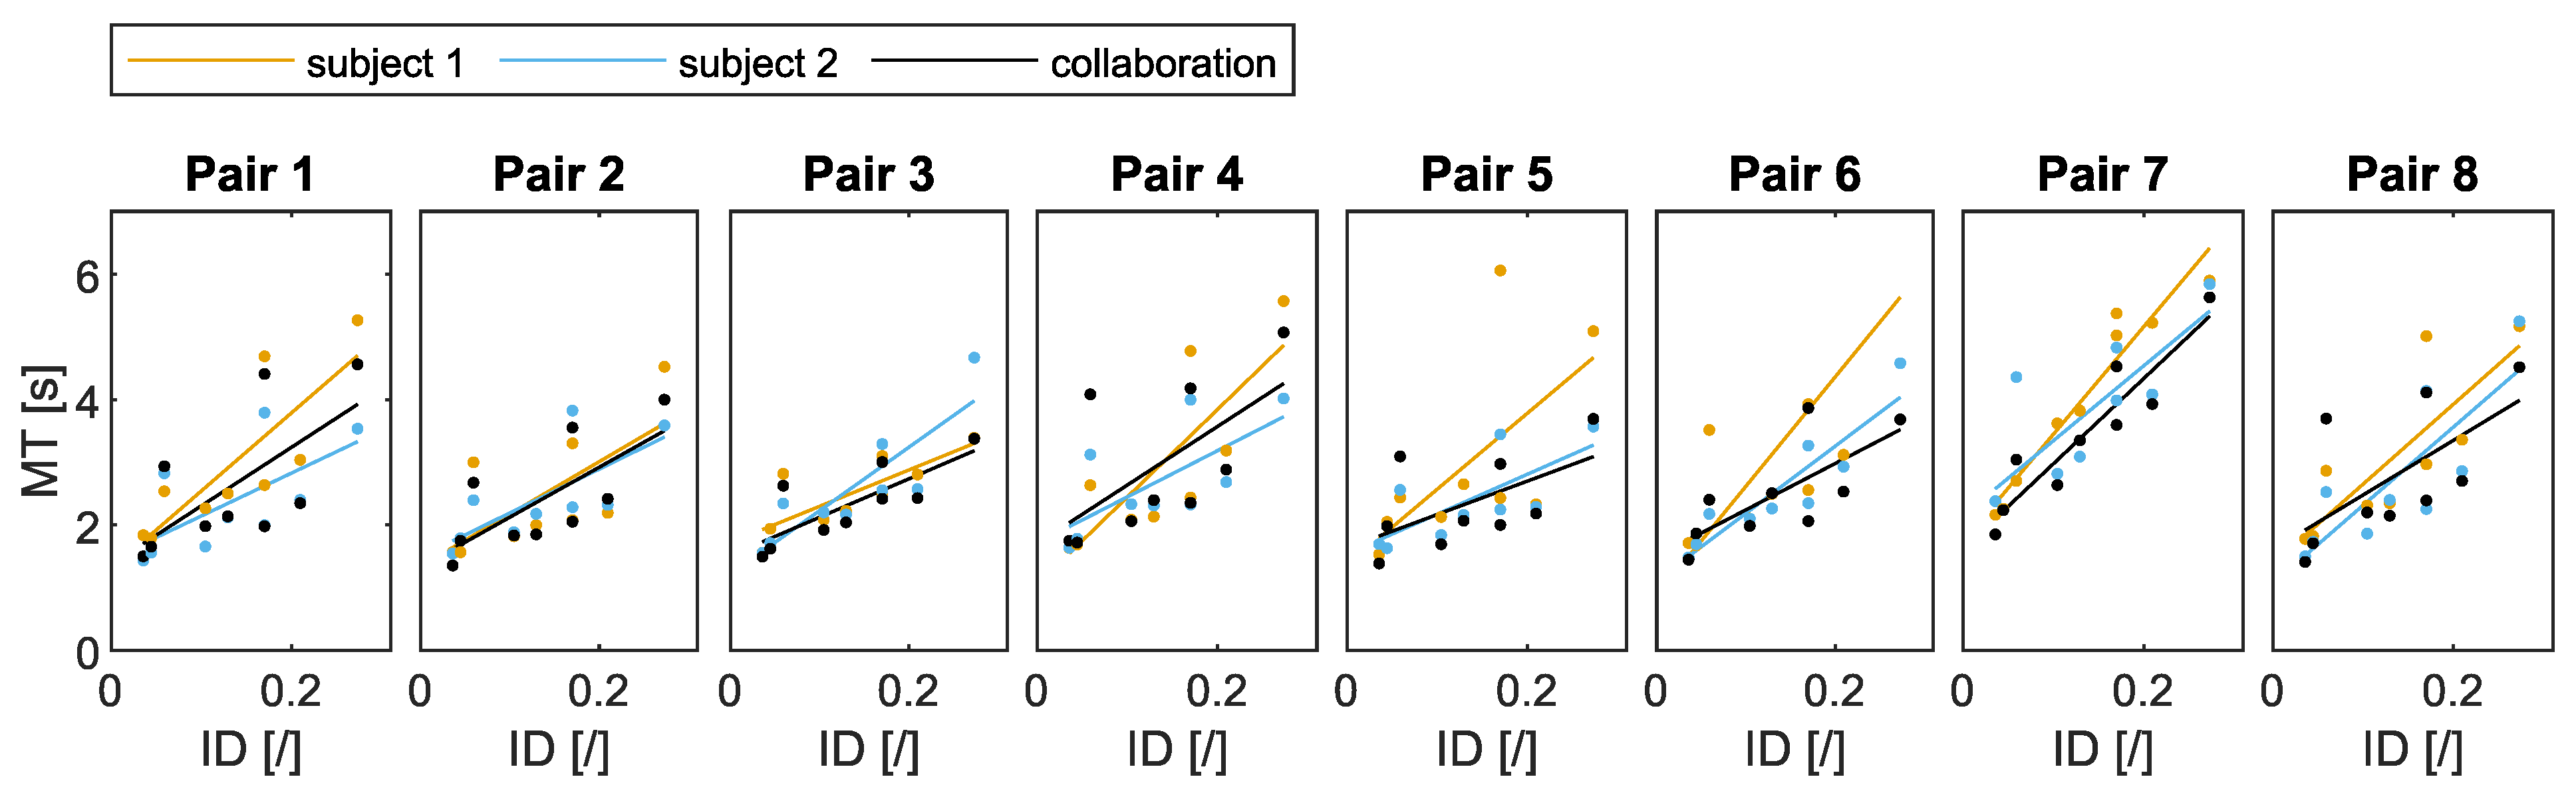
Determining the higher-performing and lower-performing subject: Fitts’ law models for each pair are shown in
Figure 2 with subjects 1 and 2 not being yet determined as either the higher- or the lower-performing subject. How different sorting methods influence the subject being defined as a lower-performing or a higher-performing individual is shown in
Table 1. Comparing the three sorting methods, results in
Table 1 show that using any of the three sorting methods determine the same subject to be the higher-performing individual, with the exception of pair 2 and 4.
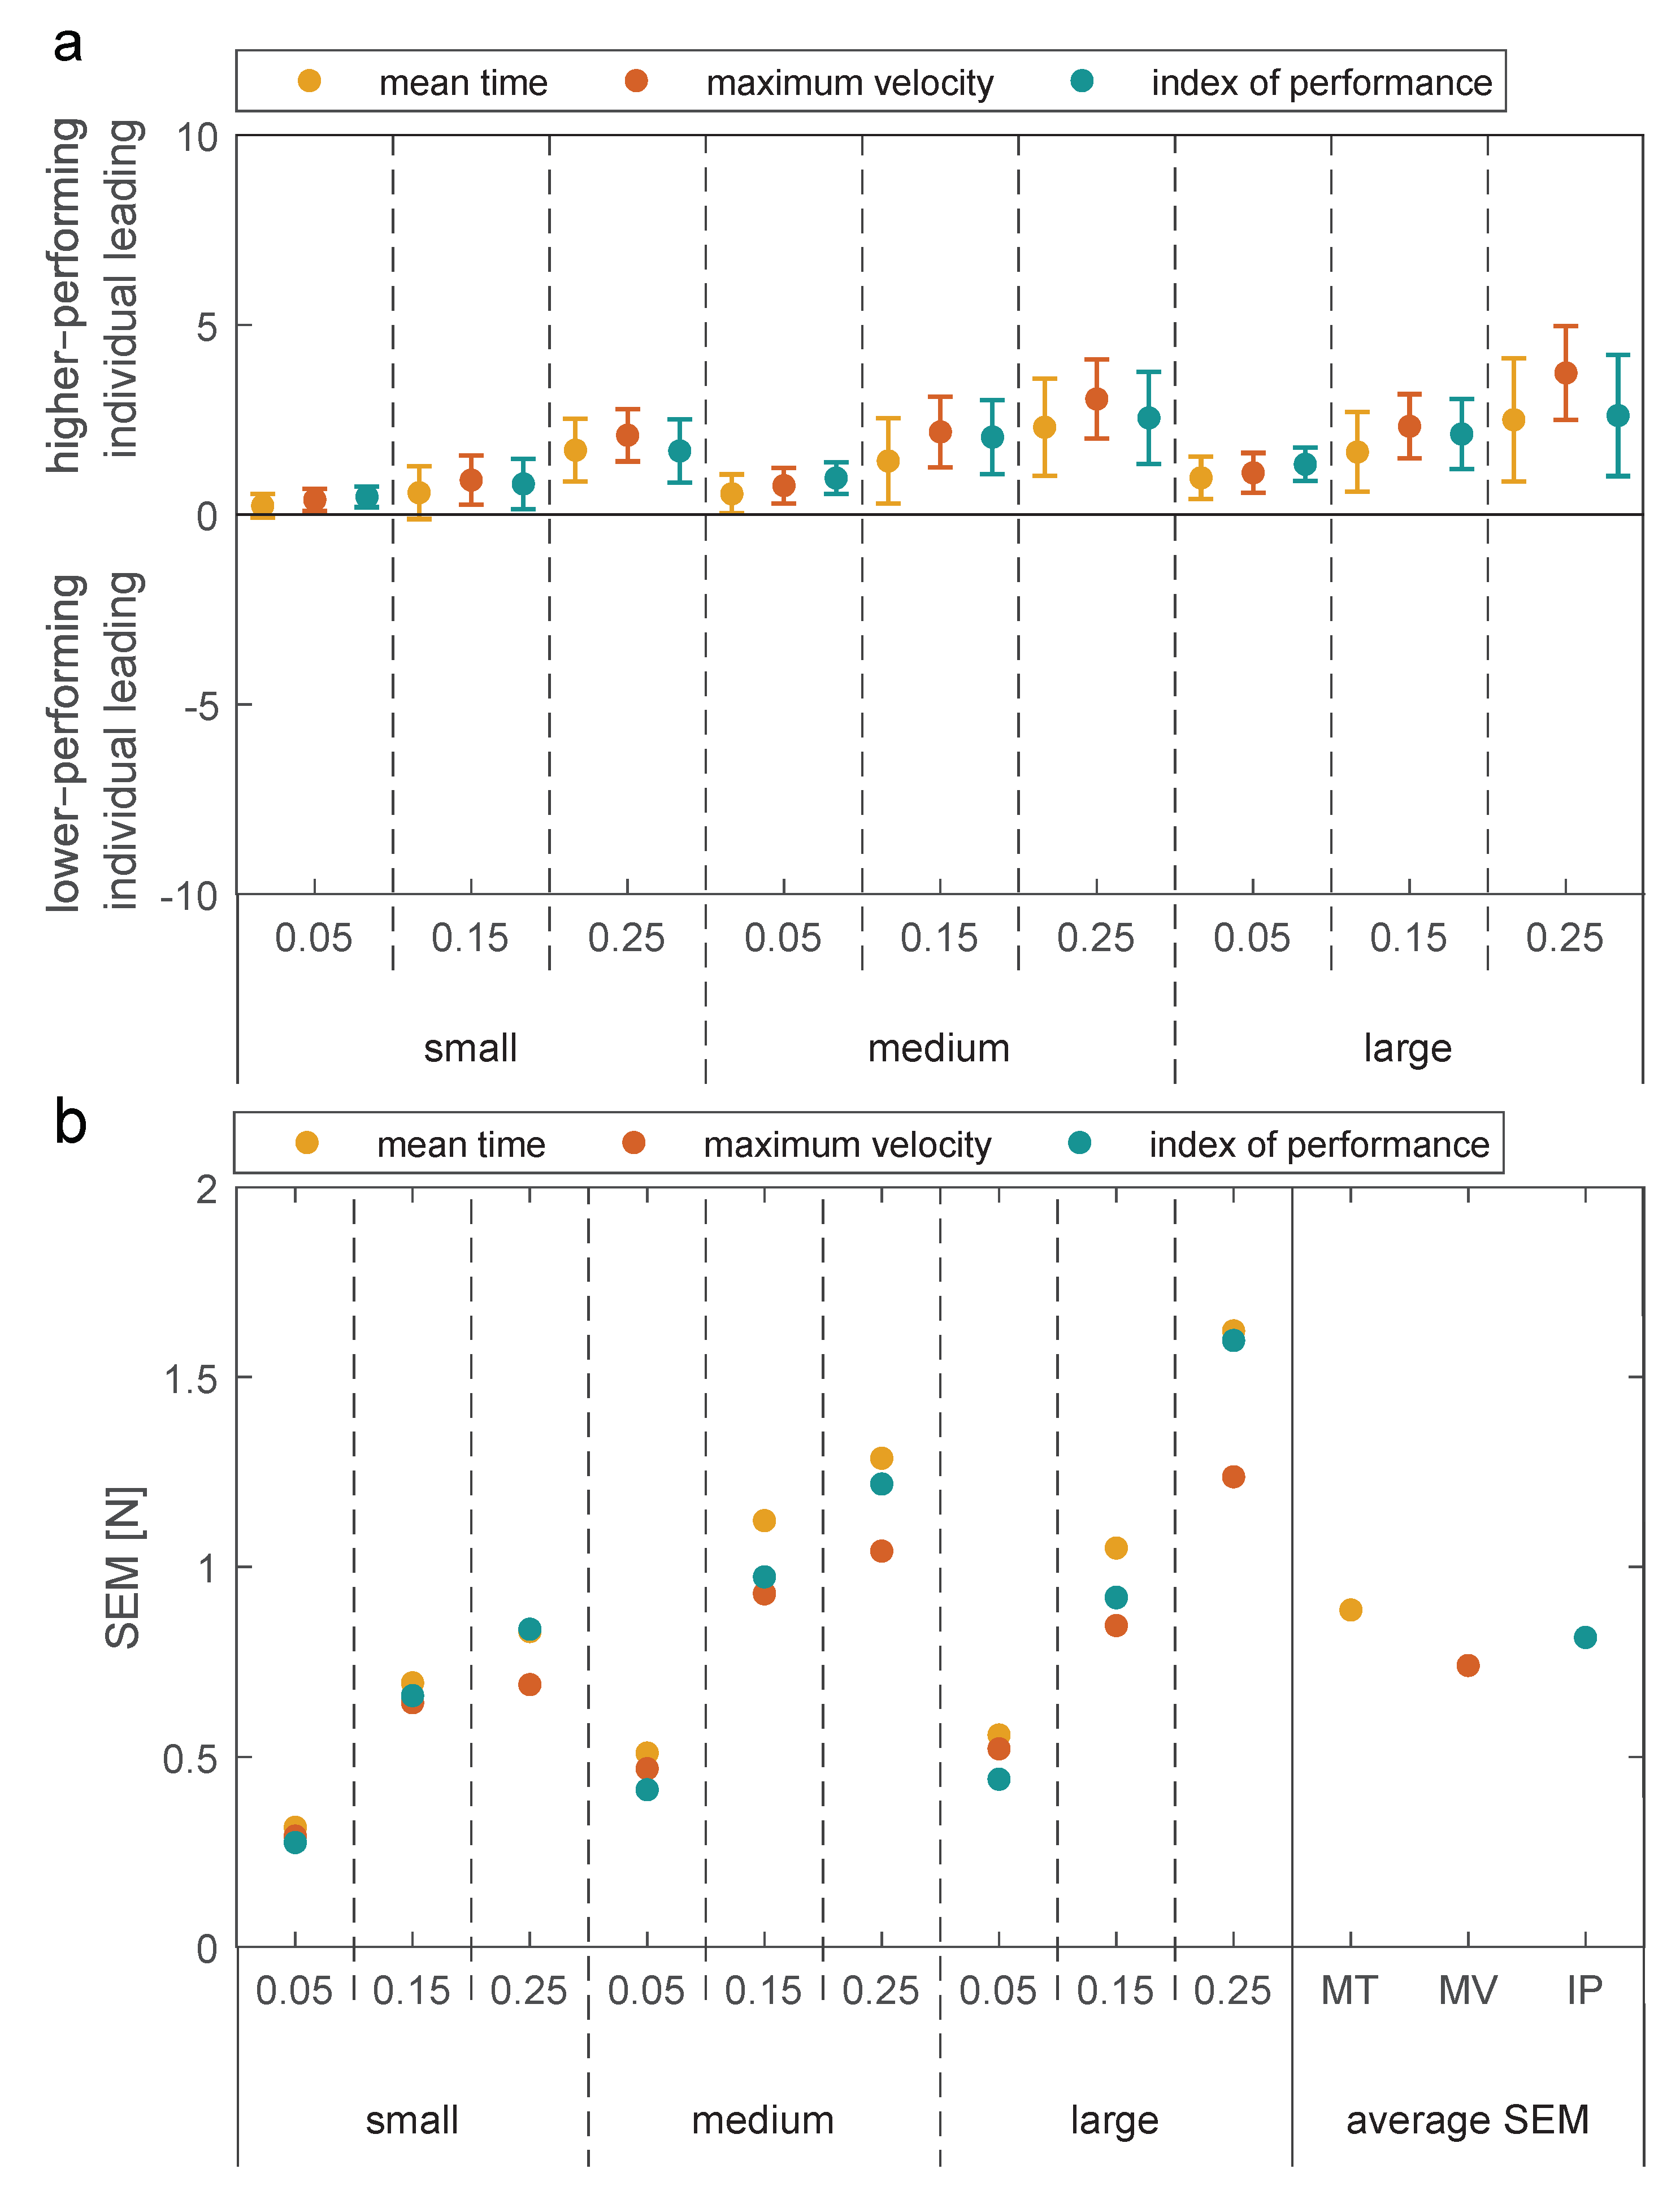
Looking at
Figure 3 however, the presented results suggest that predicting the leader of the dyad improves when using the sorting method based on maximum velocity. This can be seen in the decrease of the standard error of mean (SEM) for predicting the leader when using the velocity sorting method, as shown in the bottom plot in
Figure 3. As stated in
Section 2.4 a lower SEM shows that the results for determining the leader were more consistent throughout all pairs, which in extension means that the sorting method produces more accurate results. Based on these results, all further statistical analysis presented in this paper was performed on data sorted using the maximum velocity approach.
Determining the leader–follower dynamics: As stated in
Section 2.4 (
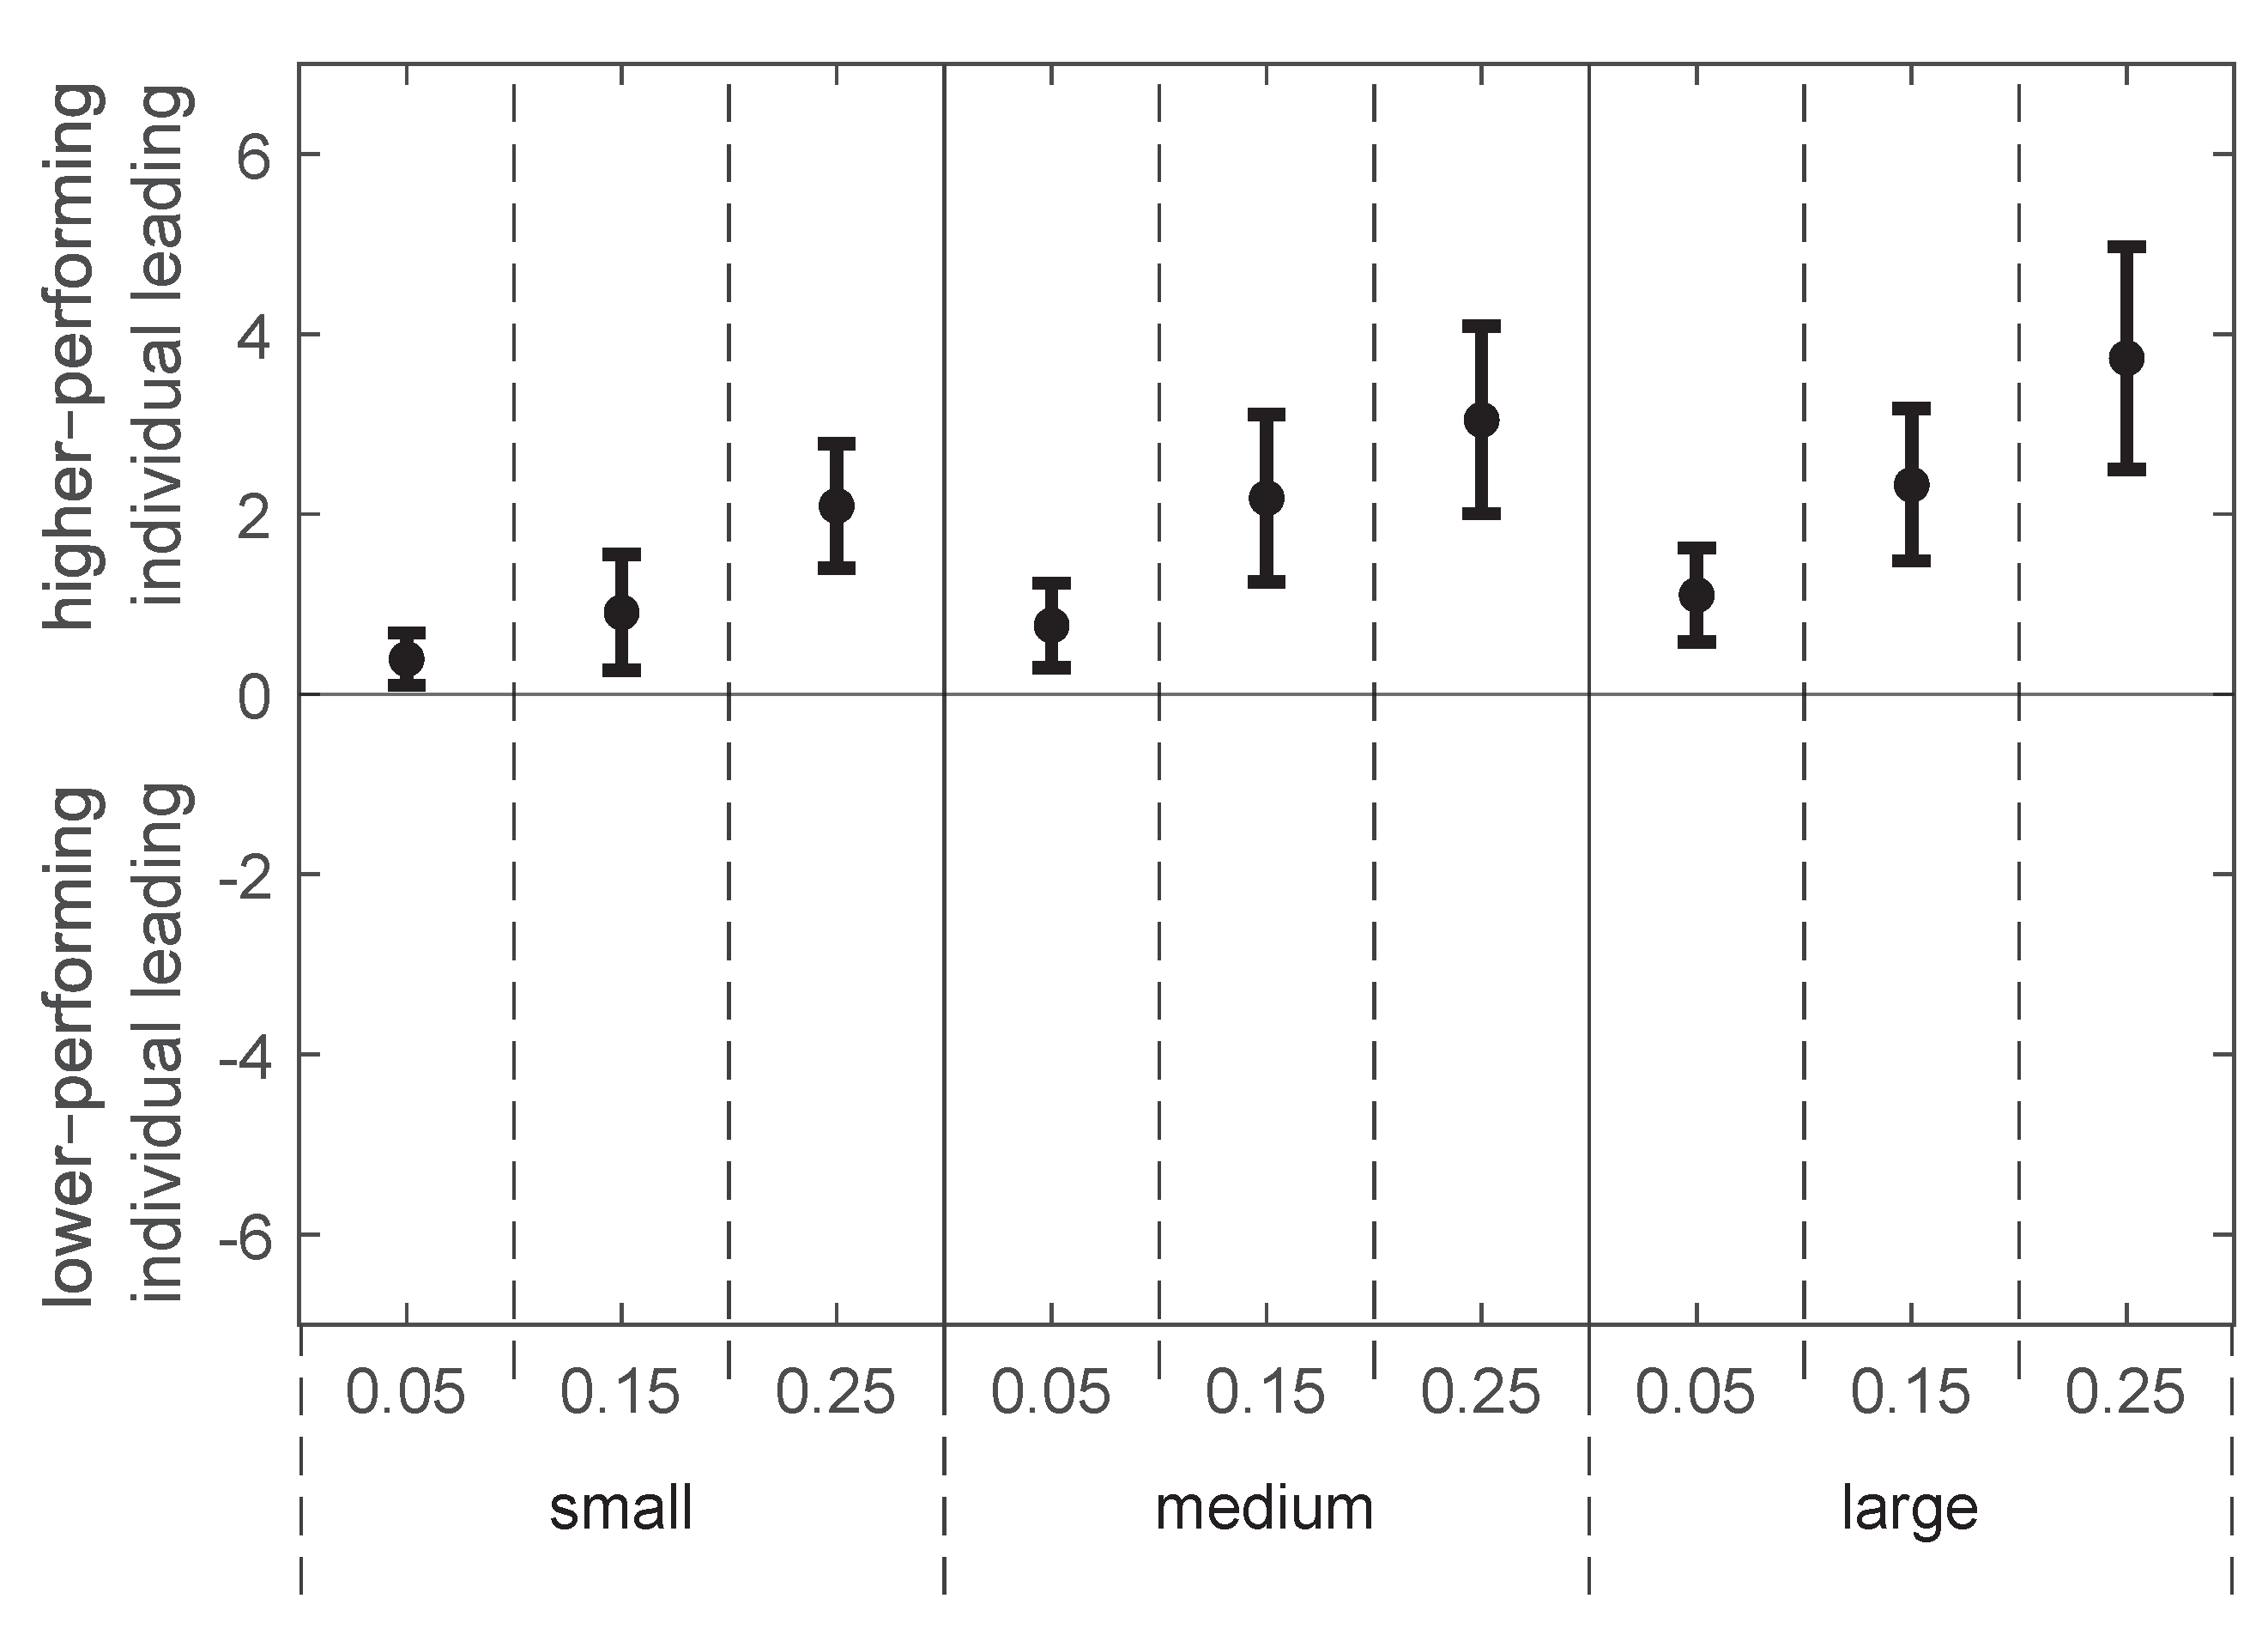
Determining the leader–follower dynamics), the leader of the dyad in collaboration was calculated based on the amount of the force applied to the robot by each partner during the overall task.
Figure 4 represents the differences in the forces applied by the partner with a lower individual performance (
) and partner with a higher individual performance (
) in a collaborative task. Here, the values represent the average leading partner of the eight dyads including SEM for each target. Equation (
3) defines positive values as equal to the partner with the higher individual performance (i.e., the subject with higher maximum velocity) leading the collaborative tasks, while negative differences equal to the partner with lower individual performance (i.e., the subject with lower maximum velocity) leading in the collaborative tasks. Equation (
3) also tells us how much the leading partner influences the task movement based on the absolute value of the difference. Here, the higher the absolute values, the more dominant the leading partner was, while the values closer to 0 showcase that the amount of exerted force from both partners was close to equal.
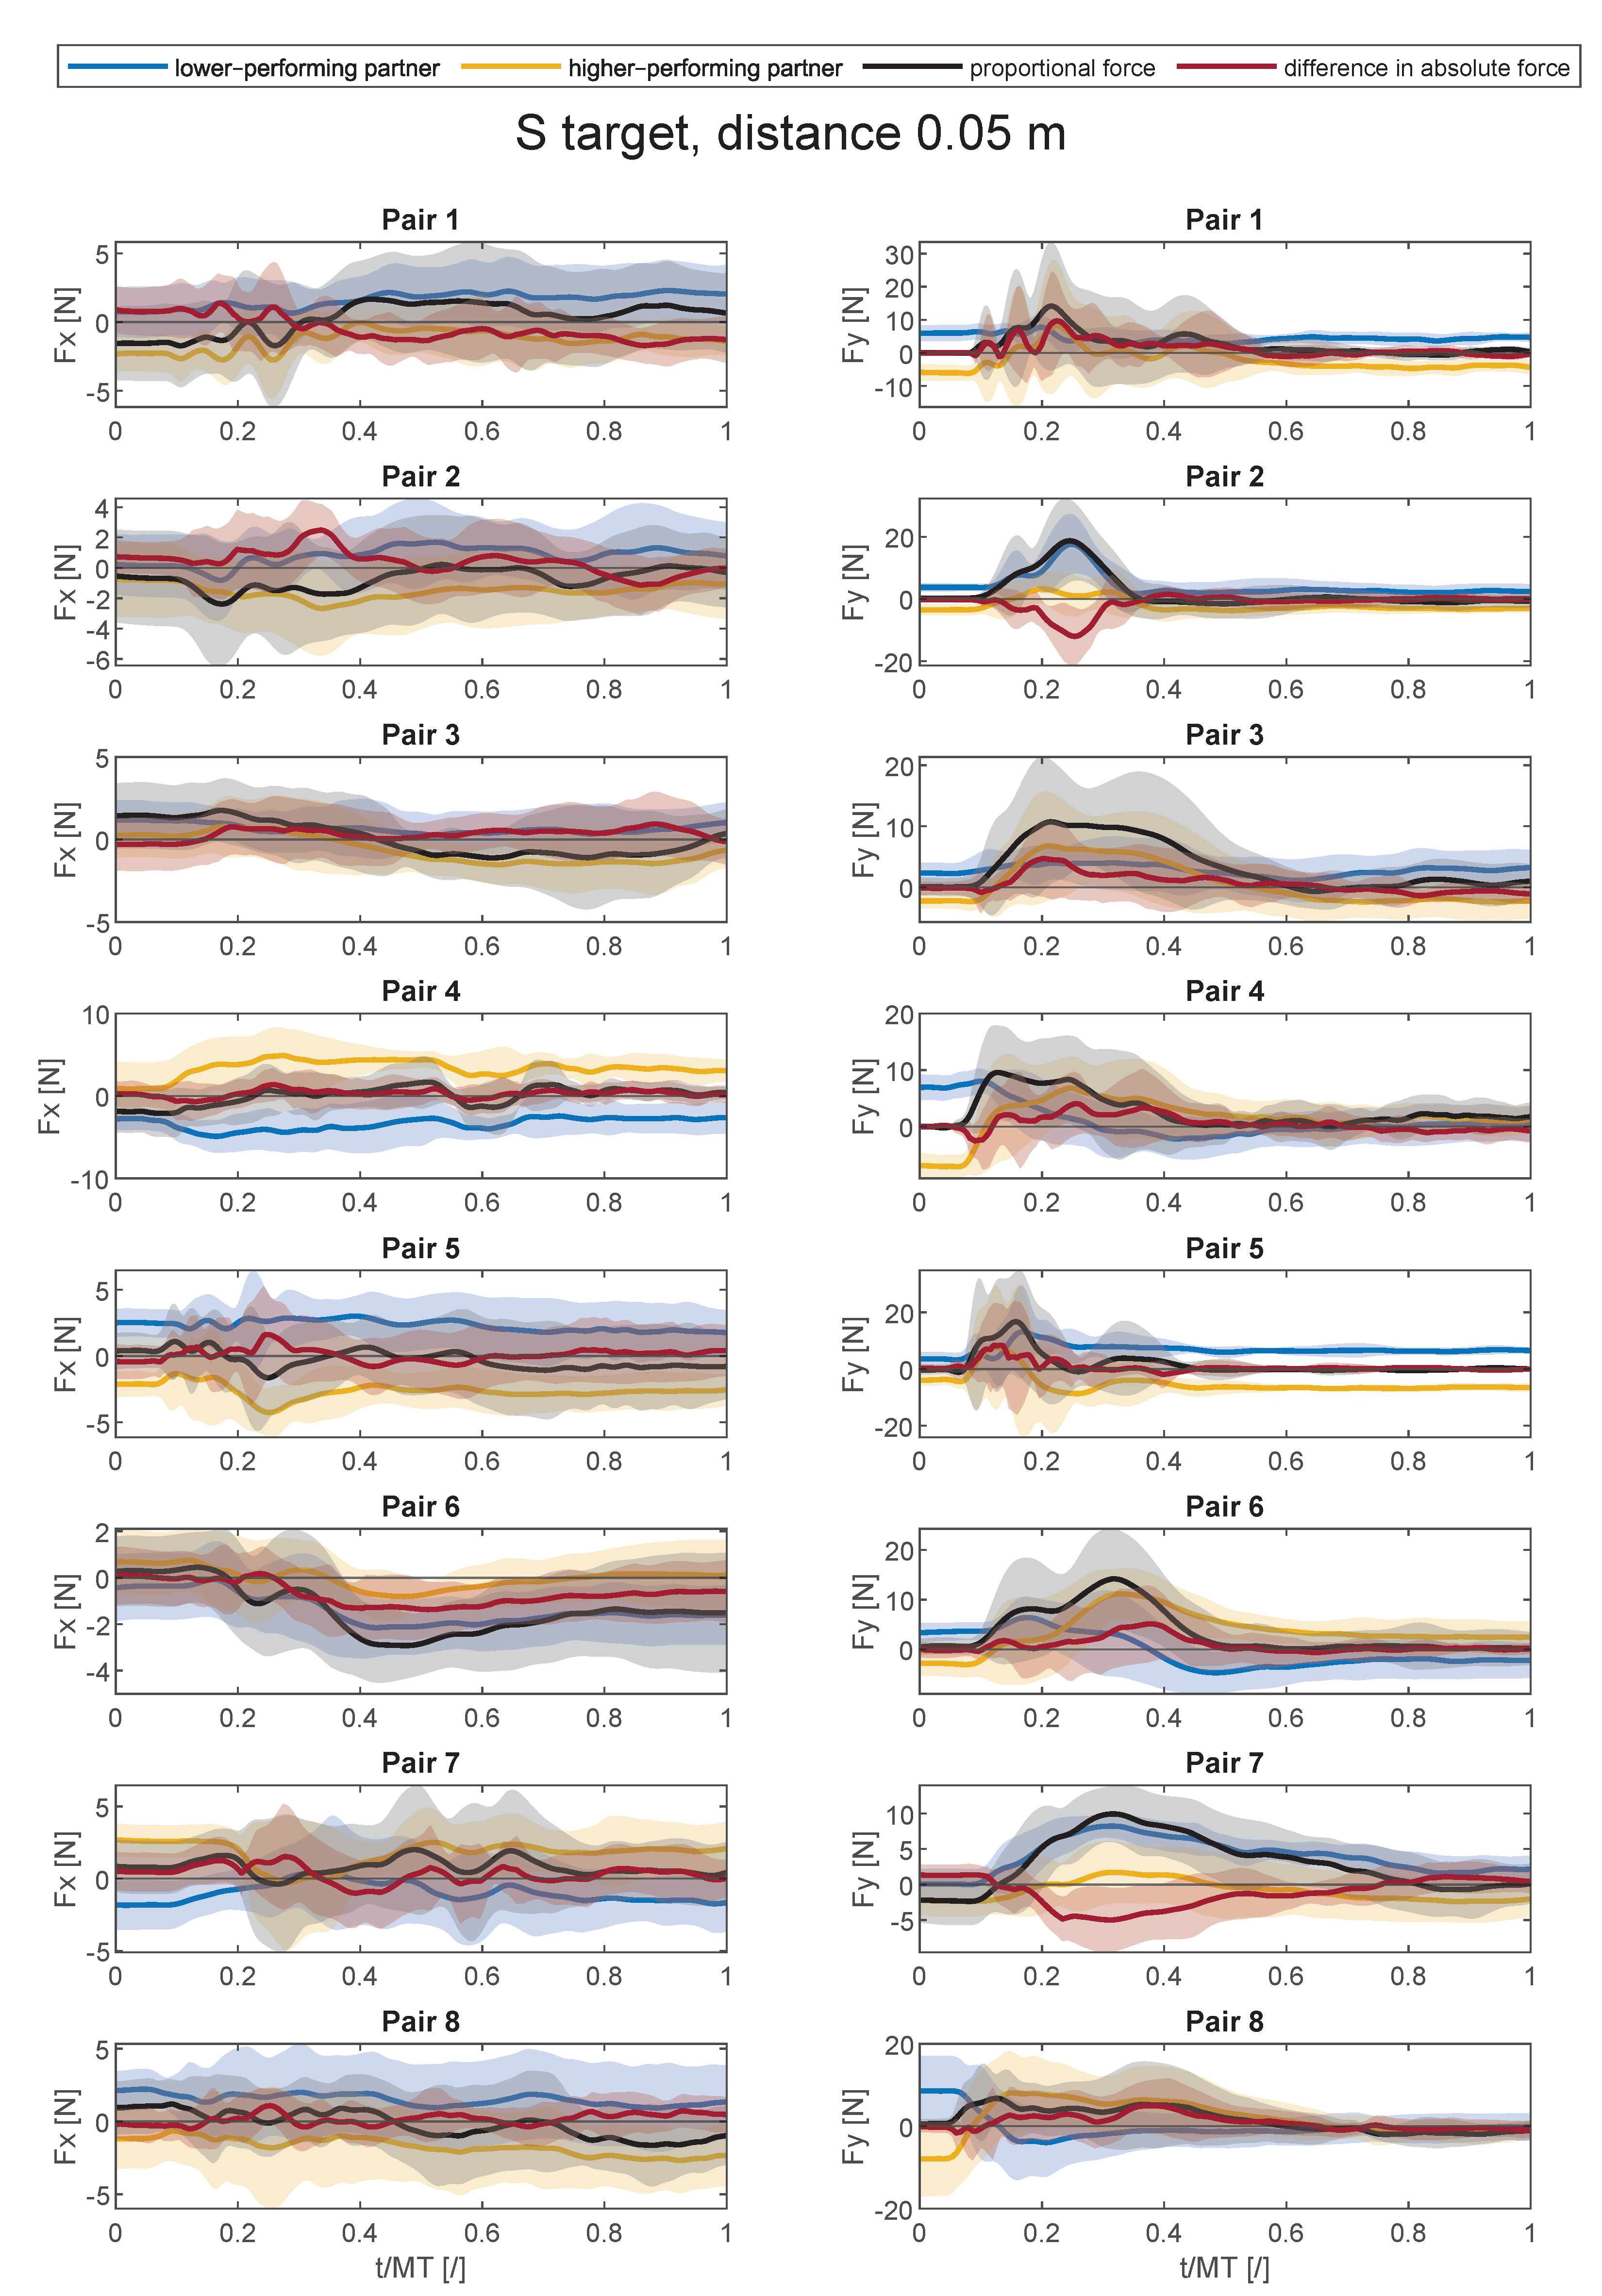
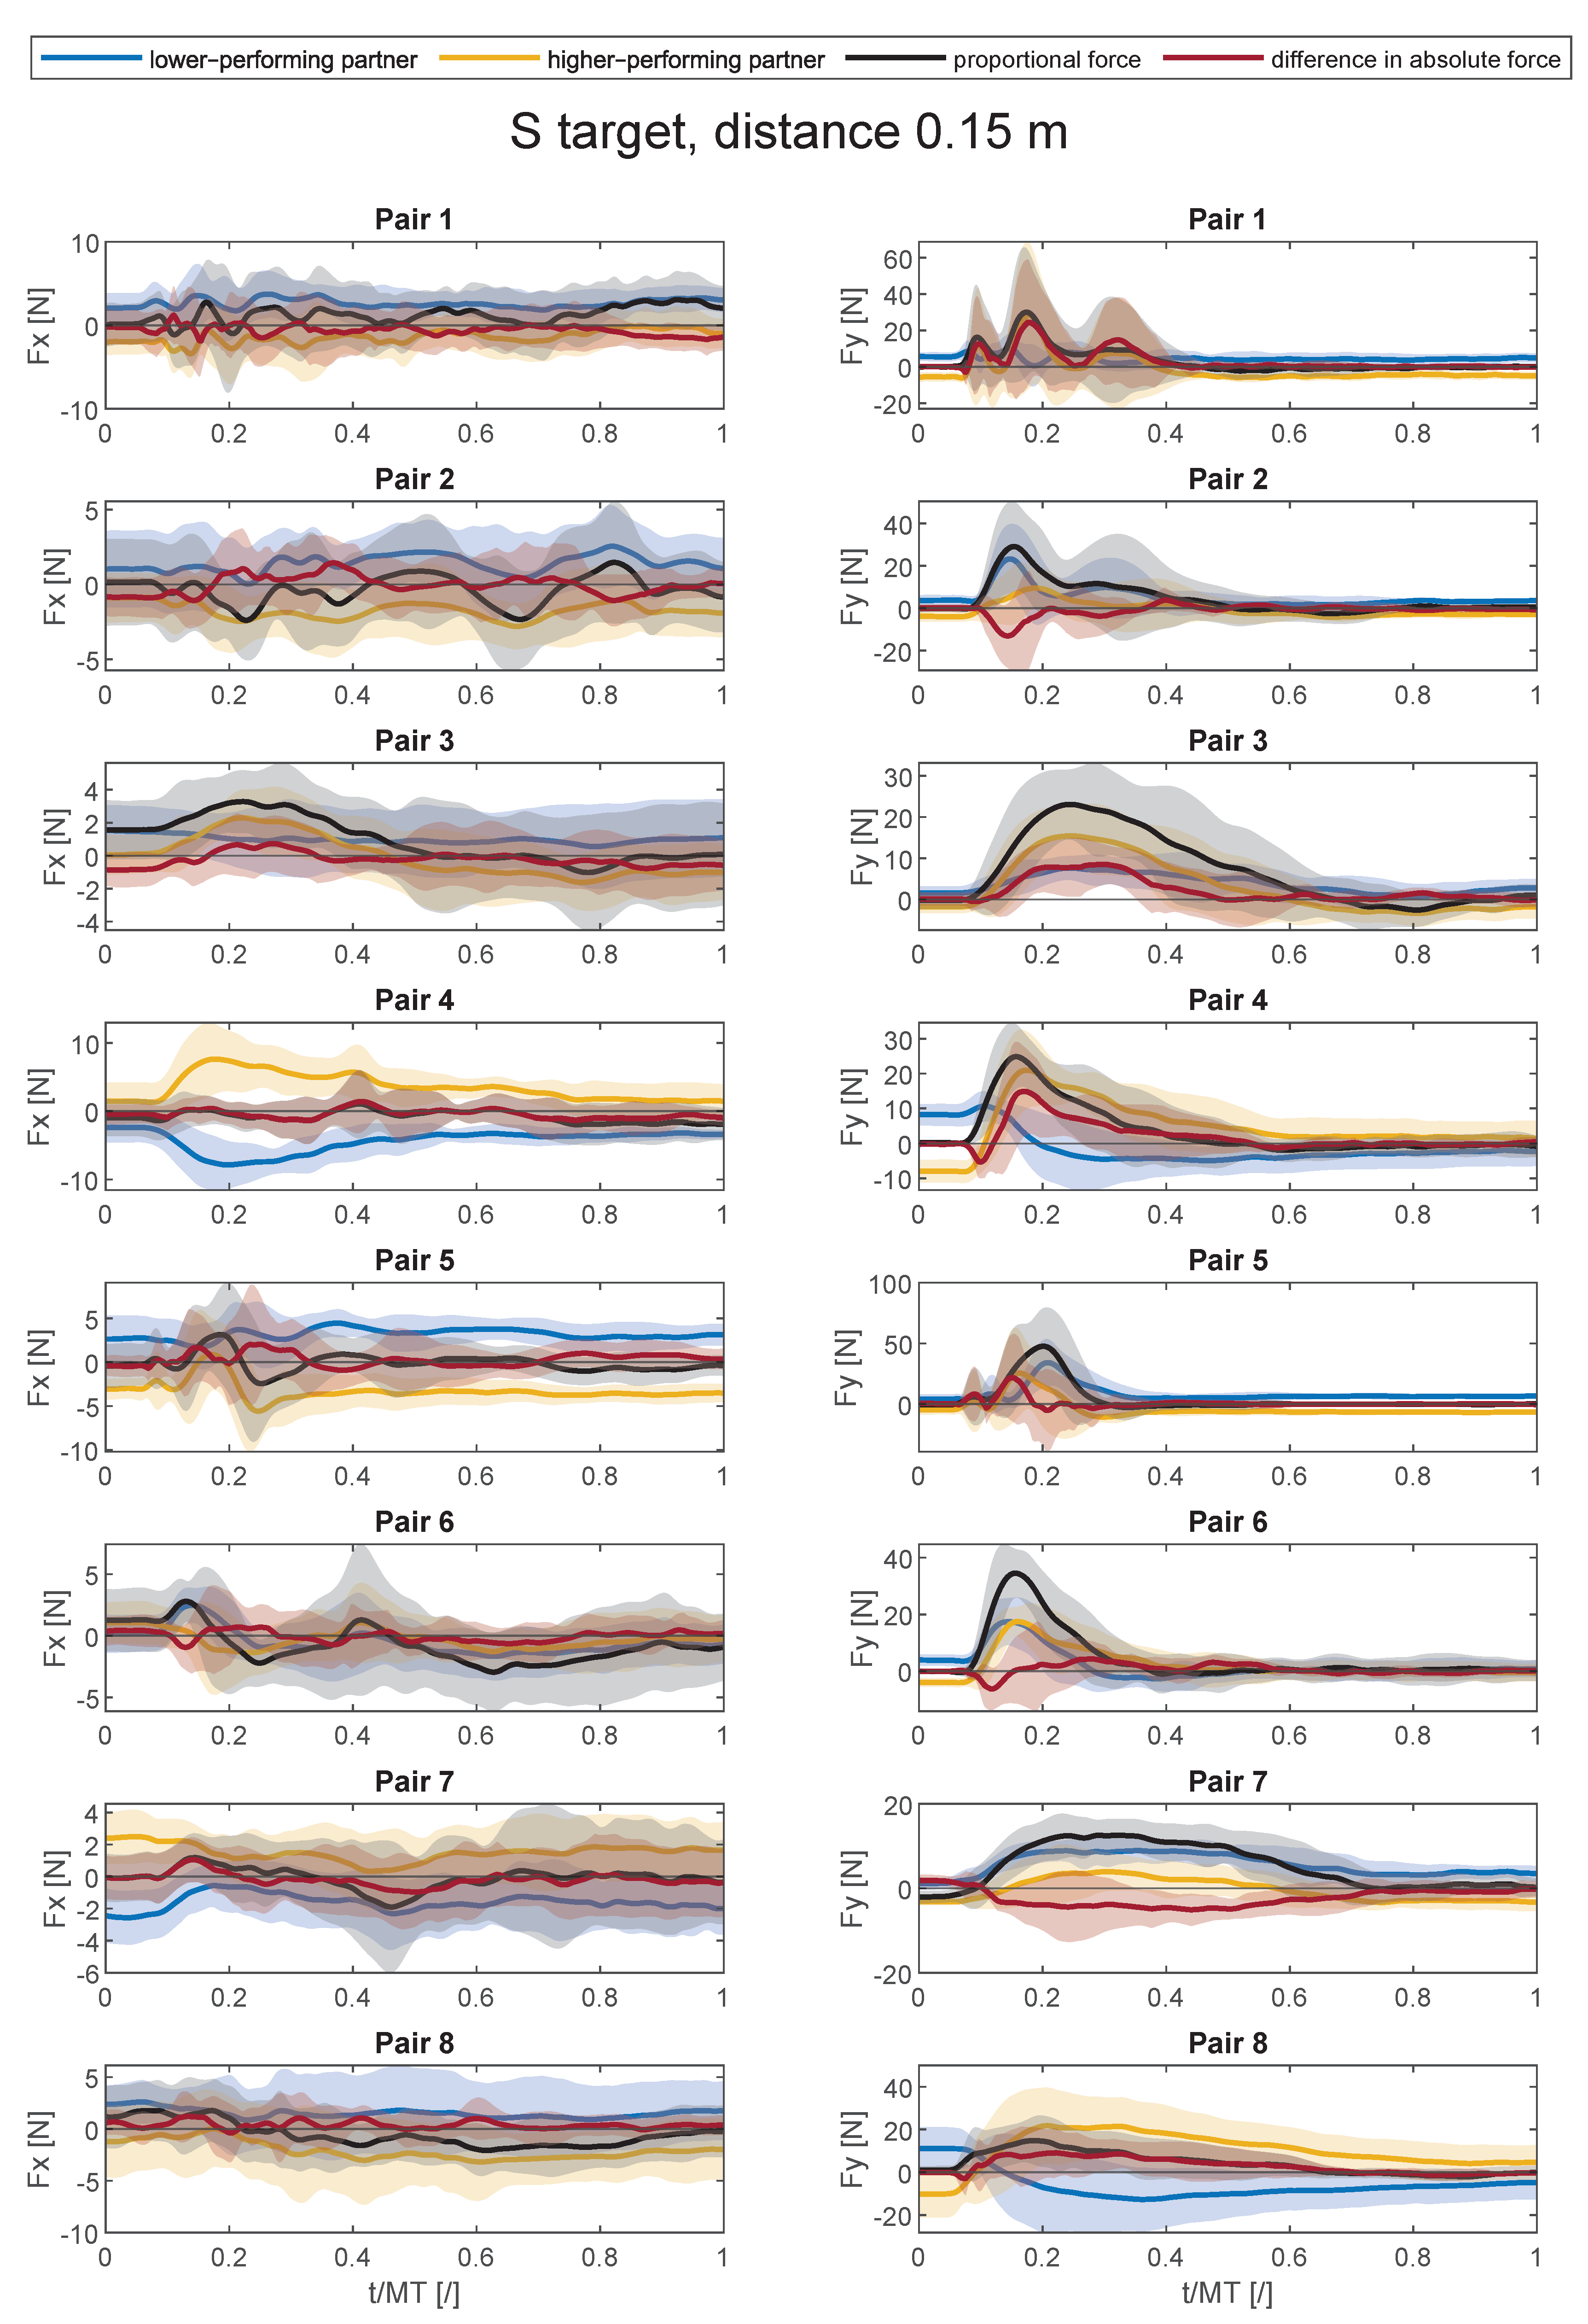
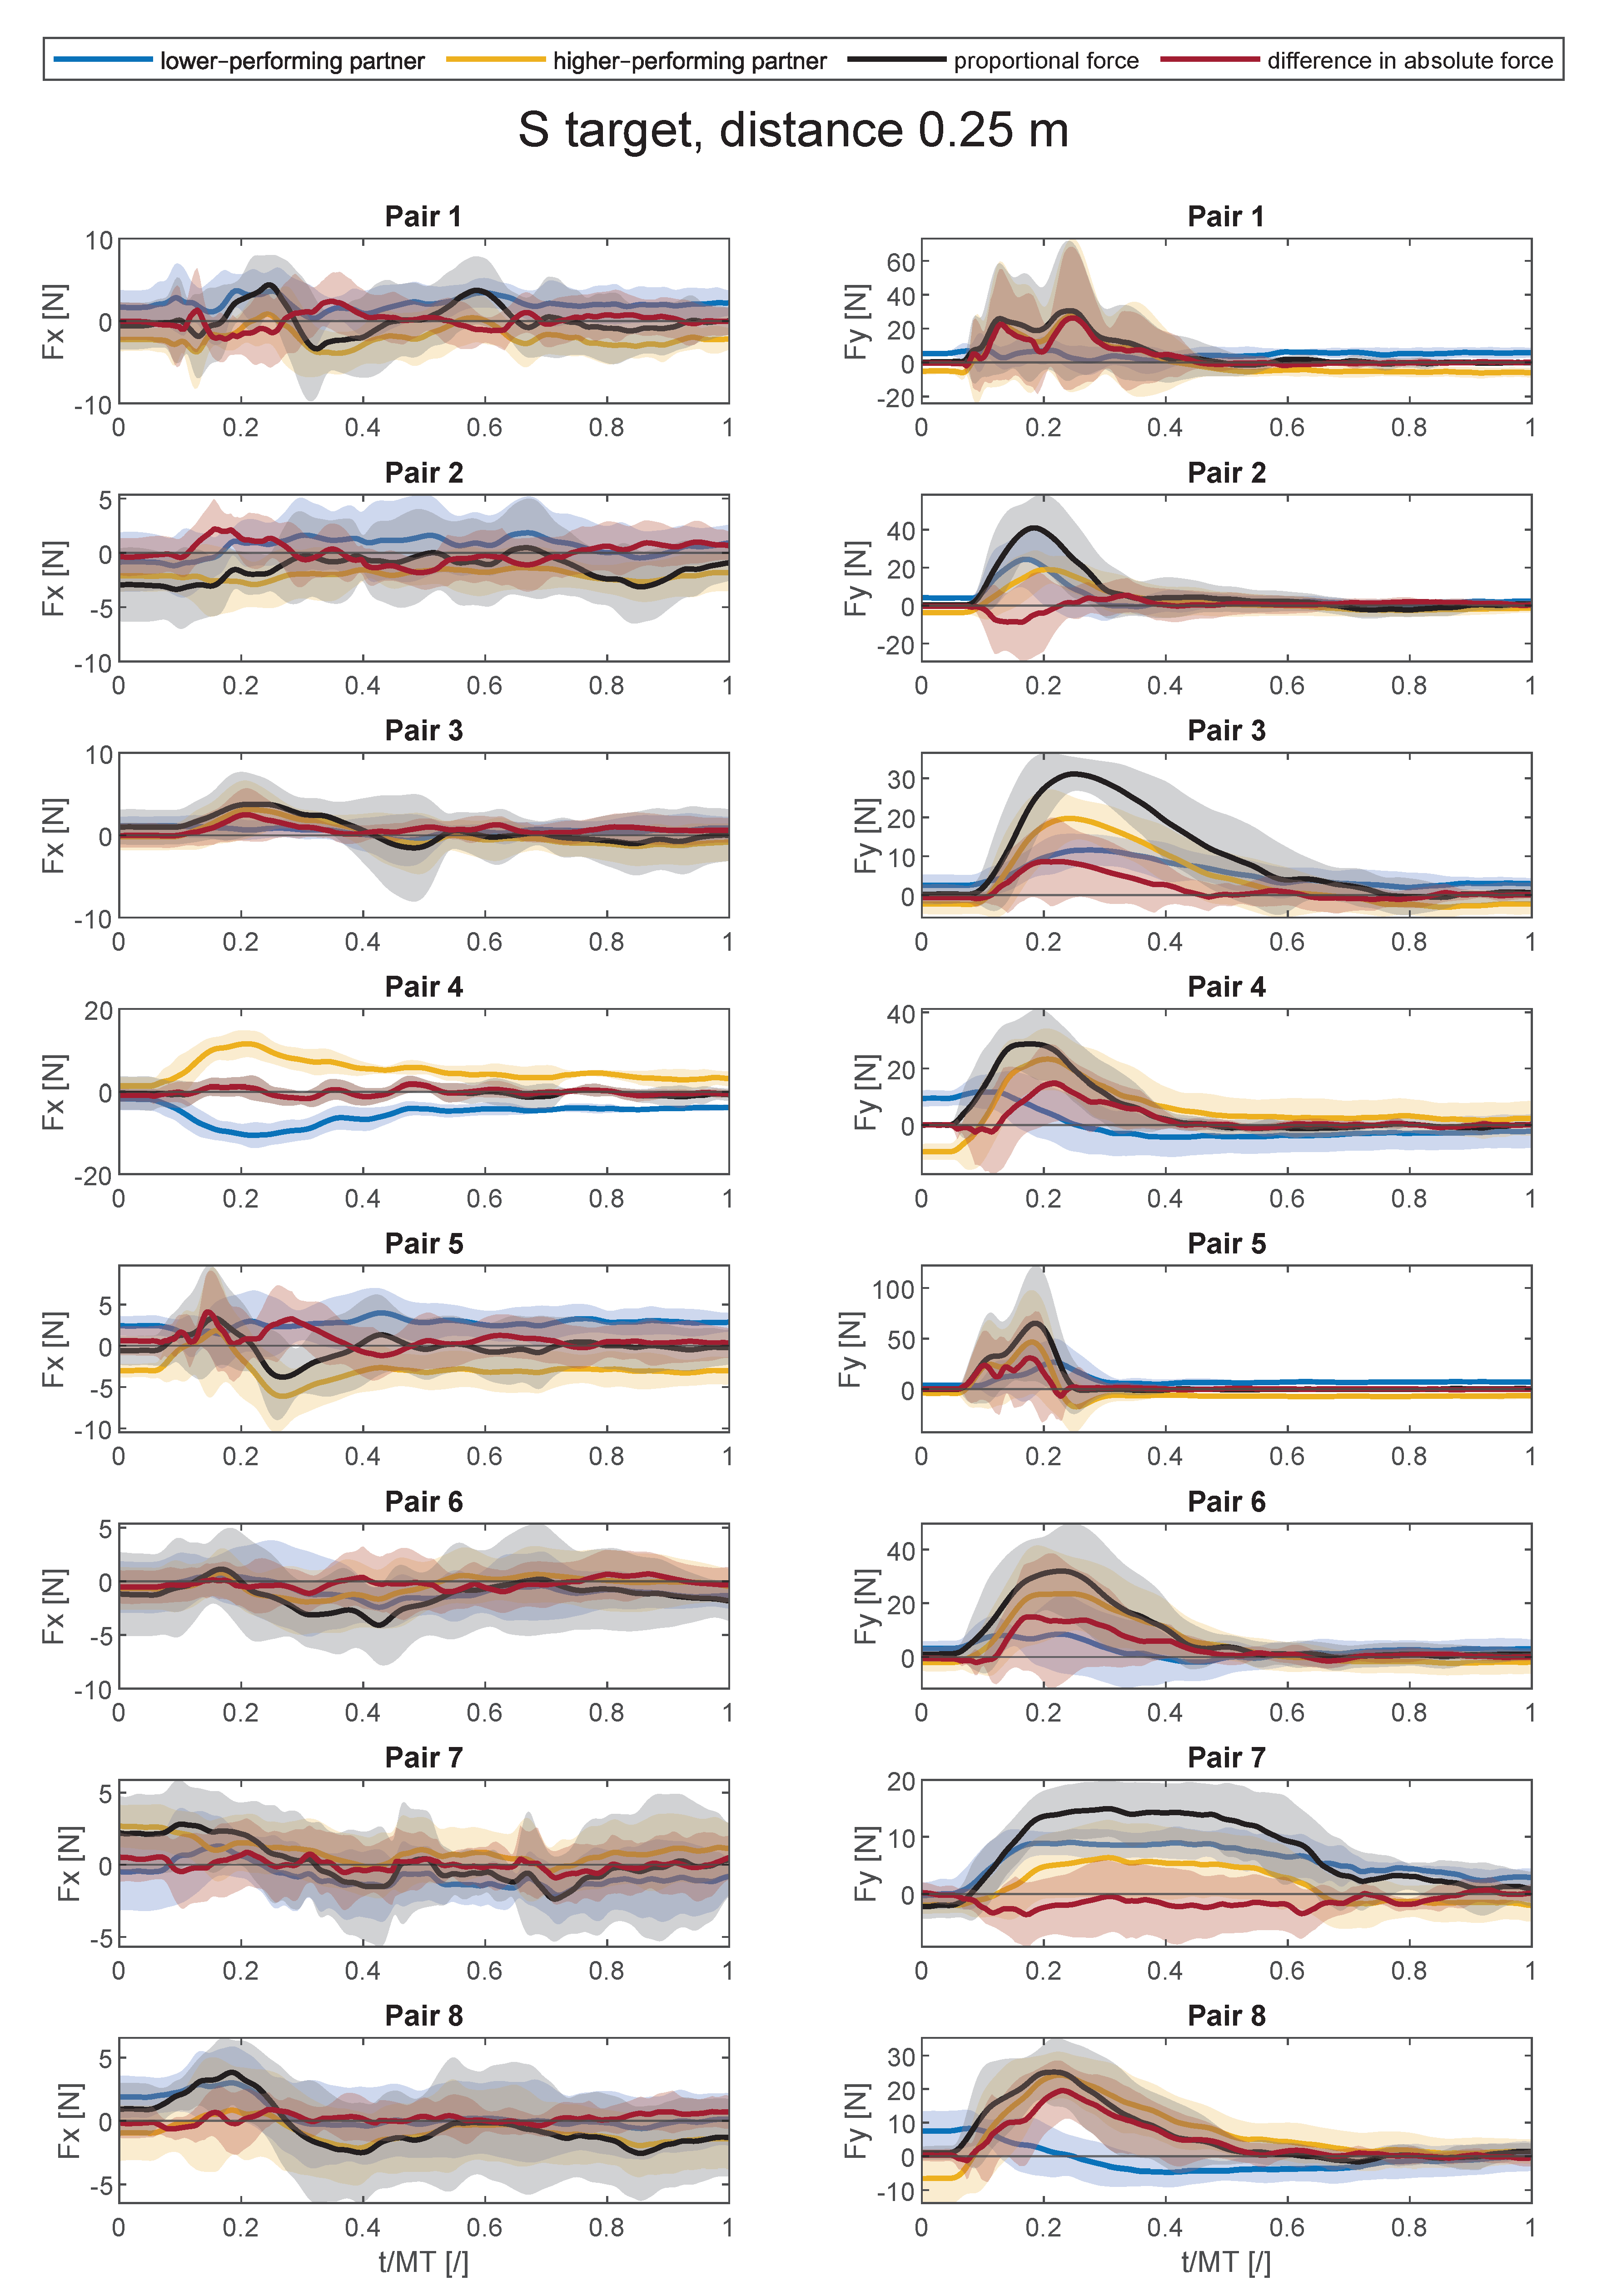
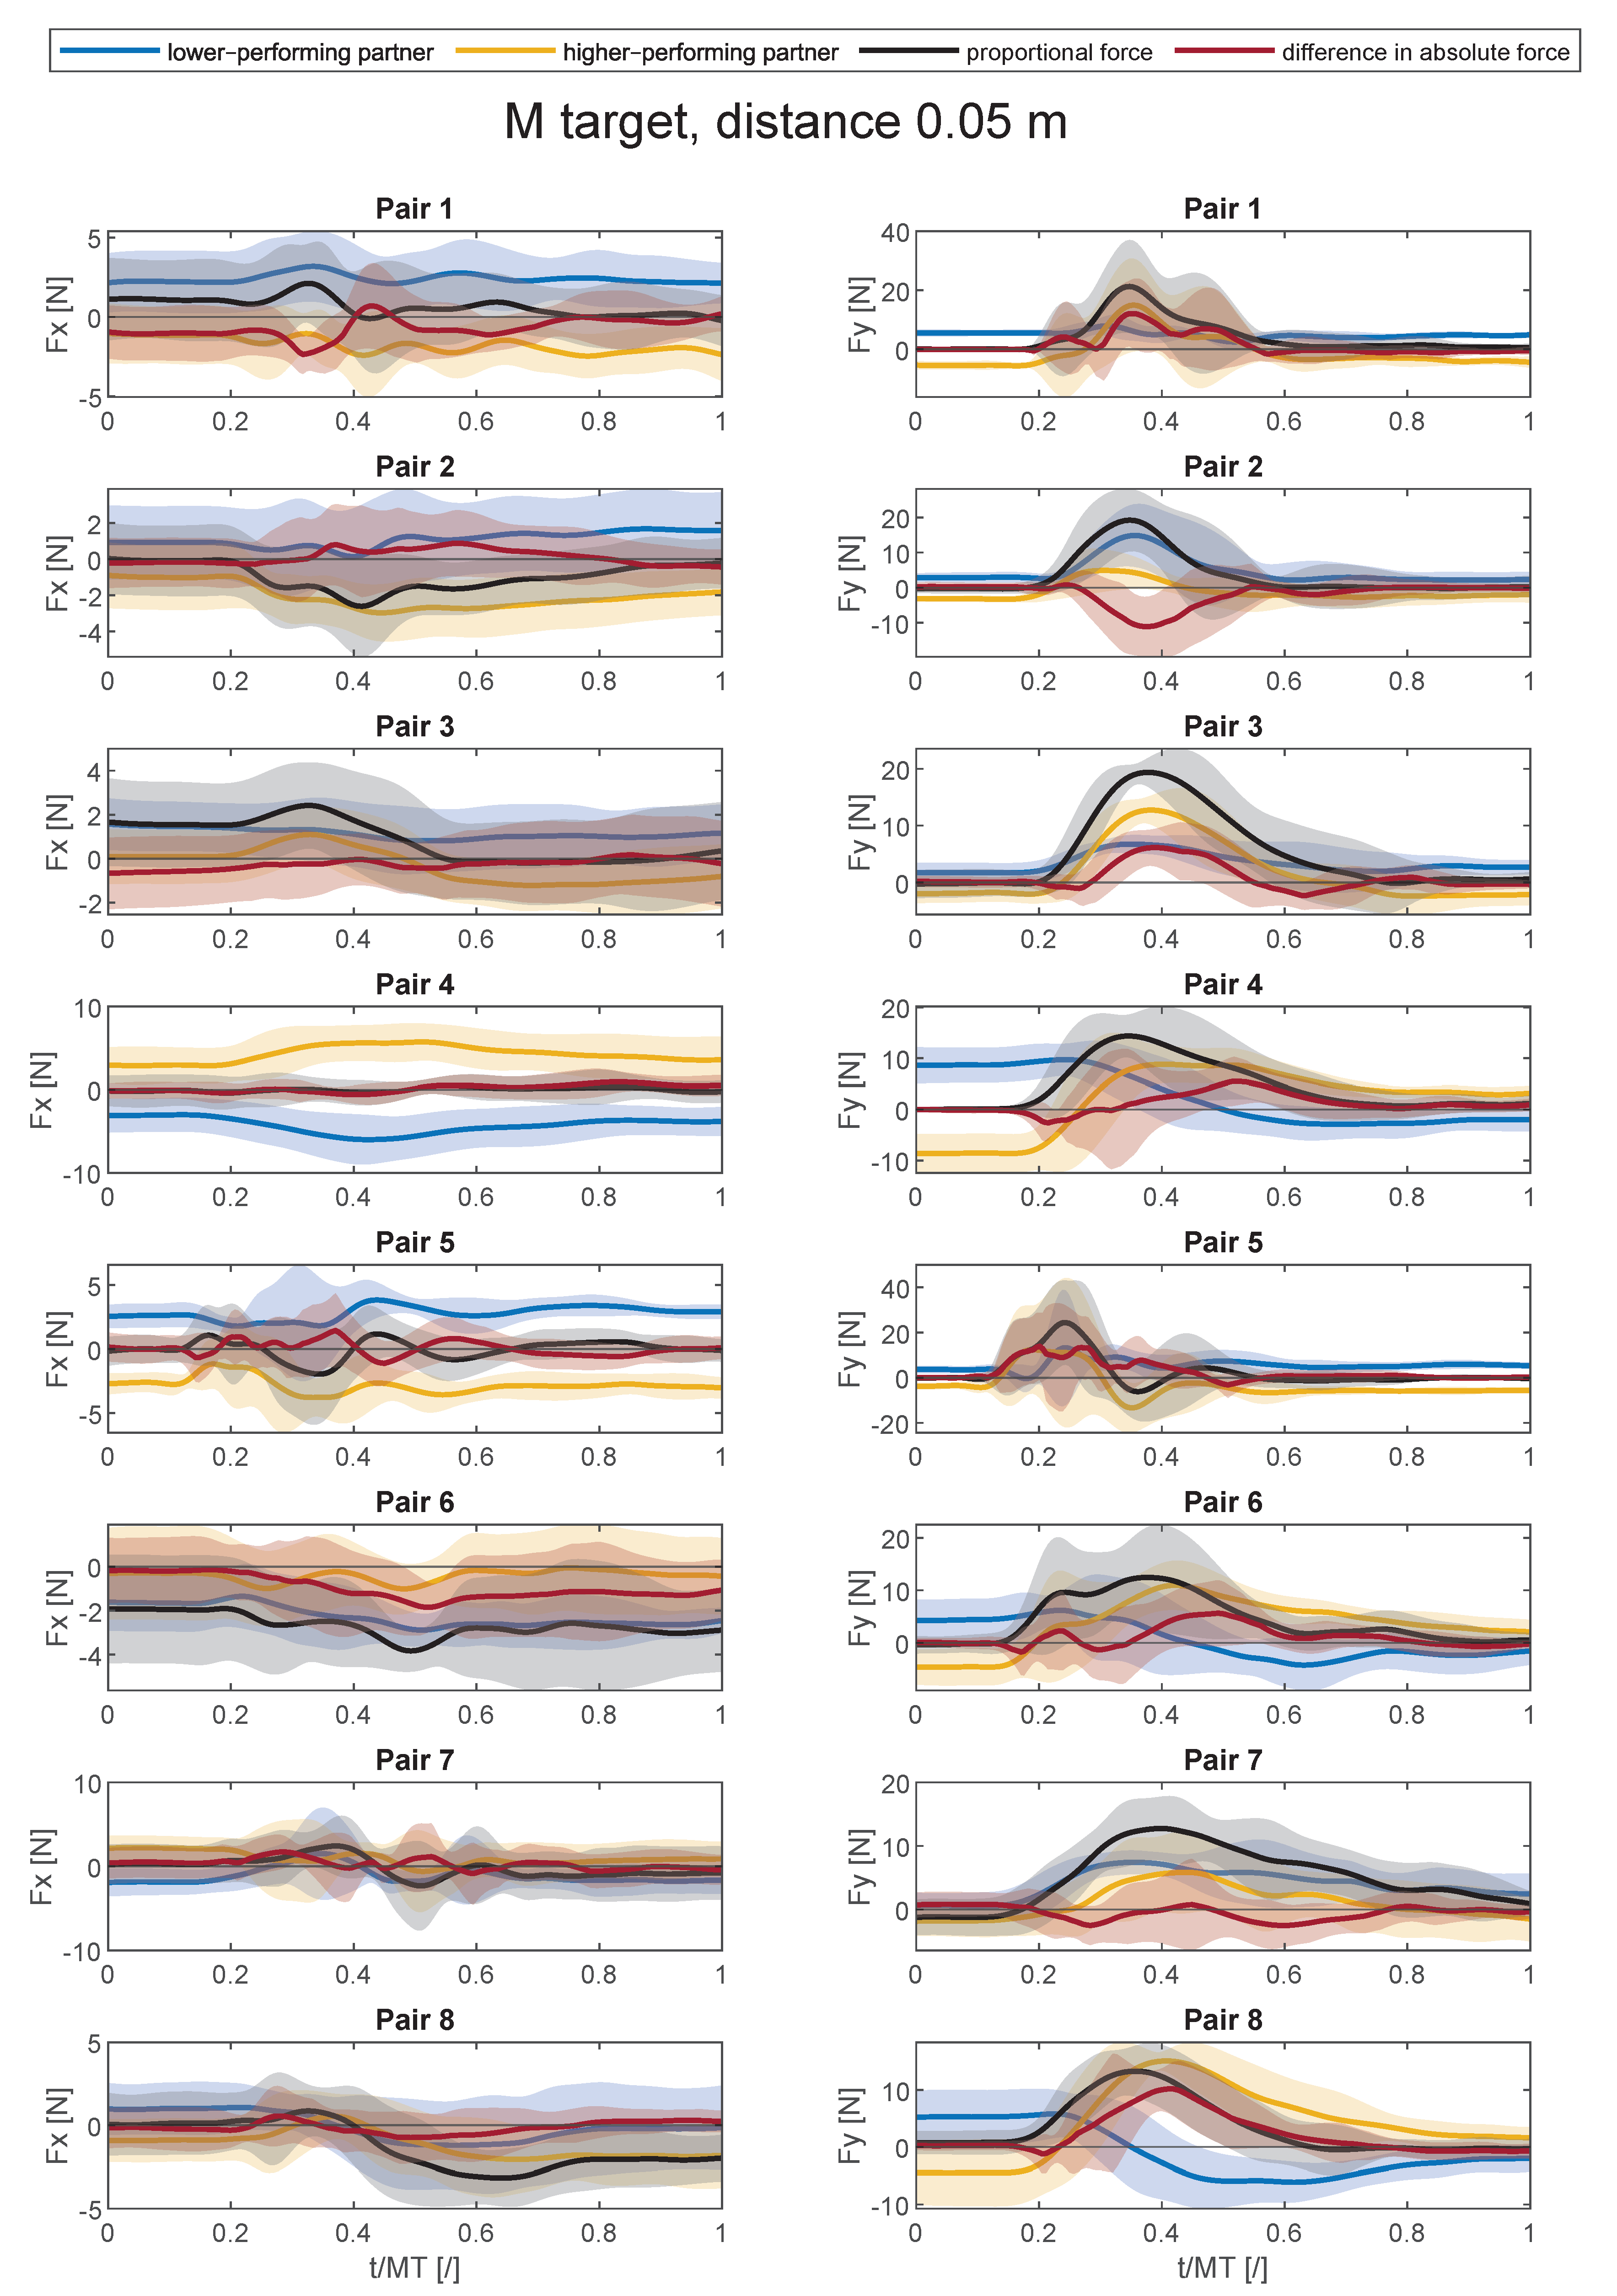
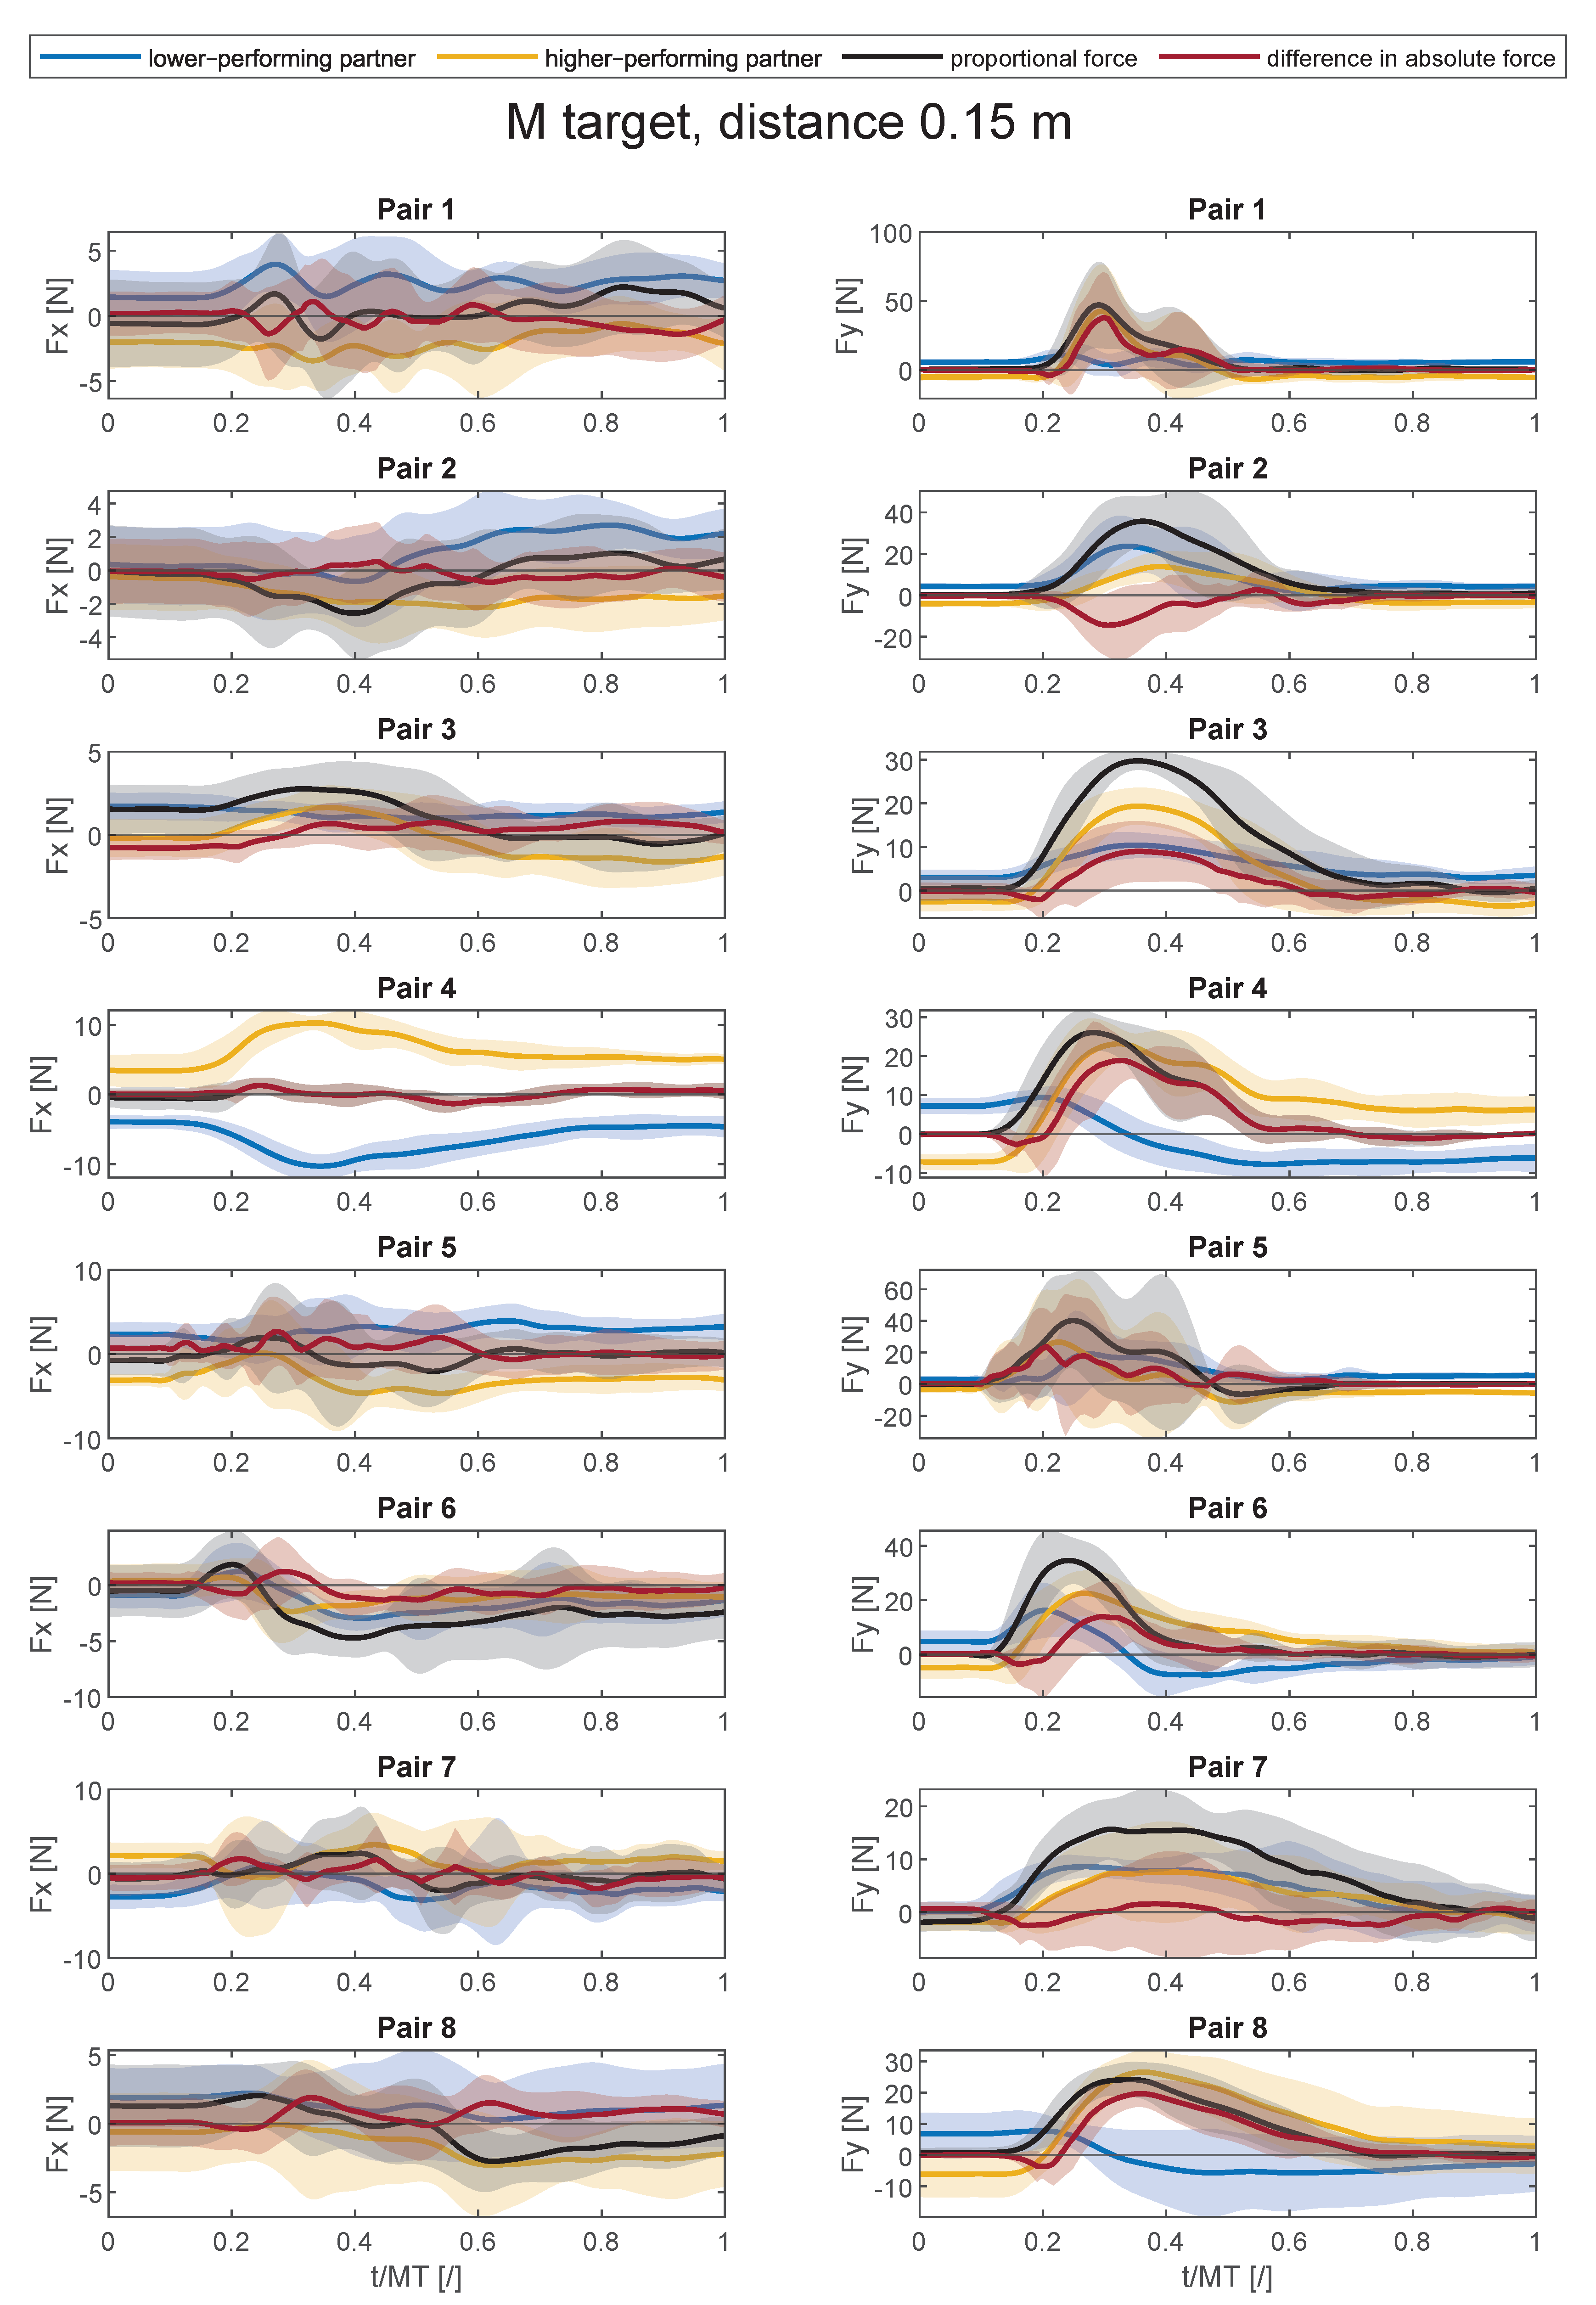
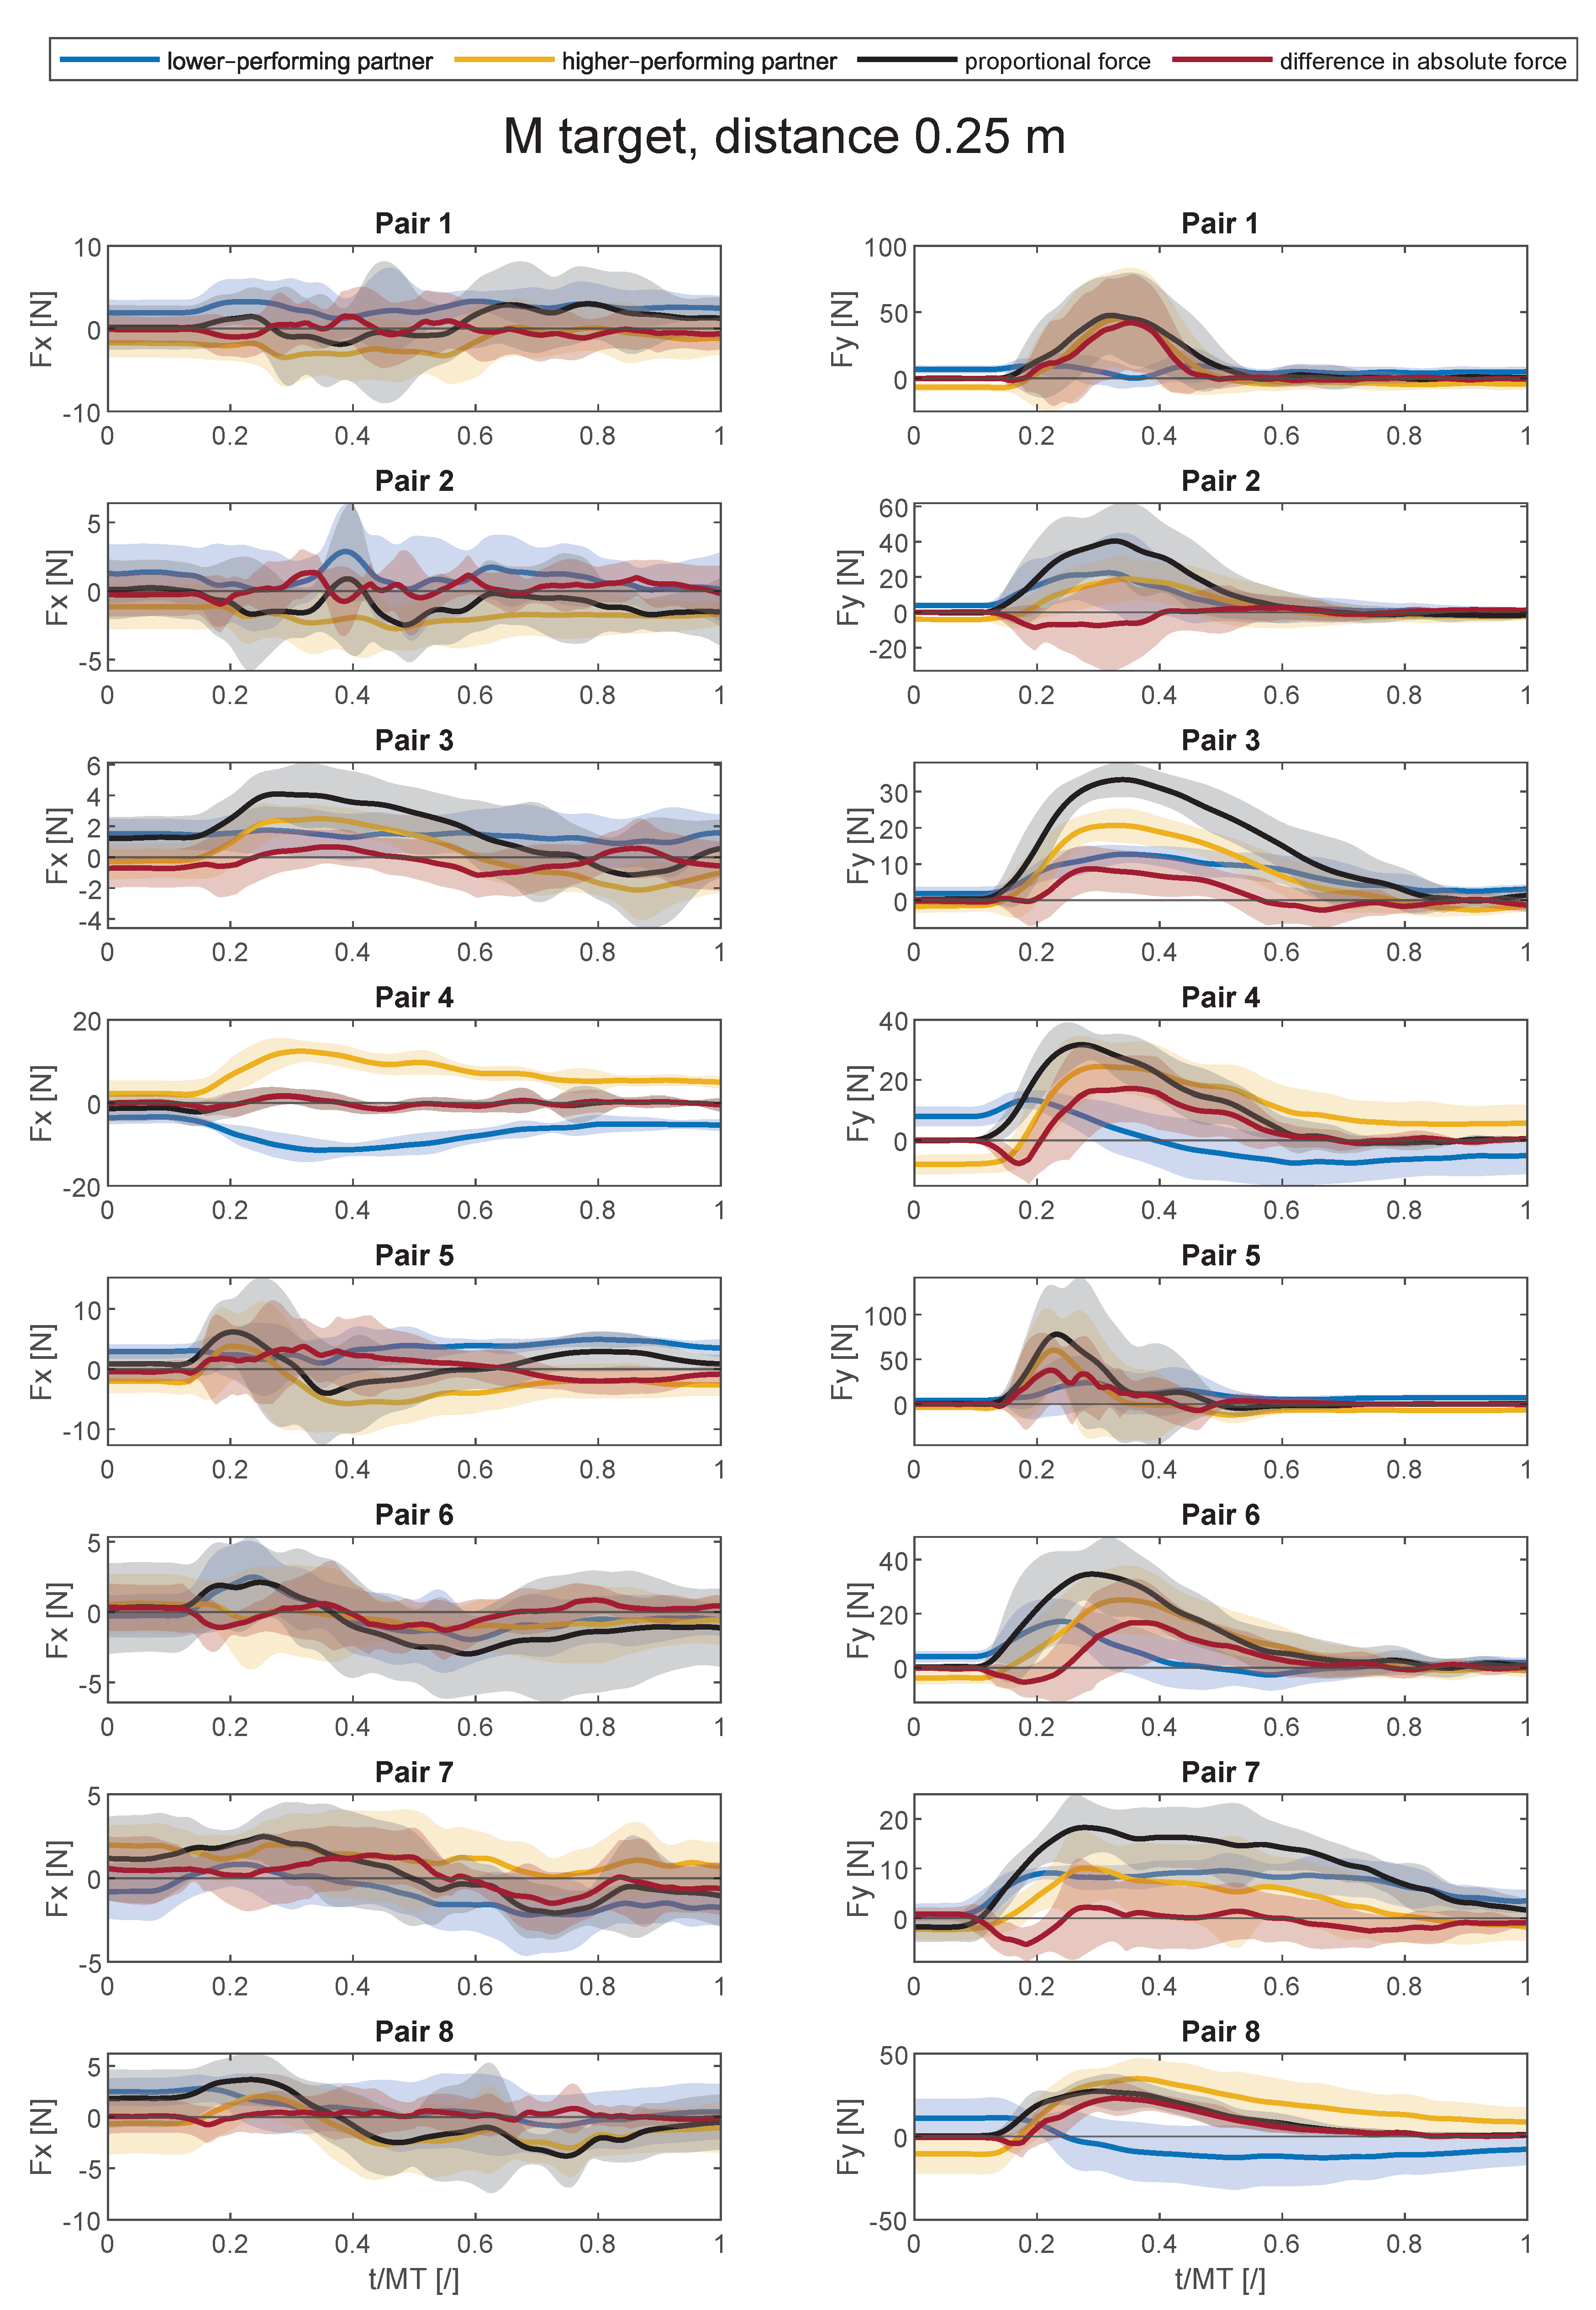
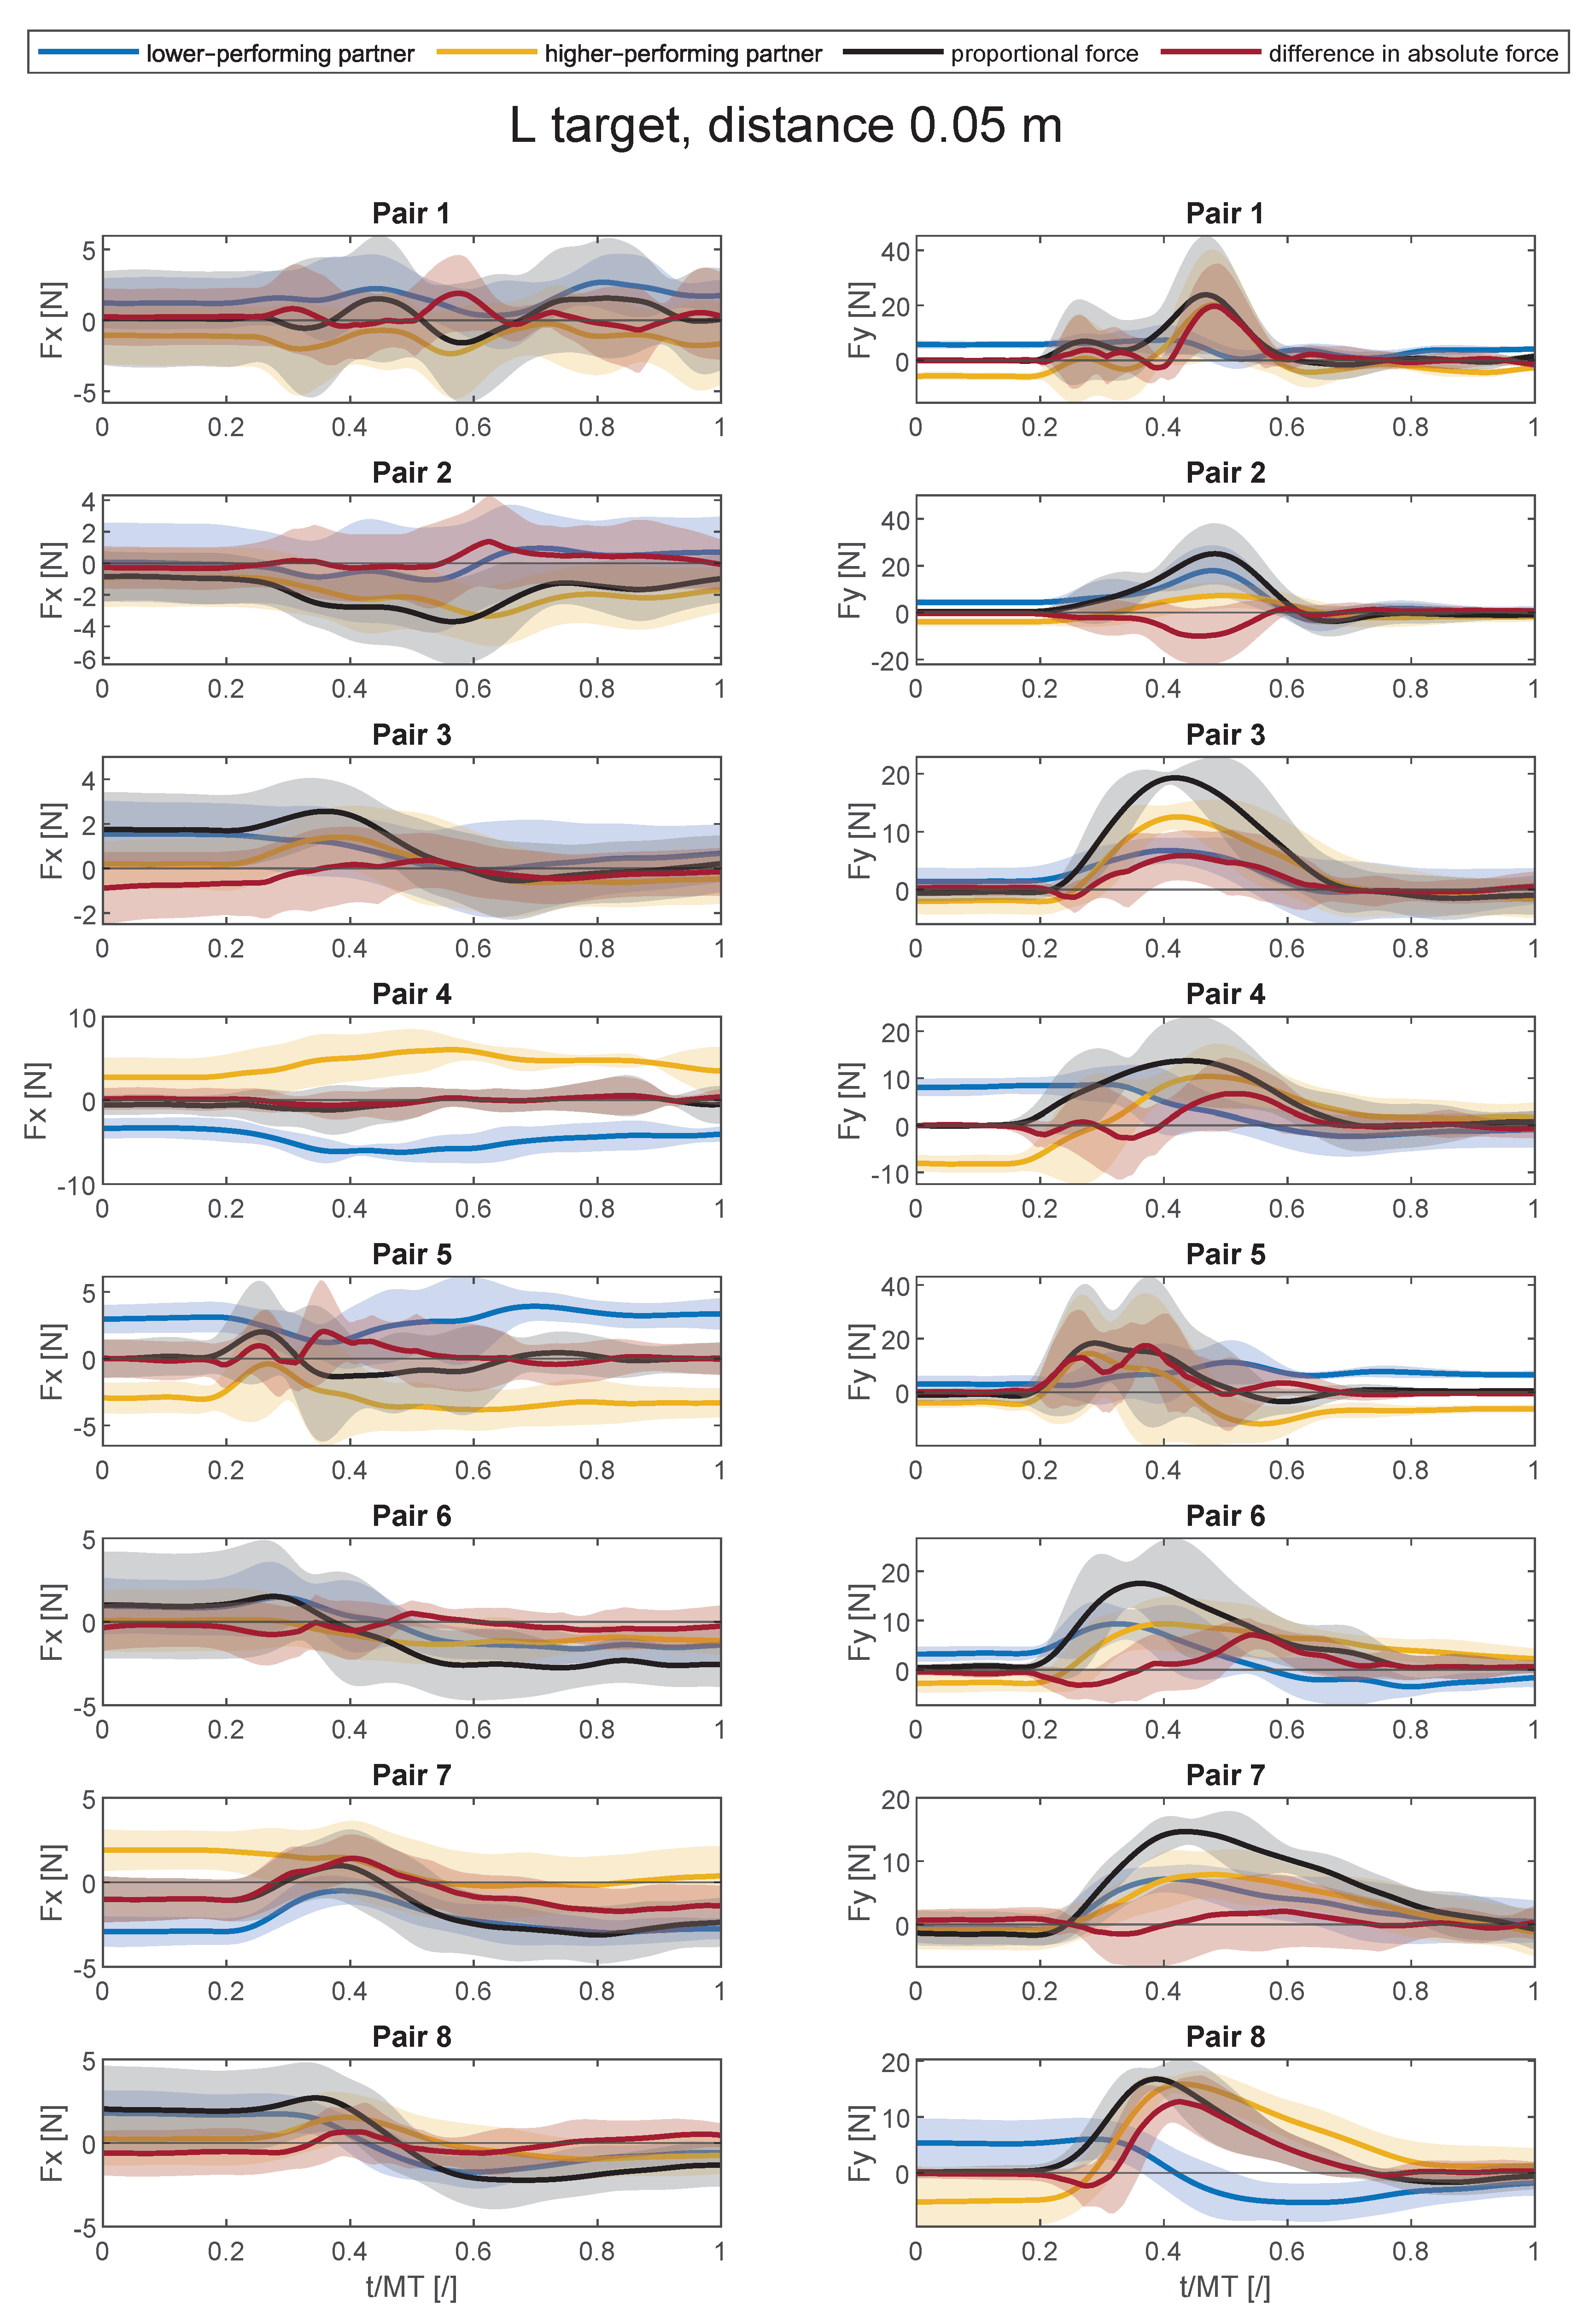
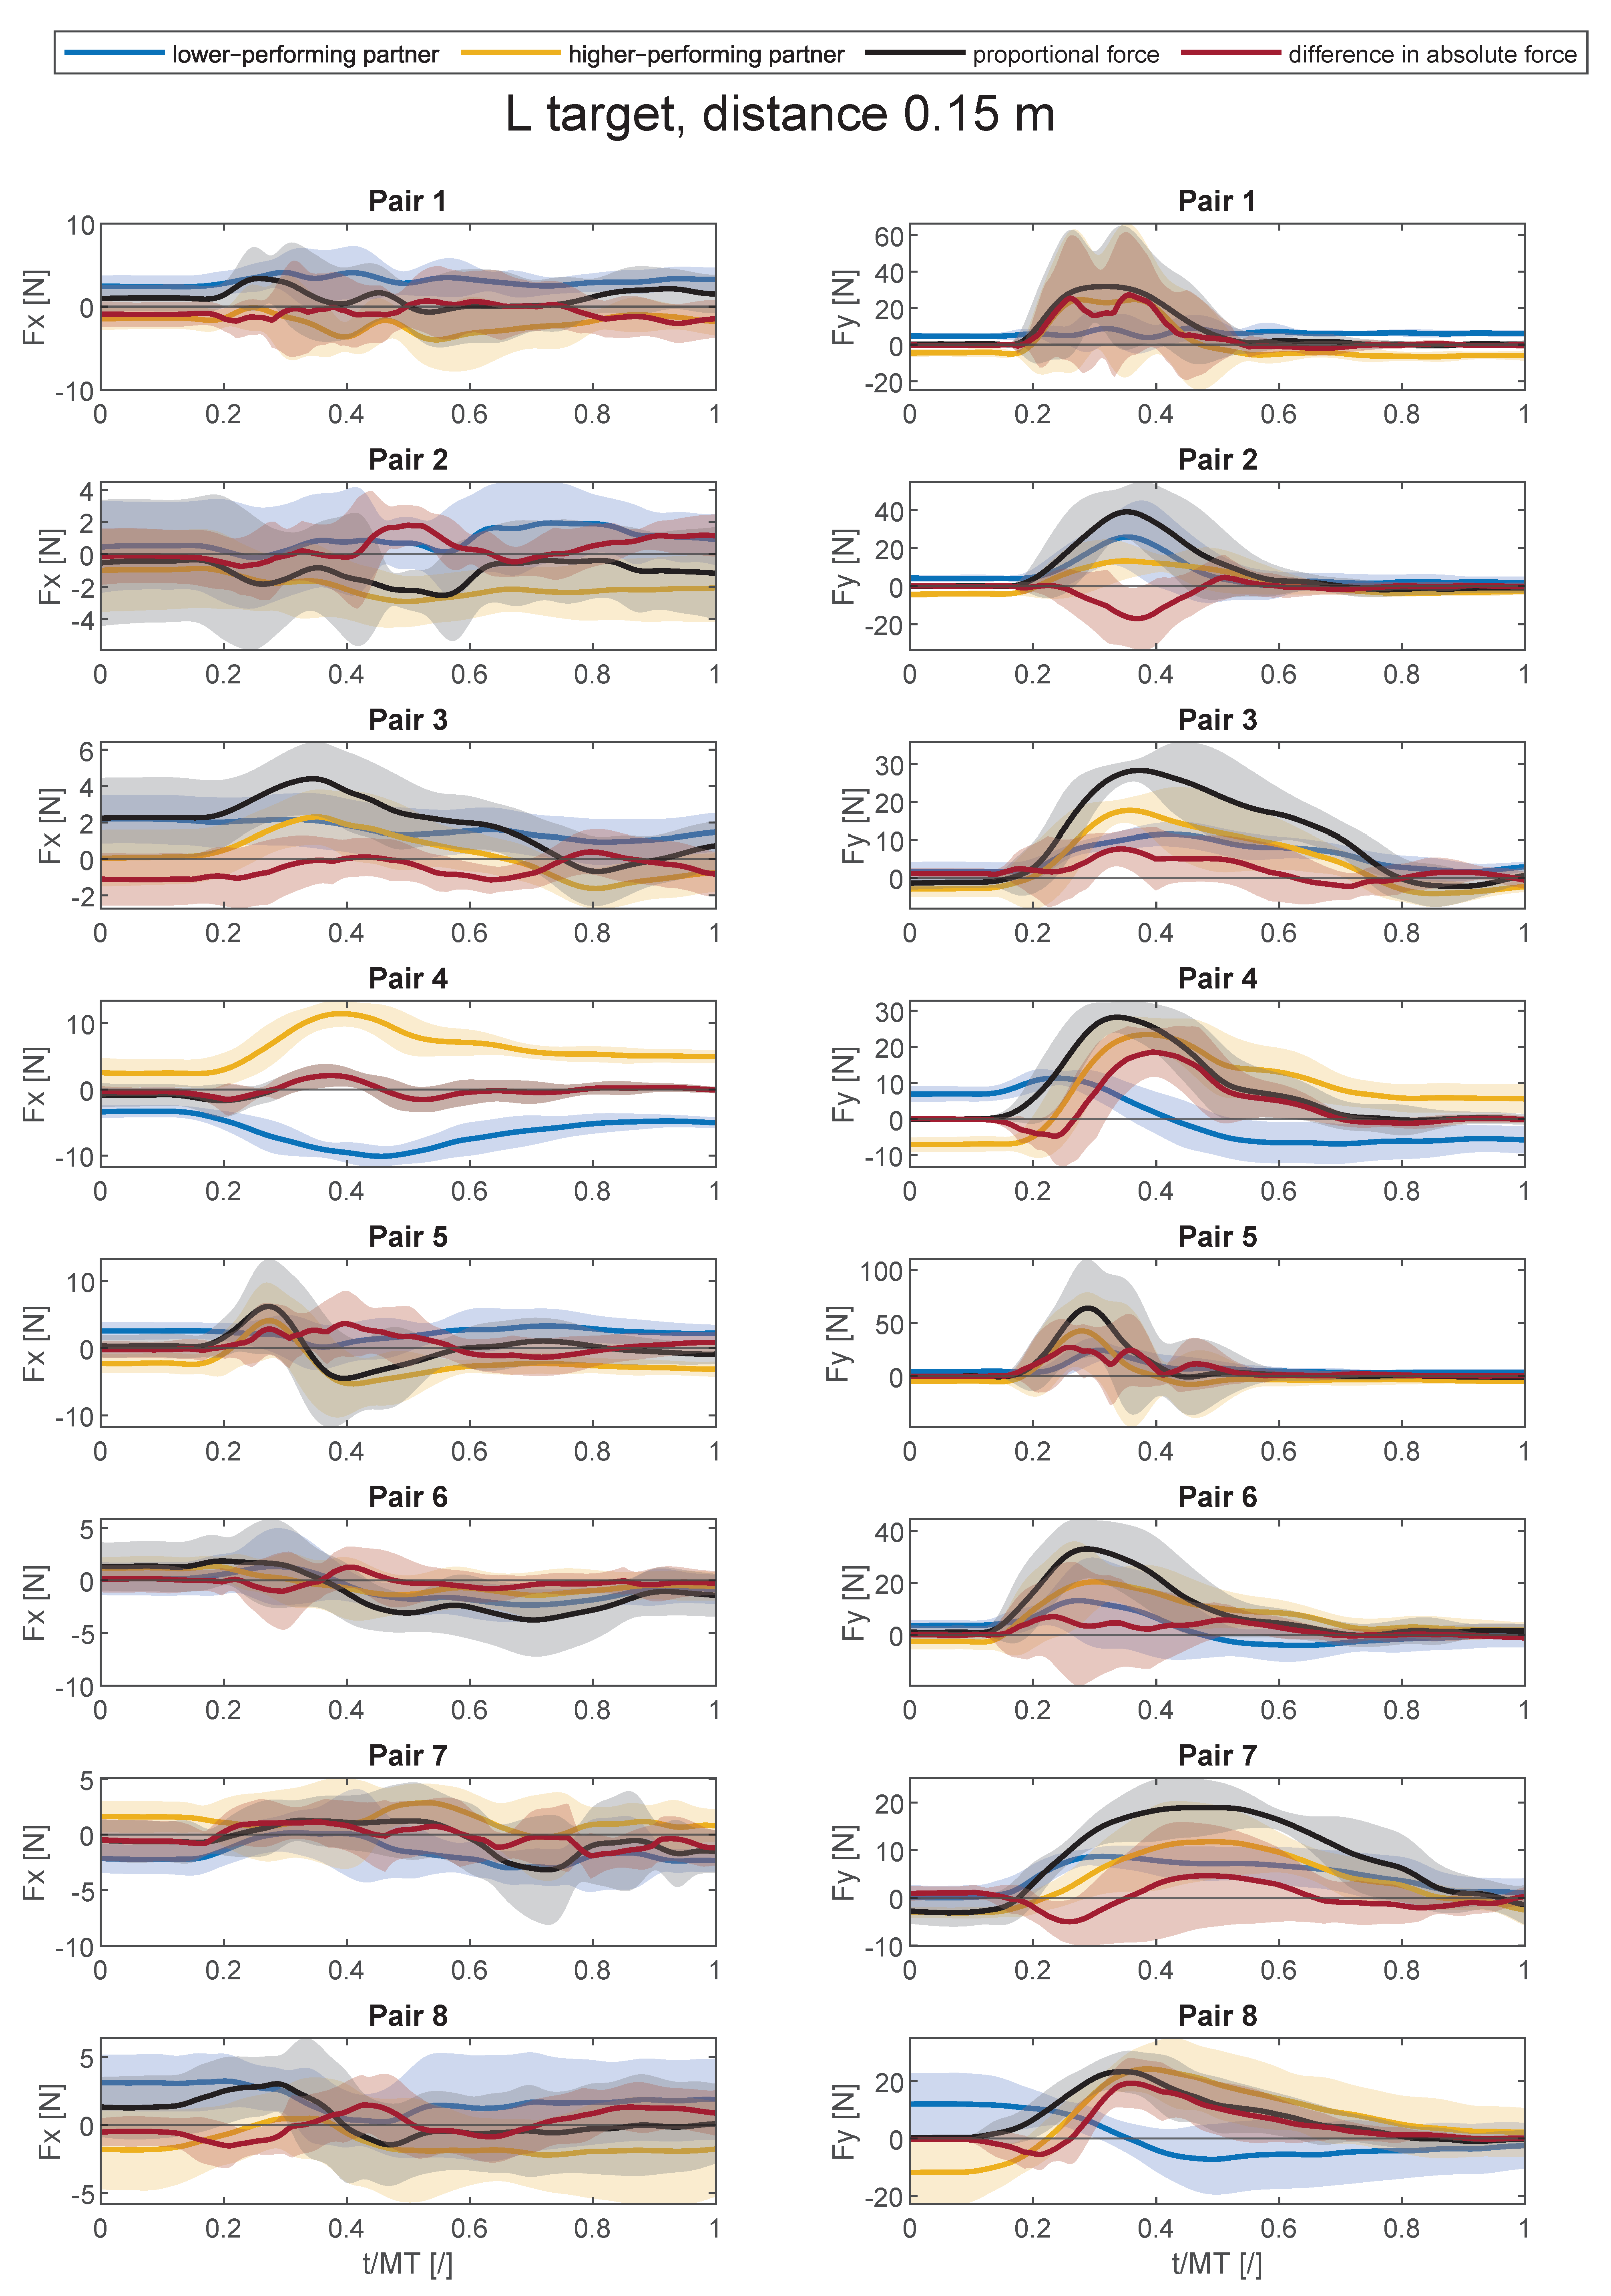
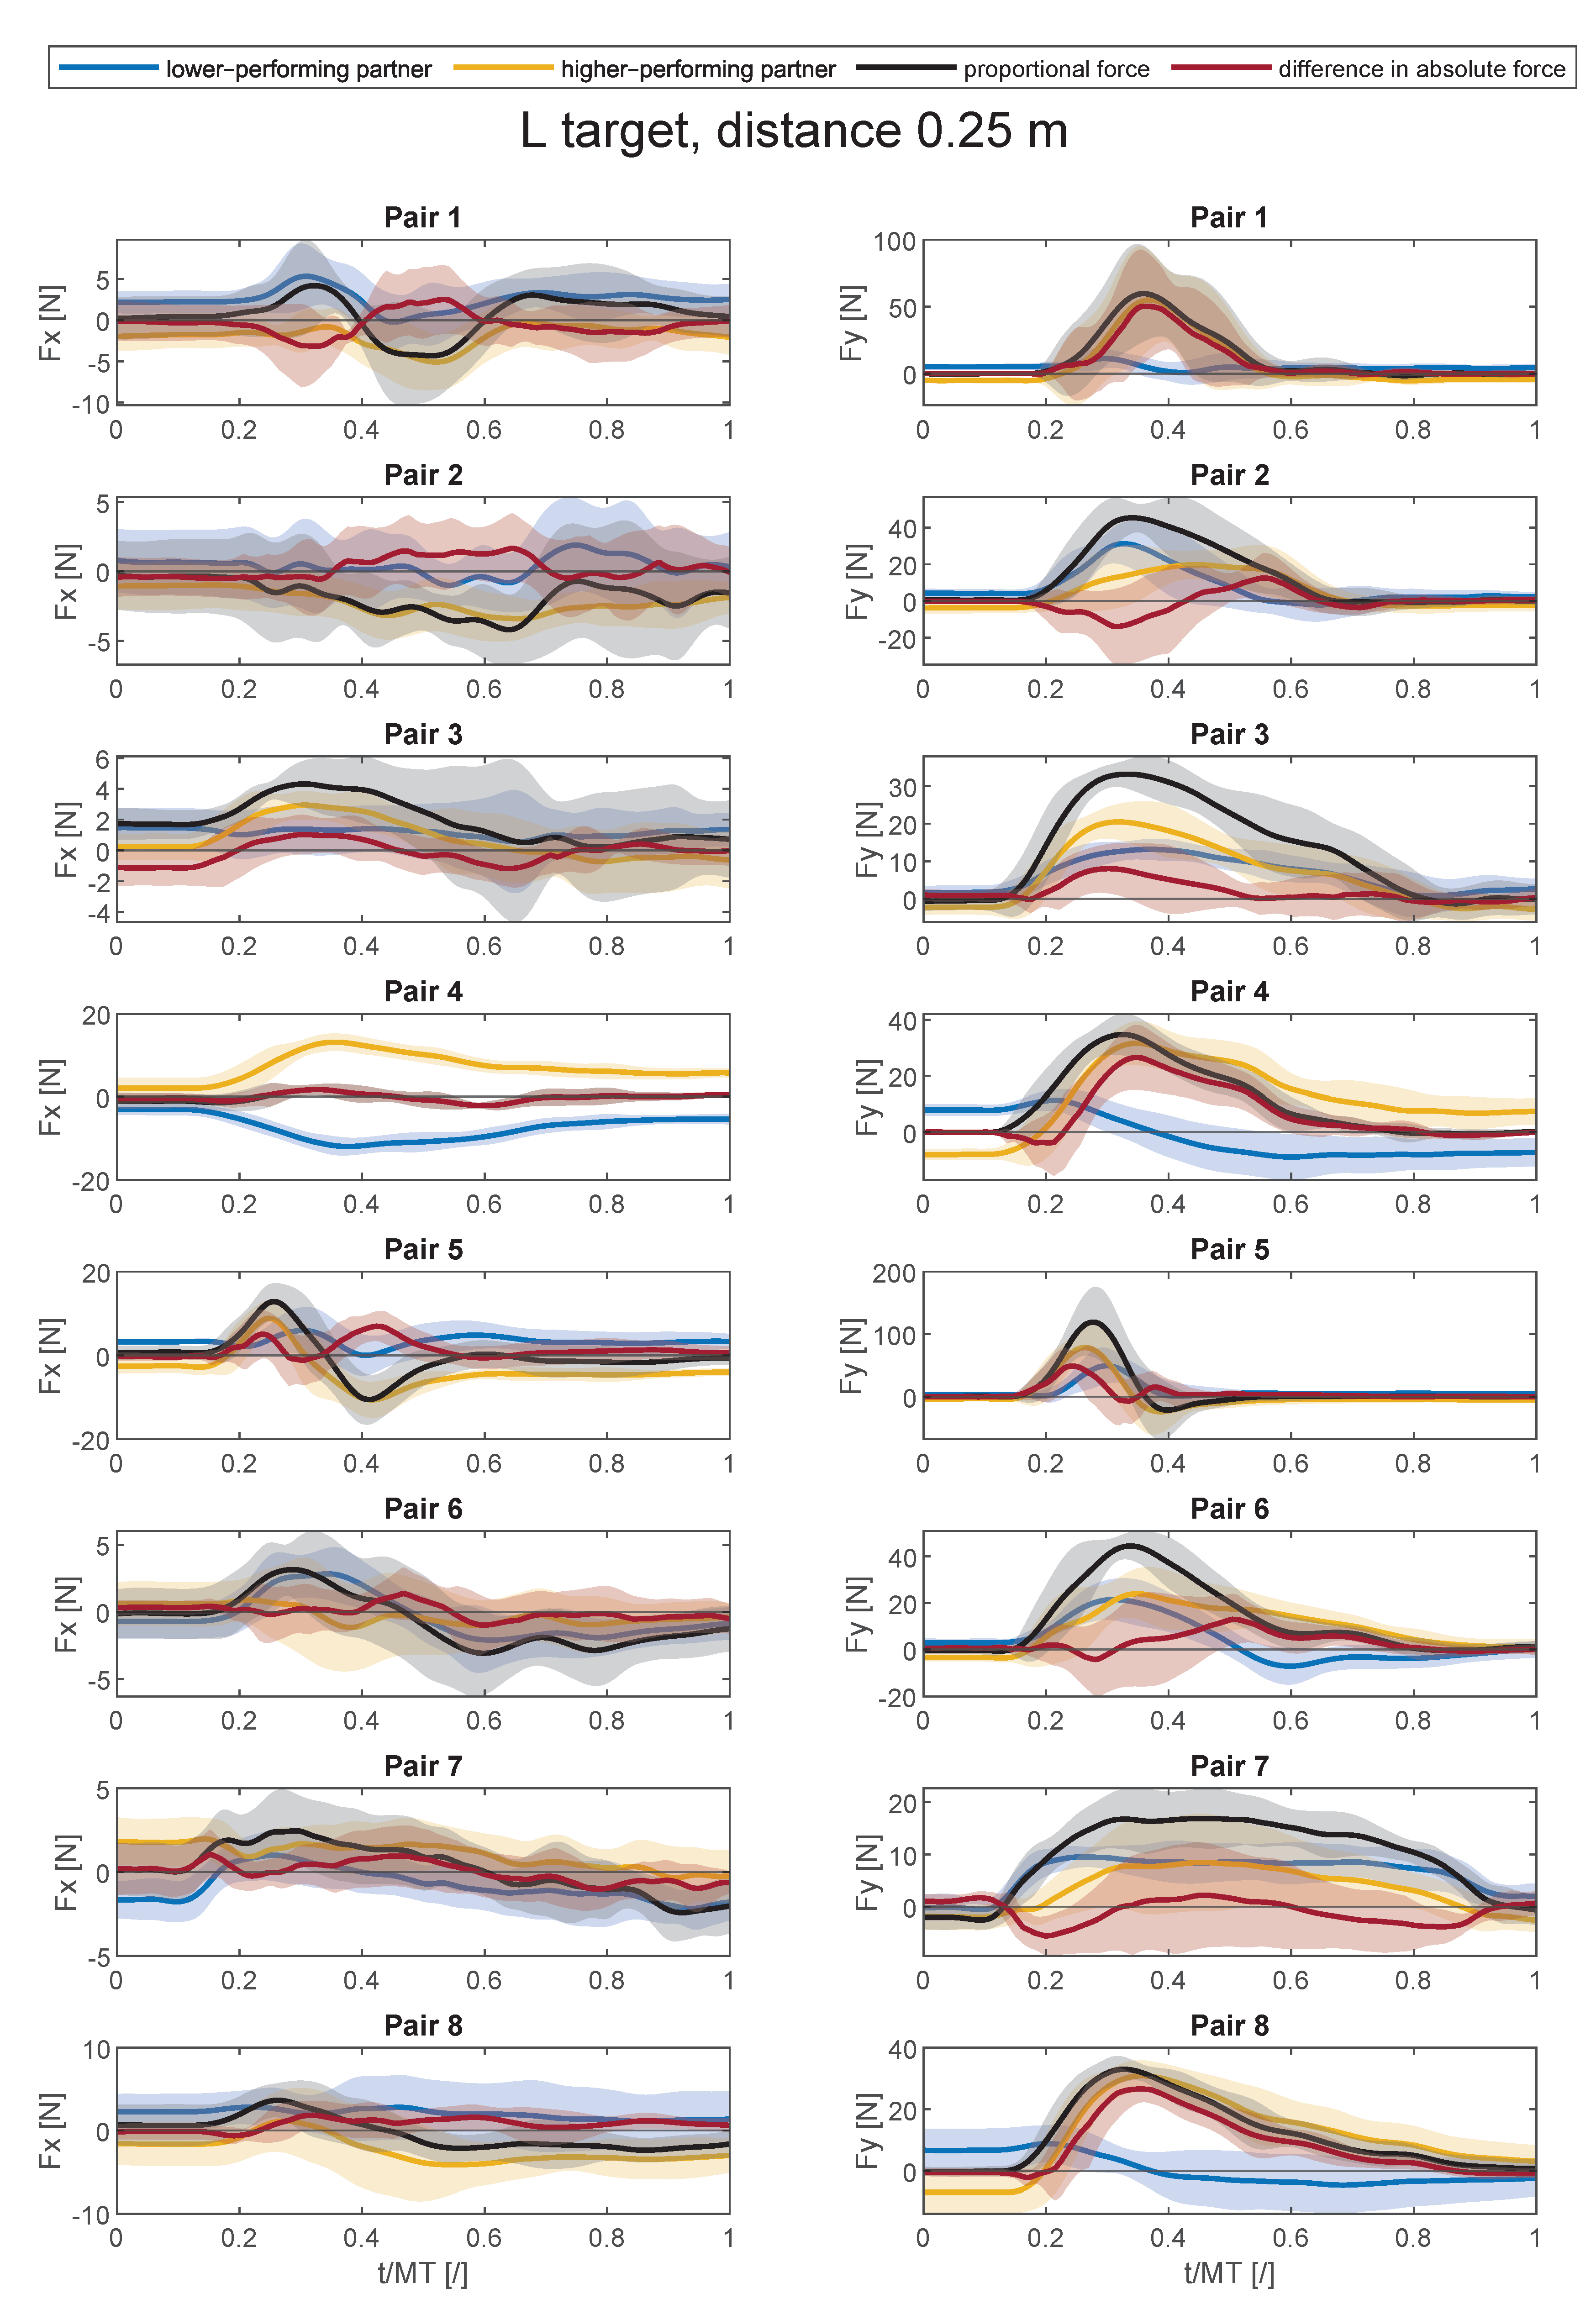
The forces applied by the partner with a lower individual performance (
) and partner with a higher individual performance (
), the proportional force (
) as well as the difference between the partners’ forces (
) during a collaborative task, from which the leader was calculated, are also presented for each pair and target separately in
Figure A1,
Figure A2,
Figure A3,
Figure A4,
Figure A5,
Figure A6,
Figure A7,
Figure A8 and
Figure A9.
Results presented in
Figure 4 suggest that the subject displaying higher performance in the individual trials will be the leader in the collaborative trials as the average leading value for all targets are positive. We can also see that the influence of each partner on the task is not constant but rather changes based on the target. Analysis of variance showed that the difference in partner influence on the task performance was based on the target distance (
,
) and the target size (
,
) with the
F and
p value of the interaction between distance and size being (
,
). Here, the influence of the higher-performing individual on the task increased with the increase in target size and target distance.
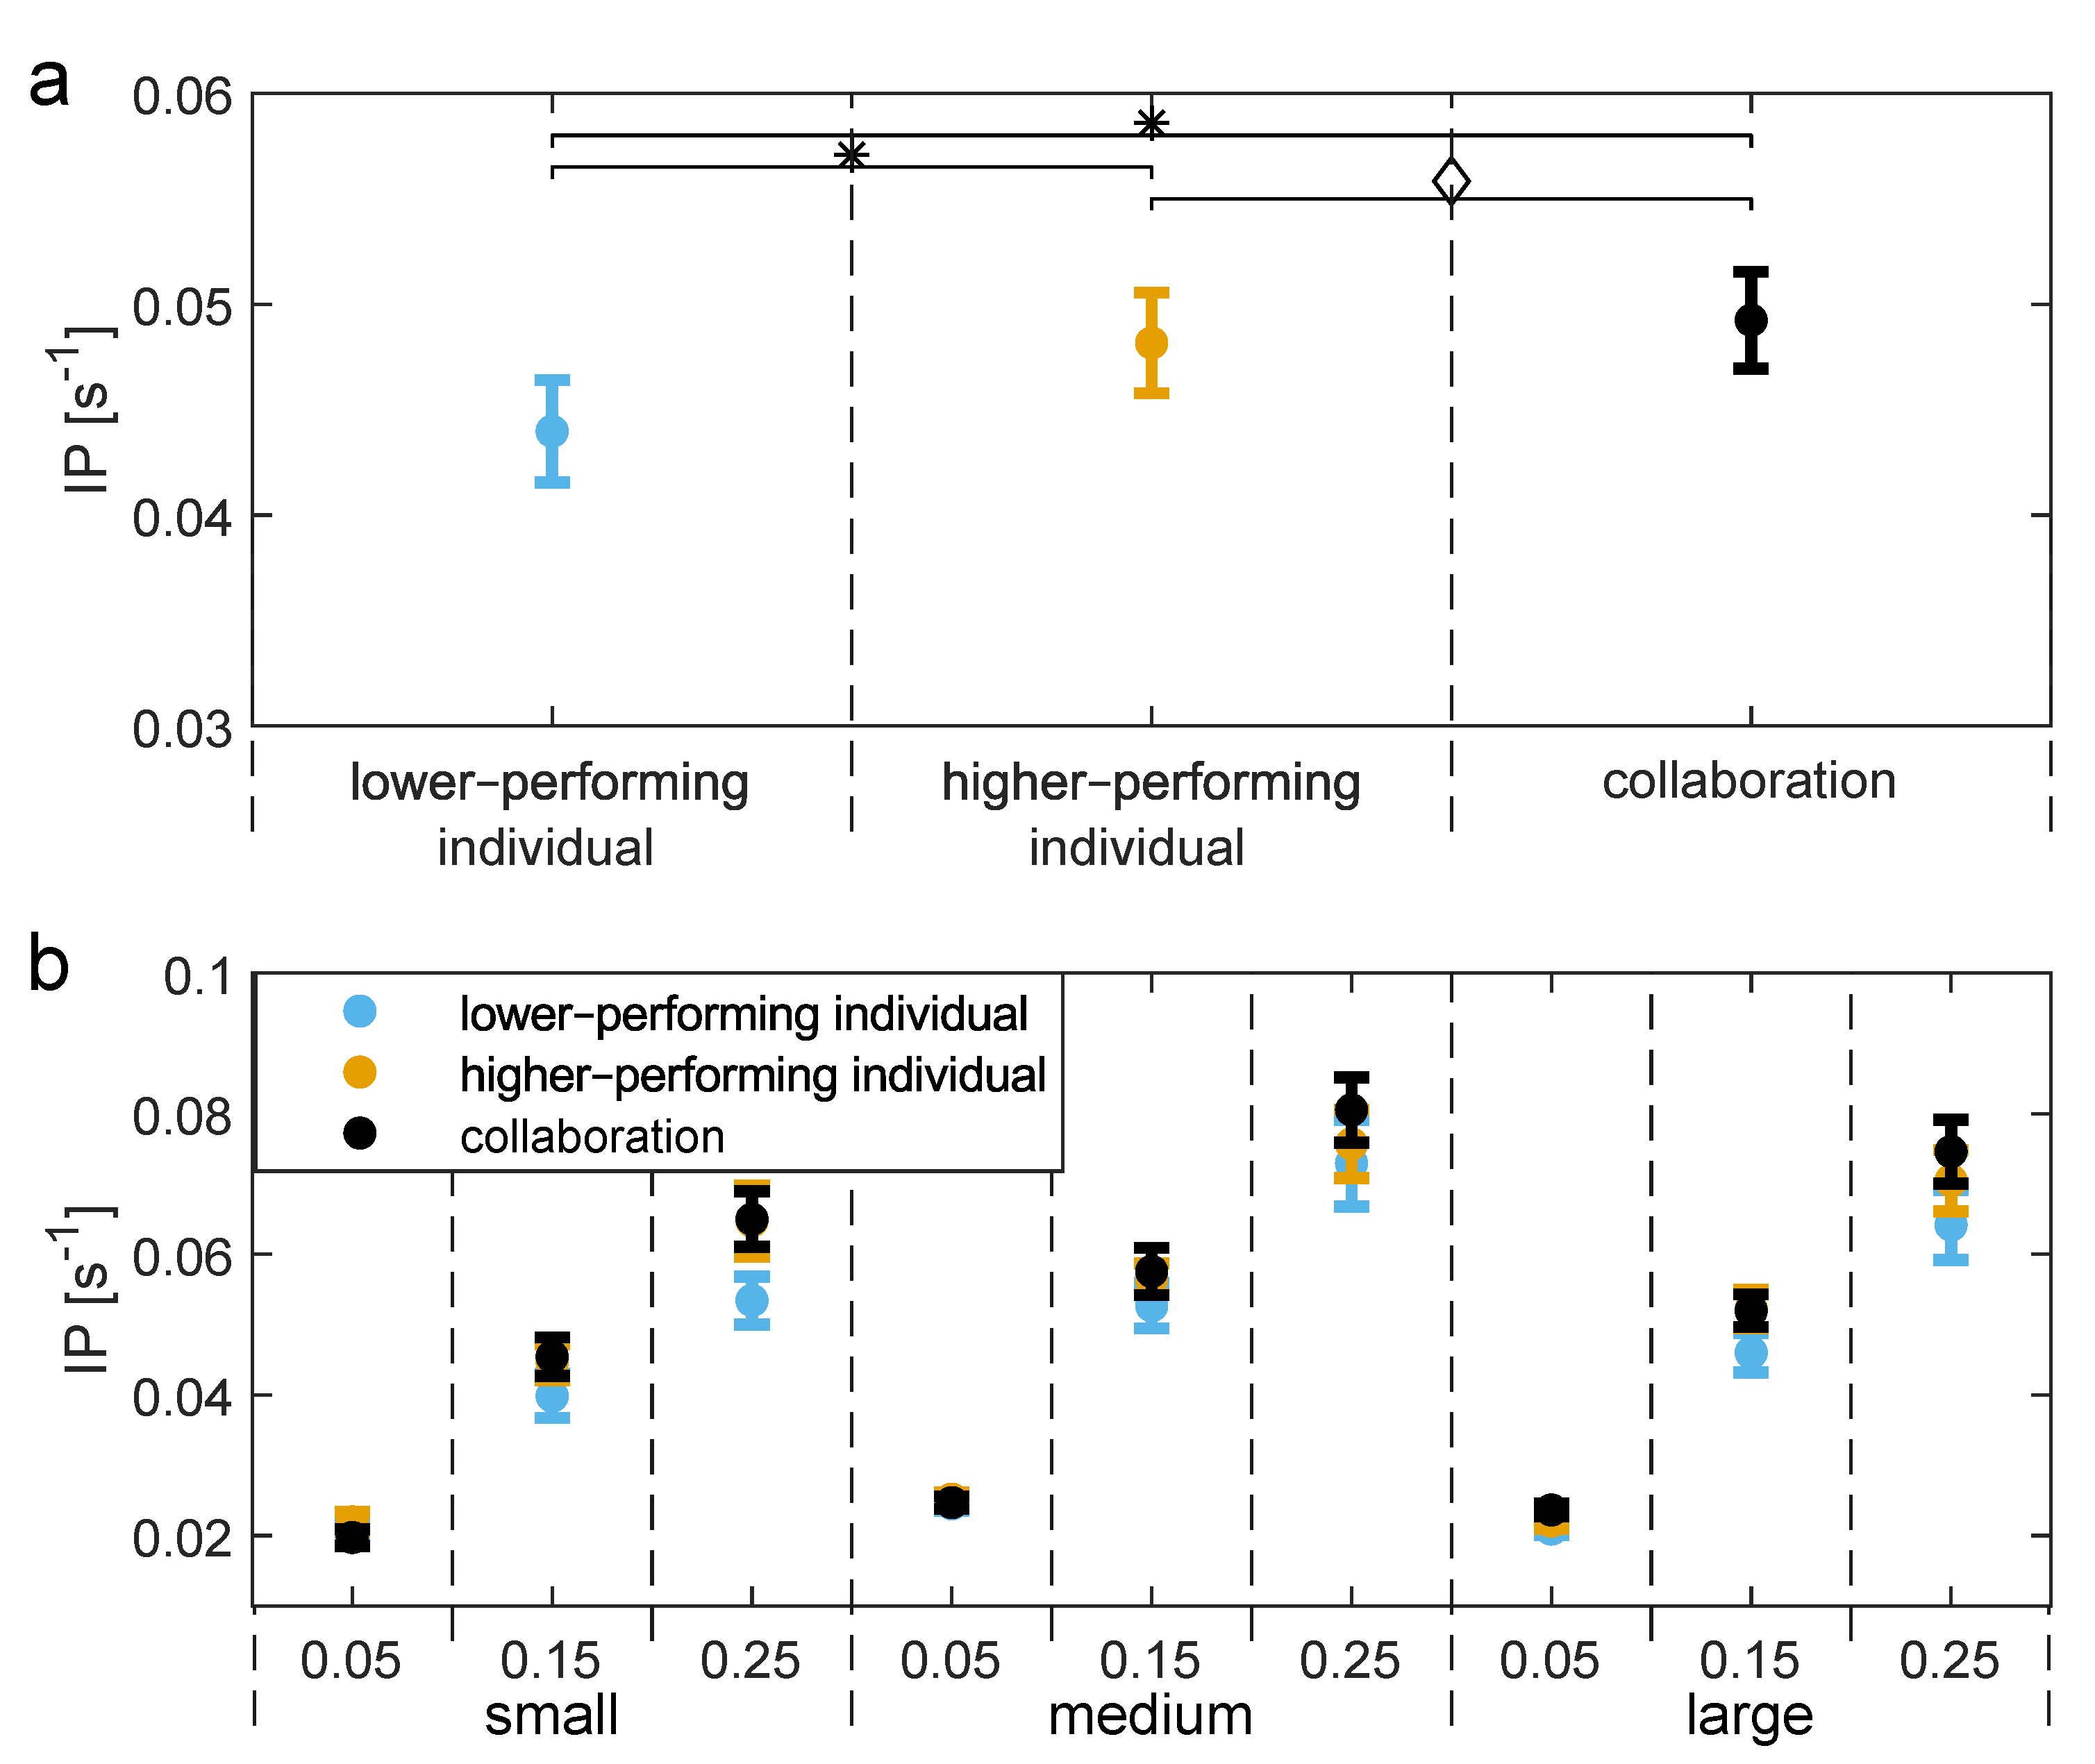
Determining task performance:Figure 5a shows the mean and standard error (SEM) for the overall task performance in different experiment types with a higher value representing better overall task performance. Analysis of variance showed that the experiment type has a significant influence on the overall task performance (
,
). A post hoc t-test showed that the task performance is statistically different between the higher-performing and the lower-performing individual (
,
) as well as between the subject with a lower individual performance and subjects in collaboration (
,
). On the other hand, the task performance between the subject with a higher individual performance and subjects in collaboration is not statistically different.
Analysis of variance showed as well that the target distance and target size have a significant influence on the task performance for lower-performing individuals (size:
,
; distance:
,
; size × distance:
,
), higher-performing individuals (size:
,
; distance:
,
; size × distance:
,
), and subjects in collaboration (size:
,
; distance:
,
; size × distance:
,
). This result is visualised in
Figure 5b, where the mean and standard errors (SEM) of task performance are shown for each target size and distance separately.
4. Discussion
The goal of this study was to observe the leader–follower dynamics in dyadic interactions and to evaluate whether these dynamics can be predicted in a dyad based on the individual performance of the partners. We hypothesised that the influence of each partner is not equally shared, but rather that the subject displaying higher performance in individual tasks influences the collaborative task performance more, thus assuming the leader role in a dyad. Furthermore, we hypothesised that the definition of higher-performing and lower-performing subject in individual tasks will influence how the leader–follower dynamics will be predicted in the collaborative task. Based on [
18] we additionally hypothesised that the performance of subjects will improve when in collaboration compared to their individual performance.
In this study we showed that in each collaboration one partner has more influence on the task performance than the other, meaning that the partner actively assumes the role of a leader. We have also shown that the leader–follower dynamics can be predicted based on the subjects’ individual performance, as the higher performing subject in individual tasks will most likely assume the role of a leader.
Determining the higher-performing and lower-performing subject: When comparing the results from different sorting methods used to define the higher-/lower-performing individuals, we have found that using any of the selected metrics to sort the partners before defining the leader will produce similar results with an increase or decrease in the standard errors of mean (SEM) and the number of dyads that have the same result as the average. The differences in SEM are due to the fact that subjects in some dyad switch their role as the higher-performing or the lower-performing partner based on the sorting method used. These differences show that the definition of the higher- and lower-performing individual is important when trying to predict the leader–follower dynamics in a collaborative task. Due to this, the method used to define the higher- and lower-performing individual should be taken into account when determining the accuracy and reliability of our predictions.
Here, results presented in
Figure 3 suggest that the most reliable metric from the ones used is the maximum velocity in task performance as it has the lowest SEM. The lowest SEM can be explained as the fact that in the haptic interface used in this study and described in [
19], the velocity directly correlates to the amount of force exerted by each individual when performing the task. When an individual with higher maximum velocity performs the task using the proposed haptic interface, they use a larger amount of force than the individual with lower maximum velocity. As the haptic interface is controlled through the use of force, the individual with a larger force exertion will have more influence over the control of the haptic interface, thus assuming the role of leader.
It is worth noting, however, that although maximum velocity was decided as the most reliable metric based on its lowest SEM, other metrics on average also produce the same result—predicting the higher-performing individual as the leader. This can be explained as the selected metrics used to define the higher-/lower-performing individuals are correlated with each other. For instance, IP is directly defined by the measured time, while measured time directly depends on the subject’s velocity. Due to this, we could state that when applied in real-life situations any metric used in this study can be used to define the higher-performing or lower-performing individual and which metric is used should be decided based upon its accessibility rather than its SEM. However, to solidify this statement a larger scale study should be performed to observe whether the differences in results between the metrics increase or decrease on a larger set of examples.
Determining the leader–follower dynamics: As stated previously, the results of this study showed that the subject with higher performance in the individual tasks is most likely to be the leader in a collaborative setting, which agrees with our hypothesis. This might occur due to the subjects not needing to change their actions much between the individual and collaborative tasks. In other words, when coupled together both subjects will use approximately the same amount of force as in the individual trials, meaning that the subject exerting a larger amount of force in the individual task will exert a larger amount of force in the collaborative task as well, thus assuming the role of the leader. This explanation can be further supported by the findings in [
15], where they found that subjects perform collaborative tasks based on pre-programmed motion plans, regardless of their partner.
What is interesting, however, is that ANOVA analysis showed that there is a statistically significant increase in the leading partner’s influence on movement when the size and distance of the target increases, indicating that the leader–follower roles are proportional, rather than being confined to pure leadership. This might be related to the fact that reaching targets that are located closer to the starting point requires less aiming to successfully perform the task and are more based on subjects’ reaction times. However, the correlation between the size of the target and the influence of the leading partner on the overall task manifests as the leader having a greater influence when the size of the target is larger. Knowing both these factors we could hypothesise that the leading individual has the greatest influence on the task performance between the starting section and finishing section of the path, while when reacting and aiming, actions are mutually influenced by both partners. This indicates that the leader–follower roles are not consistent throughout the task, but rather interchange dynamically as was also proposed and demonstrated for human–robot collaboration in [
23,
24]. Here, both studies showed that dynamic exchange of roles improves task performance, however in [
24] the study reported that subjective acceptance in participants has decreased when leader–follower roles were exchanged dynamically. Due to this, in future work leader–follower role distribution in human dyads should be further explored by analysing the tasks in segments to better understand how they occur naturally.
Determining task performance: The results of task performance seen in
Figure 5 correlate to the discoveries presented in [
18], where the results showed that the task performance of both subjects improves in collaborative tasks, while subjects performing a task with a lower-performing partner improve less than subjects performing the same task with a higher-performing partner. This can be expected as in collaboration the forces applied to the controlled point equal to the sum of forces from both individuals; meaning, when both subjects exert approximately the same amount of force in a collaborative task as they did in individual tasks, the force for each subject would increase by the force of their partner, when comparing the individual and collaborative task separately. This in turn leads to shorter task times and better task performance.
Statistical analysis also showed that the task performance is significantly influenced by the size and distance of the target. This matches what we expect with Fitts’ law as Equation (
2) states that the difficulty of each target directly depends on its size and distance, which subsequently affects the calculated index of performance or
IP.
Contributions and future work: Results presented in this study can be seen as beneficial in better understanding of collaborative dynamics that present themselves in human collaboration as well as in the further development of novel robot control models. Implementing dynamics found in human collaboration aids in the further improvement in human–robot collaboration as the human partners find human-like behaviour of robots more intuitive, as shown in [
18,
25]. Furthermore, a study by Ivanova et al. [
26] found that humans prefer a robot partner with human-like behaviour to an actual human partner for motion assistance as they are more predictable than humans. In this regard, many human-based control models have already been developed, such as [
27,
28,
29,
30,
31], however, these did not take into account the leader–follower dynamics found in human collaboration. Instead, in the accounted human-based control models the robot partner always assumes the role of the follower. Implementing the leader–follower role allocation studied in this paper into a robot control model could on the other hand allow the robot partner to assume both the role of a follower and that of a leader when necessary. The importance of role distributions in human–robot collaboration has also been addressed in [
32].
In addition, human-based control models for robots are regularly used in social robotics for effective physical rehabilitation as seen in [
33]. In this regard, the leader–follower role allocation presented in this study can as well be beneficial when incorporated in the design of systems that aid in human skill learning for either human or human–robot dyads. Studies by Kager et al. in [
34] and Avila Mirales et al. in [
35] showed that practising with a peer was more advantageous to the subject than with an expert. Knowing this, the latter study suggested that the results show the possibility of teaching an expert user to be an expert teacher as the expert teacher must learn how to support, instead of explicitly leading the naive user, in order to leave room for the naive user to learn. Having this in mind, the results presented in this paper have the potential to be used for matching best-suited individuals together based on their solo performance to assure effective skill learning. In the same regard the results can be incorporated in the design of a human–robot collaborative system that is able to support the human user in more effective skill learning by adjusting its influence on the task performance. However, to do so, in future work the experiments should be performed so as to be able to observe skill learning of both partners through time. Furthermore, it would be beneficial to examine whether the leader–follower dynamics observed in this study are maintained in new, more complex study cases such as 3D tasks.


