Article

Sustainability Outlook of Thermochemical-Based Second-Generation Biofuel Production: Exergy Assessment

1
Sustainable Innovation Office, Novo Nordisk Foundation Center for Biosustainability, Technical University of Denmark, Kemitorvet 220, 2800 Kgs. Lyngby, Denmark
2
Systems Engineering Program, Universidad de Cartagena, Piedra de Bolívar, Street 30 # 48-152, Cartagena 130000, Colombia
*
Author to whom correspondence should be addressed.
Appl. Sci. 2021, 11(19), 8851; https://doi.org/10.3390/app11198851
Submission received: 11 August 2021 / Revised: 16 September 2021 / Accepted: 21 September 2021 / Published: 23 September 2021
(This article belongs to the Special Issue Pathway Options for Pyrolysis and Gasification of Biomass)

Abstract

:
Since the last century, the idea of replacing traditional fossil sources with renewable alternatives has attracted much attention. As a result, auspicious renewable biofuels, such as biohydrogen or bio-oil, have emerged as suitable options. This study provides some knowledge on combining process design, modeling, and exergy analysis as a united framework to support decision making in energy-based projects. The assessment also included a final evaluation, considering sustainability indicators to evaluate process performance. Feedstock selection is crucial for producing bio-oil and hydrogen for process sustainability; this aspect is discussed, considering second-generation sources. Second-generation bio-oil and biohydrogen production are assessed and compared under the proposed framework. Process simulation was performed using ASPEN PLUS. Exergy analysis was developed using data generated in the process simulation stage, containing material and energy balances, thermodynamic properties, chemical reactions, etc. A mathematical formulation for the exergy analysis shows the exergy of utilities, waste, exergy efficiency, and exergy intensity of both processes, based on the same functional unit (1 kg of product). The sustainability evaluation included quantifying side parameters, such as the renewability index, energy efficiency, or global warming potential. The results indicate that pyrolysis obtained the highest resource exergy efficiency (11%), compared to gasification (3%). The exergy intensity shows that more exergy is consumed in the gasification process (4080.21 MJ/kg) than pyrolysis (18.64 MJ/kg). Similar results are obtained for total irreversibility (327.41 vs. 48.75 MJ/kg) and exergy of wastes (51.34 vs. 18.14 MJ/kg).

1. Introduction

Renewable energy is an attractive alternative to start replacing fossil fuels, making this source more environmentally friendly. Biodiesel, bioethanol, and bio-oil are among the most explored biofuels obtained from different sources. Second-generation biofuels have started attracting more interest to use lignocellulosic material in biofuel production [1]. Most second-generation biofuel production technologies are currently unsustainable at a large scale, because of the lack of technology for the commercial exploitation of waste used as feedstock [2]. Most technologies transforming second-generation sources into biofuels are currently in lower technology readiness levels (TRLs) [3,4]. The combination of process analysis and exergy assessment is helpful to identify hotspots and improve the opportunities of using such biosources [5]. More research is needed to overcome the current limitations of second-generation biofuel production, regarding energy usage and resource intensity. It is worth mentioning that other researchers have explored other sources for fuel generation, such as sewage sludge [6] or plastics [7]. Still, more research is needed, in order to embrace broader perspectives in clean energy and sustainability.
Regarding biofuel production from biomass, feedstock selection is somewhat controversial because of the particular features of second-generation biofuels. Important sustainability aspects, such as efficiency, environmental profile, and financials, must be considered [8]. Henceforward, using process analysis tools to compare the performance of second-generation technologies from different feedstocks become strategic. Biomass such as wood bagasse, leftovers, and others are sources of second-generation bio-oil [9]. These materials are abundant at a meager cost, due to their high availability. Direct combustion is traditionally used to generate energy from biomass conversion. Thermochemical and biochemical pathways produce biofuels and biochemicals [10]. Second-generation biomass composition varies in different ranges. Its typical composition shows glucan within 40–50 wt.%, xylan 20–40 wt.%, and lignin 10–40 wt.% [11]. Pyrolysis is a suitable way of producing second-generation bio-oil and is a promising alternative to replace fossil fuels [12]. This process consists of a furnace or reactor to convert biomass into products, and condensing gases into liquid products [13].
Biohydrogen is a promising biofuel, and it is expected to play a role as a fuel that is clean, friendly with the environment, and energy-intensive. This component is also functional in fuel cells for electricity generation. A significant weakness in its commercial distribution involves its inflated cost [14]. Consequently, research and development activities are needed to increase TRLs for this kind of technology. This can lead to reaching more sustainable biofuel production [15]. Using lignocellulosic materials in hydrogen production can reduce expenditures, while improving the process’s environmental profile. Gasification is an appropriate technology for thermochemically transforming biomass into syngas and biohydrogen. The process adds a water gas shift (WGS) unit to enhance biohydrogen production [16]. Biomass gasification has also been used as an internal unit in a complete methanol production process in a combined scheme [17]. A significant issue in the thermochemical transformation processes (even more for second-generation sources) is their energy-intensity operations [18], making these technologies challenging to scale up and develop for commercial applications.
Computer-aided exergy analysis is a valuable tool to identify process hotpots from the energy viewpoint. Three processes for extracting microalgae oil from Chlorella sp. were examined using exergy analysis [19], and a maximum resource efficiency of 51% was reported, based on hexane extraction. Ojeda-Delgado et al. [20] assessed the energy profile for four ethanol processes through this method. They found that second-generation bioethanol could reach an exergy efficiency of 80% through steam-explosion, saccharification, fermentation and dehydration pathways. Ebrahimi and Ziabasharhag [21] analyzed the energy and exergy aspects of biomass gasification. They presented a new process setting with built-in heat, power, and liquified natural gas cogeneration. Recently, Reyes et al. [22] assessed pyrolysis processes based on different feedstock, in a semi-continuous reactor setting.
In addition to exergy evaluation, sustainability assessment emerges as a valuable tool for improving a process or system at the early design stage. Different methods and approaches are used to accomplish this purpose [23]. Among the reported frameworks, indicator-based methods have shown successful results, while keeping an uncomplex formulation. Ruiz-Mercardo et al. [24] presented a taxonomy for several sustainability indicators, to assess economy, environment, efficiency, and energy areas within a gate-to-gate approach. These scholars continued with this work to extend this methodology by identifying data needs to estimate these indicators. Estimating these indexes involves connecting the mathematical formulas based on data requirements [25]. The GREENSCOPE approach was successfully combined with design principles and computer-aided process engineering to show the advantages of coupling these tools in chemical process sustainability [26]. Exergy performance metrics have also been used in sustainability evaluation, as separate indicators in multiple-indicator analyses [27] and in aggregated approaches [28]. Still, many of these studies have focused on indicator-based analysis, but have not included a comprehensive framework that embodies all the aligned stages from feedstock selection to sustainability evaluation, involving exergy assessment in the process. In addition, there are still missing studies that comprehensibly connect process simulation, analysis, and optimization from a sustainability perspective. The development of such methods could contribute to taking low/mid-TRL second-generation technologies to commercialization levels.
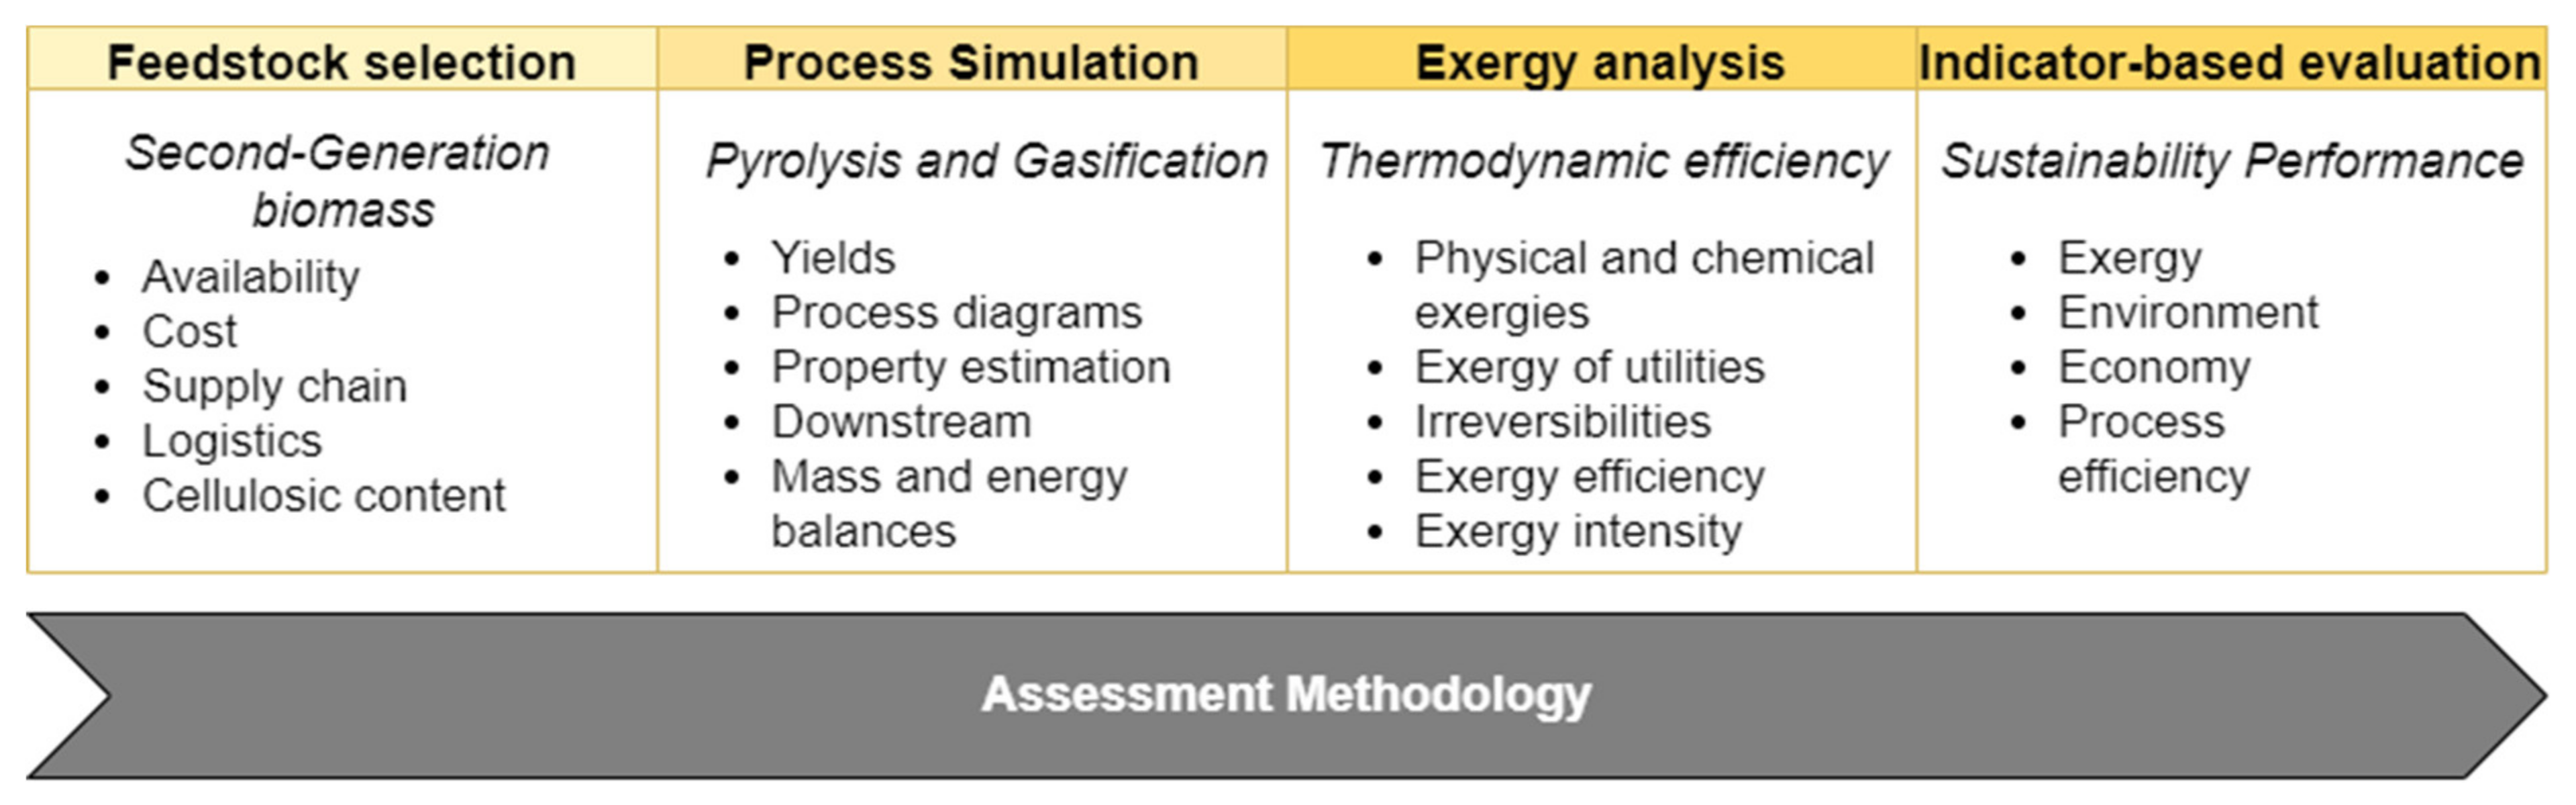
This work is aimed at the current needs of improving thermochemical technologies for second-generation biofuel production, including new know-how in the simultaneous application of process simulation and exergy analysis, to assess the performance of biofuels from lignocellulosic biomass. Besides, the approach enables process simulation and exergy analysis to be used in decision making, to compare thermochemical technologies. This method represents a new way of selecting and optimizing second-generation biofuel technologies that remain at low- to mid-TRL. The assessment is complemented by a further evaluation of sustainability indicators, based on process benchmarks, taking the assessment to the next level. The presented assessment is introduced to respond to the need and lack of comprehensive and straightforward studies for analyzing and improving bio-based processes from a broader sustainability dimension, by including exergy assessment. This approach is presented as a way of including exergy indicators in sustainable development, bringing new knowledge in process analysis for research and development in biomass transformation technologies. This work presented a practical framework that combines feedstock selection, process simulation, exergy analysis, and sustainability evaluation to compare pyrolysis and gasification as promising technologies to produce second-generation biofuels.

2. Materials and Methods

The method proposed in this work combines a feedstock selection task, process simulation of suitable thermochemical technologies (gasification and pyrolysis), and exergy analysis. Figure 1 shows the schematic representation of the proposed method to assess thermochemical-based biomass transformation processes under exergy assessment. This approach can identify energy hotspots and make comparisons between a set of alternatives. The method is also appropriate for low- to mid-TRL technologies since process simulation generates data to assess different systems considering the lack of industry data. The following subsections describe in more detail each step of the proposed methodology.

2.1. Feedstock Selection

An optimum biomass selection for chemical design is fundamental for chemical process sustainability. The principles for selecting feedstock depend on numerous aspects, e.g., availability, transportation, logistics, supply chain, and cellulosic content. Different biomasses have been investigated for industrial production. Food security issues restrict edible biomass as bio-based feedstock, even though these are economical and technically viable in biorefinery design [29]. However, first-generation biomasses are initially discarded.
Lignocellulosic biomass has emerged as a suitable source of biomass, considering its residual origin. Therefore, one can avoid food security issues using this type of biomass. Lignocellulosic biomass refers to agricultural and forestry residues and biowaste streams (e.g., municipal solid waste). These materials are highly available as co-products (even as not-desired ones) from economic activities in productive agricultural chains [30]. There are still some disposal issues associated with these substances. They might result in higher environmental and ecological effects, increased transportation expenditures, and low bulk compactness [31]. Globally, yucca is produced with a projected 60 million tons per year, generating approximately an equal amount of yucca peels and stems (YPS) [32]. Other crop wastes are also widely accessible as by-products of agricultural activities, such as rice straw (RS) and cocoa pod husk (CCH). The banana market is even bigger than yucca, rice, and cocoa, with 116 million tons produced by 2019. EBFB, RS, CCH, and YPS are attractive feedstock considering their high availability in Northern Colombia. The whole production chain for agricultural products also includes land use and harvesting. There are differences between crops in terms of the productivity yield per area of land used for harvesting. This feature becomes a crucial issue since it is more desirable to have high efficiency of this variable, translated into more availability while decreasing environmental burdens to the soil.

2.2. Process Simulation

The first step for simulating a chemical process technology involves designating the task in terms of viable product(s), available raw materials, and adequate processing pathways. Then, these layers are interconnected to generate a flowsheet containing all these elements, showing how the task is accomplished [33]. Finally, the method continues with setting chemical substances/components, thermodynamic model, and equation of state. Besides, this step includes setting production capacity and considering inlet conditions of mass and energy balances, generation and consumption of resources, operating process conditions, such as temperature or pressure, chemical reaction kinetics, fractional yields, and stoichiometry [34].
This work employed ASPEN PLUS® software to model the selected topological pathways based on thermochemical technologies for biomass transformation into biofuels. Aspen Tech (United States) developed this process engineering software and it is the leading tool in process engineering design, analysis, and optimization [35]. Input data are entered into the software to perform simulations. This modeling includes information about chemical substances, property models, mass balances, processing units, and others. However, some components (cellulose, hemicellulose, etc.) are missing in the software. The National Energy Renewable Laboratory (NERL) developed a biomass-based database for to simulate bio-processes in ASPEN PLUS software [36]. Besides, the program included a subroutine in calculating thermodynamic properties, which can be temperature-dependent or scalar. The Gibbs energy of formation, heat capacity, heat formation, or viscosity are estimated. The following assumptions are employed for modeling pyrolysis and gasification processes to produce biofuels (biohydrogen and bio-oil):
  • Steady-state modeling;
  • Solid carbon is used as char;
  • Tar formation is not considered;
  • Biomass was created as a mixture of components (cellulose, hemicellulose, lignin, ash, and acetate);
  • Temperature changes and profiles were not considered in the gasification reaction;
  • Volatile reactions follow stoichiometric equations and reported fractional yields.

2.2.1. Biomass Gasification for Hydrogen Production

The first simulated thermochemical process was gasification for biohydrogen production. This process is performed taking the following four raw materials into account: (i) CS, (ii) RS, (iii) BEFB, and (iv) CCH. These are identified in the process flowsheet simulation diagram (see Figure 2) as streams 1, 2, 3, and 4, respectively. Table 1 reports the chemical composition and mass flow rate of the primary raw materials for the gasification process. In this sense, the total feedstock flow was 52,289.80 kg/h of combined biomasses.
These streams are mixed to follow the dryer unit to reduce the moisture content below 10%. This operation is developed before entering the gasification reactor (RX-1). This process is carried out in the gasifier, which operates at 750 °C and 1 atm. Generally, the products of complete combustion are substances containing nitrogen, water vapor, carbon dioxide, among others. The reaction mechanism in the gasifier involves transforming biomass into coal, and it is transformed into CO and H2 [37]. First, the outlet reactor stream is sent to the cyclone unit (CYC-1) to separate solids and fluids. The gas-phase flow is cooled down in HX-1 to 15 °C. As a result, a large amount of water is condensed. Next, the mainstream is sent to an injector (IY-1) to remove dissolved CO2, in which water is used as the porous medium. Finally, the flow is compressed to 6 bar (CM-1) and sent to a separator (SP-1) to remove water along with the dissolved CO2 [38].
The WGS (RX-2) increased biohydrogen production based on H2 and CO2 formation from CO and H2O. The equilibrium is favorable to the products when the system performs at 205 °C and 32 atm. The reactor was simulated as a Rstoic model in ASPEN PLUS, considering reported thermodynamic parameters and performance of the equilibrium reactions under the described conditions [39]. Due to the formation of CO2 in WGS, this substance is highly mixed in the mainstream with H2 (stream 27). Thus, a filter/membrane (FT-1) was used, which according to Veenstra et al. [40], produces hydrogen with 99% purity operating at 5 bar and 430 °C. It is worth highlighting that this device is operative for up to one year, at which it needs a replacement. In this process, hydrogen is produced with a mass flow rate of 1666.8 kg/h; this traduced into global biomass to product yield of 3.20%. Besides, this process consumed energy with a rate of 4,096,267 MJ/h and a total freshwater supply of 410,360 kg/h.

2.2.2. Biomass Pyrolysis for Bio-Oil Production

Bio-oil is produced from BEFB and CS through the biomass pyrolysis pathway. The raw material is thermally converted through energy-intensive operations involving reactor section and downstream [41]. There is a mass flow of 2600 kg/h and 7800 t/h of CS and BEFB, for a total processing capacity of 10,400 kg/h. This topology produces 3900 kg/h of bio-oil, showing a total yield of 0.38 kg/kg of biomass. Figure 3 shows a flowsheet diagram of the biomass pyrolysis process. BEFB and CS are sent to an initial process handling and conditioning stage (MIX-1). Then, the mixture is heated up and dried to reduce water content below 10%. The steam leaves drying unit (DRY-1). This stage is developed at 110 °C. After this conditioning, biomass is ready to be sent to the pyrolysis reactor. This stage decomposes lignocellulosic biomass at 500 °C. Gases such as H2, CO, CH4 and char are generated in this system [42].
The reaction followed the stoichiometric modeling described by Dussan et al. [43]. It contains the kinetic modeling of the pyrolysis process considering the described conditions. The product stream of the pyrolysis reactor is sent to a complete extraction process, composing a cyclone unit for solid separation (CYC-1). The gas stream contains bio-oil components and persisting impurities. Later, non-pure bio-oil follows additional purification units to reject undesirable components. A separator rejects these remaining impurities. The outlet stream is chilled to 60 °C and subsequently fed into a flash drum (FL-1). A portion of produced bio-oil is extracted at this point. The other portion is recovered by removing unwanted gases in a flash separator (FL-2) at 25 °C.
Graphite content extracted during the cyclone stage is combusted together with ashes and gases. This allows heat to be generated and reduces energy supply. This approach is strategic to improve energy performance and exergetic profile of the process [44]. Sand and compressed air (at 2 atm) are fed together into the combustion reactor. The output stream reaches 1380 °C. This steam is directed to the cyclone unit for an additional solid–gas extraction (SEP-2). Gases leave this unit while the solid stream is cooled to 600 °C. This setting lets the generated energy from this stream to be used in order to decrease energy needs. Finally, the solid stream leaves the system. Product streams of both flash separators are directed to a vessel and cooled at 28 °C, and finally, bio-oil is stored. Final bio-oil contains a significant portion of water (73%), hydrocarbons (26.5%), and gases (0.5%).

2.3. Formulation of Exergy Analysis

Thermodynamics and energy transference principles are fundamental in chemical process design, also applicable to bio-based thermochemical technologies. From an energetic viewpoint, exergy assessment means a methodology to surpass the limitations of the 1st law of thermodynamics to recognize critical energy outflow sources [45]. This feature defines its capacity to screen energy hotpots to improve overall process efficiency. Exergy analysis quantifies chemical process system performance from a thermodynamic perspective. Exergy gives the maximum theoretical useful work (or energy) once a system reaches its thermodynamic equilibrium with the surroundings [46]. Some considerations are considered for performing exergy analysis, and these include the following aspects:
  • Steady-state conditions;
  • Kinetic and potential (energy) exergy flows as neglected;
  • Reference temperature and pressure of 25 °C and 1 atm, respectively.
Table 2 shows governing equations of the exergetic analysis. The exergy balance does not follow the energy/material conservation principle. There is always a loss of exergy connected to unavoidable irreversibilities. These are an estimation of destroyed exergy flows within a chemical process [47].
For ideal gases, the physical exergy flow is determined by (7). Here, heat capacity ( C p ) is considered as a constant. For a solid–liquid mixture, physical exergy is calculated using (7).
Ex ˙ phy = C p T T 0 T 0 C p ln T / T o RlnP / P o
The physical exergy is estimated using ASPEN PLUS. The exergy balance formulation contains all inlet exergy flows by material streams or utilities. The balance is formulated with the following:
E ˙ x in = E ˙ x stream + E ˙ x utilities
E ˙ x in gives the total inlet exergy, E ˙ x stream is the exergy flow of process streams, and E ˙ x utilities represents the exergy of utility. The total outlet exergy embraces products and waste streams produced throughout production. Equation (9) gives the mathematical formula of this variable.
E ˙ x out = E ˙ x product out + E ˙ x residues out
E ˙ x out is the total outlet exergy flow, E ˙ x product out is the summation of product exergy, E ˙ x residues out represents the exergy of waste flows. This formulation of the exergy analysis determines the thermodynamic inefficiencies or irreversibility of a system. It also includes the underuse work and energy efficiency [48].
E ˙ x loss = E ˙ x in E ˙ x product out
E ˙ x loss represents process irreversibilities. The exergy efficiency ( n exergy ) provides the thermodynamic yield of the process. This analysis also considers calculating the influence of each process on the irreversibilities of the process ( %   E ˙ x product out ) .
n exergy = 1 E ˙ x loss / E ˙ x in
%   E ˙ x loss k = E ˙ x loss k / E ˙ x in 100 %
According to the described mathematical structure, the formulation is normalized in a functional unit (1 kg of product). This setting lets a direct comparison be made between different projects with different sizes and settings.

2.4. Sustainability Assessment

The sustainability evaluation is developed considering a multiple-indicator approach to cover more improvement areas towards a more sustainable design. Ruiz-Mercado et al. [49] described a straightforward way to evaluate sustainability by assessing technical indicators. These are defined in four different sustainability areas, including economics, efficiency, environment, and energy. An advantage of this approach is viewed through the evaluation of technical parameters between best and worst targets. The percent score provides a dimensionless scale to evaluate each indicator based on benchmarks and stakeholder’s expectations (see Equation (13)).
Percent score = P i %   = I C I W I B I W × 100 %
I C is the current indicator, I W is the worst target, and I B is the best target. P i % represents the percent score of the indicator. Another feature of this method is its capacity to compare dissimilar systems under the same limits. The practitioner has the freedom to select indicators based on different criteria, such as decision-maker expectations, process nature, or convenience. This study did not consider economic indicators since calculating these parameters involves performing a techno-economic analysis and is beyond this study’s scope. The sustainability evaluation was focused on environmental, efficiency, energy, and exergy indicators. Table 3 shows selected indicators for performing sustainability assessment and their corresponding best and worst targets.

3. Results

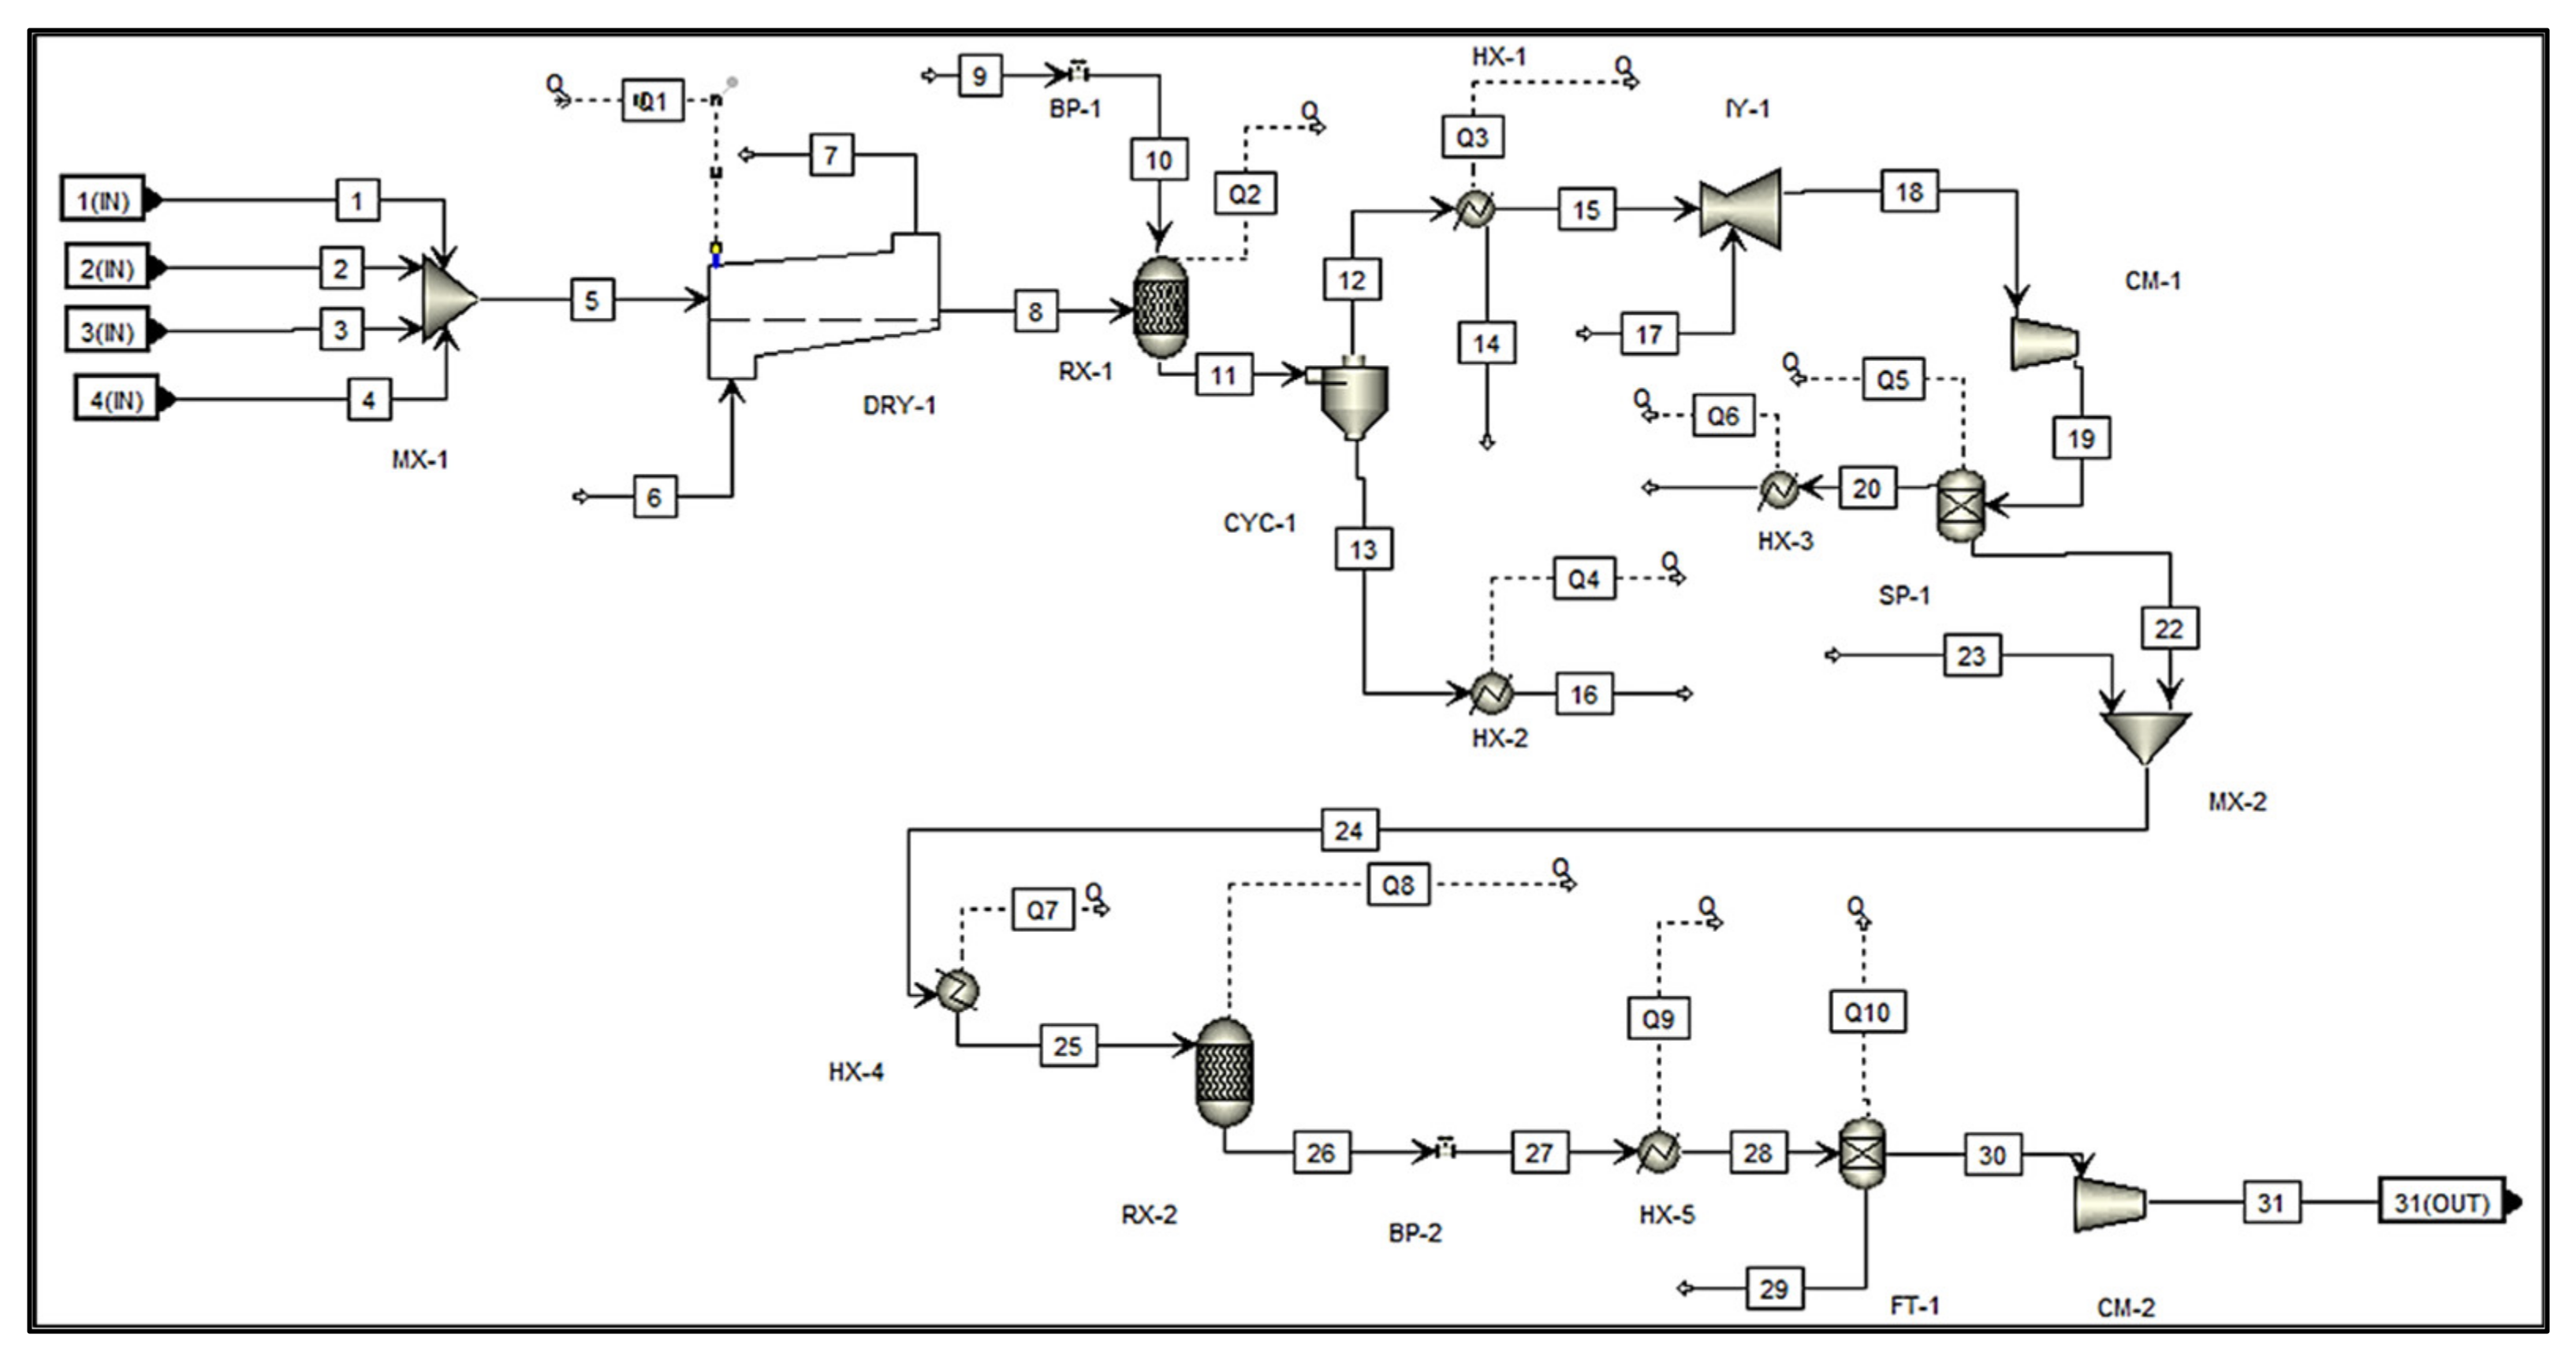
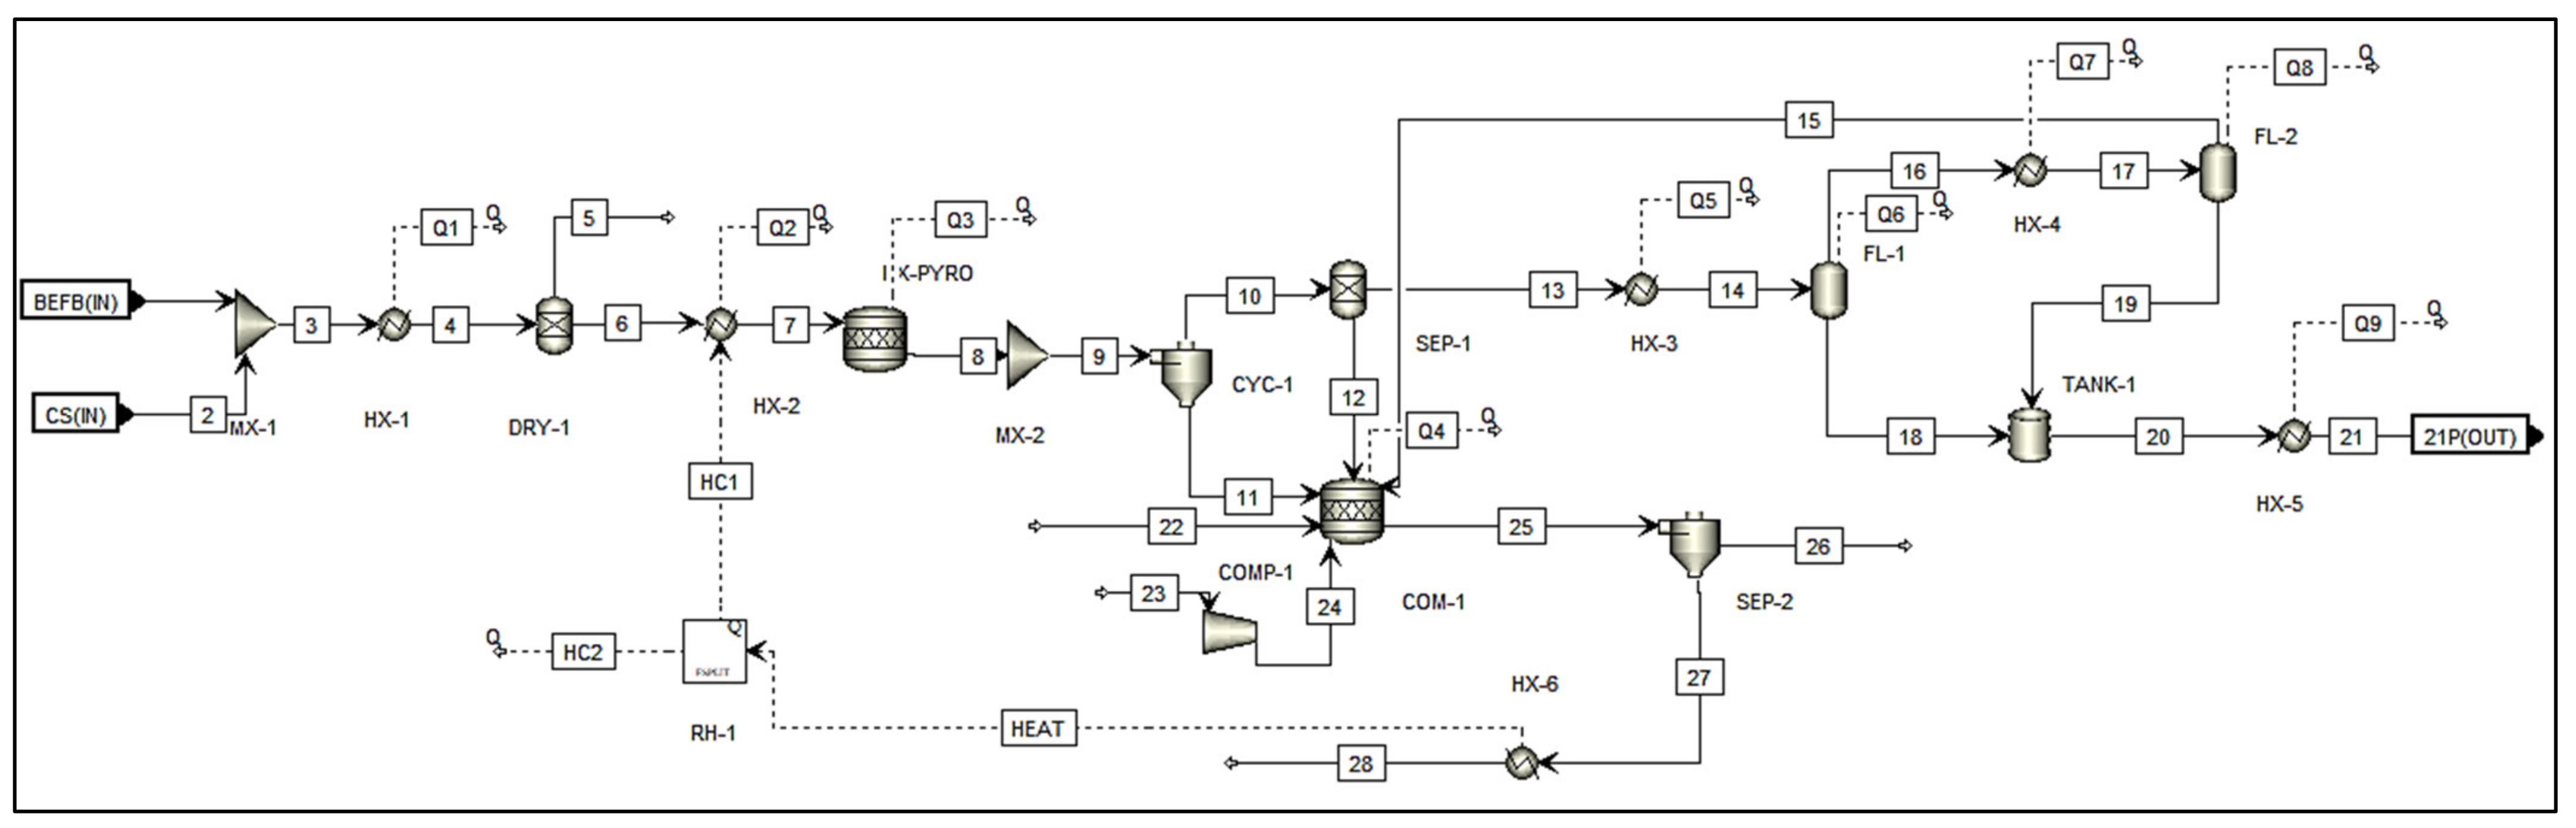
Exergy analysis was performed based on the proposed method. Gasification and pyrolysis processes were assessed under this framework. Chemical and physical exergies were estimated, to obtain the mass exergy of flow streams. Table 4 reports specific chemical exergies for components involved in the simulation of both processes. The total power for gasification was 18 kW/kg of product, with the corresponding exergy of work of 64.79 MJ/kg. The total heat flow for this process was 3696.22 MJ/kg of product (exergy of heat flow: 3538.62 MJ/kg of product). The corresponding exergy of utilities count both work and heat streams, which resulted in a total flow of 3603.42 MJ/h.
Otherwise, the results for the pyrolysis process evidence a better energetic profile, with a total power of 0.77 kW/kg of product and a heat flow of 10.64 MJ/kg of product (exergy of heat flow: 8.87 MJ/kg of product). In summary, the exergy of utilities for this process corresponded to 11.64 MJ/kg of product. This outcome indicates that the heat recovery setting included in the pyrolysis reaction improves its energy efficiency. Table 5 summarizes the exergy results for the gasification and pyrolysis processes.
The results of 
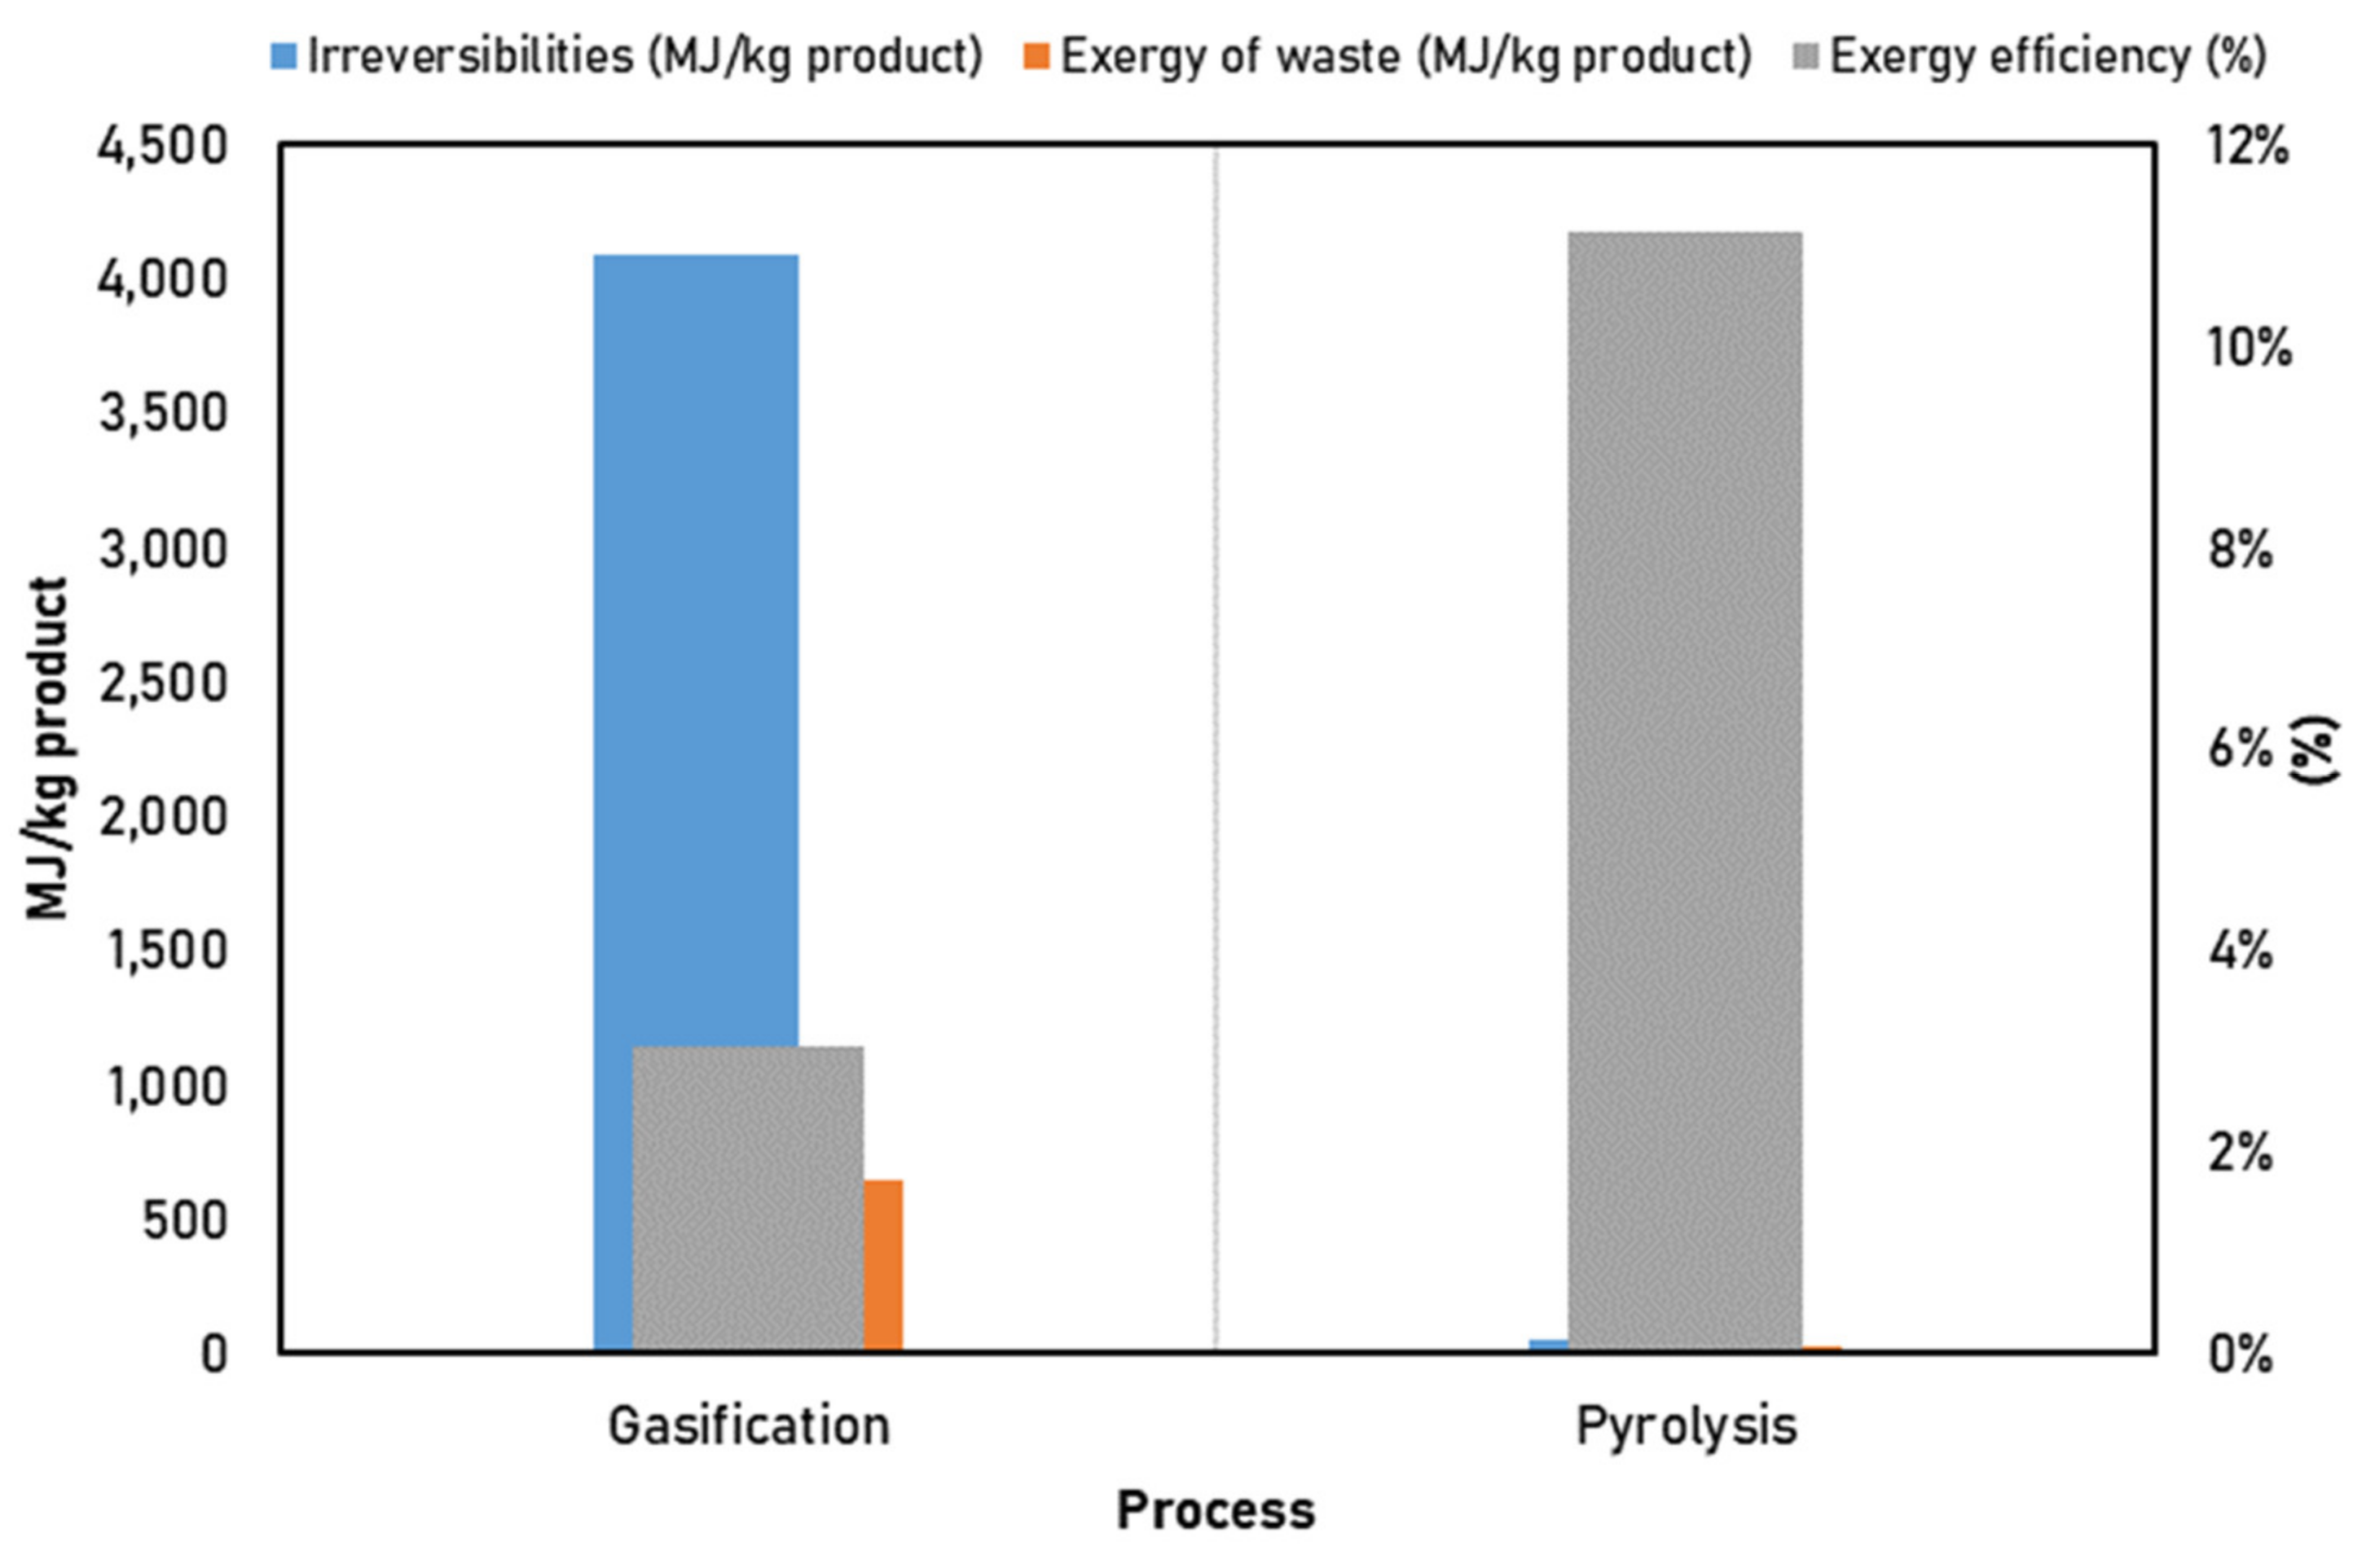
Table 5 show the better exergetic numbers for the pyrolysis process, compared to gasification. A critical aspect of gasification processes is the amount of exergy wasted, due to the high utility requirements. In the case of pyrolysis, this effect is much less, by a long margin. In numbers, this means that gasification consumes 85% of the total inlet exergy. Meanwhile, pyrolysis only uses 21.22% of the total exergy for heat supply requirements. Figure 4 depicts a result comparison between the simulated gasification and pyrolysis processes, based on the proposed exergy analysis.
The sustainability assessment complements the exergy analysis. Process data were used to estimate the performance indicators and their corresponding targets. Air and process water flows were supplied in both processes. These are renewable inputs, the same as biomass feedstock. The total energy consumption for the pyrolysis process was 12.93 MJ/kg of product, and for gasification, this value was 3695.78 MJ/kg of product. The energy usage is much higher in gasification than in pyrolysis. This result somewhat explains the outcomes of the exergy analysis. Another important parameter for evaluating sustainability was the CO2 emissions of each process. The gasification process generates 220.41 kg of CO2/kg of product. In the case of pyrolysis, this quantity corresponds to 2.09 CO2/kg. This outcome is also associated with emissions coming from energy generation, which is more significant for the gasification process. This relation might indicate a better environmental profile of the pyrolysis process. Another evaluated parameter is the energy efficiency (or net energy). This parameter measures energy balance, considering the energy consumed in the system and the energy content in the product. Ideally, it is expected that this value would be at least equal to the unity, reflecting an energy neutral design. High energy-efficient processes would show an energy efficiency >1, while a poor-efficient system would show otherwise [50]. In this sense, the best target (equals to unity) was set to reflect an energy-neutral system, but values higher than this (or 100%) can be expected. Table 6 and Table 7 summarize the targets and current values for the evaluated sustainability indicators.

4. Discussion

The irreversibility flow of the gasification process (4080.21 MJ/kg of product) is much higher than the corresponding value for pyrolysis (48.75 MJ/kg of product). This finding means that the exergy consumption in gasification is almost 84 times higher than pyrolysis. This is a considerable difference; therefore, one can establish that the modeled pyrolysis process is more refined than gasification, from an energy distribution viewpoint. This fact is supported by the obtained exergy efficiency of both processes. However, it is worth mentioning that both processes probably need more refinement, since the obtained exergy efficiencies are rather low (11% vs. 3%).
Another exergetic performance parameter that was evaluated in this study was the resource exergy intensity, which indicates the current flow of exergy needed to complete 1 kg of product production. Gasification obtains an intensity of 4080 MJ/kg of product and pyrolysis obtains 18.64 MJ/kg of product. The results that are consistent with previous exergy outcomes confirm the better energetic profile of the pyrolysis process. Globally, the evaluated thermochemical technologies are expending too much energy to produce biofuel. The ways forward, to improve the current designs, involve including optimization strategies such as heat integration [51], mass integration [52], or combined approaches (e.g., heat-integrated water recycling networks) [53].
The sustainability evaluation delivered interesting results, in terms of a broader perspective (beyond exergy assessment). The results described in Table 6 and Table 7 indicate an overall better performance of the pyrolysis process than gasification. This difference is more significant in the energy and exergy areas than the other ones, with higher performances from the pyrolysis process. 
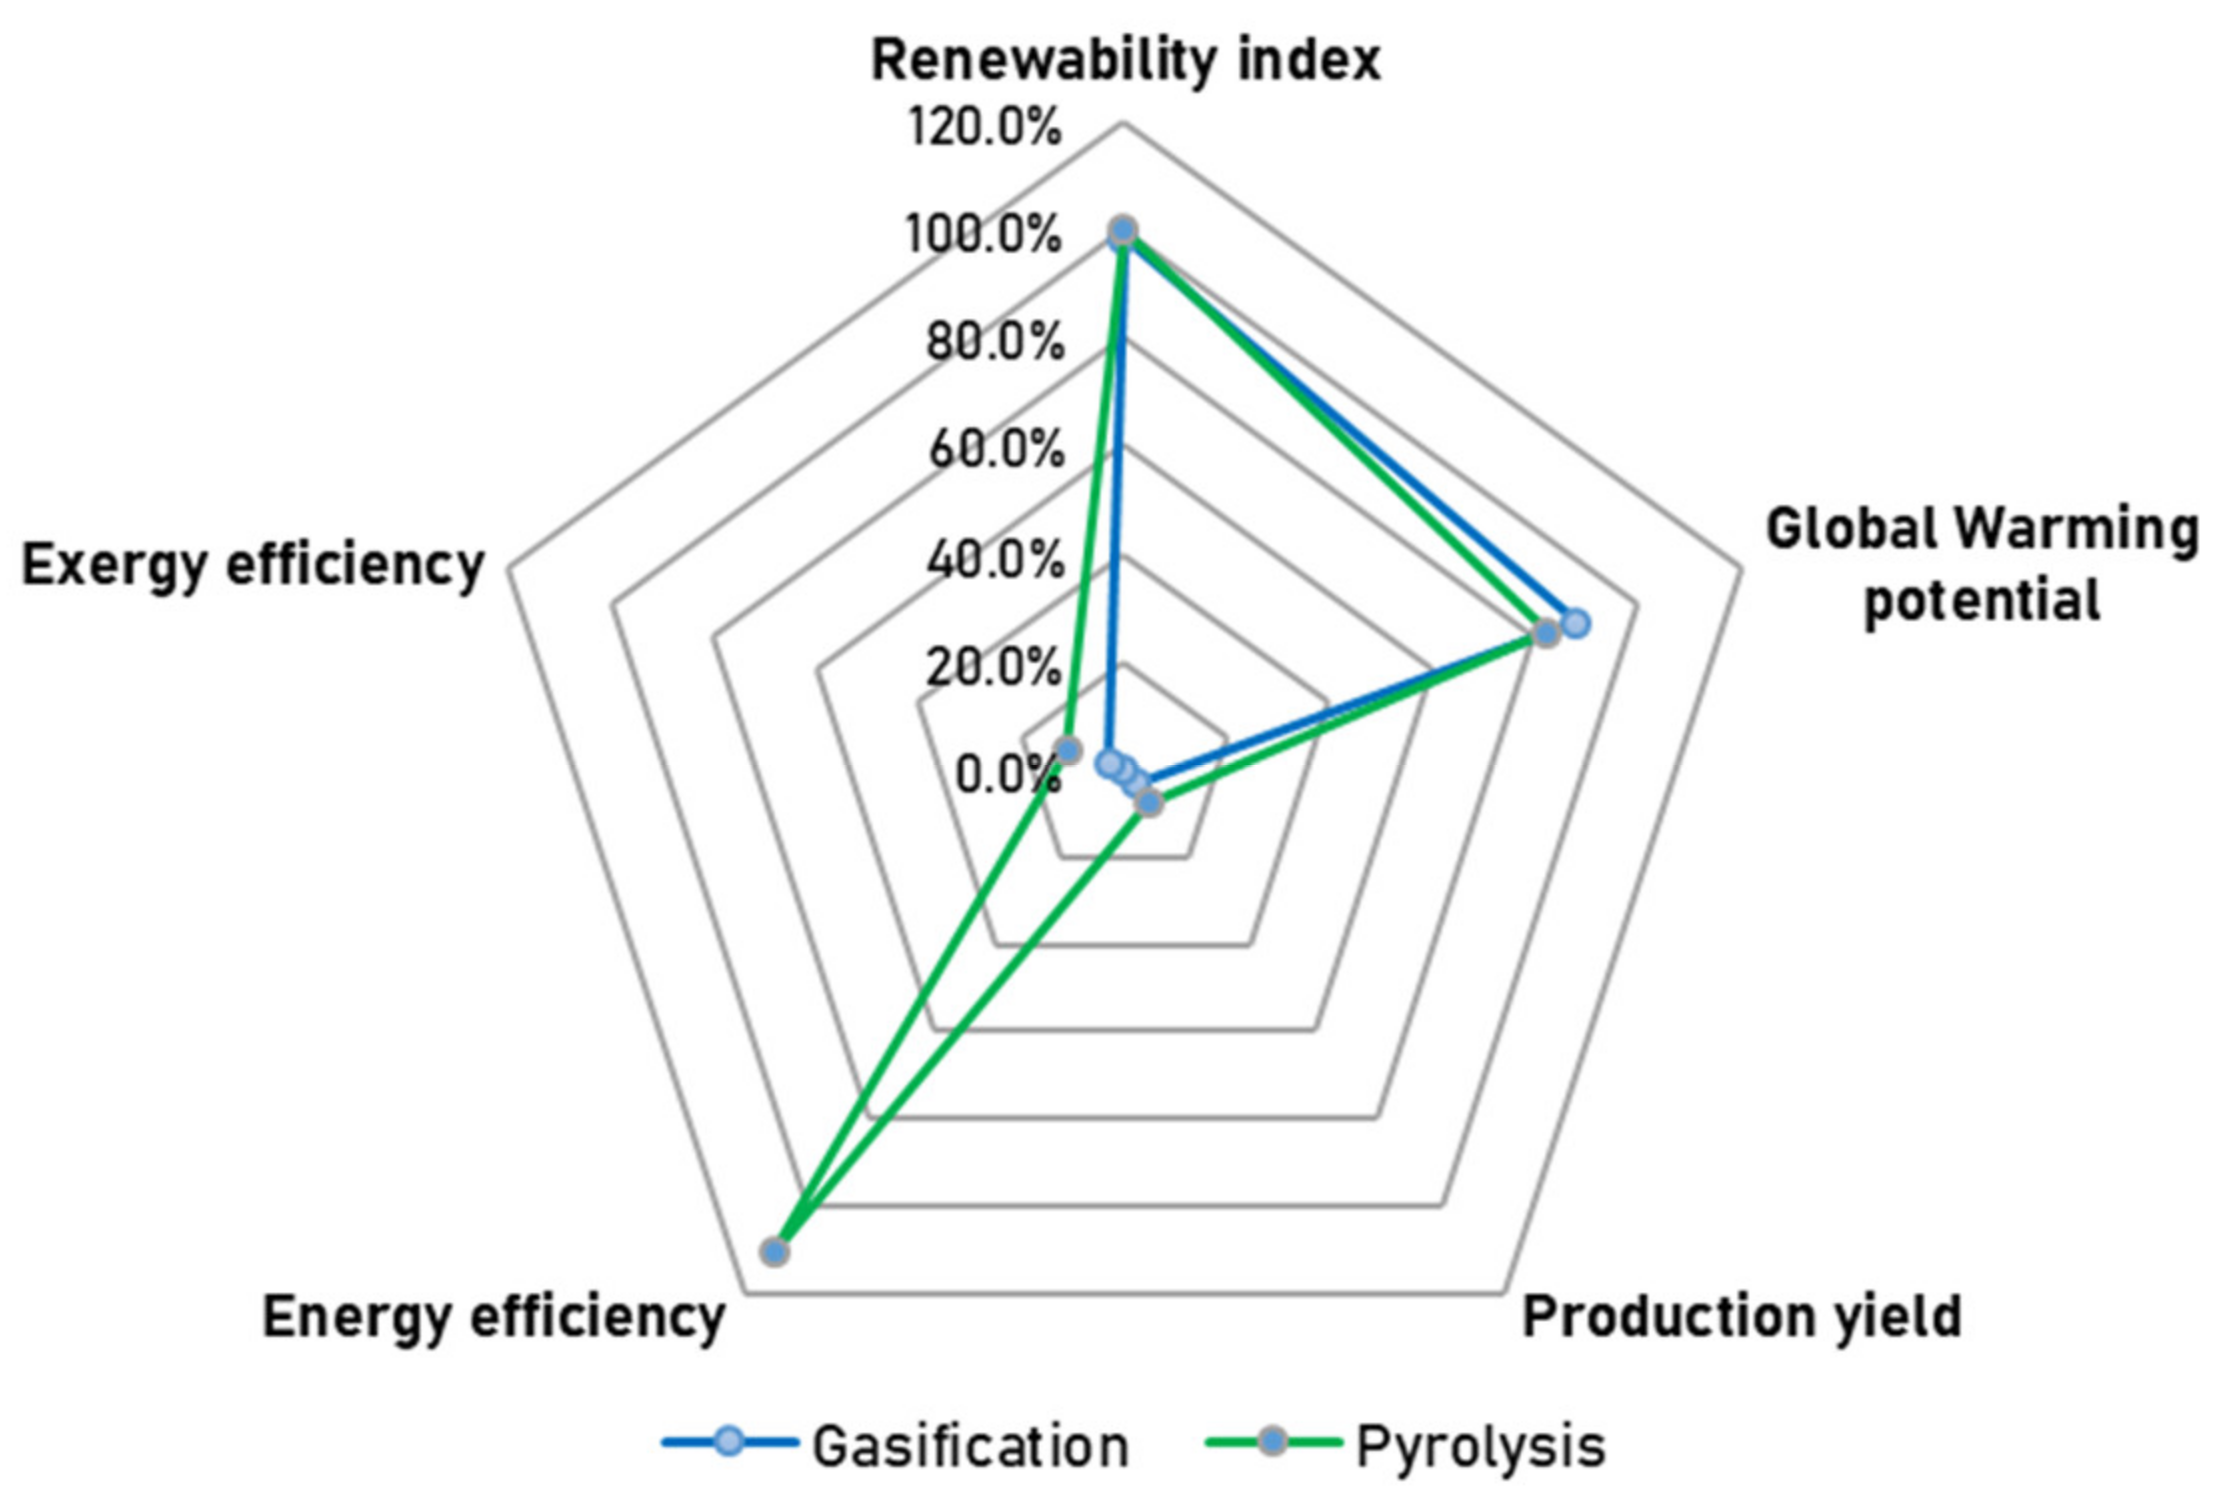
Figure 5 displays a radial chart with percent score results for each indicator, to better illustrate these results.
Globally, there is a parity in terms of renewability and global warming potential quantitative values. This is an expected result, since the nature of these processes is similar, and they use bio-based feedstock (second-generation). Consequently, very high percent scores for the renewability material index were obtained in both cases. Conversely, this is not the case for the energy and exergy efficiency indexes. The results reflected that the gasification process requires significant improvements to reach higher efficiencies that make this process more sustainable. An important fact is that more energy is consumed in the process than is obtained in the product. This is a clear sign that the process is not efficient enough to generate cleaner energy. From these outcomes, the need to include optimization strategies that might lead to a better performance of these technologies is evident. The addition of a water regeneration system and using internal heat streams to meet energy requirements are suitable alternatives to accomplish that goal.

5. Conclusions

This study presents a comprehensive process simulation, exergy analysis, and indicator-based sustainability evaluation to compare pyrolysis and gasification processes, to produce second-generation biofuels. This approach lets energetic and efficient-based hotspots and improvement breaks, from a thermodynamic and sustainability perspective, to be identified. The framework combined feedstock selection, process simulation, exergy analysis, and sustainability assessment to support decision making, research, and development progress, to advance the TRLs of these technologies. This approach was proposed as a straightforward tool for researchers to first screen technologies at early design stages, allowing optimization at low maturity phases. The results revealed that the gasification process is thermodynamically more inefficient than pyrolysis, with a resource exergy efficiency of 3%. Energy consumption and utility requirements seem to be significant drawbacks of the gasification process to reach high exergetic efficiencies. The pyrolysis process delivers a product with a higher energy content than is consumed during its processing, with an efficiency of 110.6%. The sustainability evaluation confirms the results given by the exergy assessment, indicating pyrolysis as a more attractive alternative. However, there is still potential in the gasification process, which can reach higher efficiency levels with some improvements. The ways forward to improve this process might involve using process optimization strategies or developing technological improvements. Regarding the pyrolysis process, even though the simulated setting is more refined than gasification, some improvements are still needed to make this process energy friendly. Future works might include intensification strategies and integration methods, such as heat, mass, or property integration, to achieve the most suitable topologies, in terms of energy and global sustainability.

Author Contributions

Conceptualization, S.M. and P.P.; methodology, S.M. and P.P.; software, J.R.; validation, J.R. and P.P.; resources, J.R.; programming; S.M.; writing, S.M.; review and editing, S.M., P.P. and J.R.; supervision, P.P. and J.R.; project administration, J.R.; funding acquisition, J.R. All authors have read and agreed to the published version of the manuscript.

Funding

This research and the APC were funded through the strengthening and sustainability plan for research groups of the Universidad de Cartagena.

Institutional Review Board Statement

Not applicable.

Informed Consent Statement

Not applicable.

Data Availability Statement

Not applicable.

Acknowledgments

The authors want to thank the Universidad de Cartagena and the Novo Nordisk Foundation Center for Biosustainability for their support in developing this research.

Conflicts of Interest

The authors declare no conflict of interest.

References

  1. Smith, A.L.; Klenk, N.; Wood, S.; Hewitt, N.; Henriques, I.; Yan, N.; Bazely, D. Second generation biofuels and bioinvasions: An evaluation of invasive risks and policy responses in the United States and Canada. Renew. Sustain. Energy Rev. 2013, 27, 30–42. [Google Scholar] [CrossRef]
  2. Rawat, I.; Kumar, R.R.; Mutanda, T.; Bux, F. Biodiesel from microalgae: A critical evaluation from laboratory to large scale production. Appl. Energy 2013, 103, 444–467. [Google Scholar] [CrossRef]
  3. Ögmundarson, Ó.; Herrgård, M.J.; Forster, J.; Hauschild, M.Z.; Fantke, P. Addressing environmental sustainability of biochemicals. Nat. Sustain. 2020, 3, 167–174. [Google Scholar] [CrossRef]
  4. Fernandez-Dacosta, C.; Wassenaar, P.N.; Dencic, I.; Zijp, M.C.; Morao, A.; Heugens, E.H.; Shen, L. Can we assess innovative bio-based chemicals in their early development stage? A comparison between early-stage and life cycle assessments. J. Clean. Prod. 2019, 230, 137–149. [Google Scholar] [CrossRef]
  5. Tabatabaei, M.; Tohidfar, M.; Jouzani, G.S.; Safarnejad, M.; Pazouki, M. Biodiesel production from genetically engineered microalgae: Future of bioenergy in Iran. Renew. Sustain. Energy Rev. 2011, 15, 1918–1927. [Google Scholar] [CrossRef]
  6. Zaharioiu, A.; Bucura, F.; Ionete, E.I.; Ionete, R.E.; Ebrasu, D.; Sandru, C.; Marin, F.; Oancea, S.; Niculescu, V.; Miricioiu, M.G.; et al. Thermochemical decomposition of sewage sludge-An eco-friendly solution for a sustainable energy future by using wastes. Rev. Chim. 2020, 71, 171–181. [Google Scholar] [CrossRef]
  7. Constantinescu, M.; Bucura, F.; Ionete, E.I.; Ion-Ebrasu, D.; Sandru, C.; Zaharioiu, A.; Marin, F.; Miricioiu, M.; Niculescu, V.; Oancea, S.; et al. From plastic to fuel-New challenges. Mater. Plast. 2019, 56, 721–729. [Google Scholar] [CrossRef]
  8. Sikdar, S. Measures for sustainability. Clean Technol. Environ. Policy 2020, 22, 279–280. [Google Scholar] [CrossRef] [Green Version]
  9. Sauvanaud, L.; Mathieu, Y.; Corma, A.; Humphreys, L.; Rowlands, W.; Maschmeyer, T. Co-processing of lignocellulosic biocrude with petroleum gas oils. Appl. Catal. A Gen. 2018, 551, 139–145. [Google Scholar] [CrossRef]
  10. Dhyani, V.; Bhaskar, T. A comprehensive review on the pyrolysis of lignocellulosic biomass. Renew. Energy 2018, 129, 695–716. [Google Scholar] [CrossRef]
  11. Wang, J.; Shen, B.; Kang, D.; Yuan, P.; Wu, C. Investigate the interactions between biomass components during pyrolysis using in-situ DRIFTS and TGA. Chem. Eng. Sci. 2018, 195, 767–776. [Google Scholar] [CrossRef]
  12. Salema, A.A.; Ting, R.M.W.; Shang, Y.K. Pyrolysis of blend (oil palm biomass and sawdust) biomass using TG-MS. Bioresour. Technol. 2019, 274, 439–446. [Google Scholar] [CrossRef] [PubMed]
  13. Papari, S.; Hawboldt, K. A review on condensing system for biomass pyrolysis process. Fuel Process. Technol. 2018, 180, 1–13. [Google Scholar] [CrossRef]
  14. Ahmed, U.; Zahid, U.; Onaizi, S.A.; Jameel, A.G.A.; Ahmad, N.; Ahmad, N.; AlMohamadi, H. Co-production of hydrogen and methanol using fuel mix systems: Technical and economic assessment. Appl. Sci. 2021, 11, 6577. [Google Scholar] [CrossRef]
  15. Reyes, L.; Abdelouahed, L.; Mohabeer, C.; Buvat, J.-C.; Taouk, B. Energetic and exergetic study of the pyrolysis of lignocellulosic biomasses, cellulose, hemicellulose and lignin. Energy Convers. Manag. 2021, 244, 114459. [Google Scholar] [CrossRef]
  16. Cheng, C.L.; Lo, Y.C.; Lee, K.S.; Lee, D.J.; Lin, C.Y.; Chang, J.S. Biohydrogen production from lignocellulosic feedstock. Bioresour. Technol. 2011, 102, 8514–8523. [Google Scholar] [CrossRef] [PubMed]
  17. Marcantonio, V.; de Falco, M.; Capocelli, M.; Bocci, E.; Colantoni, A.; Villarini, M. Process analysis of hydrogen production from biomass gasification in fluidized bed reactor with different separation systems. Int. J. Hydrogen Energy 2019, 44, 10350–10360. [Google Scholar] [CrossRef]
  18. Puig-Gamero, M.; Argudo-Santamaria, J.; Valverde, J.L.; Sánchez, P.; Sanchez-Silva, L. Three integrated process simulation using aspen plus®: Pine gasification, syngas cleaning and methanol synthesis. Energy Convers. Manag. 2018, 177, 416–427. [Google Scholar] [CrossRef]
  19. Chen, W.H.; Farooq, W.; Shahbaz, M.; Naqvi, S.R.; Ali, I.; Al-Ansari, T.; Amin, N.A.S. Current status of biohydrogen production from lignocellulosic biomass, technical challenges and commercial potential through pyrolysis process. Energy 2021, 226, 120433. [Google Scholar] [CrossRef]
  20. Peralta-Ruiz, Y.; González-Delgado, A.D.; Kafarov, V. Evaluation of alternatives for microalgae oil extraction based on exergy analysis. Appl. Energy 2013, 101, 226–236. [Google Scholar] [CrossRef]
  21. Ojeda, K.; Sanchez, E.; Kafarov, V. Sustainable ethanol production from lignocellulosic biomass-Application of exergy analysis. Energy 2011, 36, 2119–2128. [Google Scholar] [CrossRef]
  22. Ebrahimi, A.; Ziabasharhagh, M. Energy and exergy analyses of a novel integrated process configuration for tri-generation heat, power and liquefied natural gas based on biomass gasification. Energy Convers. Manag. 2020, 209, 112624. [Google Scholar] [CrossRef]
  23. Huang, A.; Badurdeen, F. Metrics-based approach to evaluate sustainable manufacturing performance at the production line and plant levels. J. Clean. Prod. 2018, 192, 462–476. [Google Scholar] [CrossRef]
  24. Ruiz-Mercado, G.J.; Smith, R.L.; Gonzalez, M.A. Sustainability indicators for chemical processes: I. Taxonomy. Ind. Eng. Chem. Res. 2012, 51, 2309–2328. [Google Scholar] [CrossRef]
  25. Ruiz-Mercado, G.J.; Smith, R.L.; Gonzalez, M.A. Sustainability Indicators for Chemical Processes: II. Data Needs. Ind. Eng. Chem. Res. 2012, 51, 2329–2353. [Google Scholar] [CrossRef]
  26. Ruiz-Mercado, G.J.; Carvalho, A.; Cabezas, H. Using green chemistry and engineering principles to design, assess, and retrofit chemical processes for sustainability. ACS Sustain. Chem. Eng. 2016, 4, 6208–6221. [Google Scholar] [CrossRef]
  27. Smith, R.L.; Tan, E.C.D.; Ruiz-Mercado, G.J. Applying Environmental Release Inventories and Indicators to the Evaluation of Chemical Manufacturing Processes in Early Stage Development. ACS Sustain. Chem. Eng. 2019, 7, 10937–10950. [Google Scholar] [CrossRef]
  28. Meramo-Hurtado, S.I.; González-Delgado, Á.D. Aggregate/Weighted Global Sustainability and Exergy Metric for Assessing Emerging Transformation Technologies. ACS Sustain. Chem. Eng. 2020, 8, 16637–16646. [Google Scholar] [CrossRef]
  29. Pandey, G. Challenges and future prospects of agri-nanotechnology for sustainable agriculture in India. Environ. Technol. Innov. 2018, 11, 299–307. [Google Scholar] [CrossRef]
  30. Farmanbordar, S.; Amiri, H.; Karimi, K. Synergy of municipal solid waste co-processing with lignocellulosic waste for improved biobutanol production. Waste Manag. 2020, 118, 45–54. [Google Scholar] [CrossRef]
  31. Sial, T.A.; Khan, M.N.; Lan, Z.; Kumbhar, F.; Ying, Z.; Zhang, J.; Sun, D.; Li, X. Contrasting effects of banana peels waste and its biochar on greenhouse gas emissions and soil biochemical properties. Process Saf. Environ. Prot. 2018, 122, 366–377. [Google Scholar] [CrossRef]
  32. Olukanni, D.O.; Olatunji, T.O. Cassava waste management and biogas generation potential in selected local government areas in Ogun State, Nigeria. Recycling 2018, 3, 58. [Google Scholar] [CrossRef]
  33. Sadhukhan, J.; Ng, K.S.; Hernandez, M.E. Biorefineries and Chemical Processes; John Wiley & Sons: Hoboken, NJ, USA, 2014. [Google Scholar]
  34. Meramo-Hurtado, S.; Moreno-Sader, K.; González-Delgado, Á. Simulation and exergy analysis of TiO2 nanoparticles production via green chemistry. PeerJ 2019, 7, e8113. [Google Scholar] [CrossRef] [Green Version]
  35. Hernández, V.; Romero-García, J.M.; Dávila, J.A.; Castro, E.; Cardona, C.A. Techno-economic and environmental assessment of an olive stone based biorefinery. Resour. Conserv. Recycl. 2014, 92, 145–150. [Google Scholar] [CrossRef]
  36. Wooley, R.J.; Putsche, V. Development of an ASPEN PLUS Physical Property Database for Biofuels Components. Victoria 1996. Available online: https://www.nrel.gov/docs/legosti/old/20685.pdf (accessed on 16 September 2021).
  37. Rajvanshi, A.K. Biomass gasification. Altern. Energy Agric. 2014, II, 1–21. [Google Scholar]
  38. Han, D.; Yang, X.; Yulong, W. Environmental Impact Comparison of Typical and Resource-Efficient Biomass Fast Pyrolysis Systems Based on LCA and Aspen Plus Simulation. J. Clean. Prod. 2019, 231, 254–267. [Google Scholar] [CrossRef]
  39. Meramo-Hurtado, S.I.; Puello, P.; Cabarcas, A. Process analysis of hydrogen production via biomass gasification under computer-aided safety and environmental assessments. ACS Omega 2020, 5, 19667–19681. [Google Scholar] [CrossRef]
  40. Veenstra, P.; Iyer, M.; Nijmeijer, A.; Geuzebroek, F.; Moene, R.; Saukaitis, J. Integrated Approach to CO 2 Capture: Fuel gas decarbonisation. Energy Procedia 2014, 63, 2054–2059. [Google Scholar] [CrossRef] [Green Version]
  41. Soysa, R.; Choi, S.K.; Jeong, Y.W.; Kim, S.J.; Choi, Y.S. Pyrolysis of Douglas fir and coffee ground and product biocrude-oil characteristics. J. Anal. Appl. Pyrolysis 2015, 115, 51–56. [Google Scholar] [CrossRef]
  42. Moreno-Sader, K.; Meramo-Hurtado, S.I.; González-Delgado, A.D. Computer-aided environmental and exergy analysis as decision-making tools for selecting bio-oil feedstocks. Renew. Sustain. Energy Rev. 2019, 112, 42–57. [Google Scholar] [CrossRef]
  43. Dussan, K.; Dooley, S.; Monaghan, R. Integrating compositional features in model compounds for a kinetic mechanism of hemicellulose pyrolysis. Chem. Eng. J. 2017, 328, 943–961. [Google Scholar] [CrossRef]
  44. Ryu, J.; Kong, L.; de Lima, A.E.P.; Maravelias, C.T. A generalized superstructure-based framework for process synthesis. Comput. Chem. Eng. 2020, 133, 106653. [Google Scholar] [CrossRef]
  45. Wang, J.J.; Yang, K.; Xu, Z.L.; Fu, C. Energy and exergy analyses of an integrated CCHP system with biomass air gasification. Appl. Energy 2015, 142, 317–327. [Google Scholar] [CrossRef]
  46. González, A.M.; Lora, E.E.S.; Palacio, J.C.E. Syngas production from oil sludge gasification and its potential use in power generation systems: An energy and exergy analysis. Energy 2019, 169, 1175–1190. [Google Scholar] [CrossRef]
  47. Abusoglu, A.; Kanoglu, M. Exergetic and thermoeconomic analyses of diesel engine powered cogeneration: Part 1-Formulations. Appl. Therm. Eng. 2009, 29, 234–241. [Google Scholar] [CrossRef]
  48. Wang, L.; Yang, Z.; Sharma, S.; Mian, A.; Lin, T.-E.; Tsatsaronis, G.; Maréchal, F.; Yang, Y. A review of evaluation, optimization and synthesis of energy systems: Methodology and application to thermal power plants. Energies 2019, 12, 73. [Google Scholar] [CrossRef] [Green Version]
  49. Smith, R.L.; Ruiz-Mercado, G.J.; Gonzalez, M.A. Using GREENSCOPE indicators for sustainable computer-aided process evaluation and design. Comput. Chem. Eng. 2015, 81, 272–277. [Google Scholar] [CrossRef]
  50. Cano, A.; Arévalo, P.; Jurado, F. Energy analysis and techno-economic assessment of a hybrid PV/HKT/BAT system using biomass gasifier: Cuenca-Ecuador case study. Energy 2020, 202, 117727. [Google Scholar] [CrossRef]
  51. Ong, B.H.Y.; Walmsley, T.G.; Atkins, M.J.; Walmsley, M.R.W. Total site mass, heat and power integration using process integration and process graph. J. Clean. Prod. 2017, 167, 32–43. [Google Scholar] [CrossRef]
  52. Hamad, A.; Aidan, A.; Douboni, M. Cost-effective wastewater treatment and recycling in mini-plants using mass integration. Clean Technol. Environ. Policy 2003, 4, 246–256. [Google Scholar] [CrossRef]
  53. Chin, H.H.; Foo, D.C.Y.; Lam, H.L. Simultaneous water and energy integration with isothermal and non-isothermal mixing–A P-graph approach. Resour. Conserv. Recycl. 2019, 149, 687–713. [Google Scholar] [CrossRef]
Figure 1. Assessment methodology used in this work.
Applsci 11 08851 g001
Figure 2. Process flowsheet diagram of the gasification process.
Applsci 11 08851 g002
Figure 3. Process flowsheet diagram of the pyrolysis process.
Applsci 11 08851 g003
Figure 4. Exergy results of pyrolysis and gasification processes.
Applsci 11 08851 g004
Figure 5. Radial chart of percent score for sustainability indicators.
Applsci 11 08851 g005
Table 1. Chemical composition and mass flow rate of raw materials in the gasification process.
BiomassMass Flow (kg/h)Cellulose (%wt.)Hemicellulose (%wt.)Xylan (%wt.)
CS25,742.200.290.200.13
RS19,242.200.290.250.18
BEFB7001.800.420.130.12
CCH303.600.280.290.12
Table 2. Governing equations of exergy analysis.
EquationsFormulaDescription
Exergy balance
Ex ˙ loss = Ex ˙ mass + Ex ˙ heat + Ex ˙ work
Ex ˙ loss is exergy loss, Ex ˙ mass mass exergy, Ex ˙ heat heat exergy, Ex ˙ work work exergy
Heat exergy
Ex ˙ heat = 1 T o / T Q ˙
T o is reference temperature, T stream temperature, Q ˙ heat flow
Exergy of work
Ex ˙ work = W ˙
W ˙ system work
Mass exergy
Ex ˙ mass = Ex ˙ phy + Ex ˙ che
Ex ˙ phy physical exergy, Ex ˙ che chemical exergy
Chemical exergy
Ex ˙ ch i = Δ G f i 0 + v j Ex ch j 0
Ex ˙ ch j chemical exergy of element j , v j number of atoms, Δ G f i 0 Gibss energy, Ex ˙ ch i estimated chemical exergy
Physical exergy
Ex ˙ phy = H H 0 T 0 S S 0
Ex ˙ phy physical exergy H enthalpy, H 0 enthalpy at reference conditions, S entropy, S 0 entropy at reference conditions
Table 3. Selected sustainability indicators and their best and worst values.
AreaIndicatorFormulaWorstBest
EnvironmentRenewability index R I = Renewable inputs Total inputs 01
Global warming potential GWP = Total CO 2 eq. Mass of product All waste0
EfficiencyProduction yield y = Mass of product Feedstock input 01
EnergyEnergy efficiency η E = Energy content of product Total input energy 01
ExergyExergy efficiency η energy = Exergy of product Total input exergy 01
Table 4. Chemical exergy of active components.
ComponentsChemical Exergy (kJ/kg)
Acetaldehyde51,402.00
Acetate15,120.00
Acetic Acid15,120.00
Acetone46,229.00
Acrylic acid39,382.00
Ash1965.00
Carbon34.16
Carbon dioxide433.87
Carbon monoxide9807.40
Ethylene79,735.00
Formaldehyde40,195.00
Furfural24,341.00
Glucan20,996.00
Hydrogen118,095.00
Lignin28,123.00
Methane106,199.00
Nitrogen25.71
Nitrogen25.71
Oxygen124.06
Silicon Dioxide2.20
Water50.00
Xylan21,395.00
Table 5. Exergy analysis results for gasification and pyrolysis processes.
Process Ex ˙ mass Ex ˙ in Ex ˙ out Ex ˙ loss Ex ˙ waste
Gasification604.234207.65127.454080.20639.76
Pyrolysis43.2154.856.0948.7518.14
Table 6. Summary of targets, current value, and percent score of sustainability indicators.
Indicator (Gasification)BestWorstCurrentPercent Score
Renewability index100.98498.4%
Global warming potential03,120,980 kg CO2367,380 kg CO288.2%
Production yield100.0323.2%
Energy efficiency100.0030.3%
Exergy efficiency103%3.0%
Table 7. Summary of targets, current value, and percent score of sustainability indicators.
Indicator (Gasification)BestWorstCurrentPercent Score
Renewability index101100.0%
Global warming potential046,479.2 kg CO28138 kg CO282.5%
Production yield100.0777.7%
Energy efficiency101.106110.6%
Exergy efficiency1011%11.1%
Publisher’s Note: MDPI stays neutral with regard to jurisdictional claims in published maps and institutional affiliations.

