Article

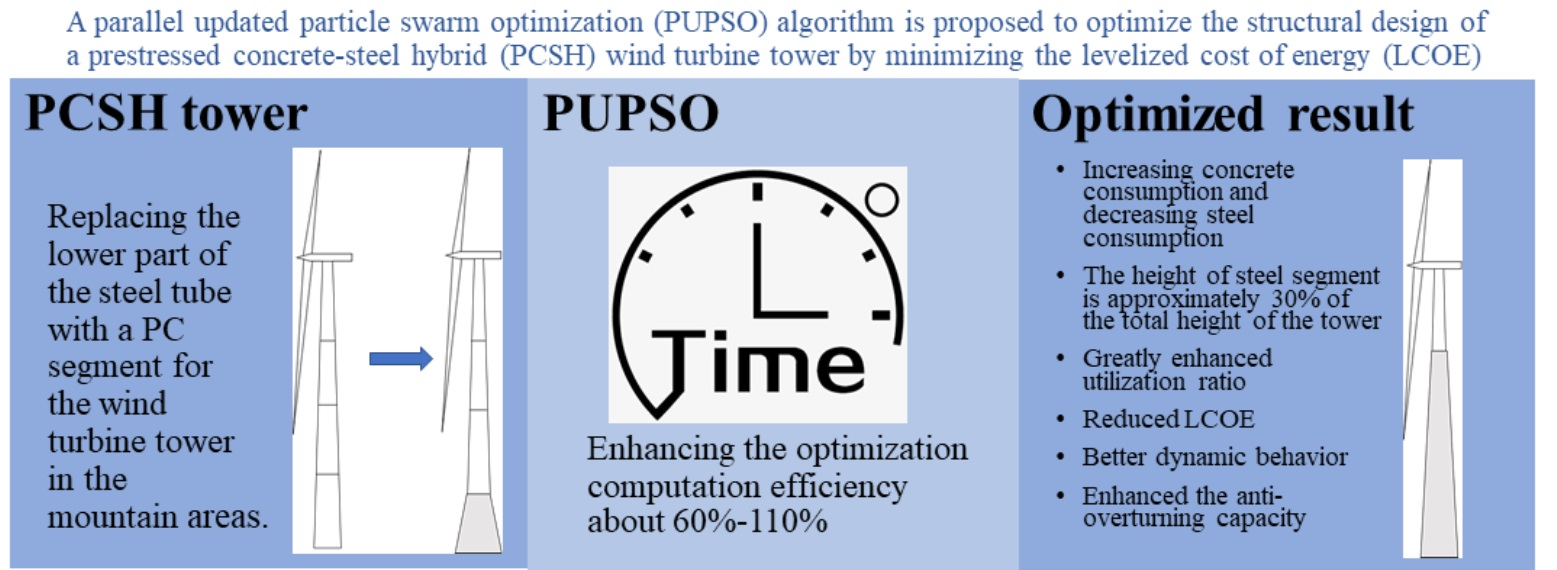
Hybrid Wind Turbine Towers Optimization with a Parallel Updated Particle Swarm Algorithm

1
College of Civil Engineering, Hunan University, Changsha 410082, China
2
School of Civil and Resource Engineering, University of Science and Technology Beijing, Beijing 100083, China
3
College of Civil Engineering, Huaqiao University, Xiamen 361021, China
4
Key Laboratory for Intelligent Infrastructure and Monitoring of Fujian Province, Huaqiao University, Xiamen 361021, China
5
Department of Civil Engineering, Meijo University, Nagoya 468-8502, Japan
*
Author to whom correspondence should be addressed.
Appl. Sci. 2021, 11(18), 8683; https://doi.org/10.3390/app11188683
Submission received: 14 August 2021 / Revised: 9 September 2021 / Accepted: 12 September 2021 / Published: 17 September 2021
(This article belongs to the Topic Artificial Intelligence (AI) Applied in Civil Engineering)

Abstract

:
The prestressed concrete–steel hybrid (PCSH) wind turbine tower, characterized by replacing the lower part of the traditional full-height steel tube wind turbine tower with a prestressed concrete (PC) segment, provides a potential alterative solution to transport difficulties and risks associated with traditional steel towers in mountainous areas. This paper proposes an optimization approach with a parallel updated particle swarm optimization (PUPSO) algorithm which aims at minimizing the objective function of the levelized cost of energy (LCOE) of the PCSH wind turbine towers in a life cycle perspective which represents the direct investments, labor costs, machinery costs, and the maintenance costs. Based on the constraints required by relevant specifications and industry standards, the geometry of a PCSH wind turbine tower for a 2 MW wind turbine is optimized using the proposed approach. The dimensions of the PCSH wind turbine tower are treated as optimization variables in the PUPSO algorithm. Results show that the optimized PCSH wind turbine tower can be an economic alternative for wind farms with lower LCOE requirements. In addition, compared with the traditional particle swarm optimization (PSO) algorithm and UPSO algorithm, the proposed PUPSO algorithm can enhance the optimization computation efficiency by about 60–110%.

Graphical Abstract

1. Introduction

The wind turbine tower, as the structure supporting the wind turbine, represents a highly significant component of wind turbine systems and accounts for approximately 30% of the overall investment in onshore installations [1]. With the increase in unit power capacity of wind turbines, the heights of wind turbine towers have increased for the purpose of capturing wind energy efficiently, as wind profiles are strong and steady at higher elevations [2,3,4]. In recent years, wind turbine towers with a height of over 100 m have been widely employed in practice alongside increasing investment [5]. Many wind farms have been developed or are under construction in mountainous areas in the mainland of China after decades of wind farm development in plain areas. The transportation of segmental steel tubes and long blades to the top of mountains is a challenging task with risks. Moreover, the construction of temporary transportation roads with large turning radii in mountains leads to additional investment and environmental destruction [6]. The traditional steel-tubular wind turbine tower systems are typical soft supporting systems, and it is hard to meet the stiffness requirements of large capacity wind turbines due to the limitation of steel-tube diameter transportation.
In recent years, the prestressed concrete–steel hybrid (PCSH) wind turbine tower has been proposed to overcome the difficulty of transportation and the limitation of the structural mechanical behavior of traditional steel tubular towers. Compared with the full-height steel tubular tower, the PCSH wind turbine tower results in a lower center of gravity and higher flexural stiffness. The use of concrete leads to a lower sensitivity to fluctuations in steel prices [2]. Moreover, by replacing parts of the steel tubular segments with prestressed concrete (PC), the total cost of the PCSH tower system can be decreased while the design–servicing life of PC is much longer than steel. This leads to reasonable life-cycle cost savings and decreases in the levelized cost of energy (LCOE) in a life-cycle perspective. The development of the PCSH wind turbine tower has received great attention in recent years. Singh [7] investigated concrete construction for wind energy towers and highlighted the advantages of concrete as the major construction material for wind turbine towers. Seidel [8] compared a steel and concrete hybrid tower with a steel tower and concluded that hybrid towers are an effective alternative to traditional steel towers, can be built at nearly every site, and help overcome transportation issues caused by mountains or other terrains.
The optimization algorithm plays key roles in realizing the economical results that withstand the most demanding functional requirements arising during their service life [9]. Hani et al. [10] proposed and tested five different optimization strategies for a 100 kW wind turbine system considering the natural frequencies as the most representative objective function. Uys et al. [11] used optimization to calculate the least cost of a steel wind turbine tower that meets the structural demands and emphasized the influence of ring stiffeners. Nicholson et al. [12,13] redesigned wind turbine towers with a generalized reduced gradient (GRG) method and analyzed how individual design variables affected the objective function of a hybrid wind turbine tower. Employing the genetic algorithm (GA), Ma et al. [14] optimized a 100 m PC tower system for a 5 MW wind turbine and discussed the advantages of a PC wind turbine tower. Oest et al. [15] explored three different state-of-the-art analytical gradient-based optimization approaches to minimize the mass of a jacket structure for wind turbines considering fatigue and frequency constraints and provided insight into critical structural and modeling parameters. Adopting GA, Chen et al. [16] suggested that the optimal height of the concrete segment should be 80.5 m for one 120 m PCSH wind turbine tower. The safety factors of the tower are improved and the total construction cost can be reduced by about 20% after optimization. However, the optimization result is easily stuck at locally optimal values and the material utilization ratio of the optimization result is comparatively low. Different from the direct investment or construction cost for a wind turbine system investigated in the above studies, it is more important to minimize its LCOE in a life-cycle perspective, which is treated as the objective function for geometry optimization for PCSH wind turbine towers in this study.
Particle swarm optimization (PSO) has proven to be a powerful method for optimization problems [17]. Adopting PSO, Poitras et al. [18] investigated the optimum floor configuration by minimizing the total mass or cost while satisfying all design criteria. Ye et al. [19] conducted a comprehensive investigation on cold-formed steel beam designs using PSO techniques. Luo et al. [20] proposed a computational approach based on PSO to obtain the lower bound of the buckling load of shell structures with geometric imperfections. Based on a PSO algorithm, Xu et al. [21] optimized the active control strategy for machinery-equipment-induced structural vibrations. Tsiptsis et al. [22] carried out structural optimization employing isogeometric tools in PSO for a two-dimensional truss or a frame tower. Farias et al. [23] introduced a new hybrid algorithm based on PSO and GA to find optimal fiber orientation of stiffened laminated composite panels to reach their maximum buckling load. Kaveh and Eslamlou optimized a series of usual-size skeletal structures by transplanting a harmony search-based mechanism to particle swarm optimization with an aging leader and challengers (HALC-PSO) and multistage particle swarm optimization (MSPSO) and obtained satisfactory results [24].
In this paper, in order to enhance the computation efficiency for the geometry optimization of the PCSH wind turbine towers, a parallel updated PSO (PUPSO) method is proposed to optimally design a PCSH wind turbine tower subjected to both wind and seismic excitations, considering the constraints of load-carrying capacity, fatigue, stability, natural frequency, and maximum top displacement. It employs the LCOE as the objective function. The proposed approach is used to optimally design a 2 MW PCSH wind turbine tower with a design height of 77.5 m as an alternative to the traditional steel tubular tower. The optimal result is evaluated by utilization ratio of the tower. Results show that the PUPSO algorithm efficiently optimizes the PCSH wind turbine towers when compared with the traditional particle swarm optimization (PSO) algorithm and the LCOE of the optimized PCSH wind turbine significantly decreases when compared with the benchmark wind turbine tower. The height of the steel segment of the optimized PUPSO tower is recommended to be 30% of total height of the PCSH wind turbine tower. Compared with the original PCSH tower, the increased utilization rates of both PC and steel segments illustrate the effectiveness of the PUPSO algorithm. Moreover, the fundamental natural frequency of the optimized PCSH wind turbine tower increases significantly when compared with that of the original wind turbine tower.

2. Effects of Wind and Earthquake Excitations on Wind Turbine Tower

Under normal operation, wind power generation systems are subjected to wind loads and are also affected by earthquakes in seismically active areas over their service life. These effects are of importance to the performance, durability, and safety of wind turbine towers. In this study, the PCSH wind turbine tower is geometrically optimized with the consideration of both wind and earthquake loads. The effects of both wind and earthquakes on the PCSH wind tower system are discussed in the following sections.

2.1. Wind Load Applied to the PCSH Wind Turbine Towers

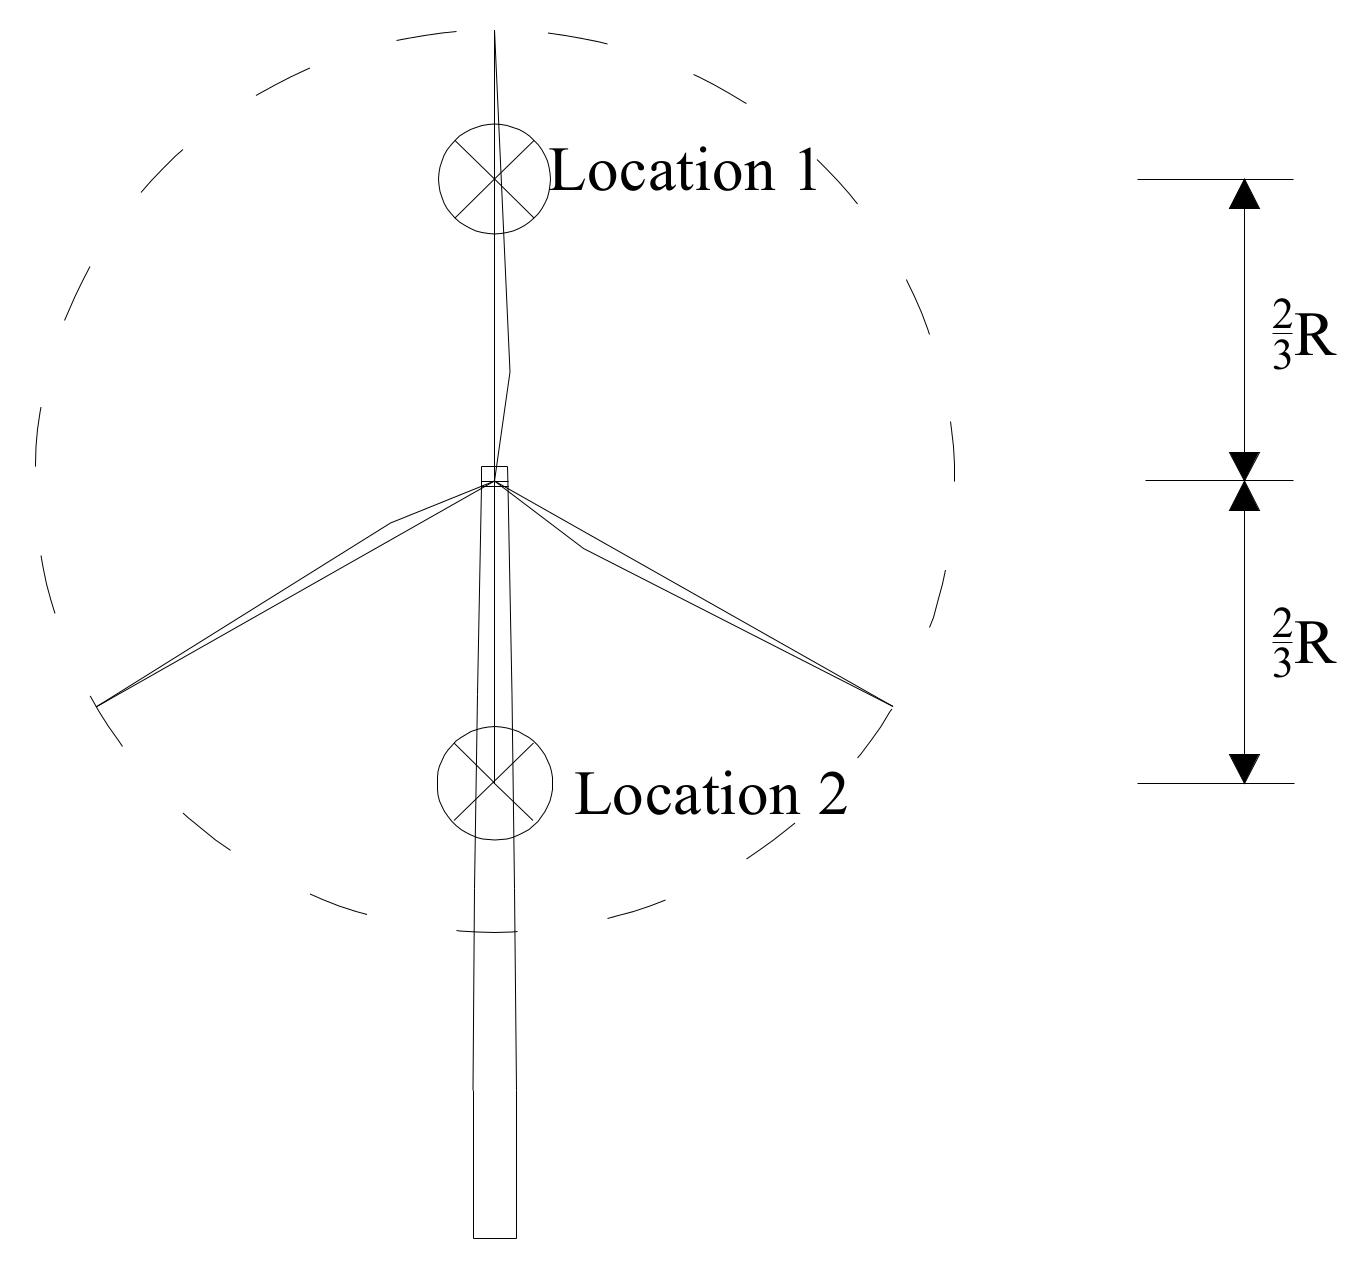
2.1.1. Aerodynamic Load Determination

Due to differences in wind pressure, the aerodynamic wind load applied on the top of a wind turbine tower is usually calculated under four different working conditions, including the annual average wind speed, nominal wind speed, cut-out wind speed, and extreme wind speed [25]. The aerodynamic load can be determined by the following equations [26,27]:
F 1 = C p ρ V a 2 π R 2
F 2 = C p ρ V n 2 π R 2
F 3 = 0.4 C p ρ V c 2 π R 2
F 4 = 0.5 C t ρ V e 2 A
ρ = 0.00125 e 0.0001 z 3
where
F 1 is the wind load under the annual average wind speed, C p is the wind energy utilization coefficient which can take the value of 4/9 for an ideal wind turbine but 0.4 is chosen for the PCSH wind turbine tower in this study, ρ is the density of air, V a is the annual average wind speed, R is the impeller radius of the wind turbine, F 2 is the wind load applied to the turbine under the nominal wind speed, V n is the nominal wind speed, F 3 is the wind load under the cut-out wind speed, V c is the cut-out wind speed, F 4 is the wind load under the strongest wind speed in 50 years, the drag coefficient C t = 1.6 , V e is the extreme wind speed, A is the projection of the blades in the plane perpendicular to the direction of the wind, and z is the height.

2.1.2. Pitching Moment

The pitching moment, M P , caused by inhomogeneity in the wind speed can be calculated by the following Equation (6) [13]:
M P = 4 27 ρ B π R 3 V 1 2 V 2 2
where B is the number of blades and V 1 and V 2 are the wind speeds at locations 1 and 2, respectively, as illustrated in Figure 1.

2.1.3. Deflecting Torque

The deflecting torque on the wind turbine tower is mainly caused by the generator impeller. The equation for deflecting torque T can be simplified as [27]:
T = 0.23 ρ V c 2 π R 2 e h
where e h is the horizontal distance between the center of the hub and the center of the tower.

2.2. Wind Load Acting on the Tower

According to the load code for the design of building structure GB50009-2012 [28], the characteristic value of the wind load can be calculated with the following equations:
ω k = β z μ s μ z ω 0
β z = 1 + 2 g f I 10 B z 1 + R f 2
R f = π 6 ζ 1 x 1 2 1 + x 1 2 4 / 3
x 1 = 30 f 1 k w ω 0
B z = k f r H a 1 ρ x ρ z ϕ 1 z μ z
ρ z = 10 H + 60 e H / 60 60 H
where ω 0 is the basic wind speed at a height of 10 m, β z is the wind-induced vibration factor, μ s is the wind load shape coefficient and μ z is the wind pressure height coefficient, g f   equals to 2.5, I 10 is the nominal turbulence intensity, B z is background component of fluctuating wind load, R f is the resonance component of the fluctuating wind load, ζ 1 is the damping ratio and is equal to 0.03 in this paper, f 1 is the first-order natural frequency, k w is the surface roughness correction coefficient and is equal to 1.0 in this paper, H is the height of the tower, ρ x is the horizontal correlation coefficient and equals 1.0 due to the small width of the windward side of the tower, ρ z is the vertical correlation coefficient, and the k f r , a 1 , ϕ 1 z can be determined according to GB 50009-2012 [28].
The lateral static force is applied along the height of the tower as a distributed load. The force of the tower section at height i owing to the wind can be calculated as [28]:
F i = ω k A i
where F i is the wind force of the tower section at height i and A i is the wind pressure area of the section.

2.3. Additional Bending Moment

The additional bending moment, M e , at the top of the wind turbine tower can be calculated according to Equation (10):
M e = m e g e e
where g is the acceleration of gravity, m e is the weight of the equipment at the top of the tower, including the blades, nacelle, hub, etc., and e e is the distance between the center of the equipment and the center of the tower.

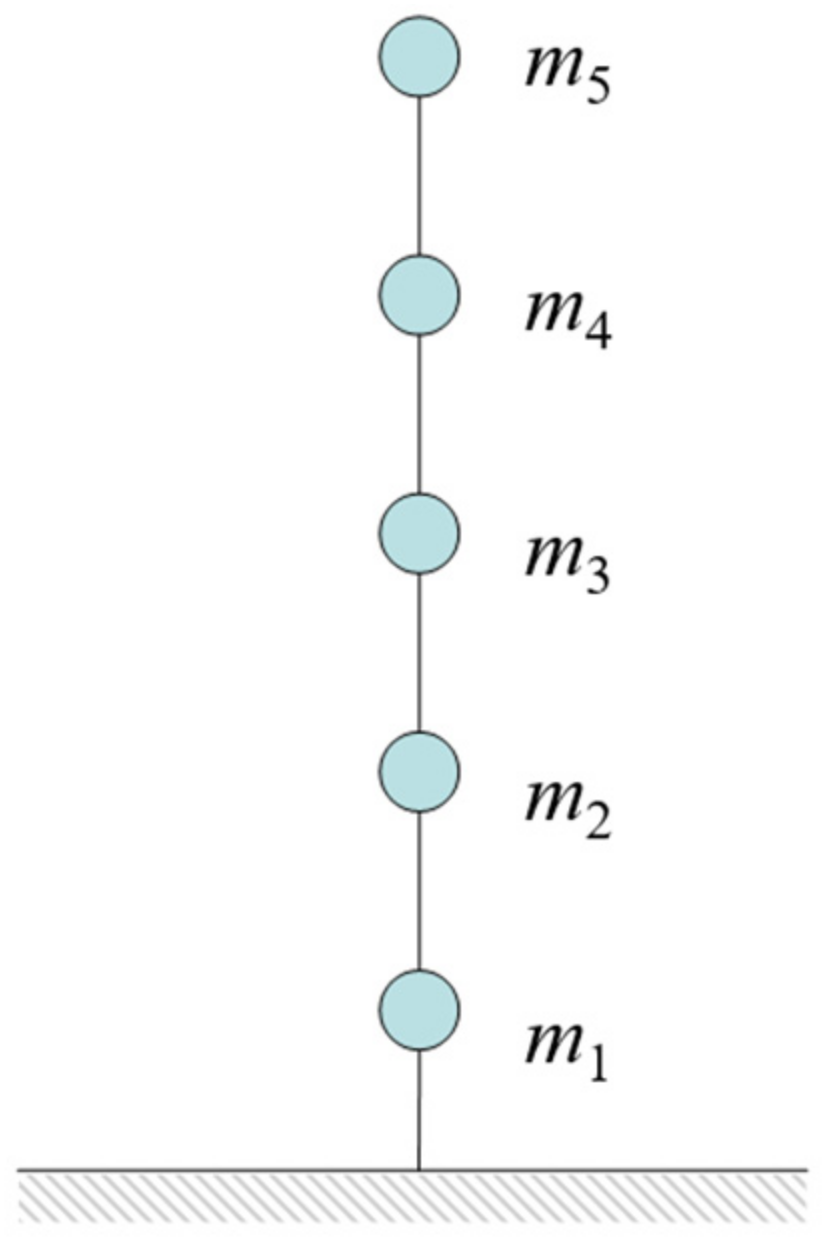
2.4. Earthquake Effect

In order to consider the effect of earthquakes on the wind turbine tower, it is reasonable to model the tower structure as a mass-lumped structure. The natural frequencies are determined for calculating the earthquake effect on the wind turbine tower [29]. For the PCSH wind turbine structure, the tower is simplified as a five degrees-of-freedom (DOF) model with five lumped masses as shown in Figure 2 [30]. The lumped mass on the top of the wind turbine tower is the largest because of the existence of blades, nacelle, hub, etc. The other lumped mass is determined by the distributed mass along the tower. The bending stiffness of the model changes with the height of the tower. Based on the seismic influence coefficient curve, the earthquake effect can be estimated by the mode–superposition response spectrum method [31].

2.5. Load Combination

Referring to the relevant literatures [28,32,33], the load combinations are given in Table 1. In this table, WL is the wind load on the tower, DL is the dead load, and EQ is the effect of an earthquake.

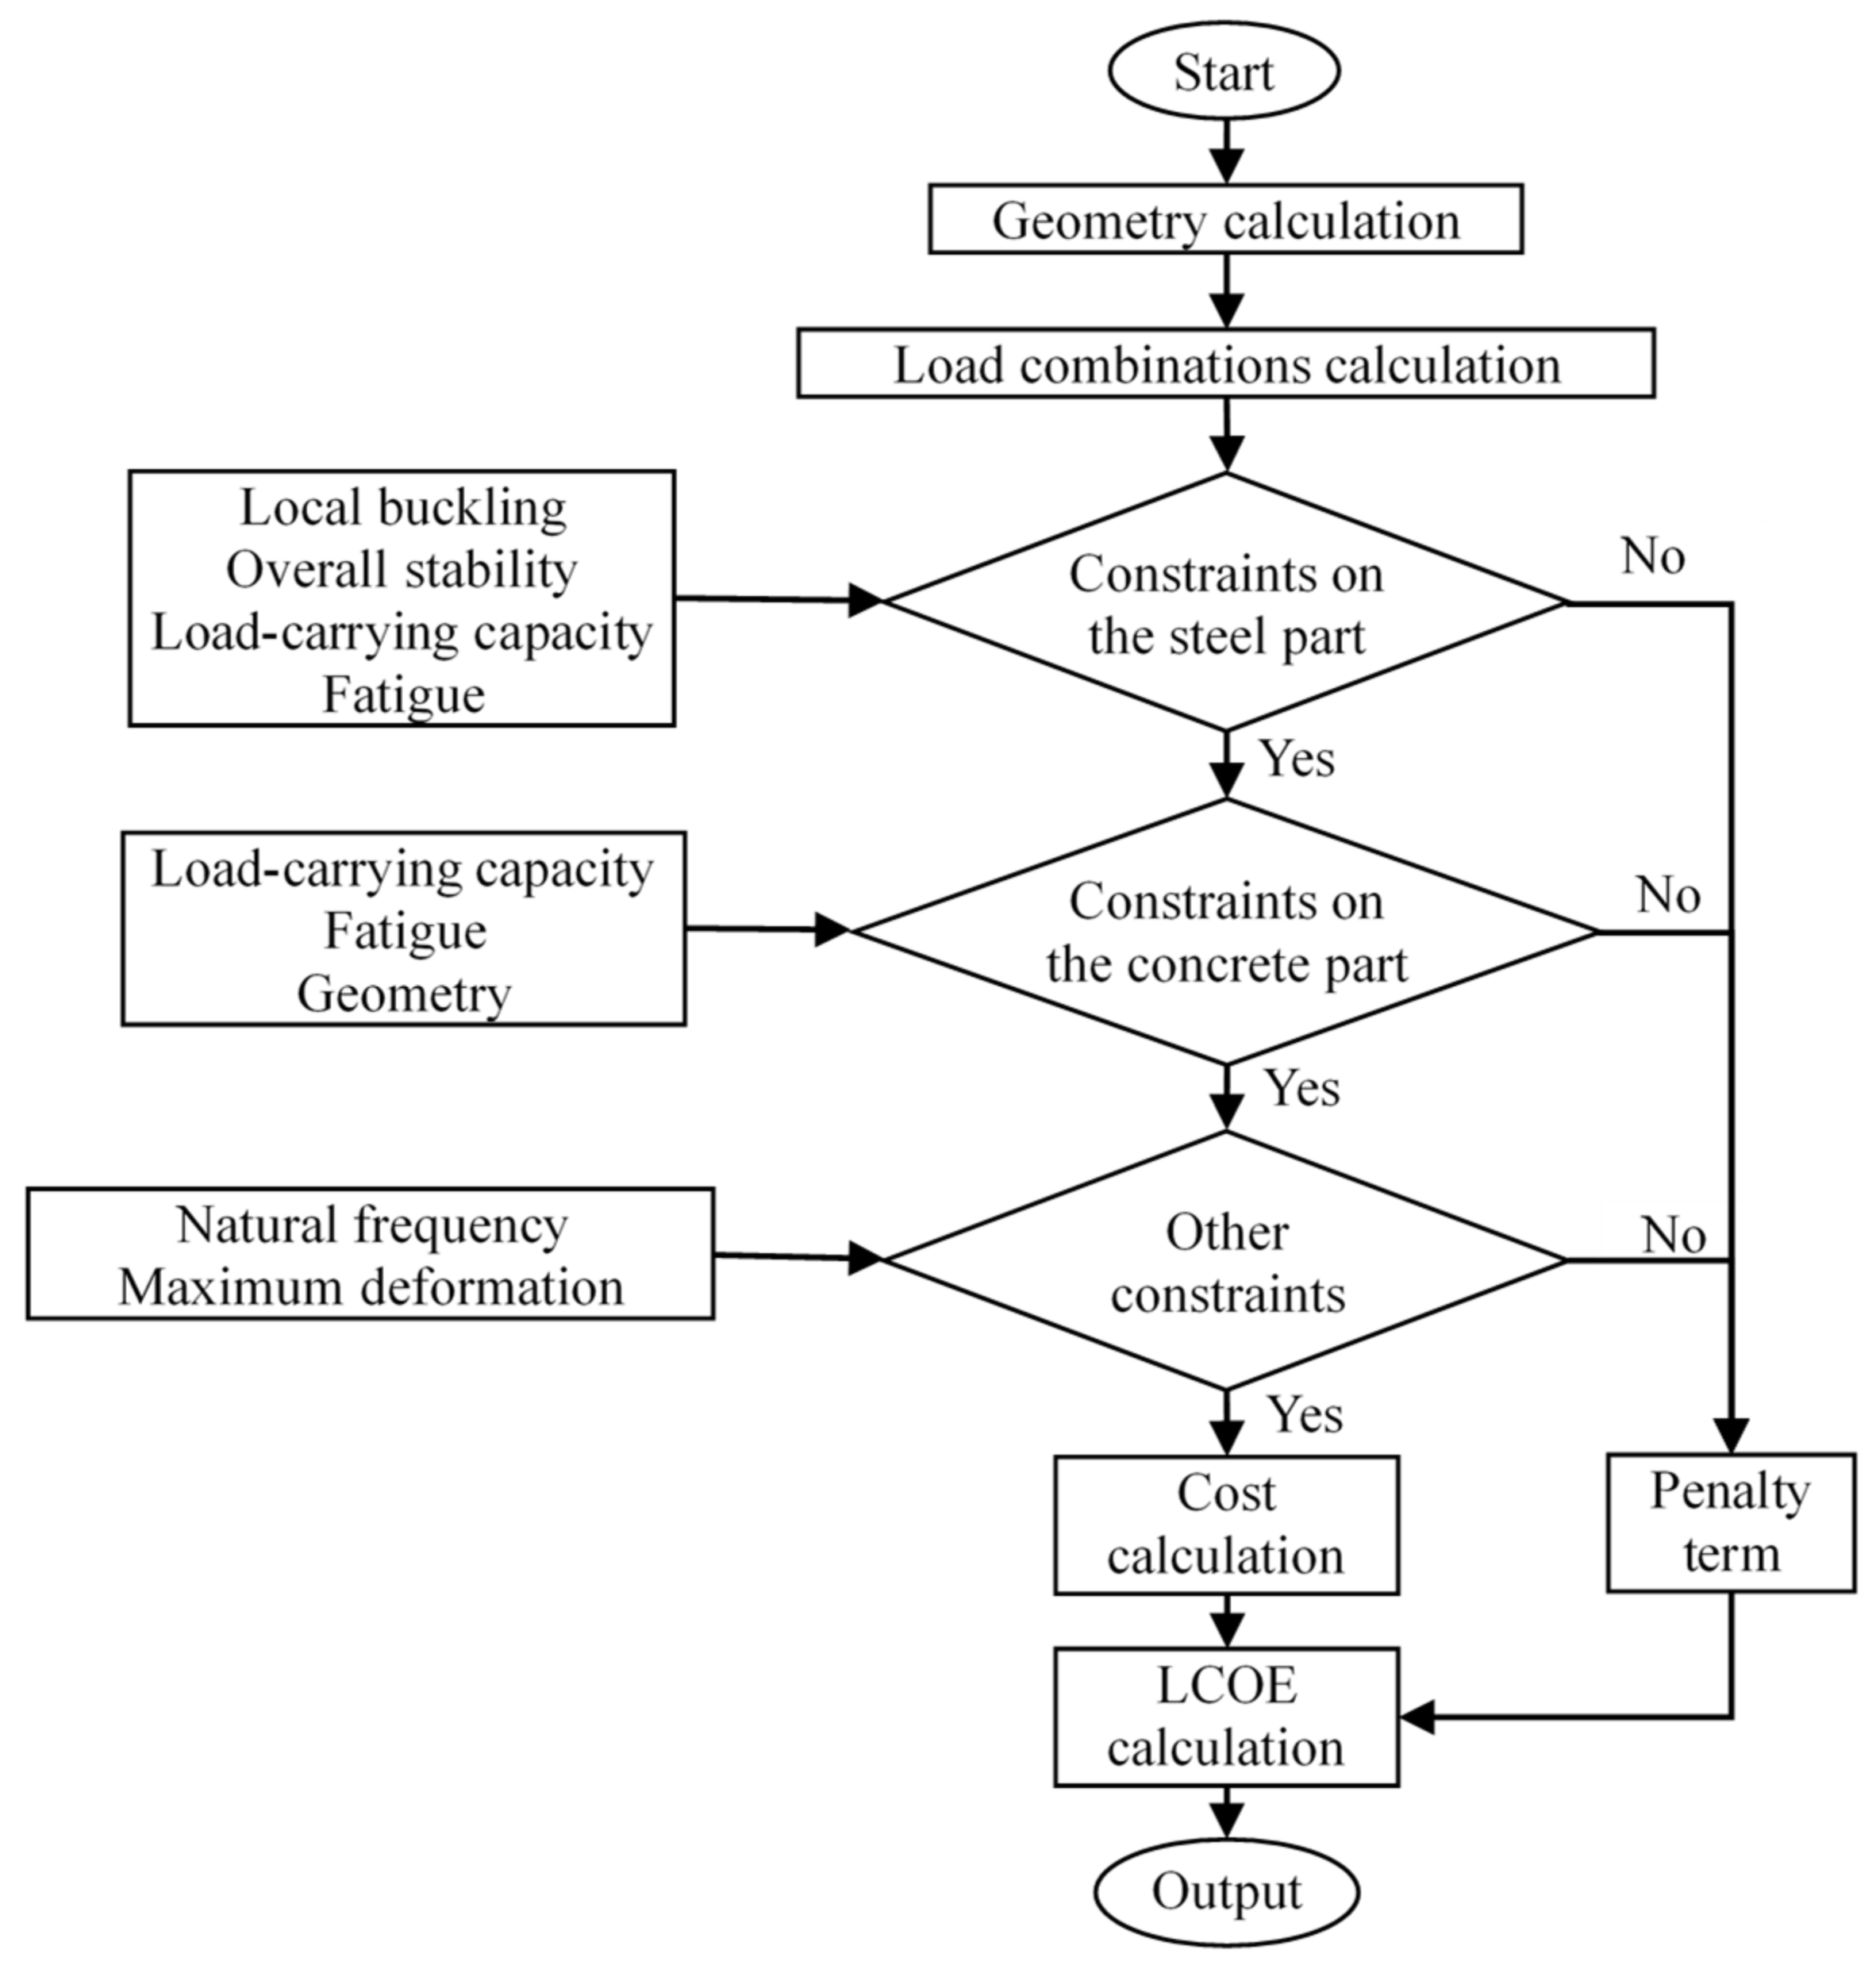
3. Design Constraints for Optimization of the PCSH Tower

The PCSH wind turbine tower can be modelled as a typical cantilever beam with variable cross sections. The following assumptions are made during the geometry optimization of the PCSH wind turbine tower in this paper. The bottom of the tower is fixed on the ground, and a concentrated mass representing the blades, nacelle, hub, and top part of the tower is attached at the top of the tower while the distributed mass along the tower is simulated by four lumped masses [30]. The nonlinearity of both PC and steel materials is not considered. The stress concentration around the door opening and the connection between the concrete and steel are not considered in the geometry optimization model due to the fact that a local strengthening measure is adopted around the door opening [16]. The optimization analysis is only performed in the fore-and-aft direction.

3.1. Constraints on the Steel Tubular Segment

3.1.1. Local Buckling

According to the code for the design of chimneys GB50051-2013 [34], the following condition should be satisfied in order to avoid local buckling of the steel tubular tower:
N i A n i + M i W n i σ c r t
where M i is the design maximum bending moment of a cross section i , N i is the design axial tension or pressure associated with M i , A n i is the net cross-sectional area of a cross section i , and W n i is the net cross-sectional resistance moment of the cross section. The local buckling critical stress of the steel segment σ c r t = 0.4 E k   t D , E   is the elastic modulus of steel, k is the regulation factor of local bearing strength, t is the thickness of the segment, and D is the outer diameter of the segment.

3.1.2. Overall Stability

According to the code for the design of steel structures GB50017-2003 [35], the monolithic stability should fulfill the following requirement:
N i φ A b i + M i W b i 1 0.8 N i / N E x f t
where A b i is the gross cross-sectional area of cross section i , W b i is the gross cross-sectional resistance moment of cross section i , φ is the coefficient of stability of the axial compression members of level cross section i , f t is the yield strength value of the steel segment, and N E x is the Euler critical load.

3.1.3. Load-Carrying Capacity

According to Agbayani [36], the following constraints need to be considered:
f c u ϕ c F c n
f v u ϕ v F v n
f T u ϕ T F T n
f v u / ϕ v F v n + f T u / ϕ T F T n 1
and
For f T u / ϕ T F T n 0.2 :
f c u / ϕ c F c n 1
For f T u / ϕ T F T n > 0.2 :
f c u / ϕ c F c n ] 2 + f v u / ϕ v F v n + f T u / ϕ T F T n ] 2 1
where f c u is the compression stress of the steel segment, ϕ c = 0.9 , F c n is the nominal compressive strength, f v u is the transverse shear of the steel segment,   ϕ v = 0.9 , F v n is the nominal shear strength of the steel segment, but F v n should not exceed F y / 3 , f T u is the torsion of the steel segment, ϕ T = 0.9 , T u is the design torsional moment, and   F T n is the nominal torsional strength of the steel segment.

3.1.4. Fatigue

The supporting structures for wind turbines are usually subjected to variable amplitude stress cycles caused by wind over their service life. As a result, the investigation of fatigue strength is of considerable significance for the design of wind-turbine-supporting structures.
According to the code for the design of steel structures GB50017-2017 [35], the allowable stress range of fatigue can be calculated by the equation:
Δ σ = ( C n ) 1 β
where n is the number of stress cycles and C and β can be determined by the code for the design of steel structures.
The Weibull Distribution function is commonly used to represent the wind speed frequency distribution. Based on the wind data for a given site, a method for estimating the wind speed frequency distribution is used [37]. The wind speed over 5.29 × 10 8 cycles for a 20-year fatigue design life of a wind farm can be synthesized [32]. The stress amplitude of the steel tubular tower segment can be determined based on the wind turbine tower model, the probability distribution, and the rain-flow counting method [38]. Fatigue assessment can be performed according to the amplitude, Miner rule, and code for the design of steel structures [35]. The equivalent stress range of the variable amplitude fatigue Δ σ e can be identified with the following equation:
Δ σ e = [ n l ( Δ σ l ) β n l ] 1 β
where n l is the life expectancy of the structure expressed in the number of stress cycles and n l is the number of stress cycles of stress range Δ σ l during the expected lifespan of the structure.

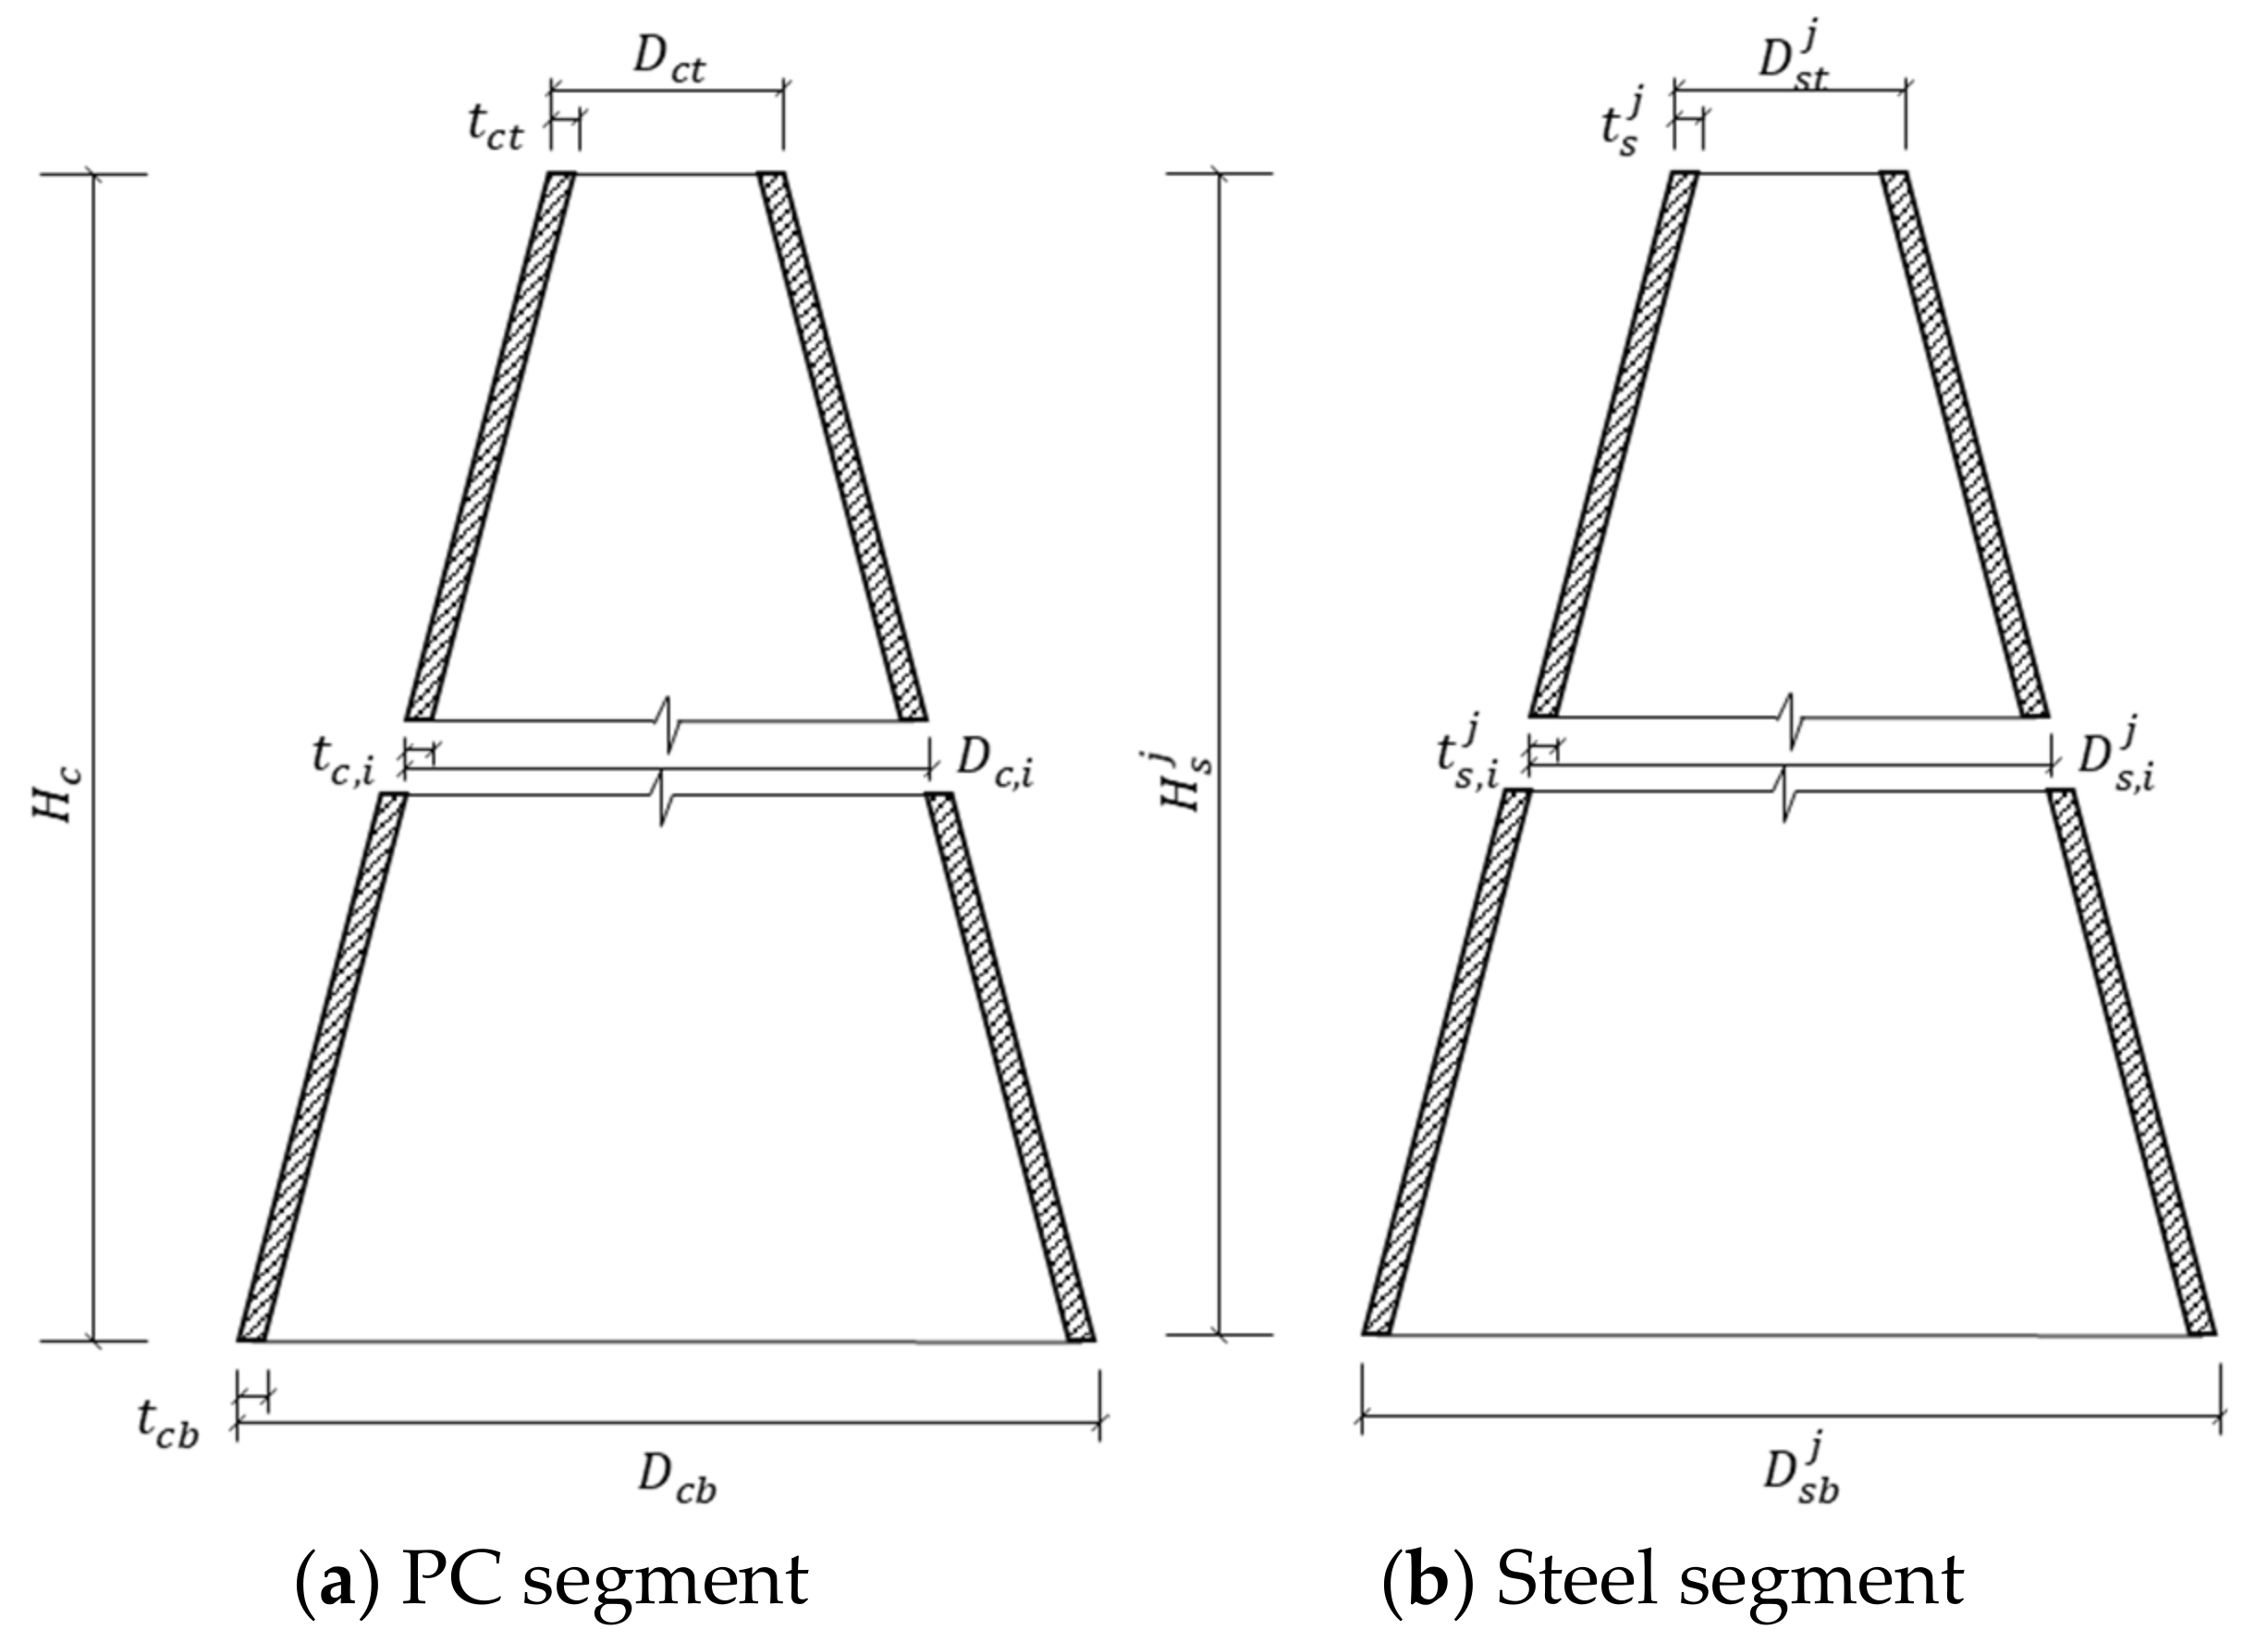
3.2. Constraints on the PC Segments

3.2.1. Load-Carrying Capacity

The minimum concrete compressive stress is set to be larger than zero. According to the code for design of high-rising structures GB50135-2006 [39] and code for the design of concrete structures GB50010-2010 [40], the following conditions must be fulfilled for compressive load-carrying capacity:
0 < σ c < f c
V u 1.2 t D + T u W t < 0.7 f t + 0.05 N p 0 1.2 t D
where σ c is the concrete stress, f c are the concrete axial compressive load-carrying capacity, V u   is the design shear force, T u   is the design torsional moment,   W t is the torsional section modulus, f t is the concrete axial tensile load-carrying capacity, N p 0 is the concrete normal prestressing force of the cross section, t is the thickness of the segment, and D is the outer diameter.

3.2.2. Fatigue

According to GB50010-2010 [40], the following constraints for concrete fatigue stress must be fulfilled:
σ c c , m a x f f c f
Δ σ p f Δ f p y f
where σ c c , m a x f is the maximum concrete compressive stress of a cross section, f c f is the axial compressive fatigue strength, Δ σ p f is the prestressed reinforcement stress amplitude, and Δ f p y f is the fatigue stress amplitude limit of prestressed reinforcement.

3.2.3. Geometry Constraint

According to GB50135-2006 [39], the thinnest thickness of the wall t m i n (mm) should fulfill the following Equation (30) and be thicker than 180 mm:
t m i n = 100 + 0.01 D

3.3. Other Constraints

3.3.1. Natural Frequency

To avoid resonance of the PCSH tower caused by the rotation of wind turbine blades, there should be a 10% safety margin between the natural frequencies of the whole system and the excitation frequencies of the rotating turbine blades. The value of natural frequencies of the tower system should be away from the blade passing frequency and the blade rotor frequency [41].

3.3.2. Maximum Top Displacement

To avoid excessive vibration and displacement, the maximum deflection at the top of the PCSH tower is restricted [10]:
W m a x W a l < 1
θ m a x θ a l < 1
where W m a x is the maximum top deflection, W a l is the allowable deflection, θ m a x is the maximum rotation angle of the top section, and θ a l is the allowable rotation angle of the top section. According to GB50135-2006 [39], W a l = H / 100 and θ a l = 5 ° , where H is the height of the wind turbine tower.

4. PUPSO Approach with the Objective Function of LCOE

4.1. Updated Partial Swarm Optimization (UPSO) Approach

With the development of intelligent optimization algorithms, solving engineering computing problems by simulating biological behavior is becoming increasingly popular in a series of practical applications [42]. In this paper, the geometry optimization problem of PCSH wind turbine towers can be expressed as the following equations:
Z t a r g e t = min f x = min f ( x 1 , x 2 , , x n ) T c x = [ h 1 x , h 2 x , , h n x ] T 0
where x is an N-dimensional vector to represent the particle, Z t a r g e t is the optimal target, f x is a function to calculate the total cost of the tower and has been described above, and c x is the vector of constraints functions. Both f x and c x are nonlinear functions.
The particles are operated by the following equations:
v q k + 1 = w × v q k + c 1 × ξ × x q b e s t x q k + c 2 × ξ × x g b e s t x q k x q k + 1 = x q k + v q k + 1
in which v q k and x q k are the speed and position, respectively, of the q th particle in the k th loop, w is the inertia weight, c 1 and c 2 are the learning factors of the algorithm, x q p b e s t is the position of the optimal point of the q th particle in the cycles from 1st to k th, x g b e s t is the position of the optimal point of all particles in the periods from 1st to kth, and ξ is an uniformly distributed random number within (0, 1).
A penalty term in the fitness valuation process is added to coordinate the movement of particles within the feasible region and ensure that the wind turbine tower design fulfills the design constraints.
Because the basic PSO algorithm usually encounters premature convergence issues, it is first updated in this paper. The updated PSO (UPSO) is carried out as follows.
1.
Weight function’s learning factor
The algorithm with a weight function’s learning factor [43] is adopted in this paper to speed up the computation. Unlike the traditional PSO algorithm, the learning factor and inertia weight can be calculated as:
w = w m i n + w m a x w m i n e x p ( 20 m / M ) 6 c 1 = 0.5 w 2 + w + 0.5 c 2 = 2.5 c 1
where m is the number of iterations, M is the maximum number of iterations,   w is the inertia weight, w m i n is the minimum inertia weight, w m a x is the maximum inertia weight, and c 1 and c 2 are the learning factors.
2.
Random perturbation
To avoid premature convergence, a random operator is introduced to the optimization process in this paper [23]. The fitness variance of particles is defined as the following equation:
σ 2 = i = 1 n ( f q f a v g f N ) 2
where f q is the fitness of the q th particle; f a v g is the average value of fitness of particles; and f N is the normalized scaling factor, which can be calculated by the following equation:
f N = max ( f q f a v g ) , max ( f q f a v g ) > 1 1 , o t h e r s
The mutation probability p m can be calculated by the following equation:
p m = ζ , σ 2 < σ d 2 0 , o t h e r s
where ζ takes the values within 0.1 ,   0.3 and   σ d 2 is set to be 0.15.
For the purpose of mutating the operator x g b e s t in the kth loop, random perturbation is adopted according to the following equation:
x g m b e s t = x g b e s t × 1 + 0.5 η
where η follows a Gaussian distribution, x g m b e s t is the position of the optimal point of all particles in the periods from 1st to kth after mutation, and x g b e s t is the position of the optimal point of all particles in the periods from 1st to kth.

4.2. Objective Function

With the start of bidding in wind power markets, LCOE, as the world’s most commonly used index to evaluate the cost of electricity, has been favored by participants involved in wind power projects. Bruck et al. suggests that LCOE can be used as a basis for setting appropriate power purchasing agreement terms [44]. Based on the LCOE method, Myhr et al. studied the influence of deployable operating depth and other factors on offshore wind power platforms [45]. Khojasteh et al. proposed and optimized a distributed generation by adding a shroud to the wind turbine and assessed it by LCOE [46]. In this paper, the LCOE is chosen as the objective function and can be calculated by Equation (40):
L C O E = t = 1 n I t + M t + F t 1 + r t t = 1 n E t 1 + r t
where I t are the investment expenditures in year t (including financing); M t is the operations and maintenance expenditures in year t; F t is the fuel expenditures in year t; E t is the electricity generation in year t; r is the discount rate; and n is the life of the system. There are four types of wind energy resource areas in China and the LCOE of each area needs to be calculated separately.
Table 2 shows the costs and fees of the wind farm, which are estimated based on official files and engineering experiences [16]. Management expenses and measure expenses are 33.3% and 15.3% of the total labor and machinery costs, respectively. However, due to the difficulties of considering extra costs during the project, such as wind curtailment, transportation, and road construction, these factors are not considered in the optimization.
The geometry of a PCSH wind turbine tower, including the heights of the PC and steel segments, is optimized in this paper. Figure 3 shows the cost evaluation flow chart for the PCSH tower. As illustrated in Figure 3, the function of LCOE can be determined accordingly when the design is completed.
When the particle violates the constraint, measures need to be taken to orchestrate the motion of the particle. As shown in Figure 3, the penalty term is set to 0.5, which coordinates the movement of particles within the feasible region and cannot be treated as the ultimate goal of cost calculation. When a constraint violation occurs, the checking procedure is interrupted directly and the penalty term is employed to evaluate the fitness value for enhancing the computing efficiency of the optimal algorithm.

4.3. Optimization Variables

In this paper, the influence of geometric dimensions is considered to achieve a more economical design in the form of LCOE. The independent variables are shown in Figure 4 and their ranges are listed in Table 3. The ranges of the variables are set according to engineering and design experience. The thickness of each steel segment is assumed to be constant along the height direction. The range of the thickness of the steel section can be narrowed down with increasing design experience and determined in the cost estimate function to reduce the optimization variables and to accelerate the optimization computation. Based on the assumption that the length of each steel section is basically the same, the number of flanges is determined by the length and stress condition of the steel tower. For the PC segments, the thickness and diameter of the bottom cross section should not be smaller than the upper cross section of the segment.
Apart from the aforementioned variables, there are some known dependent variables. The total length of the tower is 77.5 m. Therefore, the length of the steel segment determines the length of the concrete segments. The length of each steel section is the longitudinal dimension of the whole steel segment divided by the number of steel segments. The diameter of the steel tubular segment at the top of the tower is determined by the design of the nacelle and hub. Hence, their values are constant during the optimization. To simplify the problem and construction process, it is assumed that the generatrix of every section of the tower is a straight-line segment rather than a curved segment to easily determine the dimension of the tower at any height.

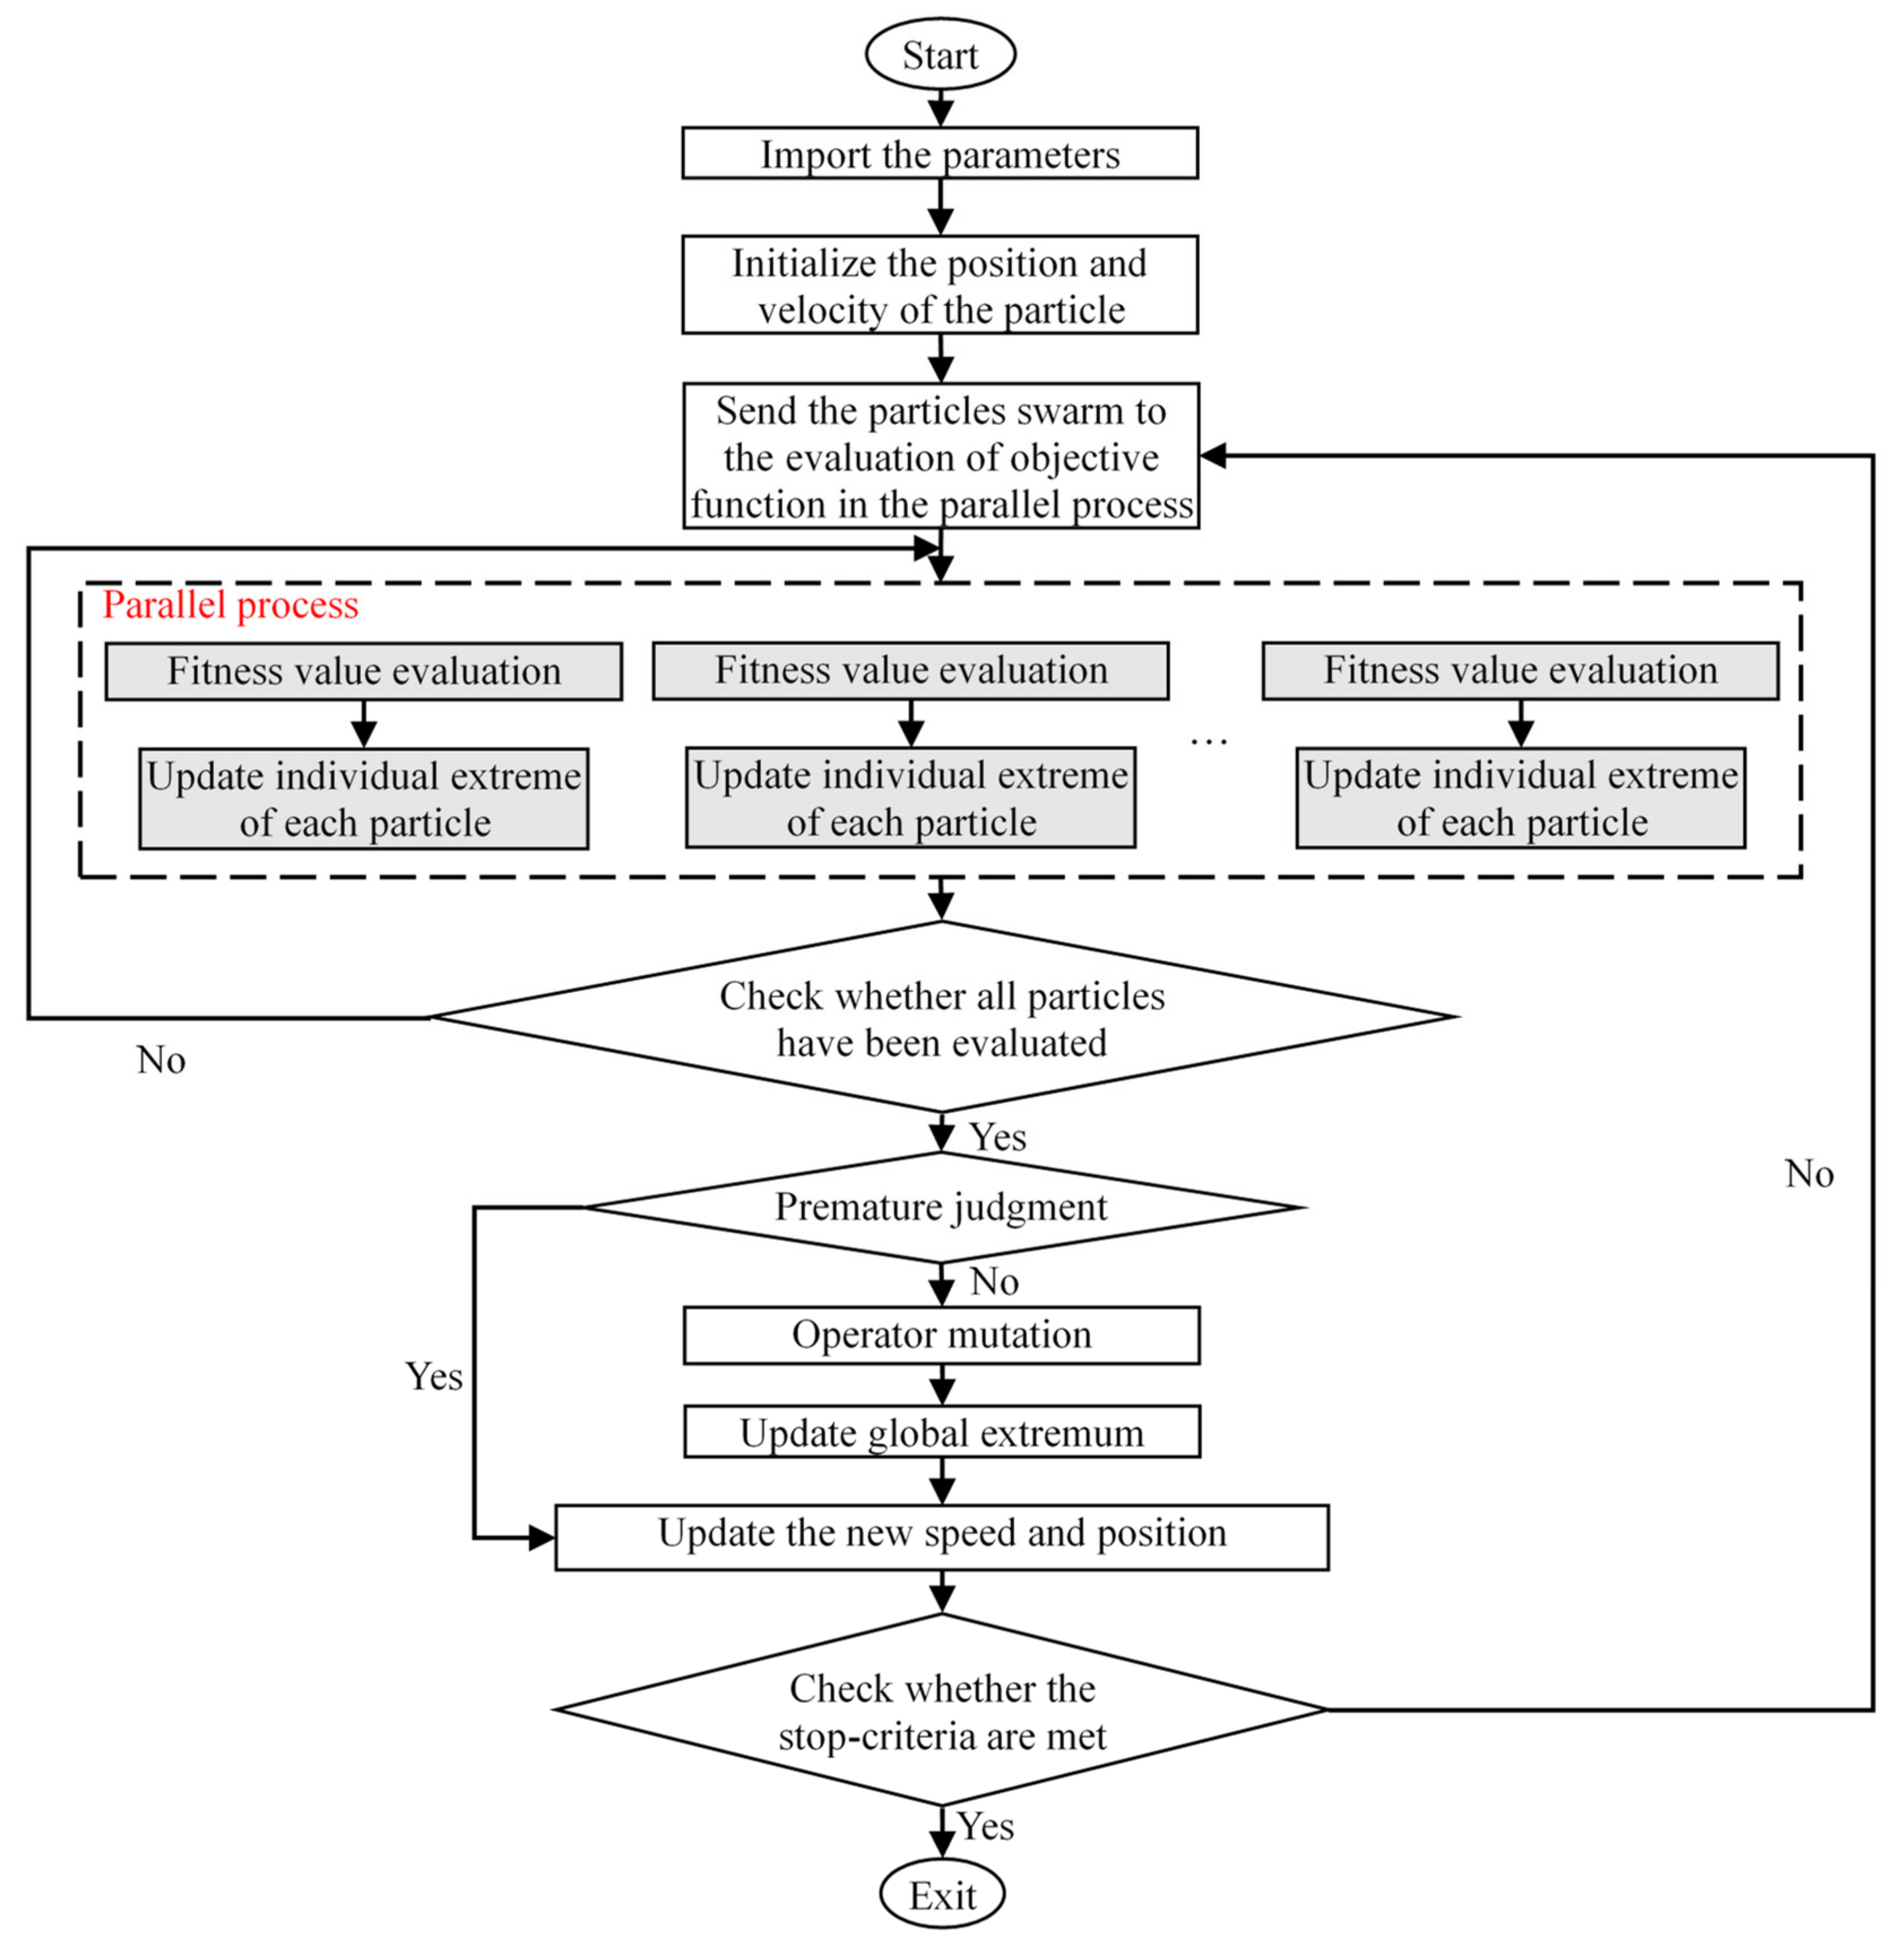
4.4. Flow Chart of PUPSO Algorithm

The above mentioned UPSO algorithm is carried out in a sequential form and the optimization process is usually time-consuming when the speed and position of a large number of particles are updated. In this study, further efforts are made to improve the computational efficiency by proposing a parallel UPSO (PUPSO) approach, where the computing body is divided into several concurrent tasks on the basis of different particles when evaluating the objective function. The flow chart of the PUPSO algorithm is shown in Figure 5.
The PUPSO algorithm starts by reading the initial conditions of the PCSH tower model, including the number of particles, the optimization parameters, and the termination condition. The termination condition for this implementation is the maximum number of iterations. Then, the particle swarm is generated randomly in the range mentioned in Section 4.3 and sent into the fitness value function. Based on the fitness value function, the fitness value of every particle can be determined and fed back to the PUPSO algorithm. Based on the returned values, the parameters are modified as described in Section 4.1. Then, new particles are generated according to the modified parameters and sent to the next loop. The optimal solution is then obtained after a number of cycles.

5. Optimization for PCSH Wind Turbine Tower

5.1. Design Parameters

It is assumed that the wind farm is built in a mountainous area, and site information and the parameters of the wind turbine studied in this paper are listed in Table 4 [25,47]. In the PCSH wind turbine tower, the upper steel part of the tower is made of Q345 steel and the lower PC part is made of C50 concrete. The height of the wind turbine tower is 77.5 m. The material properties are determined by GB 50010-2010.
The parameters used in the PUPSO approach are listed in Table 5.

5.2. Optimization Results for the PCSH Wind Turbine Tower

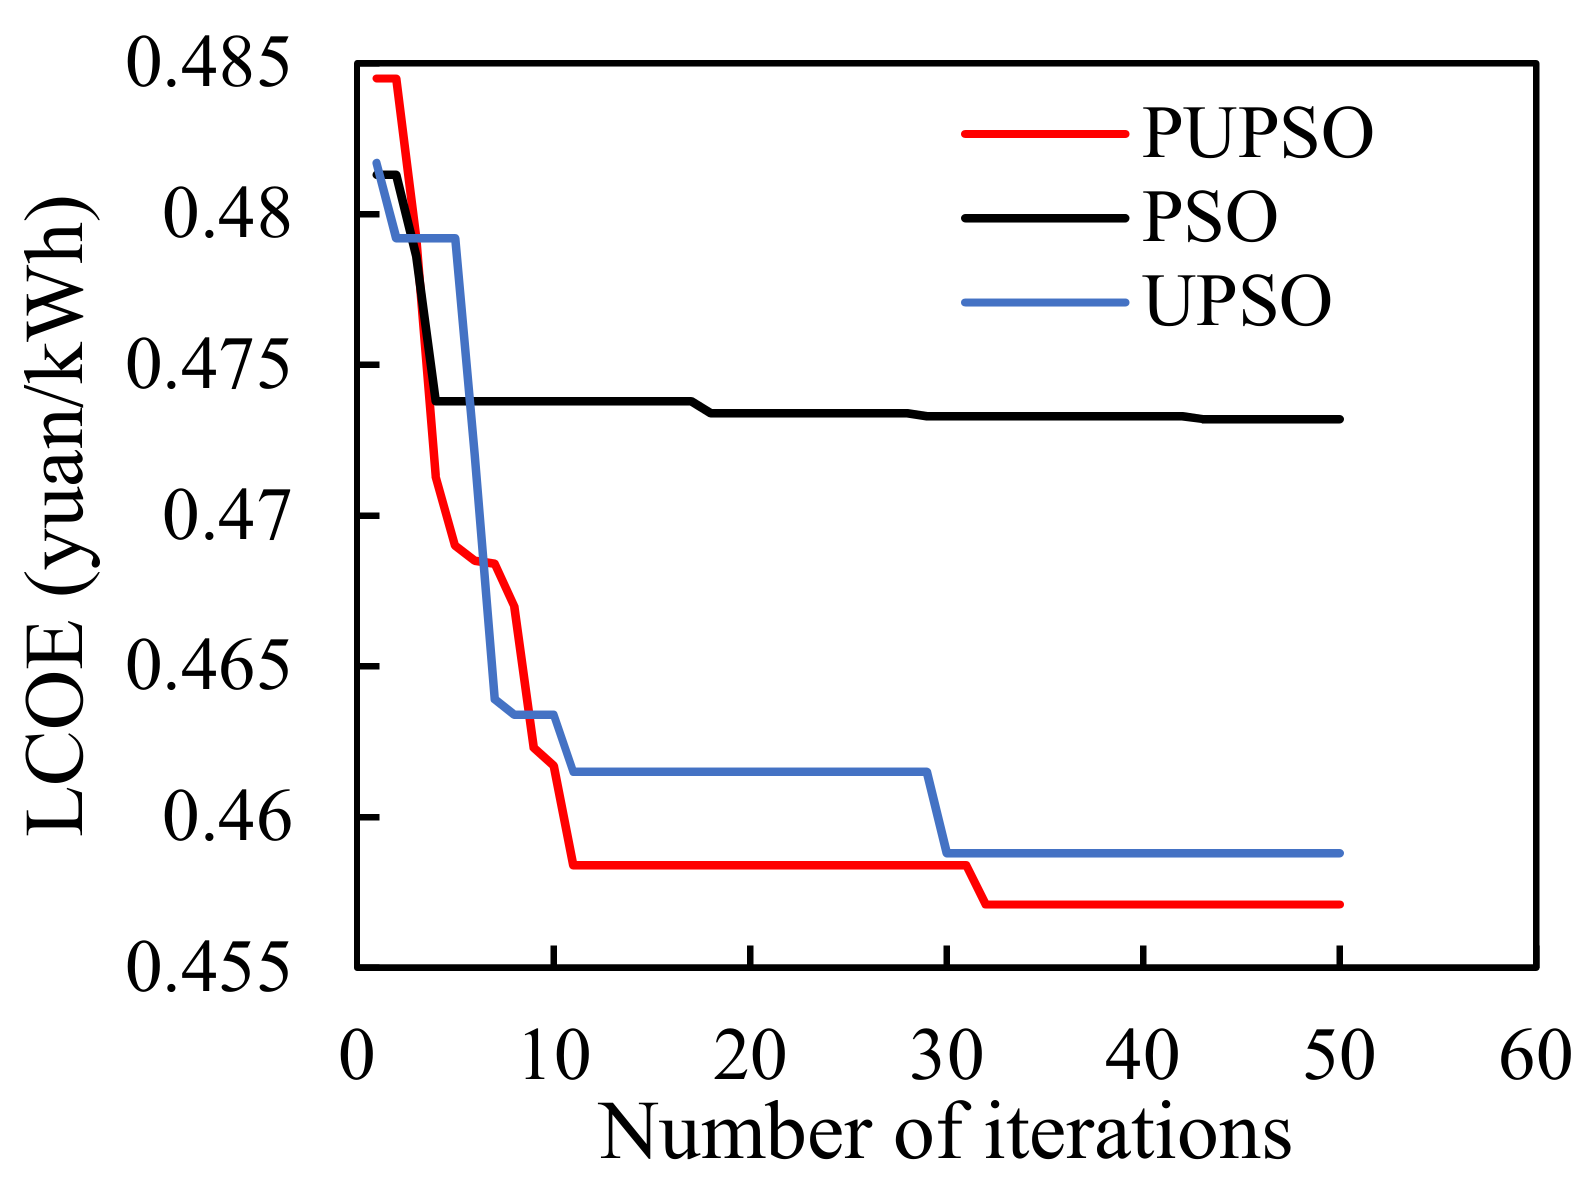
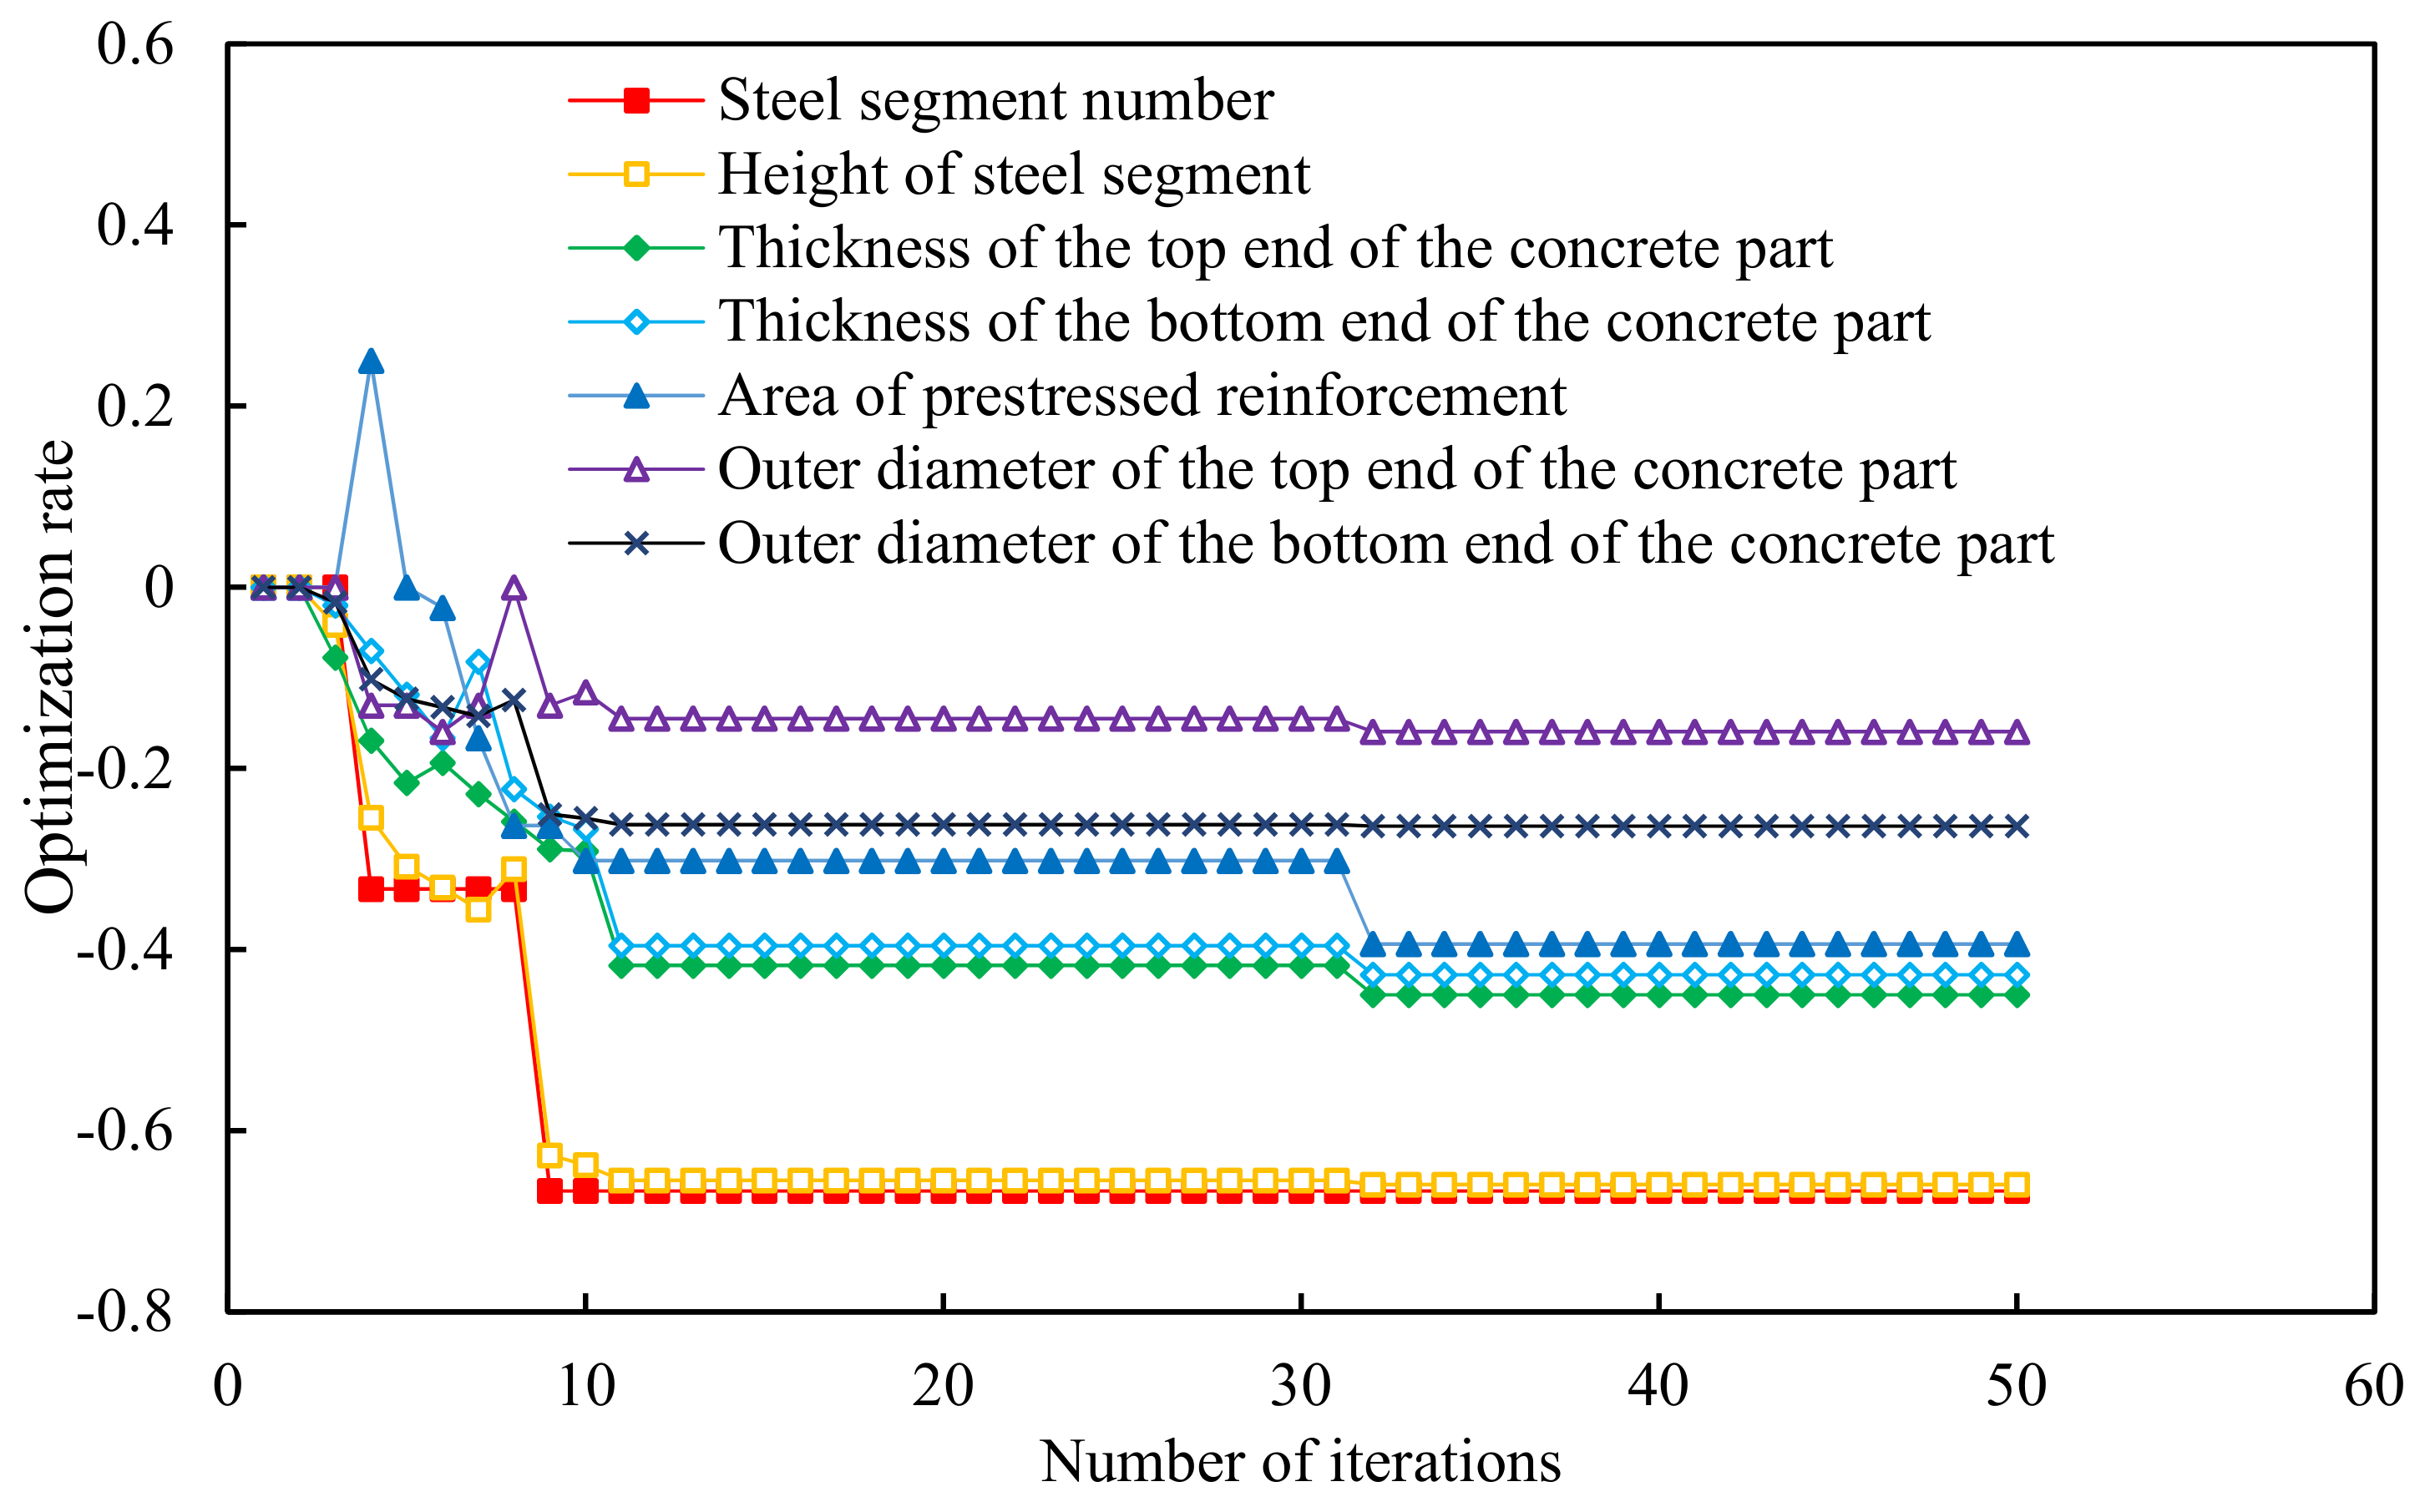
5.2.1. LCOE Optimization

The relationship between the LCOE under the category IV wind energy resource area and the number of iterations is illustrated in Figure 6. According to Figure 6, by the use of the proposed PUPSO optimization approach, the LCOE of the PCSH tower defined above decreases clearly with the iteration of the approach and the minimization of the objective function is realized when the number of the iteration reaches 31. The LCOE decreases sharply in the first iterations because the algorithm in this paper strengthens the searching space diffusion and heightens the weight of particle optimization in the early stage and the weight of global optimum in the later iterations. The LCOE also drops fast in the early stage of the PSO optimization. However, the optimal result of PSO is inferior to that of the PUPSO algorithm proposed in this paper after the process is iterated four times.
The LCOE of four types of wind energy resource areas are presented in Table 6. Compared with the LCOE of the original wind turbine tower, the LCOE of the optimized wind turbine tower reduced by about 4% due to the reduction in construction costs. Theoretically, if the LCOE is higher than the electricity price, the project is not economically feasible. Therefore, the optimized PCSH wind turbine tower can increase profits and make it economically possible to build wind farms in areas with lower electricity prices.
The optimization rates, that is, the ratio of the difference of variables before and after optimization to the value before optimization, using the PUPSO are shown in Figure 7. It can be seen that the variables illustrated in the figure are less than zero, which means the variables are smaller than they were before the optimization. As the number of iterations increases, the variable tends to decrease.
The comparison of corresponding dimensions for the PCSH wind turbine tower is listed in Table 7. Compared with the original design, the height of the upper steel segment is greatly reduced to 22 m and approximately 30% of the total height of the PCSH tower while the steel segment number is 1. The thickness of the tower, including the steel segment and concrete segment, is also reduced, which decreases the material consumption of the PCSH tower.

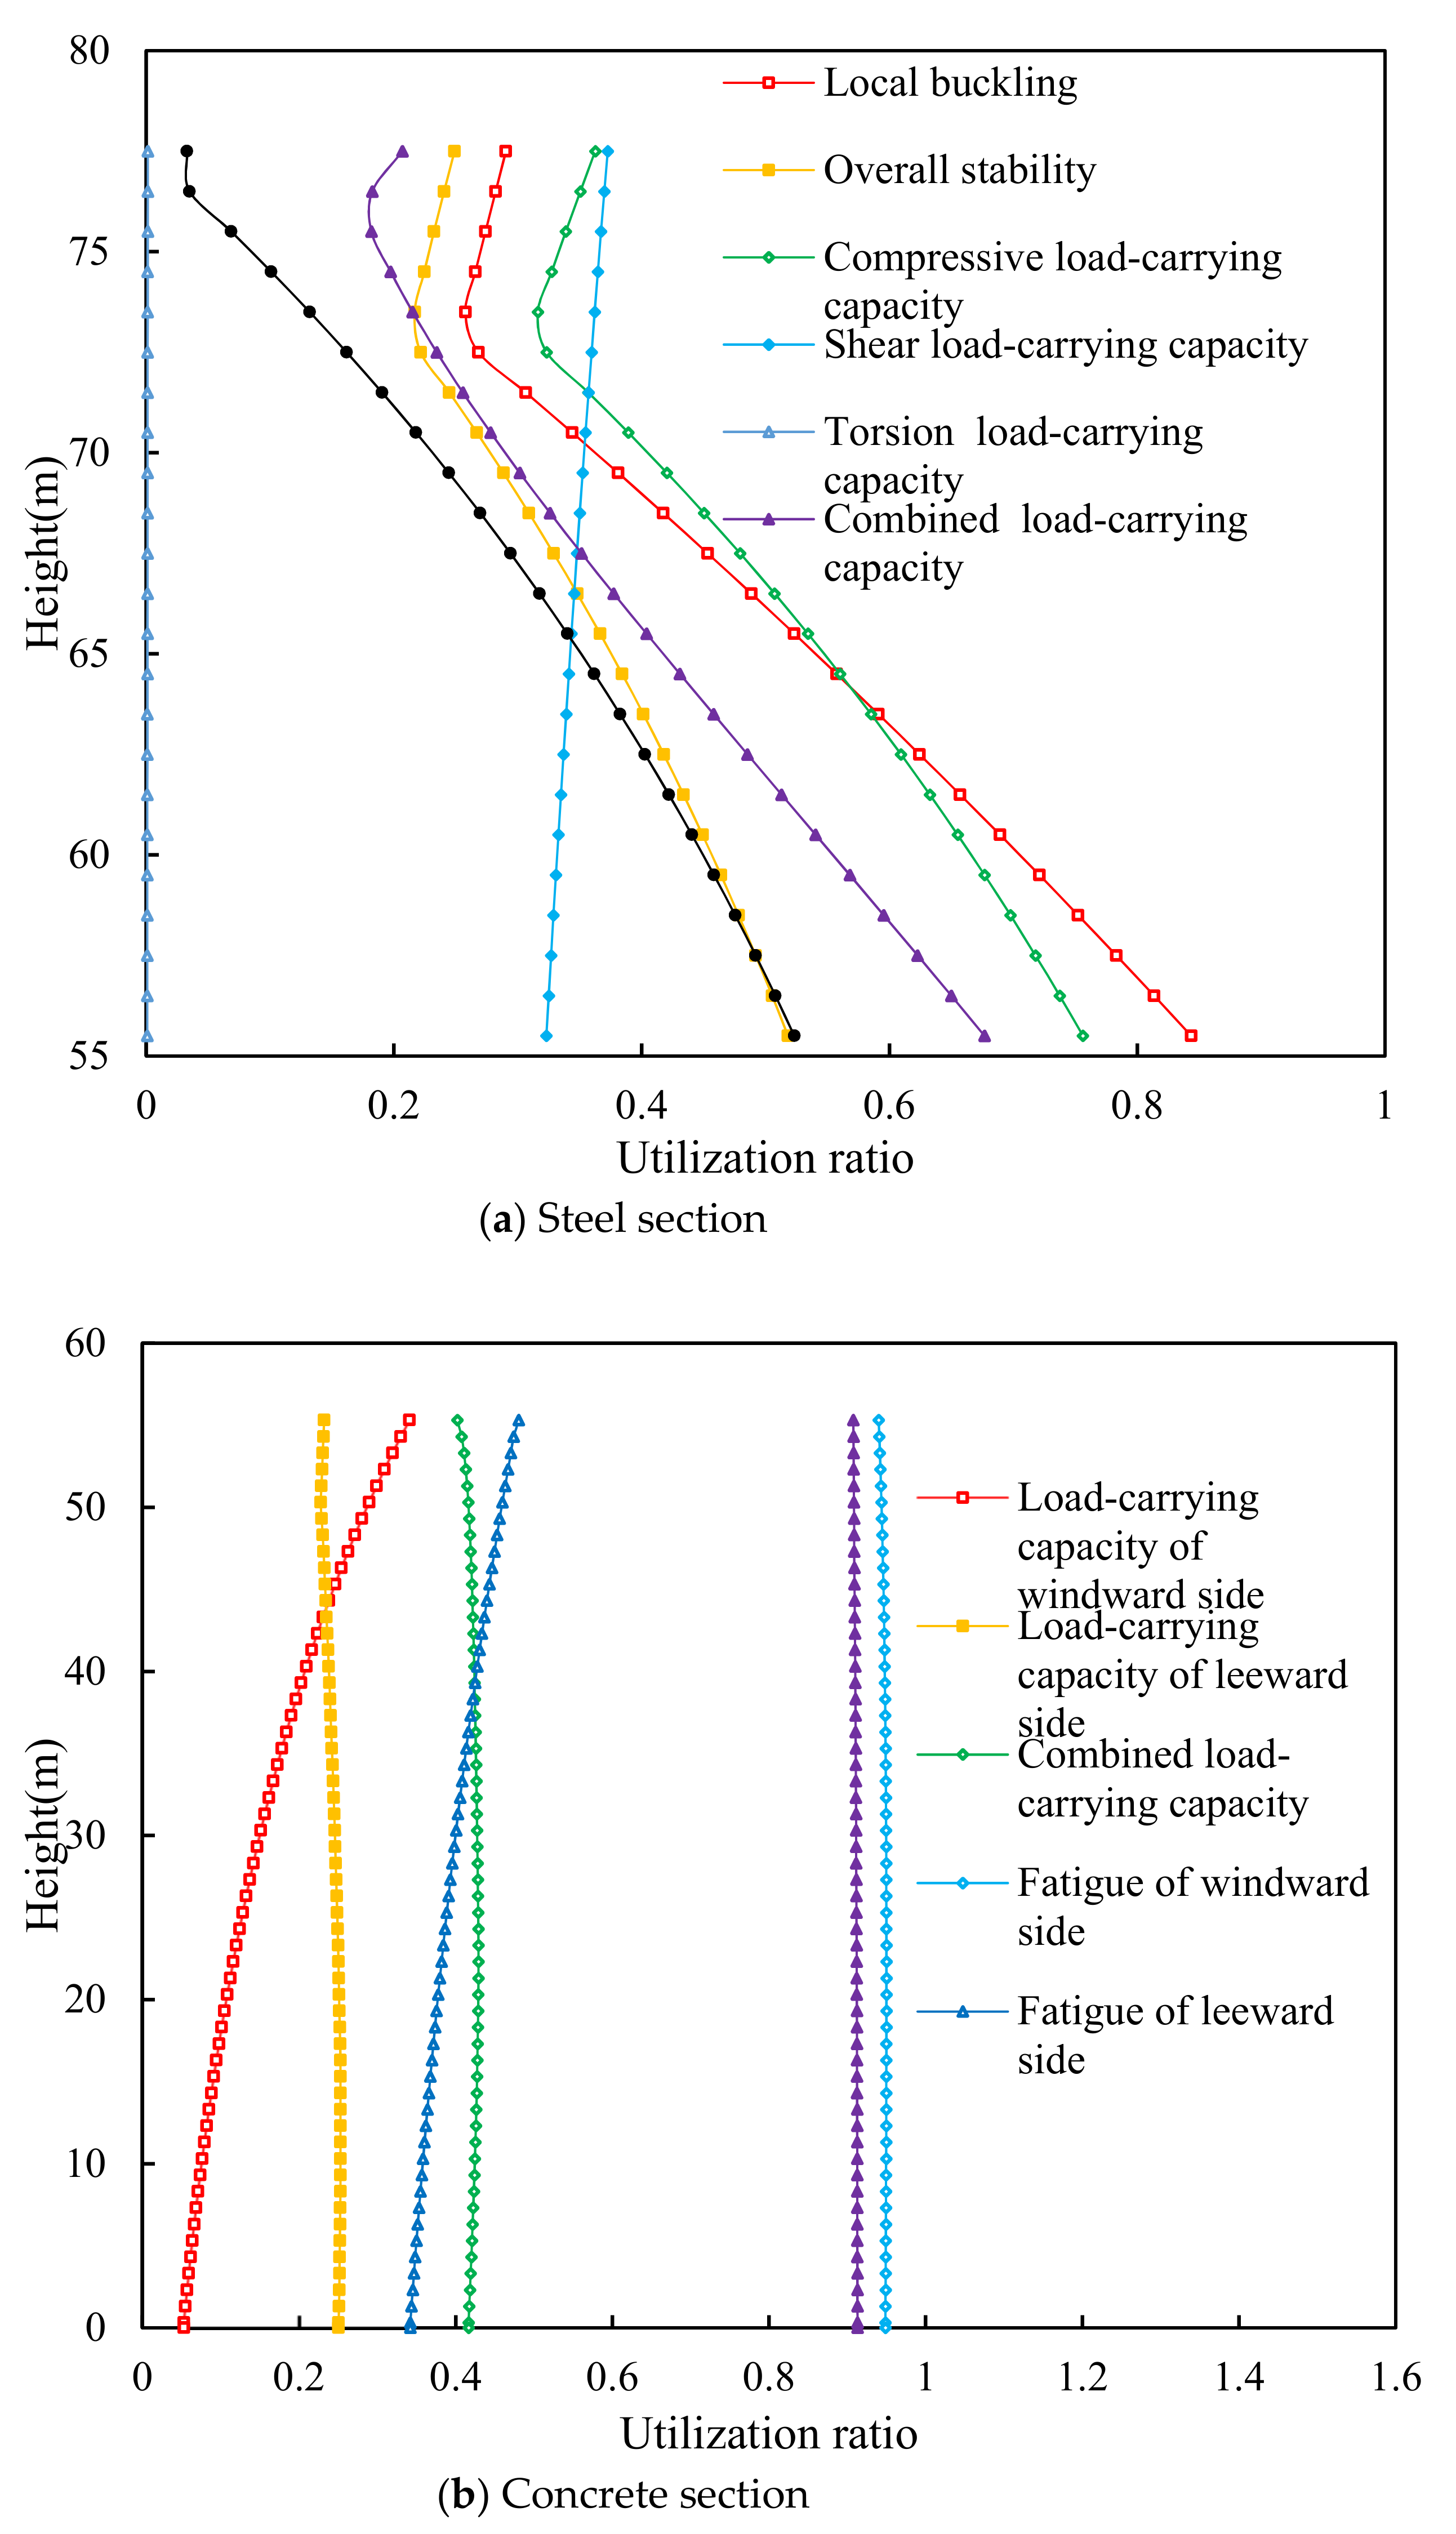
5.2.2. Utilization Ratio Comparison

In order to evaluate the utilization of both concrete and steel material of the optimized PCSH wind turbine tower and the effectiveness of the approach, the material utilization ratio as the ratio of the actual to maximum allowable performance values is determined. Figure 8 shows the maximum constraint activity of all cases for the optimized design. According to Figure 8, it can be seen that all utilization rates are less than one but greater than zero and local buckling for the steel section and fatigue damage for the concrete section are prominent. Therefore, no constraint was violated and the safety of the structure is ensured. The utilization rate at the upper part of the steel segment is less than that at the lower part of the steel segment due to the fact that D s t 1 is not optimized and is determined by the wind turbine and that the thickness of the steel section is constant along the height direction. The maximum utilization rate of the concrete segment is close to one along with the height, which means that the optimal result is close to the global optimal solution.
The maximum utilization ratio of the PCSH tower before and after optimization are listed in Table 8. According to Table 8, the utilization ratio of steel and concrete has been enhanced significantly. That both maximum utilization ratios of prestressing bars are close to one means the prestressing bars are fully used. The change of prestressed reinforcement is mainly due to the change of structural internal forces caused by the change of structural dimensions. The maximum utilization ratio for the load-carrying capacity of the PC segment at windward side is below zero, which means that the windward side of the tower is compressed rather than tensioned under the impact of prestress. The maximum utilization rate of the optimized PCSH wind turbine tower is close to one, which illustrated the effectiveness of the PUPSO algorithm.

5.2.3. Fundamental Natural Frequency Comparison

The rotating speed of the rotor in the rated power is 23 rpm. Therefore, the corresponding rotational frequency is 0.38 Hz and the blade passing frequency is 1.15 Hz. The natural frequency of the different tower is listed in Table 9. The fundamental natural frequency of the original wind turbine tower is 0.45 Hz and the natural frequency of the optimized PCSH wind turbine tower is 0.56 Hz. The natural frequency of the PCSH tower is higher than that of the original tower. Moreover, the natural frequency of the proposed PCSH wind turbine tower has a safety margin of 0.18 Hz away from the rotational frequency and 0.59 Hz away from the blade passing frequency, which means a better dynamic behavior compared with the original design.

5.2.4. Weight Comparison

The weight of the wind turbine tower before and after optimization are listed in Table 10. Due to the reduction in the proportion of steel sections, the consumption of steel is reduced by about 82% and the weight of PC segment is increased by about 56%. The optimized design greatly reduces the steel consumption of the tower. The weight of the structure is increased by about 27%, which strengthens the anti-overturning capacity of the structure.

5.2.5. Computation Efficiency Comparison

To verify the effectiveness of the proposed PUPSO algorithm for the optimization of the PCSH wind turbine tower, the comparison of computational times at different number of cycles between the PUPSO approach and the UPSO computation is shown in Table 11. When the cycle was 5, the computation time was saved by 49% and 38%, respectively. When the cycle was 10, the computation time was saved by 47% and 51%, respectively. It can be seen that by the use of the proposed PUPSO approach, the optimization computation efficiency was clearly enhanced.
The comparison of computational time for PSO, UPSO, and PUPSO is shown in Table 12. The proposed PUPSO algorithm has better optimization abilities compared with the PSO and UPSO. As shown in Table 12, the computation time of the proposed PUPSO can be saved by 51% and 53% when compared with the PSO and UPSO, respectively. In conclusion, compared with the PSO and UPSO algorithm, the PUPSO algorithm can improve the optimization efficiency by 60–110%. The reason for the large difference in calculation efficiency is that computing time will be saved when a constraint violation occurs as the checking procedure is interrupted directly and employs the penalty term, as shown in Figure 3. Not only does the approach speed up the calculation efficiency but it also avoids premature convergence as much as possible.

6. Conclusions

Based on the PUPSO algorithm, a geometry optimization approach for PCSH wind turbine towers has been proposed in this paper. During the optimization procedure, several working conditions, including wind and earthquakes as well as combinations of these factors, are considered. The LCOE of the PCSH tower is treated as the objective function and the geometry variables for the optimization of the PCSH tower include the dimensions of the PC and steel segments of the PCSH wind turbine tower. Based on this analysis, a geometrically optimal result was obtained, and the following findings can be made:
1.
The proposed PUPSO algorithm performs better when compared with the traditional PSO algorithm and the UPSO. The computation time is greatly reduced by using parallel algorithms. Fulfilling the design constraints of relevant specifications and industry standards, the PUPSO algorithm provides an optimal design for the PCSH wind turbine towers with considerably improved computational efficiency.
2.
The levelized cost of energy (LCOE) of the PCSH wind turbine tower in a life cycle perspective is considered as the objective function as an alternative to the direct investment. The LCOE of the optimized PCSH wind turbine clearly decreases when compared with the benchmark tower and increases the material utilization rate of the tower. The optimized PCSH wind turbine tower can be an economic alternative for wind farms with lower LCOE requirements. The height of the steel segment of the optimized PUPSO tower is recommended to be 30% of the total height of the PCSH wind turbine tower.
3.
The optimized tower can provide better dynamic behavior to avoid the resonance caused by wind turbine excitation.
4.
The optimization results for PCSH wind turbine towers provide valuable references in practice for PCSH wind turbine tower design in mountainous areas. This paper, based on a linear hypothesis and limited deformation, has been conducted as the preliminary optimization. Because of the nonlinearity present in prestressed concrete towers, nonlinear calculations should be investigated in the future.

Author Contributions

Conceptualization, B.X. and H.G.; methodology, B.X.; software, H.C.; validation, Z.L.; investigation, Z.L.; data curation, H.C.; writing—original draft preparation, Z.L.; writing—review and editing, B.X. and H.G.; visualization, Z.L.; supervision, H.G.; funding acquisition, B.X. All authors have read and agreed to the published version of the manuscript.

Funding

This research was funded by National Natural Science Foundation of China (NSFC) under Grants No. 51478175, the Scientific Research Funds of Huaqiao University (Grant number 605-50Y18016), and the International Science and Technology Cooperation and Exchange Fund Projects of Ministry of Science and Technology of China (2014DFE70230).

Institutional Review Board Statement

Not applicable.

Informed Consent Statement

Not applicable.

Data Availability Statement

Data are contained within in the article.

Acknowledgments

The authors gratefully acknowledge the support provided to the corresponding author through the National Natural Science Foundation of China (NSFC) under Grants No. 51478175, the Scientific Research Funds of Huaqiao University (Grant number 605-50Y18016), and the International Science and Technology Cooperation and Exchange Fund Projects of Ministry of Science and Technology of China (2014DFE70230).

Conflicts of Interest

The authors declare no conflict of interest.

References

  1. Quilligan, A.; O’Connor, A.; Pakrashi, V. Fragility analysis of steel and concrete wind turbine towers. Eng. Struct. 2012, 36, 270–282. [Google Scholar] [CrossRef]
  2. Lantz, E.; Roberts, O.; Nunemaker, J.; Edgar, D.; Dykes, K.; Scott, G. Increasing Wind Turbine Tower Heights: Opportunities and Challenges; National Renewable Energy Laboratory (NREL): Denver, CO, USA, 2019. [Google Scholar]
  3. Yadav, K.K.; Gerasimidis, S. Instability of thin steel cylindrical shells under bending. Thin Walled Struct. 2019, 137, 151–166. [Google Scholar] [CrossRef]
  4. Yadav, K.K.; Gerasimidis, S. Imperfection insensitive thin cylindrical shells for next generation wind turbine towers. J. Constr. Steel Res. 2020, 172, 106228. [Google Scholar] [CrossRef]
  5. de Lana, J.A.; Júnior, P.A.A.M.; Magalhães, C.A.; Magalhães, A.L.M.A.; de Andrade Junior, A.C.; de Barros Ribeiro, M.S. Behavior study of prestressed concrete wind-turbine tower in circular cross-section. Eng. Struct. 2021, 227, 111403. [Google Scholar] [CrossRef]
  6. Jay, A.; Myers, A.T.; Torabian, S.; Mahmoud, A.; Smith, E.; Agbayani, N.; Schafer, B.W. Spirally welded steel wind towers: Buckling experiments, analyses, and research needs. J. Constr. Steel Res. 2016, 125, 218–226. [Google Scholar] [CrossRef] [Green Version]
  7. Singh, A. Concrete construction for wind energy towers. Indian Concr. J. 2007, 81, 43–49. [Google Scholar]
  8. Seidel, M. Experiences with two of the world’s largest wind turbine towers. In Proceedings of the 2003 EWEC European Wind Energy Conference and Exhibition, Madrid, Spain, 6–19 June 2003; pp. 16–19. [Google Scholar]
  9. Kaveh, A.; Ghazaan, M.I. Meta-Heuristic Algorithms for Optimal Design of Real-Size Structures; Springer: Cham, Switzerland, 2018; pp. 5–6. [Google Scholar]
  10. Negm, H.M.; Maalawi, K.Y. Structural design optimization of wind turbine towers. Comput. Struct. 2000, 74, 649–666. [Google Scholar] [CrossRef]
  11. Uys, P.; Farkas, J.; Jarmai, K.; Van Tonder, F. Optimisation of a steel tower for a wind turbine structure. Eng. Struct. 2007, 29, 1337–1342. [Google Scholar] [CrossRef]
  12. Nicholson, J.C. Design of Wind Turbine Tower and Foundation Systems: Optimization Approach; The University of Iowa: Iowa City, IA, USA, 2011. [Google Scholar]
  13. Nicholson, J.C.; Arora, J.S.; Goyal, D.; Tinjum, J.M. Multi-Objective Structural Optimization of Wind Turbine Tower and Foundation Systems using Isight: A Process Automation and Design Exploration Software. In Proceedings of the 10th World Congress on Structural and Multidisciplinary Optimization, Orlando, FL, USA, 19–24 May 2013; pp. 1–10. [Google Scholar]
  14. Ma, H.; Meng, R. Optimization design of prestressed concrete wind-turbine tower. Sci. China Technol. Sci. 2014, 57, 414–422. [Google Scholar] [CrossRef]
  15. Oest, J.; Sandal, K.; Schafhirt, S.; Stieng, L.E.S.; Muskulus, M. On gradient-based optimization of jacket structures for offshore wind turbines. Wind Energy 2018, 21, 953–967. [Google Scholar] [CrossRef]
  16. Chen, J.; Li, J.; He, X. Design optimization of steel–concrete hybrid wind turbine tower based on improved genetic algorithm. Struct. Des. Tall Spec. Build. 2020, 29, e1741. [Google Scholar] [CrossRef]
  17. Sahib, N.M.; Hussein, A. Particle Swarm Optimization in Managing Construction Problems. Procedia Comput. Sci. 2019, 154, 260–266. [Google Scholar] [CrossRef]
  18. Poitras, G.; Lefrançois, G.; Cormier, G. Optimization of steel floor systems using particle swarm optimization. J. Constr. Steel Res. 2011, 67, 1225–1231. [Google Scholar] [CrossRef]
  19. Ye, J.; Hajirasouliha, I.; Becque, J.; Eslami, A. Optimum design of cold-formed steel beams using Particle Swarm Optimisation method. J. Constr. Steel Res. 2016, 122, 80–93. [Google Scholar] [CrossRef] [Green Version]
  20. Luo, L.; He, W.; Zhang, X. PSO-Based Approach for Buckling Analysis of Shell Structures with Geometric Imperfections. Math. Probl. Eng. 2019, 2019, 1–8. [Google Scholar] [CrossRef] [Green Version]
  21. Xu, J.; Zhang, T.-Y.; Huang, W.; Hu, M.-Y.; Qin, J.-W.; Zu, X.-C. Active control for machinery equipment induced structural vibration using H∞ criterion and PSO technique. Eng. Rev. 2019, 39, 21–28. [Google Scholar] [CrossRef]
  22. Tsiptsis, I.N.; Liimatainen, L.; Kotnik, T.; Niiranen, J. Structural optimization employing isogeometric tools in Particle Swarm Optimizer. J. Build. Eng. 2019, 24, 100761. [Google Scholar] [CrossRef]
  23. Moradi, S.; Vosoughi, A.R.; Anjabin, N. Maximum buckling load of stiffened laminated composite panel by an improved hybrid PSO-GA optimization technique. Thin-Walled Struct. 2021, 160, 107382. [Google Scholar] [CrossRef]
  24. Kaveh, A.; Eslamlou, A.D. Metaheuristic Optimization Algorithms in Civil Engineering: New Applications; Springer: Cham, Switzerland, 2020; pp. 24–34. [Google Scholar]
  25. Niu, J. Research on the Structural Performance of Prestressed Concrete-Steel Hybrid Wind Turbine Tower. Master’s Thesis, Hunan University, Changsha, China, 2014. [Google Scholar]
  26. Chen, X. Static loads and dynamic loads of wind turbine tower. Wind Power Gener. 1989, 3, 44–49. [Google Scholar]
  27. Zhao, W.; Cao, P.; Chen, J. The Research of Load Calculation Method and Loads Combination about Wind Turbine Tower. Spec. Struct. 2020, 4, 80–83. [Google Scholar]
  28. SAC. GB50009-2012: Load Code for the Design of Building Structures; Standardization Administration of China: Beijing, China, 2012.
  29. Dai, K.; Wang, Y.; Huang, Y.; Zhu, W.D.; Xu, Y.F. A Modified Stochastic Subspace Identification Method for Estimating Natural Frequencies. In Proceedings of the ASME 2016 International Mechanical Engineering Congress and Exposition, Phoenix, Arizona, USA, 11–17 November 2016. [Google Scholar]
  30. Ma, H.; Zhang, D. Seismic Response of a Prestressed Concrete Wind Turbine Tower. Int. J. Civ. Eng. 2016, 14, 1–11. [Google Scholar] [CrossRef]
  31. SAC. GB 50011-2010: Code for Seismic Design of Buildings; Standardization Administration of China: Beijing, China, 2010.
  32. LaNier, M.W. LWST Phase I Project Conceptual Design Study: Evaluation of Design and Construction Approaches for Economical Hybrid Steel/Concrete Wind Turbine Towers; 28 June 2002–31 July 2004; National Renewable Energy Lab.: Golden, CO, USA, 2005. [Google Scholar] [CrossRef] [Green Version]
  33. He, Y.-S.; Wang, J.; Zhao, H.-Y.; Li, Z.-L.; Xing, K.; Yao, S.; Zeng-Jun, H. Research of load calculation and load combination for wind turbine generator system of beach-shallow sea. Build. Sci. 2012, 120–127. [Google Scholar]
  34. SAC. GB 50051-2013: Code for Design of Chimneys; Standardization Administration of China: Beijing, China, 2013.
  35. SAC. GB 50017-2017: Code for Design of Steel Structure; Standardization Administration of China: Beijing, China, 2017.
  36. Agbayani, N.A. A Technical Overview of ASCE/AWEA RP2011: Recommended Practice for Compliance of Large Land-Based Wind Turbine Support Structures. In Proceedings of the Structures Congress 2014, Boston, MA, USA, 3–5 April 2014; pp. 1759–1770. [Google Scholar]
  37. Justus, C.; Hargraves, W.; Mikhail, A.; Graber, D. Methods for estimating wind speed frequency distributions. J. Appl. Meteorol. 1978, 17, 350–353. [Google Scholar] [CrossRef]
  38. Huo, T.; Tong, L. An approach to wind-induced fatigue analysis of wind turbine tubular towers. J. Constr. Steel Res. 2020, 166, 105917. [Google Scholar] [CrossRef]
  39. SAC. GB 50135-2006: Code for Design of High-Rising Structures; Standardization Administration of China: Beijing, China, 2007.
  40. SAC. GB 50010-2010: Code for Design of Concrete Structures; Standardization Administration of China: Beijing, China, 2010.
  41. Grünberg, J.; Göhlmann, J. Concrete Structures for Wind Turbines; John Wiley & Sons: Berlin, Germany, 2013. [Google Scholar]
  42. Liu, X. Introduction to Artificial Intelligence: Approaches and Systems; National Defense Industry Press: Beijing, China, 2008. [Google Scholar]
  43. Zhao, Y.; Fang, Z. Particle swarm optimization algorithm with weight function’s learning factor. J. Comput. Appl. 2013, 33, 2265–2268. [Google Scholar] [CrossRef]
  44. Bruck, M.; Sandborn, P.; Goudarzi, N. A Levelized Cost of Energy (LCOE) Model for Wind Farms that Includes Power Purchase Agreement (PPA) Energy Delivery Limits. Renew. Energy 2016, 122, 131–139. [Google Scholar] [CrossRef]
  45. Myhr, A.; Bjerkseter, C.; Ågotnes, A.; Nygaard, T.A. Levelised cost of energy for offshore floating wind turbines in a life cycle perspective. Renew. Energy 2014, 66, 714–728. [Google Scholar] [CrossRef] [Green Version]
  46. Khojasteh, H.; Noorollahi, Y.; Tahani, M.; Masdari, M. Optimization of Power and Levelized Cost for Shrouded Small Wind Turbine. Inventions 2020, 5, 59. [Google Scholar] [CrossRef]
  47. Product Introduction of XE93-2000. Available online: http://wp.china-nengyuan.com/member_product/21420.html (accessed on 20 April 2021).
Figure 1. Computational locations for V 1 and V 2 .
Applsci 11 08683 g001
Figure 2. Simplified tower model.
Applsci 11 08683 g002
Figure 3. Flow chart of cost evaluation for the PCSH tower.
Applsci 11 08683 g003
Figure 4. Design parameters of the tower.
Applsci 11 08683 g004
Figure 5. Flow chart of the proposed PUPSO.
Applsci 11 08683 g005
Figure 6. Optimization of costs of PCSH wind tower as a function of iteration number.
Applsci 11 08683 g006
Figure 7. The optimization ratio of variables.
Applsci 11 08683 g007
Figure 8. The utilization ratio for constraints along the tower.
Applsci 11 08683 g008
Table 1. Load combinations.
Load CombinationsLoad Factors
Ultimate 1 1.4 × D L + 1.4 × 0.2 × W L + 1.3 E Q
Ultimate 2 1.0 × D L + 1.4 × W L
Service 1 1.0 × D L + 0.2 × W L + 1.0 × E Q
Service 2 1.0 × D L + 1.0 × W L
Table 2. The comprehensive cost of LCOE.
TitleItemUnit Price
Direct costConcrete600 yuan/m3
Reinforcement5500 yuan/ton
Prestressing steel strand14,390 yuan/ton
Sheeting50 yuan/m2
Timber support15 yuan/m2
Metallic pipe679 yuan/100 m
Flange40,000 yuan/pcs
Q3451000 yuan/ton
Labor cost and mechanical costReinforcement1500 yuan/ton
Prestressing steel strand1000 yuan/ton
Sheeting300 yuan/100 m2
Timber support15 yuan/m2
concrete60 yuan/m3
Project conditionInstalled capacity50 MW
Equipment fee5200 yuan/kW
Other cost1200 yuan/kW
Annual cost during operation80 yuan/kW (Year 1–5)
120 yuan/kW (Year 6–20)
construction period1 a
Loan-to-value ratio80%
Depreciation life20 a
Ratio of remaining value5%
Length of maturity15 a
Interest rate4.9%
Table 3. Variables and their ranges.
VariableRange
Length of the j s t steel section   H s j (mm)500–70,000
Thickness of the j s t steel section t s j (mm)10–25
Outer diameter of the top end of the j s t steel section D s t j 2686 (j = 1)
D s b j 1 (j > 1)
Outer diameter of the bottom end of the j s t steel section D s b j > D s t j
Steel segments1–3
Length of the concrete section H c 7500– 77 , 000
Thickness of the top end of the concrete part t c t (mm)180–500
Thickness of the bottom end of the concrete part t c b (mm) t c t -500
Outer diameter of the top end of the concrete part D c t (mm)-
Outer diameter of the bottom end of the concrete part D c b (mm) > D c t
Area of prestressed reinforcement (mm2)31,150–62,300
Table 4. Parameters of the wind turbine.
Wind Turbine ParametersValue
Generator modelXE93-2000
Rated power2 MW
Rotor diameter93.4 m
Nacelle and hub weight80 t
Distance from gravitational center of the nacelle and hub to the center of tower3000 mm
Weight of blades48.5 t
Distance from gravitational center of the blades to the center of tower4864 mm
IEC wind zoneIECIIIA
Annual average wind speed7.5 m/s
Cut-in wind speed3 m/s
Nominal wind speed11 m/s
Cut-out wind speed25 m/s
Extreme wind speed52.5 m/s
Rotational speed23 rpm
Maximum turbulence intensity0.18
Table 5. Parameters of the PUPSO approach.
ParameterValue
w m a x 0.9
w m i n 0.4
M 50
N 30
Penalty term0.5
ζ 0.3
Table 6. LCOE measurement.
CategoryEquivalent Available Duration (h)Electricity Price in 2019 (Yuan/kWh)LCOE for the Benchmark PCSH Tower (Yuan/kWh)LCOE for the Optimized PCSH Tower (Yuan/kWh)
I28500.340.36130.3474
II26000.390.38740.3722
III25000.430.39930.3835
IV20000.520.47690.4571
Table 7. PCSH tower dimension before and after optimization.
TowerVariableBefore OptimizationAfter Optimization
Steel tube segmentSegment31
t s 1 (mm)1410
D s t 1 (mm)26862686
D s b 1 (mm)34853296
H s 1 (mm)21,50022,000
t s 2 (mm)18-
D s t 2 (mm)3485-
D s b 2 (mm)4046-
H s 2 (mm)20,000-
t s 3 (mm)20-
D s t 3 (mm)4046-
D s b 3 (mm)4400-
H s 3 (mm)20,000-
PC segment t c t (mm)500270
t c b (mm)500285
H c (mm)16,00055,500
D c t (mm)48783549
D c b (mm)69005800
Prestressed duct number3636
Prestressed reinforcement8 Φ S 1 × 7 (d = 15.2 mm)7 Φ S 1 × 7 (d = 12.7 mm)
Prestressed reinforcement area (mm2)40,32024,872
Table 8. The maximum utilization ratio of PCSH tower before and after optimization.
TowerMaximum Utilization RatioBefore OptimizationAfter Optimization
Steel segmentLocal buckling0.450.84
Overall stability0.400.52
Compressive load-carrying capacity0.530.76
Shear load-carrying capacity0.150.37
Torsion load-carrying capacity0.000750.0013
Combined load-carrying capacity0.290.67
Fatigue0.410.52
PC segmentLoad-carrying capacity of windward side0.0640.34
Load-carrying capacity of leeward side0.480.25
Combined load-carrying capacity0.0910.45
Fatigue of windward side0.560.94
Fatigue of leeward side0.210.48
Fatigue of prestressing bar0.930.91
Table 9. Natural frequency comparison of different tower.
TowerFrequency (Hz)
Before optimization0.45
After optimization0.56
Table 10. Weight comparison of different tower.
WeightBefore OptimizationAfter Optimization
Steel segment (t)9016
PC segment (t)338528
Total (t)428544
Table 11. Comparison of computational time with two computing method.
Cycle NumberPSO Computation (s)UPSO Computation (s)PUPSO Computation (s)
555,07444,91227,845
1099,352107,55352,427
Table 12. Comparison of computational time with three computing methods.
PSO Computation (s)UPSO Computation (s)PUPSO Computation (s)
432,759451,480212,801
Publisher’s Note: MDPI stays neutral with regard to jurisdictional claims in published maps and institutional affiliations.

