Article

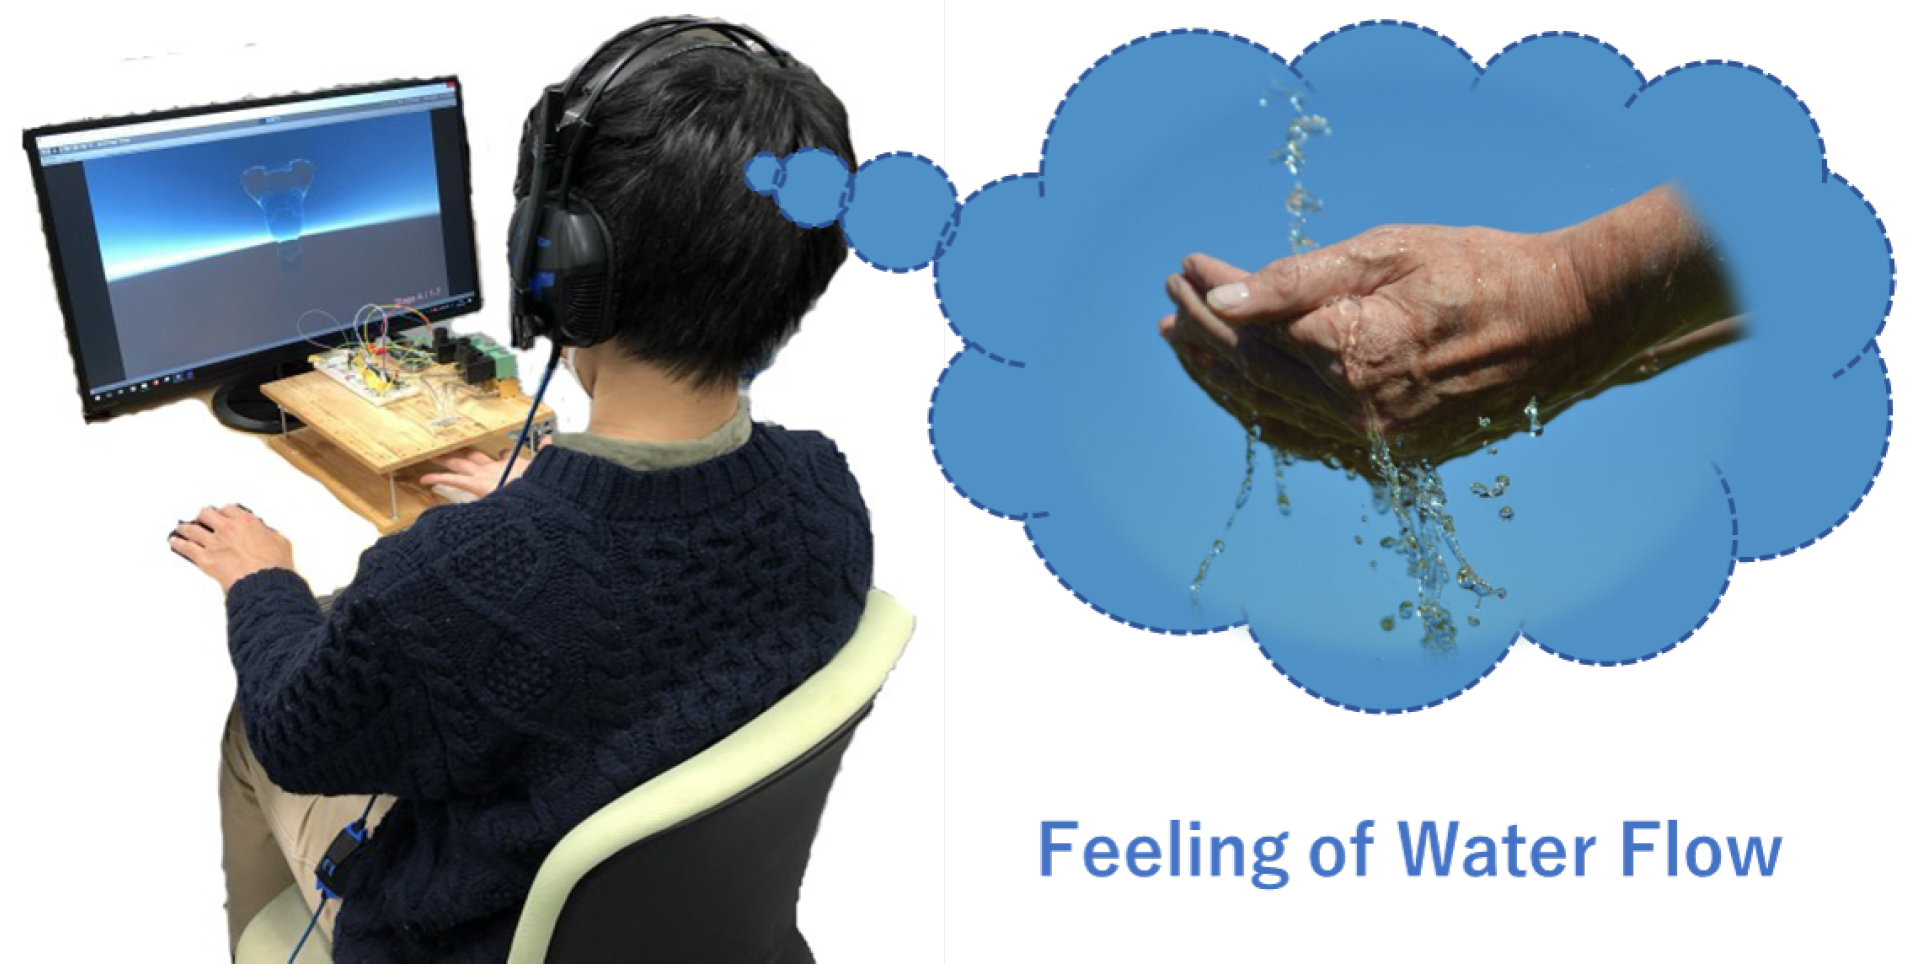
FlowHaptics: Mid-Air Haptic Representation of Liquid Flow

1
Graduate School of Information Science and Technology, Osaka University, Osaka 565-0871, Japan
2
Faculty of Engineering, Information and Systems, University of Tsukuba, Tsukuba 305-8573, Japan
*
Author to whom correspondence should be addressed.
Appl. Sci. 2021, 11(18), 8447; https://doi.org/10.3390/app11188447
Submission received: 20 July 2021 / Revised: 30 August 2021 / Accepted: 3 September 2021 / Published: 11 September 2021
(This article belongs to the Special Issue Extended Reality: From Theory to Applications)

Abstract

:
Water is an essential substance for humans in their daily lives. There are many opportunities for us to come in contact with water, such as cooking, bathing, and swimming. However, few studies have reproduced the sensation of water touching the skin. This study aims to propose a novel midair haptic device, named FlowHaptics, that reproduces the feeling of the force of flowing water over human fingers using multiple air jets. We first estimated the temporal pressure distribution change of water in two-dimensional space using machine-learning-accelerated fluid simulation. We controlled the airflow based on the pressure distribution change obtained from the fluid simulation to reproduce the feeling of flowing water over the fingers using our proposed device, which can control multiple air jets in real time. We performed a psycho-physical evaluation of different flow velocities and a subjective evaluation of different velocity profiles. We found that FlowHaptics reliably created the illusion of the pressure distribution of flowing water on the fingers where the flow velocity could be distinguished within the range of 8.42% to 13.05%, and our estimated flow velocity profile with the configuration of three air jets felt more similar to flowing water when compared to a constant velocity profile according to the users.

1. Introduction

Water is one of the most common substances on the Earth [1], and we regularly interact with it in our daily lives. Besides consuming it as a beverage, there are several other opportunities for us to interact with water, such as cleaning, cooking, swimming, bathing, and showering. Despite the rapid development of realistic water graphics [2,3,4] used in Virtual Reality (VR), animation, and the entertainment industry, research that reproduces the force and tactile sensation of water flowing over the skin has not been conducted so far. If we can reproduce the tactile sensation of flowing water, we expect a better immersive experience for the user.
In order to reproduce the sensation of flowing water, using actual water is one option. However, this has several drawbacks such as wetting of the skin and the risk of an electronic device coming in contact with the water and becoming damaged. For flexibility and for safety reasons, it is preferable to use a different substance to reproduce the sensation of flowing water. It is difficult to reproduce the sensation of flowing water with existing conventional nonfluid haptic methods such as ultrasonic [5] or vibratory [6] stimuli. However, the flow of water can be replicated with another fluid. Therefore, we could reproduce the sensation of flowing water using multiple air jets.
In this paper, we introduce FlowHaptics, a haptic device aimed at reproducing the sensation of flowing water over the fingers by using multiple air jets, presented in Figure 1. In order to estimate the force acting on each finger, the simulation was performed in 2D space using fluid simulation with machine learning to accelerate the simulation so that the flow of the fluid could be adapted in real time. To verify the concept, we considered a situation in which the water flows from above the finger. The velocity profile, obtained from the fluid simulation, was used as the input to control the flow rate of the haptic device in real time. Our FlowHaptics was designed so that it can control the velocity of the airflow from three air jets, which can accentuate the frictional flow on the sides of the fingers.

2. Related Works

Although there is existing previous research on noncontact approaches to recreating tactile sensations such as the laser-induced evocation of tactile feedback [7] or using acoustic waves [5] and airflow [8,9,10,11] to deliver tactile feedback to the skin, there is not much research exploring the haptic representation of fluid flow. Saito et al. [12] conducted a sensory evaluation of the frictional force generated in the direction parallel to the skin surface when the skin touches water. As a result, it was shown that the frictional force generated in the direction parallel to the skin surface was characteristic of the feeling of water. In this research, we used this finding to not only produce the force in the vertical direction, but also the force parallel to the finger on both sides of the finger.
Iwata et al. [13] proposed the general concept of the haptic representation of the scalar, vector, and tensor fields. Baxter et al. [14] proposed a haptic feedback system with the fluid flow field generated by simulation.Forces can be generated with haptic devices, such as through a stylus, e.g., the PHANToM [15], which can generate forces of multiple degrees of freedom on the stylus tip. This successfully reproduces the reaction force of the fluid in real time, but the presentation of the reaction force is transmitted to the user through a graspable device. Furthermore, since the reaction force is presented only at one point of the device, it is difficult to experience fine reaction forces. We believe that users can directly experience the reaction force through the skin and that the reactive force should be presented in a distributed manner in order to have a better immersive experience. Yano et al. [16] created a glove-type device that can locally present vibrations induced by 17 motors to the fingers, palms, and back of the hand to simulate the perception of the flow of the wind. They performed a test on the ability to discriminate the wind direction by changing the amplitude and frequency of the vibration of each motor. The wind direction could be distinguished if there was a difference of more than eight degrees. Barreiro et al. [17] demonstrated an ultrasound rendering of a hand interacting with fluids. The system simulated an air-like flow and produced a pressure distribution that was suitable for an ultrasound haptic display.
Instead of just producing tactile feedback on the skin, this research is focused on reproducing the sensation of rapidly falling water on the fingers without the user grasping or wearing a device. The sensation of flowing water is defined as a complex feeling composed of the sensation of force, which is the magnitude of the water’s force on the skin, and the tactile sensation, which is the skin friction that occurs when flowing water passes over the fingers. In this paper, the pressure sensation of falling water hitting the fingers was produced using multiple air jets.

3. Methodology

3.1. Concept

When any fluid acts on any object, as presented in Figure 2, the drag force and skin friction act in opposition to the relative motion of the object with respect to the surrounding fluid flow [18]. When humans touch a fluid, we also expect the sensation of the fluid flow to involve both the drag force and skin friction at the same time. The skin friction especially, i.e., the shear force, arises from the friction of the fluid against the “skin” of the object while the fluid passes, and we believe this should play an important role in the sensation of fluid flow. According to the above hypothesis, we utilized wind flow to represent flowing water, as both air and water are fluids; however, air has less mass than water. Therefore, we added an additional air jet to emphasize the skin friction acting on both sides of the fingers to produce a more realistic sensation of flowing water.

3.2. Theory

The value of the magnitude of the force applied to the skin by the air jets using the device should be accurate. The magnitude F of the force that the surface receives from the fluid when the fluid collides with the surface is described as:
F = ρ Q V
where ρ is the density of the fluid, Q is the flow rate, and V is the flow velocity. The flow rate Q is calculated by using the flow velocity V if the flow cross-section S is assumed to be constant such that Q = S V , then:
F = ρ S V 2
In order to express the magnitude of the force applied by another fluid on the surface by using the air jet, the density and velocity of the fluid are replaced by those of the air jet. This results in:
ρ f S V f 2 = ρ a S V a 2
V a = V f ρ f ρ a
where the density and velocity of the fluid are described as ρ f and V f , respectively, while those of the air jet are expressed as ρ a and V a , respectively. Since ρ f and ρ a are constants, if it is possible to estimate the velocity of the fluid, then the same force can be produced by multiplying the wind speed by the proportionality constant.

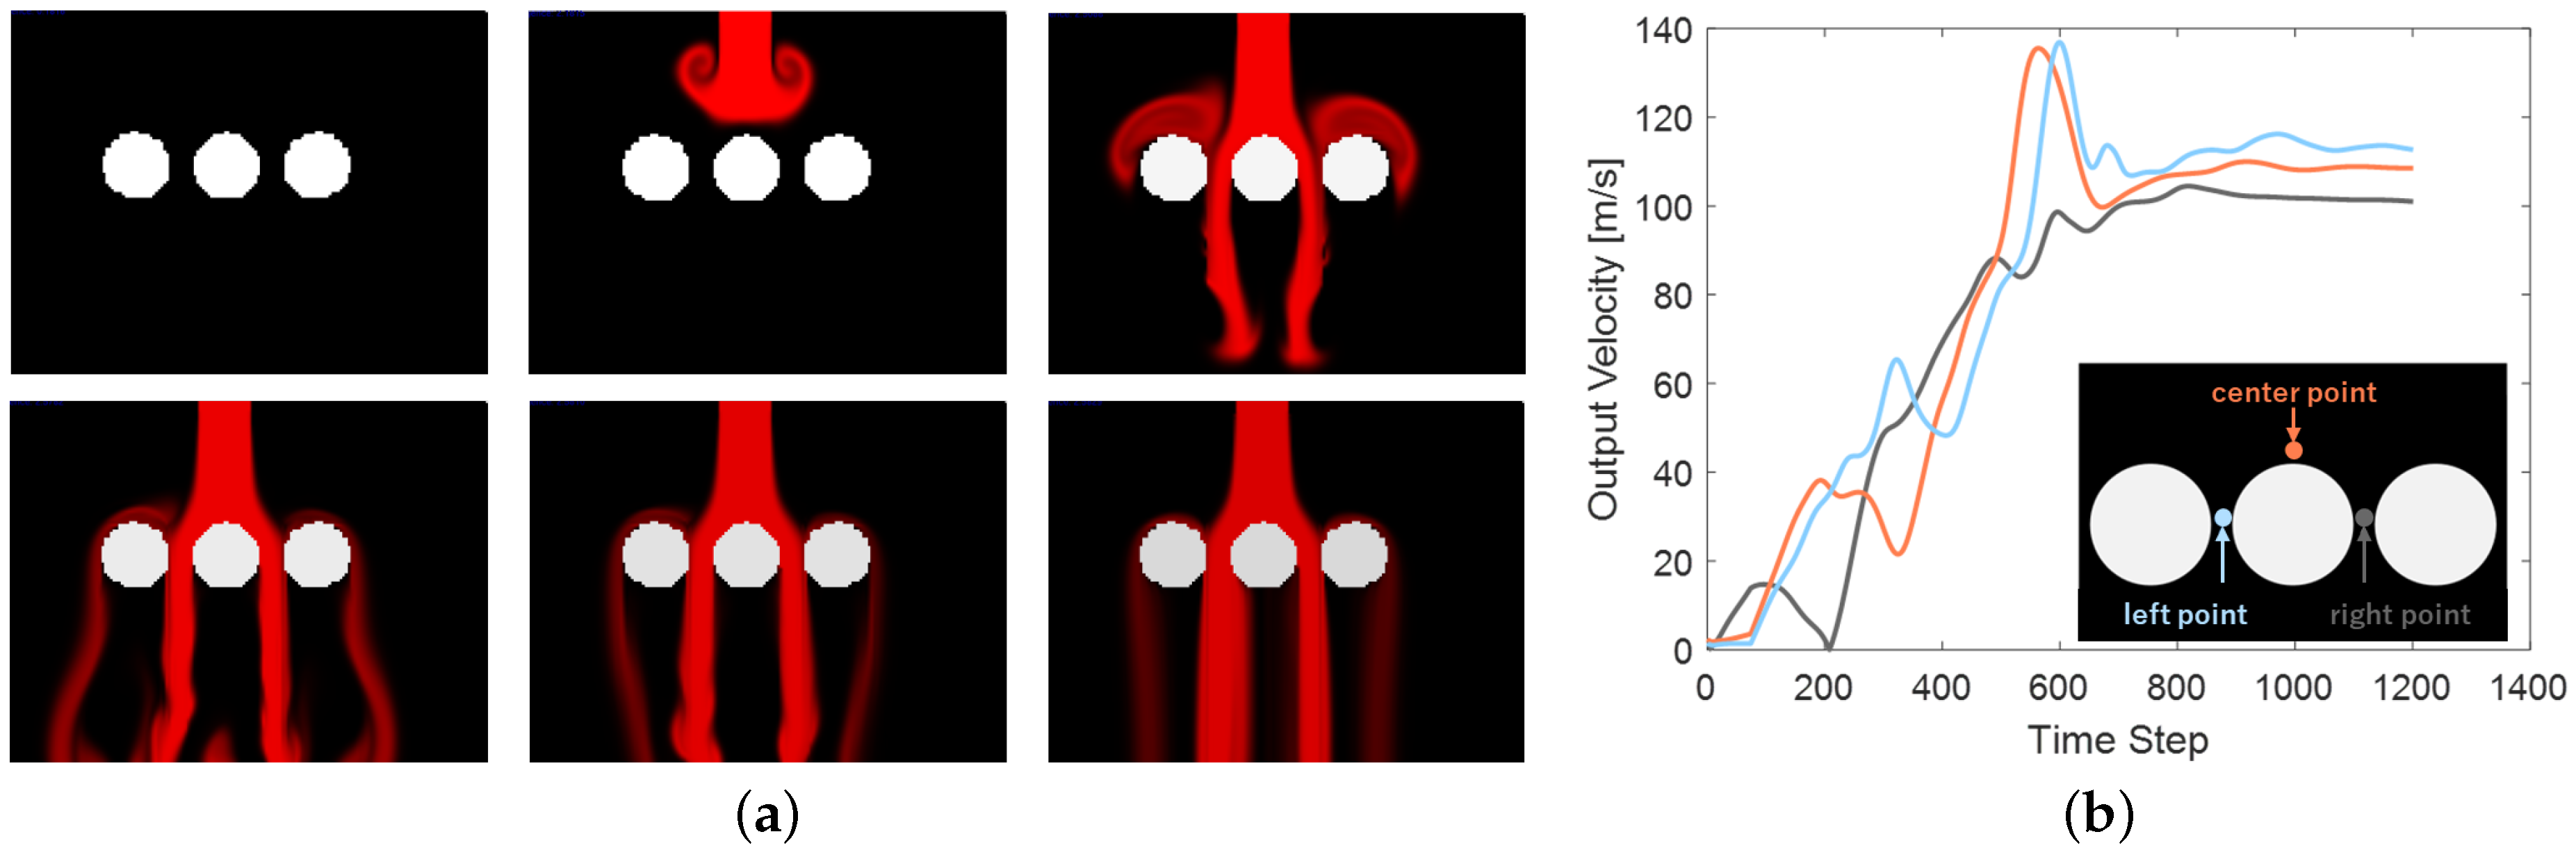
3.3. Fluid Flow Simulation

The magnitude of the force that the skin receives from flowing water is proportional to the square of the velocity. Moreover, since the pressure distribution and force change with time, we should be able to change the value for the velocity of the flowing water in real time.
The methods to describe the motion of a fluid can be divided into the Euler method [19] and the Lagrange method [20]. The Euler method is a method in which a space is divided into regular grids, and the physical quantity of the fluid is updated every time step, while each regular grid has its own physical quantity such as the flow velocity. In the Lagrange method, a fluid is expressed as a set of particles or moving grids, and the position of each particle/grid is tracked every time step. Since we would like to estimate the velocity in real time, we selected the Euler method approach. Though there are several Computational Fluid Dynamics (CFD) simulation software based on the Euler method and the Navier–Stokes equation, such as OpenFOAM [21] or ANSYSCFX [22], this method is computationally expensive and cannot be performed in real time for velocity estimation.
In this research, we used FluidNet [4], which is a machine-learning-accelerated fluid simulation software using the Euler method to estimate the flow velocity of a fluid at the antinode and both sides of the finger.
The input data were derived using a 2D finger cross-section model to generate the training fluid data for the simulation. The output data were the real-time estimated fluid data. In this research, in order to generalize the prediction of the airflow in any environment, we used a pretrained model from FluidNet, which was derived from 50 standard models from the NTU 3D Model Database [23] using random scaling, rotation, and translation of the patterns in the simulation. As a result, the pretrained model can perform the general prediction of the fluid flow for any model. The fluid simulation with one finger and with three fingers is presented in Figure 3a and Figure 4a, respectively.
Since we expected our application to be able to estimate the flow in real time based on different finger configurations, we utilized a machine-learning-based approach over the traditional physics simulation approach. The outcome from the simulation was not perfectly symmetric because the flow from FluidNet is an estimated version of the flow from the physics simulation approach. This was a tradeoff between the speed and accuracy of the machine-learning-based flow estimation approach. Furthermore, the FluidNet model we used also included wavelet turbulence when predicting the flow so that the flow result was similar to the outdoor environment where air disturbance is expected to occur. As a result, we could obtain the maximum and minimum values of the velocity of the flow on the left, right, and center parts of each finger. Based on the normalized value of the estimated flow velocity, the air jet flow was produced.
In FluidNet’s 2D simulation, the virtual space is pixelized, and information on the flow velocity, volume, and pressure of the fluid is held for each pixel. The simulation was performed on a PC with Ubuntu 16.04 LTS with a GTX 1080 Nvidia Graphic Card. After training, the fluid simulation could be adapted based on the participants’ interaction in real time.

3.4. Device Configuration

The system configuration diagram is shown in Figure 5. A Takanei EARTH MAN air compressor was used to store compressed air at 0.88 MPa in a maximum volume of 39 L. The output pressure could be freely adjusted by the dial attached to the compressor. The air compressor was connected to the air separator by air tubes. Each tube was connected to an ASCO proportional control solenoid valve so that the flow rate was controlled by applying a voltage of 0–24 V to the proportional control valve. Then, the compressed air was ejected via the air nozzle over the fingers.

3.5. Flow Control System

A flow control valve was used to produce the airflow based on the estimated flow velocity obtained from the fluid simulation. The flow control valve was operated by applying a direct current voltage. On the PC, eleven control signals are transmitted to the Arduino microcontroller using serial communication. Specifically, the high-order bit was used as a control section for stopping and starting the operation. The central nine bits were divided into three signals. Each of the three signals represents PWM values from 0 to 255, which are the minimum and maximum flow velocity values. The signal is sent directly to the right, center, and left air control valves. The low-order bit is a terminating character. The result of the velocity control of the airflow is presented in Figure 6.
To validate the output airflow, we used a pressure sensor to measure the output from each tube. The output pressure was converted to the output flow velocity using Equation (2). The flow velocity for each pattern for the one-finger condition and three-finger condition is shown in Figure 7 and Figure 8, respectively.

4. Experiment 1: Flow Sensation with Velocity Change

4.1. Experimental Conditions and Settings

To investigate the performance of the pressure representation of FlowHaptics, we conducted psycho-physical evaluations of the flow sensation. The experimental setup is presented in Figure 9a. As presented in Figure 9b, the device has 3 air nozzles with 1 cm between each nozzle, and the distance from each nozzle to the human finger is 2 cm. During the experiment, we adjusted the output value of the pressure from the compressor from 0.48 MPa to 0.64 MPa. We controlled the auditory and visual input to the subject by having them wear headphones while a monitor presented a visualization of flowing water, thereby reducing the influence of other auditory and visual stimuli. Furthermore, the video on the front monitor presented the same image as the airflow that was produced so that there was no influence from the visual stimulus. We had 10 participants in total. The experiment conditions were conducted as follows:
  • 1F: the condition in which only the middle finger was presented to the device;
  • 3F: the condition in which the index finger, middle finger, and ring finger were presented to the device.
The shapes of the fingers in 1F and 3F during the experiment are shown in Figure 9c,d, respectively. Furthermore, there were two conditions for the air ejection method as follows:
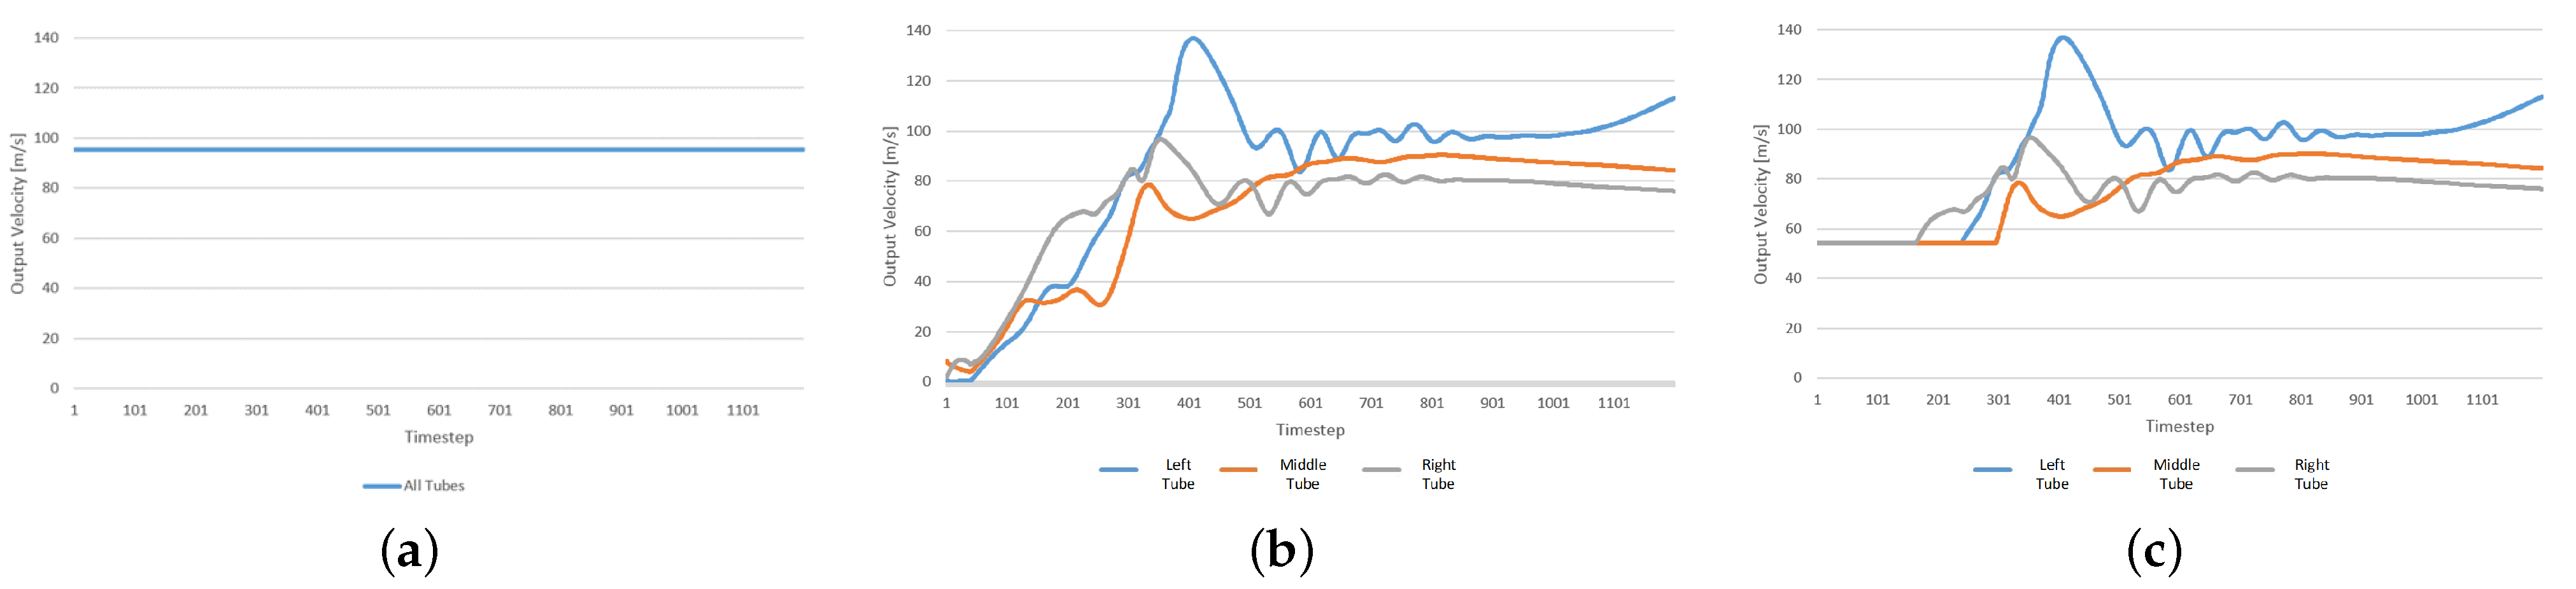
  • 1T: the condition in which FlowHaptics the air was ejected only from the center nozzle;
  • 3T: the condition in which FlowHaptics the air was ejected from all 3 nozzles.
Hence, we had four conditions, which were 1 F / 1 T , 1 F / 3 T , 3 F / 1 T , and 3 F / 3 T , for each participant. We analyzed the discrimination performance realized by the proposed device with a constant method. The standard stimulus was set to 95.58 m/s, and we had five comparison stimuli with estimated wind speed values of 54.3, 74.94, 95.58, 114.92, and 136.86 m/s. In each condition, a pair of standard stimuli and one comparison stimulus were presented in a random order, and the participants reported whether the former or latter stimulus felt stronger. A total of 15 comparisons, that is 3 times for the 5 compared stimuli, were made for each condition. In total, 1 participant performed 60 trials of the discrimination sensitivity experiment, that is 15 comparisons for the 4 conditions, i.e., 1 F / 1 T , 1 F / 3 T , 3 F / 1 T , and 3 F / 3 T .

4.2. Results and Discussions

Figure 10 shows the result of fitting the psychometric curves to the probabilities using a normalized cumulative distribution function. To evaluate the discrimination performance quantitatively, we calculated the Just-Noticeable Difference (JND) as half of the difference threshold levels between the inverse of the curves at 0.25 and 0.75.
From the fitted curves, we could divide the subjects into two groups, which were those who successfully discriminated the output pressure (solid lines) and those who guessed the majority of the stimuli (dashed lines). More than 80% and 70% of the participants were able to successfully discriminate the output pressure using our novel device with one tube and three tubes, respectively. This result is in agreement with other types of haptic devices [24,25], for which a small number of participants were not able to discriminate the sensation.
From those who successfully discriminated the output pressure, we found that the JNDs were 8.88%, 10.80%, 8.42%, and 13.05% for 1F/1T, 1F/3T, 3F/1T, and 3F/3T, respectively. The box plot of the JND for each case is shown on the right side of Figure 10a–d. Based on the JND results for 1F/3T and 3F/3T compared to the JND results for 1F/1T and 3F/1T, it seemed that it was more difficult for the subjects to discriminate the output of the three-tube condition (3T) compared to the one-tube condition (1T). However, the JND results for 3F/1T were about the same as for 1F/1T, and the JND results for 3F/3T were higher than for 1F/3T. Compared with the one-finger condition (1F), the greater sensing area in the three-finger condition (3F) did not strongly affect the discrimination, as the greater sensing area in 3T significantly resulted in participants feeling confused about the difference in flow velocity when compared to 1T.
From this analysis, we can confirm that our developed controlled air jet device is able to sufficiently reproduce the feeling of fluid flow such that a human can classify the different flow velocities.

5. Experiment 2: Different Velocity Profiles

5.1. Experimental Conditions and Settings

In order to investigate how closely the proposed system can emulate the sensation of flowing water that matches human perception, we performed a subjective evaluation based on 3 velocity profiles, which were:
  • Constant: the velocity profile of controlling the air jet at a constant velocity (95.58 m/s) for a certain time. The conditions 1F and 3F are presented in Figure 7a and Figure 8a, respectively;
  • FlowEst1: the velocity profile of controlling the air jet of each control valve using the estimated flow velocity transitions with FluidNet. The velocity profiles of the conditions 1F and 3F are presented in Figure 7b and Figure 8b, respectively;
  • FlowEst2: the velocity profile of the air jets only presenting a flow velocity that exceeded the threshold value (54.3 m/s) among the estimated flow velocity changes by FluidNet. The velocity profiles of 1F and 3F are presented in Figure 7c and Figure 8c, respectively.
Similar to Experiment 1, we applied 3 velocity profiles with 4 conditions; 1F/1T, 1F/3T, 3F/1T, and 3F/3T, respectively. Each trial was repeated 3 times. Therefore, we had 3 × 4 × 3 = 36 trials for each participant. After each trial, we asked the subjects to respond to the question, “How closely did the haptic rendering match your sensation of the flowing water?” using a 7-point Likert scale (1—not at all realistic, 7—highly realistic). We had 8 participants in total.
Note that we had an additional condition, FlowEst2, because we hypothesized that the participant would feel the difference between the exact estimation (from low to high velocity) in FlowEst1 and when the participant experienced only a high velocity (more than 54.3 m/s) in FlowEst2.

5.2. Results and Discussions

We present our results in terms of the box plots shown in Figure 11. We used a one-way repeated-measures analysis of variance (ANOVA) to analyze the data, followed by a paired t-test with Bonferroni correction to find any significant differences.
In the case of 1F, presented in Figure 11a, the paired t-test showed a significant difference between the constant velocity profile and the FlowEst2 profile in the 1F/3T condition with the rate ( t = 2.39 , p < 0.05 ). In the case of 3F, presented in Figure 11b, we did not find strong support between each condition as no significant difference was observed. However, by breaking down the analysis, we looked at the highest score among each velocity profile, presented in Figure 12, and we found that the participant preferred the FlowEst1 and FlowEst2 rendering techniques over the constant velocity profile by over 50% in all conditions. FlowEst1 and FlowEst2 with the dynamic change of the flow velocity were considered realistic for some participants, but were considered too complex for some participants. As shown in 1F1T, 3F1T, and 3F3T, some participants preferred the Constant condition over FlowEst1 and FlowEst2 because of its simplicity. Especially in 3F3T, FlowEst1 was considered to be the most difficult to interpret for a number of participants; therefore, it was significantly lower than in the other three conditions. As a result, in 3F3T, subjects who preferred a realistic rendering would choose FlowEst2 over FlowEst1, and subjects who preferred a simple rendering would choose the Constant condition. We also did not find a statistical difference between the other conditions, but we did receive positive feedback from the participants. Example comments from the participants were “Though there is no wetness, I feel flow similar to when water comes out of the tap” and “Compared to three-finger, I felt more realistic flow sensation during an experiment with one finger”, while another participant reported, “The presented flow at the fastest speed was very strong that I feel the heaviness of water”.

6. Conclusions

In this study, we proposed FlowHaptics, a midair haptic representation of flowing water using an air jet system. We developed the prototype system and focused on generating a pressure distribution on the fingers based on the velocity profile obtained from machine-learning-accelerated fluid simulation. We first evaluated the performance of FlowHaptics using a psycho-physical discrimination experiment on the flow velocity. We found that the users were capable of perceiving the different flow velocities with the JND ranging from 8.42% to 13.05%. Furthermore, we conducted a subjective evaluation experiment based on the different flow velocity profiles. We found that using our estimated flow velocity profile from the fluid simulation with our proposed configuration of three air jets, the users felt that the sensation was more similar to flowing water when compared to the constant velocity profile.

7. Limitations and Future Works

The FlowHaptics enables the design of new interactions and the midair sensation of flowing water. However, there are still limitations to our current device. Firstly, though the feeling of flowing water is composed of sensations resulting from temperature, viscosity, and pressure, including the drag force and skin friction, the current version of the proposed device tries to represent the pressure distribution via airflow velocity, so that the friction force applied when the airflow passes over the finger surface imitates flowing water. Secondly, this current study solely focused on the sensation of flowing water, not water in a static condition. Thirdly, in terms of usability, the current device is still limited to sensation at the finger. In order to produce flow sensation on another large part of the human body such as the hand, it is expected that the number of air jet tubes would need to be increased.
In the future, we would like to further develop the device so that it can represent water at different temperatures and in other forms such as static water. By integrating a water spray mechanism and temperature control device, we expect that the other components of the sensation of water such as wetness or temperature can also be realized. If we can represent these additional sensations, it will become possible to achieve a richer virtual experience.

Author Contributions

P.R. and Y.K. led the research progress, assisted with the implementation, secured funding for the research, and revised and refined the manuscript. Y.O. devised the system’s basic concept, technically constructed the system, and conducted the research and experiments. H.T. assisted with the research and revised the manuscript. All authors read and approved the final manuscript.

Funding

This research was supported in part by the Promotion of Joint International Research (Fostering Joint International Research (B)) No. 20KK0086) and JSPS KAKENHI Grant Numbers JP17H01780 and JP21H03474.

Institutional Review Board Statement

The experiment was conducted with the approval of an institutional review board (IRB) of Cyber Media Center, Osaka University, Japan.

Informed Consent Statement

Informed consent was obtained from all subjects involved in the study.

Conflicts of Interest

The authors declare no conflict of interest.

References

  1. Agency, C.I. The CIA World Factbook 2010; Skyhorse Publishing Inc.: New York, NY, USA, 2009. [Google Scholar]
  2. Mitchell, J.L. Real-time synthesis and rendering of ocean water. ATI Res. Tech. Rep. 2005, 4, 121–126. [Google Scholar]
  3. Darles, E.; Crespin, B.; Ghazanfarpour, D.; Gonzato, J.C. A Survey of Ocean Simulation and Rendering Techniques in Computer Graphics; Computer Graphics Forum; Wiley Online Library: Hoboken, NJ, USA, 2011; Volume 30, pp. 43–60. [Google Scholar]
  4. Tompson, J.; Schlachter, K.; Sprechmann, P.; Perlin, K. Accelerating eulerian fluid simulation with convolutional networks. In Proceedings of the 34th International Conference on Machine Learning, Sydney, NSW, Australia, 6–11 August 2017; pp. 3424–3433. [Google Scholar]
  5. Carter, T.; Seah, S.A.; Long, B.; Drinkwater, B.; Subramanian, S. UltraHaptics: Multi-point midair haptic feedback for touch surfaces. In Proceedings of the 26th Annual ACM Symposium on User Interface Software and Technology, St. Andrews, UK, 8–11 October 2013; pp. 505–514. [Google Scholar]
  6. Chacin, A.C.; Oozu, T.; Iwata, H. IrukaTact: Submersible Haptic Search Glove. In Proceedings of the TEI’16: Tenth International Conference on Tangible, Embedded, and Embodied Interaction, Eindhoven, The Netherlands, 14–17 February 2016; pp. 392–397. [Google Scholar]
  7. Jun, J.H.; Park, J.R.; Kim, S.P.; Bae, Y.M.; Park, J.Y.; Kim, H.S.; Choi, S.; Jung, S.J.; Park, S.H.; Yeom, D.I.; et al. Laser-induced thermoelastic effects can evoke tactile sensations. Sci. Rep. 2015, 5, 11016. [Google Scholar] [CrossRef] [PubMed] [Green Version]
  8. Sodhi, R.; Poupyrev, I.; Glisson, M.; Israr, A. AIREAL: Interactive tactile experiences in free air. ACM Trans. Graph. (TOG) 2013, 32, 134. [Google Scholar] [CrossRef]
  9. Tsalamlal, M.Y.; Ouarti, N.; Martin, J.C.; Ammi, M. Haptic communication of dimensions of emotions using air jet based tactile stimulation. J. Multimodal User Interfaces 2015, 9, 69–77. [Google Scholar] [CrossRef]
  10. Tsalamlal, M.Y.; Ouarti, N.; Ammi, M. Psychophysical study of air jet based tactile stimulation. In Proceedings of the World Haptics Conference (WHC), Daejeon, Korea, 14–17 April 2013; pp. 639–644. [Google Scholar]
  11. Lee, J.; Lee, G. Designing a Non-contact Wearable Tactile Display Using Airflows. In Proceedings of the 29th Annual Symposium on User Interface Software and Technology, Tokyo, Japan, 16–19 October 2016; pp. 183–194. [Google Scholar]
  12. Saito, R.; Suzuki, M.; Maeno, T.; Mayama, H.; Nonomura, Y. Tactile Texture and Friction Properties of Water on Artificial Skin Surfaces. Trans. Soc. Instrum. Control Eng. 2014, 50, 2–8. [Google Scholar] [CrossRef] [Green Version]
  13. Iwata, H.; Noma, H. Volume haptization. In Proceedings of the 1993 IEEE Research Properties in Virtual Reality Symposium, San Jose, CA, USA, 25–26 October 1993; pp. 16–23. [Google Scholar] [CrossRef]
  14. Baxter, W.; Lin, M.C. Haptic Interaction with Fluid Media. In Proceedings of Graphics Interface 2004; Canadian Human-Computer Communications Society, School of Computer Science, University of Waterloo: Waterloo, ON, Canada, 2004; pp. 81–88. [Google Scholar]
  15. 3D Printers, Software, Manufacturing & Digital Healthcare. 3D Systems. Available online: https://www.3dsystems.com/ (accessed on 12 June 2005).
  16. Yano, H.; Hirose, M.; Ogi, T.; Tamura, Y. Haptization of flow field using vibroglove. Trans. Inf. Process. Soc. Jpn. 1999, 49, 414–421. [Google Scholar]
  17. Barreiro, H.; Sinclair, S.; Otaduy, M.A. Ultrasound Rendering of Tactile Interaction with Fluids. In Proceedings of the IEEE World Haptics Conference, Tokyo, Japan, 9–12 July 2019. [Google Scholar]
  18. White, F.M. Fluid Mechanics; Technical Report; McGraw-Hill: New York, NY, USA, 1986. [Google Scholar]
  19. Shakib, F.; Hughes, T.J.; Johan, Z. A new finite element formulation for computational fluid dynamics: X. The compressible Euler and Navier-Stokes equations. Comput. Methods Appl. Mech. Eng. 1991, 89, 141–219. [Google Scholar] [CrossRef]
  20. Gerstenberger, A.; Wall, W.A. An extended finite element method/Lagrange multiplier based approach for fluid–structure interaction. Comput. Methods Appl. Mech. Eng. 2008, 197, 1699–1714. [Google Scholar] [CrossRef]
  21. Jasak, H.; Jemcov, A.; Tukovic, Z. OpenFOAM: A C++ library for complex physics simulations. In Proceedings of the International Workshop on Coupled Methods in Numerical Dynamics, IUC Dubrovnik, Croatia, 19–21 September 2007; Volume 1000, pp. 1–20. [Google Scholar]
  22. Ekambara, K.; Sanders, R.S.; Nandakumar, K.; Masliyah, J.H. Hydrodynamic simulation of horizontal slurry pipeline flow using ANSYS-CFX. Ind. Eng. Chem. Res. 2009, 48, 8159–8171. [Google Scholar] [CrossRef]
  23. Pu, J.; Ramani, K. On Visual Similarity Based 2D Drawing Retrieval. Comput. Aided Des. 2006, 38, 249–259. [Google Scholar] [CrossRef]
  24. Kato, G.; Kuroda, Y.; Nisky, I.; Kiyokawa, K.; Takemura, H. HapSticks: Tool-Mediated Interaction with Grounding-Free Haptic Interface. In Proceedings of the SIGGRAPH Asia 2015 Haptic Media and Contents Design, Kobe, Japan, 2 November 2015; Association for Computing Machinery: New York, NY, USA, 2015. [Google Scholar] [CrossRef]
  25. Quek, Z.F.; Schorr, S.B.; Nisky, I.; Okamura, A.M.; Provancher, W.R. Augmentation Of Stiffness Perception with a 1-Degree-of-Freedom Skin Stretch Device. IEEE Trans.-Hum.-Mach. Syst. 2014, 44, 731–742. [Google Scholar] [CrossRef]
Figure 1. Our prototype FlowHaptics, which produces midair haptic feedback to replicate the sensation of flowing water. Although the feeling of flowing water is composed of multiple sensations, such as viscosity and temperature, we focused on pressure, including the drag over the fingers and skin friction.
Applsci 11 08447 g001
Figure 2. The sensation of fluid flow is a combination of the drag force and skin friction. We added additional air tubes on the left and right to emphasize skin friction on both sides of the finger.
Applsci 11 08447 g002
Figure 3. (a) Fluid simulation for 1 finger and (b) the velocity measured in the fluid simulation on the left, center, and right parts of the middle finger.
Applsci 11 08447 g003
Figure 4. (a) Fluid simulation for 3 fingers and (b) the velocity measured in the fluid simulation on the left, center, and right parts of the middle finger.
Applsci 11 08447 g004
Figure 5. System configuration.
Applsci 11 08447 g005
Figure 6. Velocity control of the airflow from the air control value.
Applsci 11 08447 g006
Figure 7. Flow velocity output value for the one-finger condition. (a) Constant; (b) FlowEst1; (c) FlowEst2.
Applsci 11 08447 g007
Figure 8. Flow velocity output value for the three-finger condition. (a) Constant. (b) FlowEst1. (c) FlowEst2.
Applsci 11 08447 g008
Figure 9. (a) Experimental setup; (b) front view of the device; (c) one finger; (d) three fingers.
Applsci 11 08447 g009
Figure 10. The probability of the subjects responding that the “comparison is stronger” with respect to the standard stimuli from the psycho-physical evaluation results (CS = comparison stimuli, SS = standard stimuli). (a) 1F/1T (b) 1F/3T (c) 3F/1T (d) 3F/3T.
Applsci 11 08447 g010
Figure 11. Box plot of the result for (a) one finger and (b) three fingers.
Applsci 11 08447 g011
Figure 12. Bar graph showing the highest scores for each condition.
Applsci 11 08447 g012
Publisher’s Note: MDPI stays neutral with regard to jurisdictional claims in published maps and institutional affiliations.

