Article

Modal-Based Ground Motion Selection Method for the Nonlinear Response Time History Analysis of Reinforced Concrete Shear Wall Structures

1
Shock and Vibration of Engineering Materials and Structures Key Laboratory of Sichuan Province, Mianyang 621010, China
2
Key Laboratory of Structural Engineering and Disaster Prevention of Fujian Province, Xiamen 361021, China
3
College of Civil Engineering, Huaqiao University, Xiamen 361021, China
Appl. Sci. 2021, 11(17), 8230; https://doi.org/10.3390/app11178230
Submission received: 11 August 2021 / Revised: 30 August 2021 / Accepted: 31 August 2021 / Published: 5 September 2021
(This article belongs to the Special Issue Seismic Assessment and Design of Structures)

Abstract

:
This paper presents a modification of the modal-based ground motion selection (MGMS) method for improving the reliability of the nonlinear response time history analysis (NLRHA) of reinforced concrete (RC) shear wall structures. The original MGMS procedure quantified the impact of frequency content combinations in the time domain (FCCTD) of input ground motions (IGMs) on the seismic response of building structures using the level of interaction of the first three modes induced by IGMs. However, previous research found that the first two modes have far larger modal mass coefficients than those of higher modes and dominate the vibration of the RC shear wall structures with a symmetric plan. Therefore, the MGMS procedure should be modified by employing the interaction of the first two modes induced by IGMs to properly account for the effect of the FCCTD of IGMs on the seismic response of structures. In the MGMS procedure for RC shear wall structures, seven IGMs that caused the most significant interactions of the first two modes were selected from a suite of twenty seed IGMs, which were chosen with a conventional spectra-matching-based IGMs selection procedure for the NLRHA of the structure. A comprehensive case study involving three RC shear walls with different heights was conducted to investigate the capability of the MGMS in selecting suitable IGMs for the NLRHA of RC shear wall structures. Sets of seed IGMs were selected, adopting conditional mean spectra and design spectra as the target spectra. It was found that the seismic demands computed using MGMS selected IGMs can ensure a more reliable and reasonable computation of seismic demands compared with conventional spectra-matching-based IGMs selection methods.

1. Introduction

Tall buildings in moderate and high seismicity regions extensively adopt reinforced concrete (RC) shear wall structures to resist lateral loads because of their remarkable seismic performance. Owing to the increased seismic risk, accurate computation of the seismic demand is crucial to the seismic design of RC shear wall structures. The most precise method in computing seismic demands of building structures is the nonlinear response time history analysis (NLRHA) method. Still, the reliability and reasonability of the NLRHA are limited by the representative input ground motions (IGMs) because of the extreme uncertainty and contingency of earthquake events [1,2,3,4,5]. The available IGM selection procedures [6,7,8,9] firstly evaluate local geological features and basic properties of the IGMs [10,11,12,13,14,15] to ensure these features of IGMs fulfil the requirement of the site. Then, the selection procedures adopt various spectra matching techniques to modify IGMs to provide the response spectra IGMs that match closely with the target spectrum [16].
In the past two decades, plenty of research efforts have been made in developing spectra-matching-based IGM selection procedures for selecting and scaling proper IGMs for the NLRHA of building structures [17,18,19,20,21,22,23,24,25,26,27,28]. However, the structural seismic demand is affected by the peak modal responses and the modal response combinations in the time domain, which is determined by the frequency contents combinations in the frequency domain (FCCFD) and time-domain (FCCTD) of IGMs, respectively [29]. For high-rise buildings, the peak modal responses and modal response combinations in the time domain are of the same importance to the seismic demand of the building structure. The response spectrum of IGMs quantifies the effect of FCCFD of IGMs. Thus, most of the available IGMs selection procedures that employ spectra matching techniques can only consider the impact of FCCFD of IGMs. The research of Wang [20] and Anajafi [24] showed that even if the individual records are tightly matched to the target spectrum, the record to record variability in the inelastic structural responses might be still noticeable. Moreover, Anajafi and Medina [24] also illustrated that the record-to-record variability in higher-mode dominated responses is very sensitive to the value of the target damping. These findings highlighted the shortcoming of the spectral matching technique.
Recently, a modal-based ground motion selection (MGMS) procedure was developed by Liu et al. [30] to consider the effect of FCCTD of IGMs in IGM selection. In the MGMS procedure, the impact of FCCTD of IGMs on the seismic demand of structures is quantified with the interaction of the first three modes. The MGMS procedure’s capability to select more reasonable IGMs for the NLRHA of structures has been proved for frame structures. At the same time, the deflection profile of the wall and frame structures is flexural and shear profiles, respectively, when the structures are subjected to the action of lateral load. Different deflection profiles of the wall and frame structures indicate different structural behavior [31,32]. The contribution of the seismic response of dominated modes to the final seismic demand shall also be different. Therefore, the capability of the MGMS procedure in improving the reliability of the NLHRA of RC shear wall structures is not guaranteed.
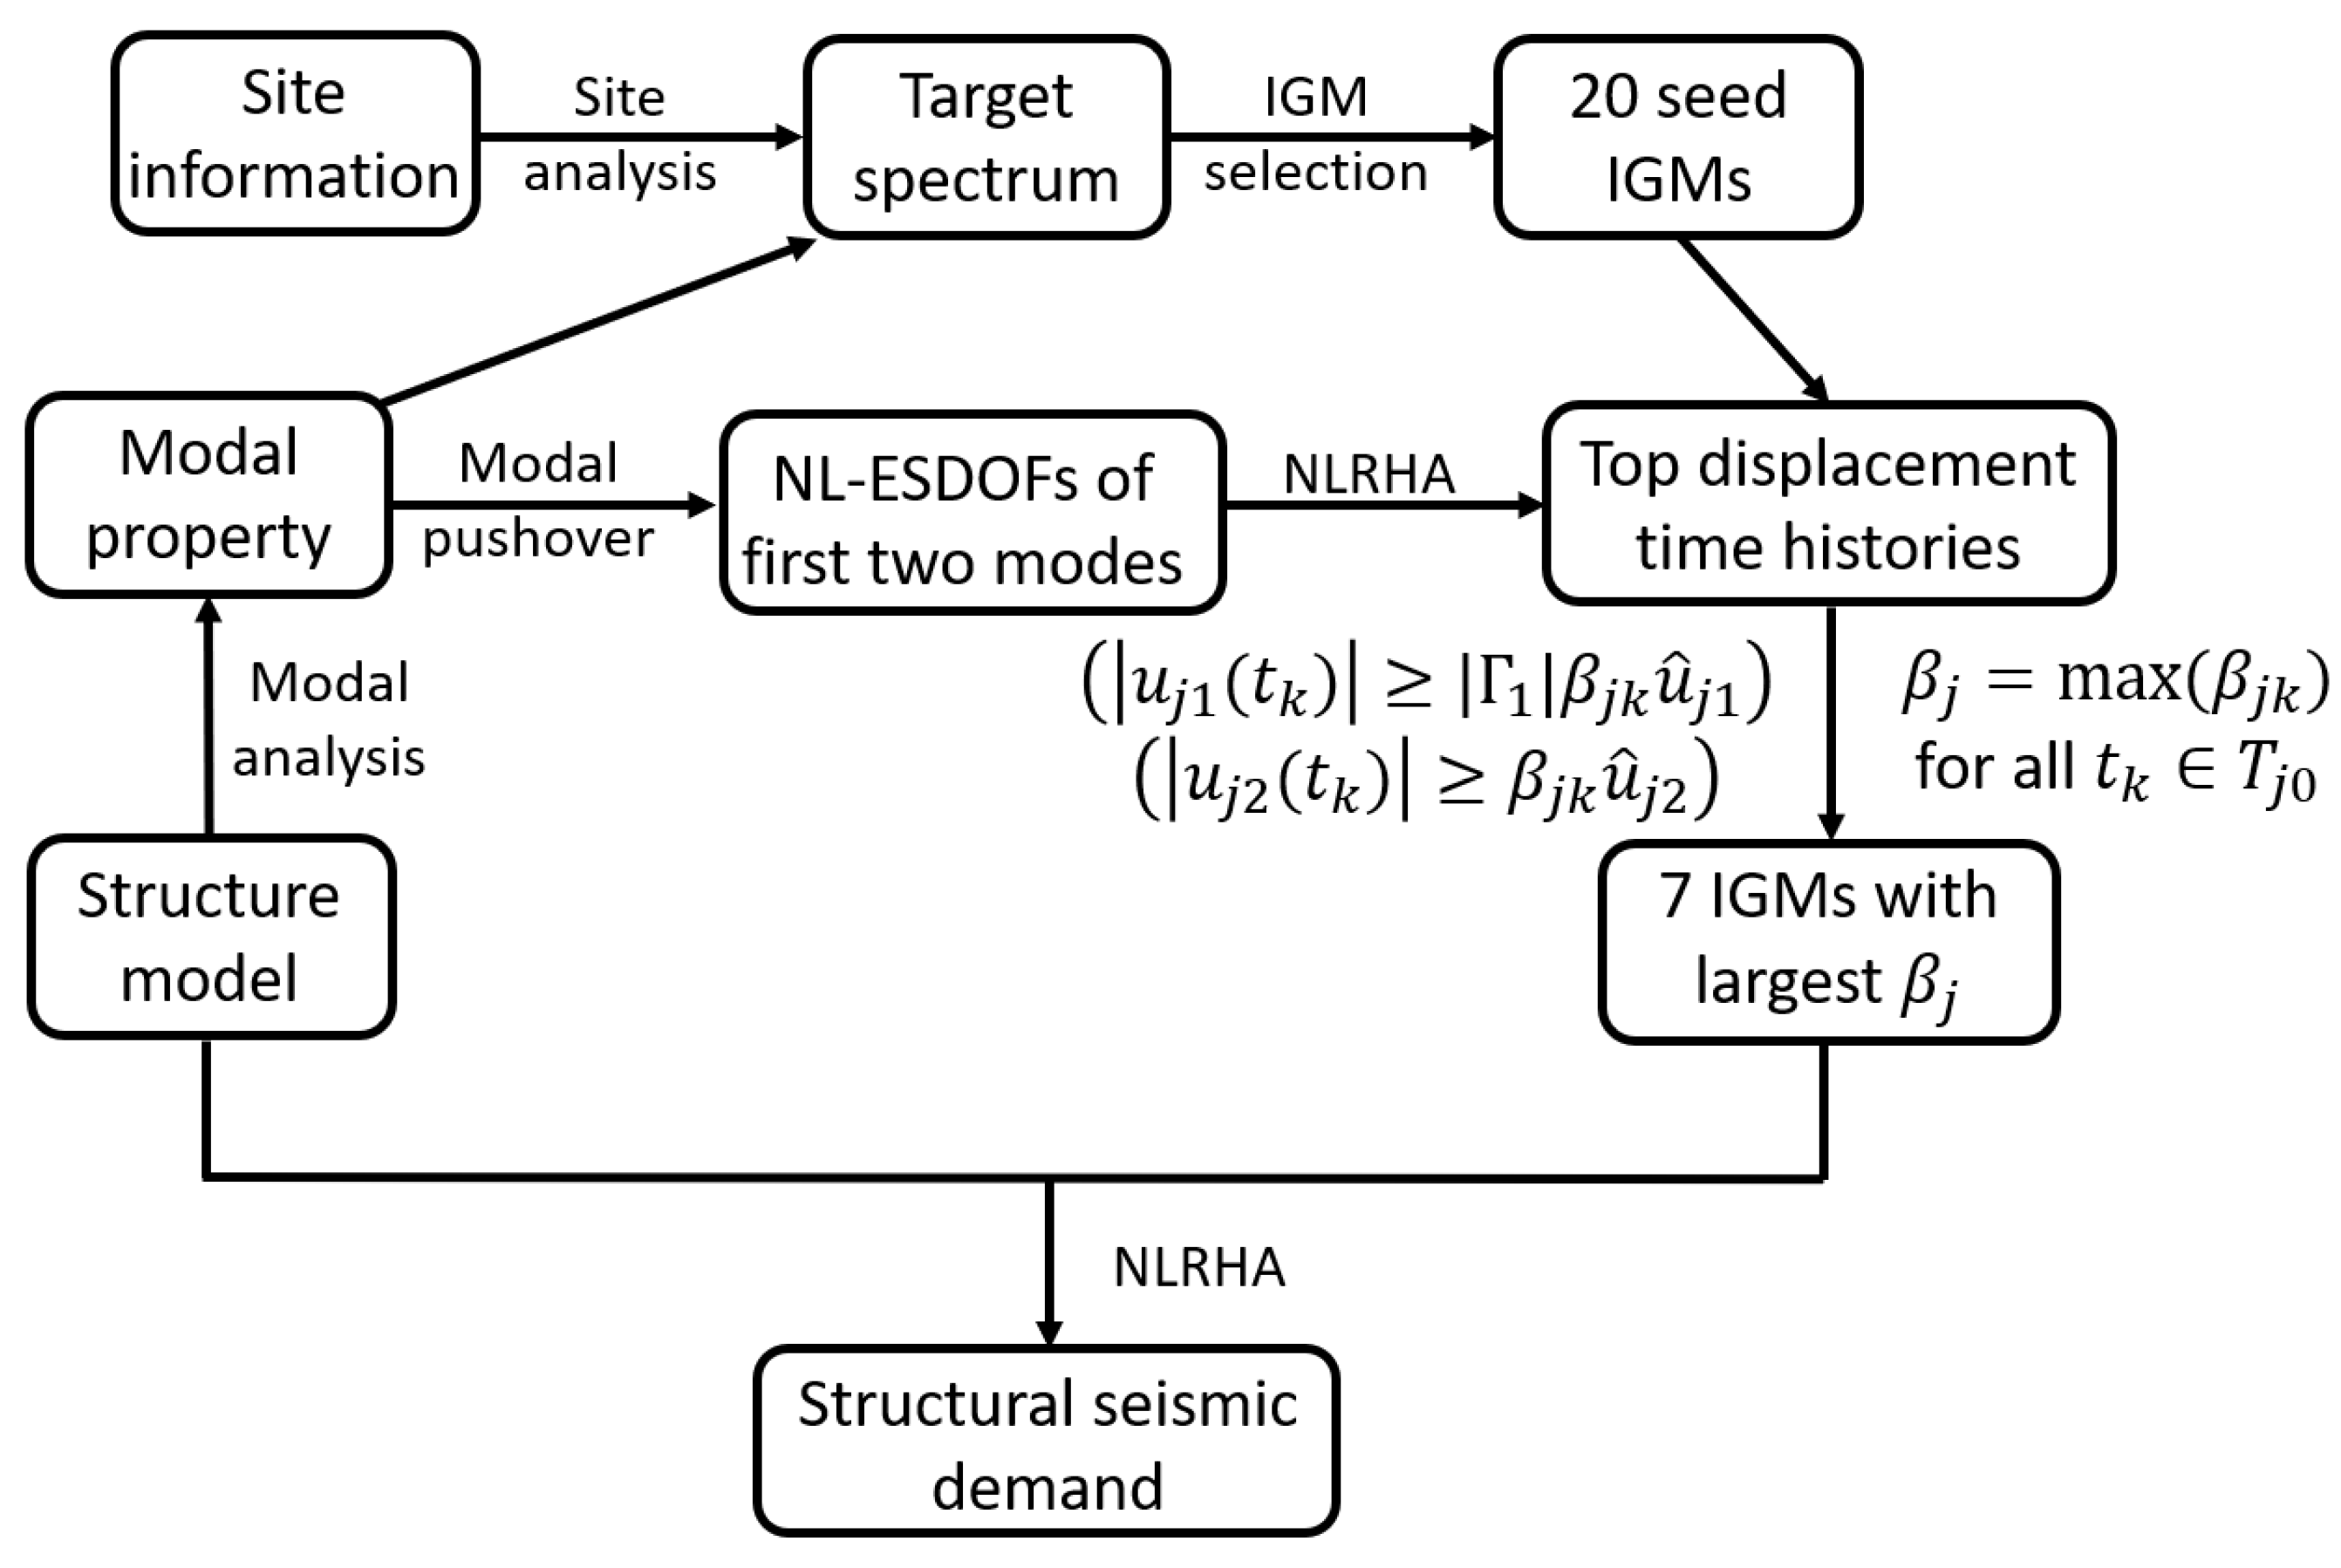
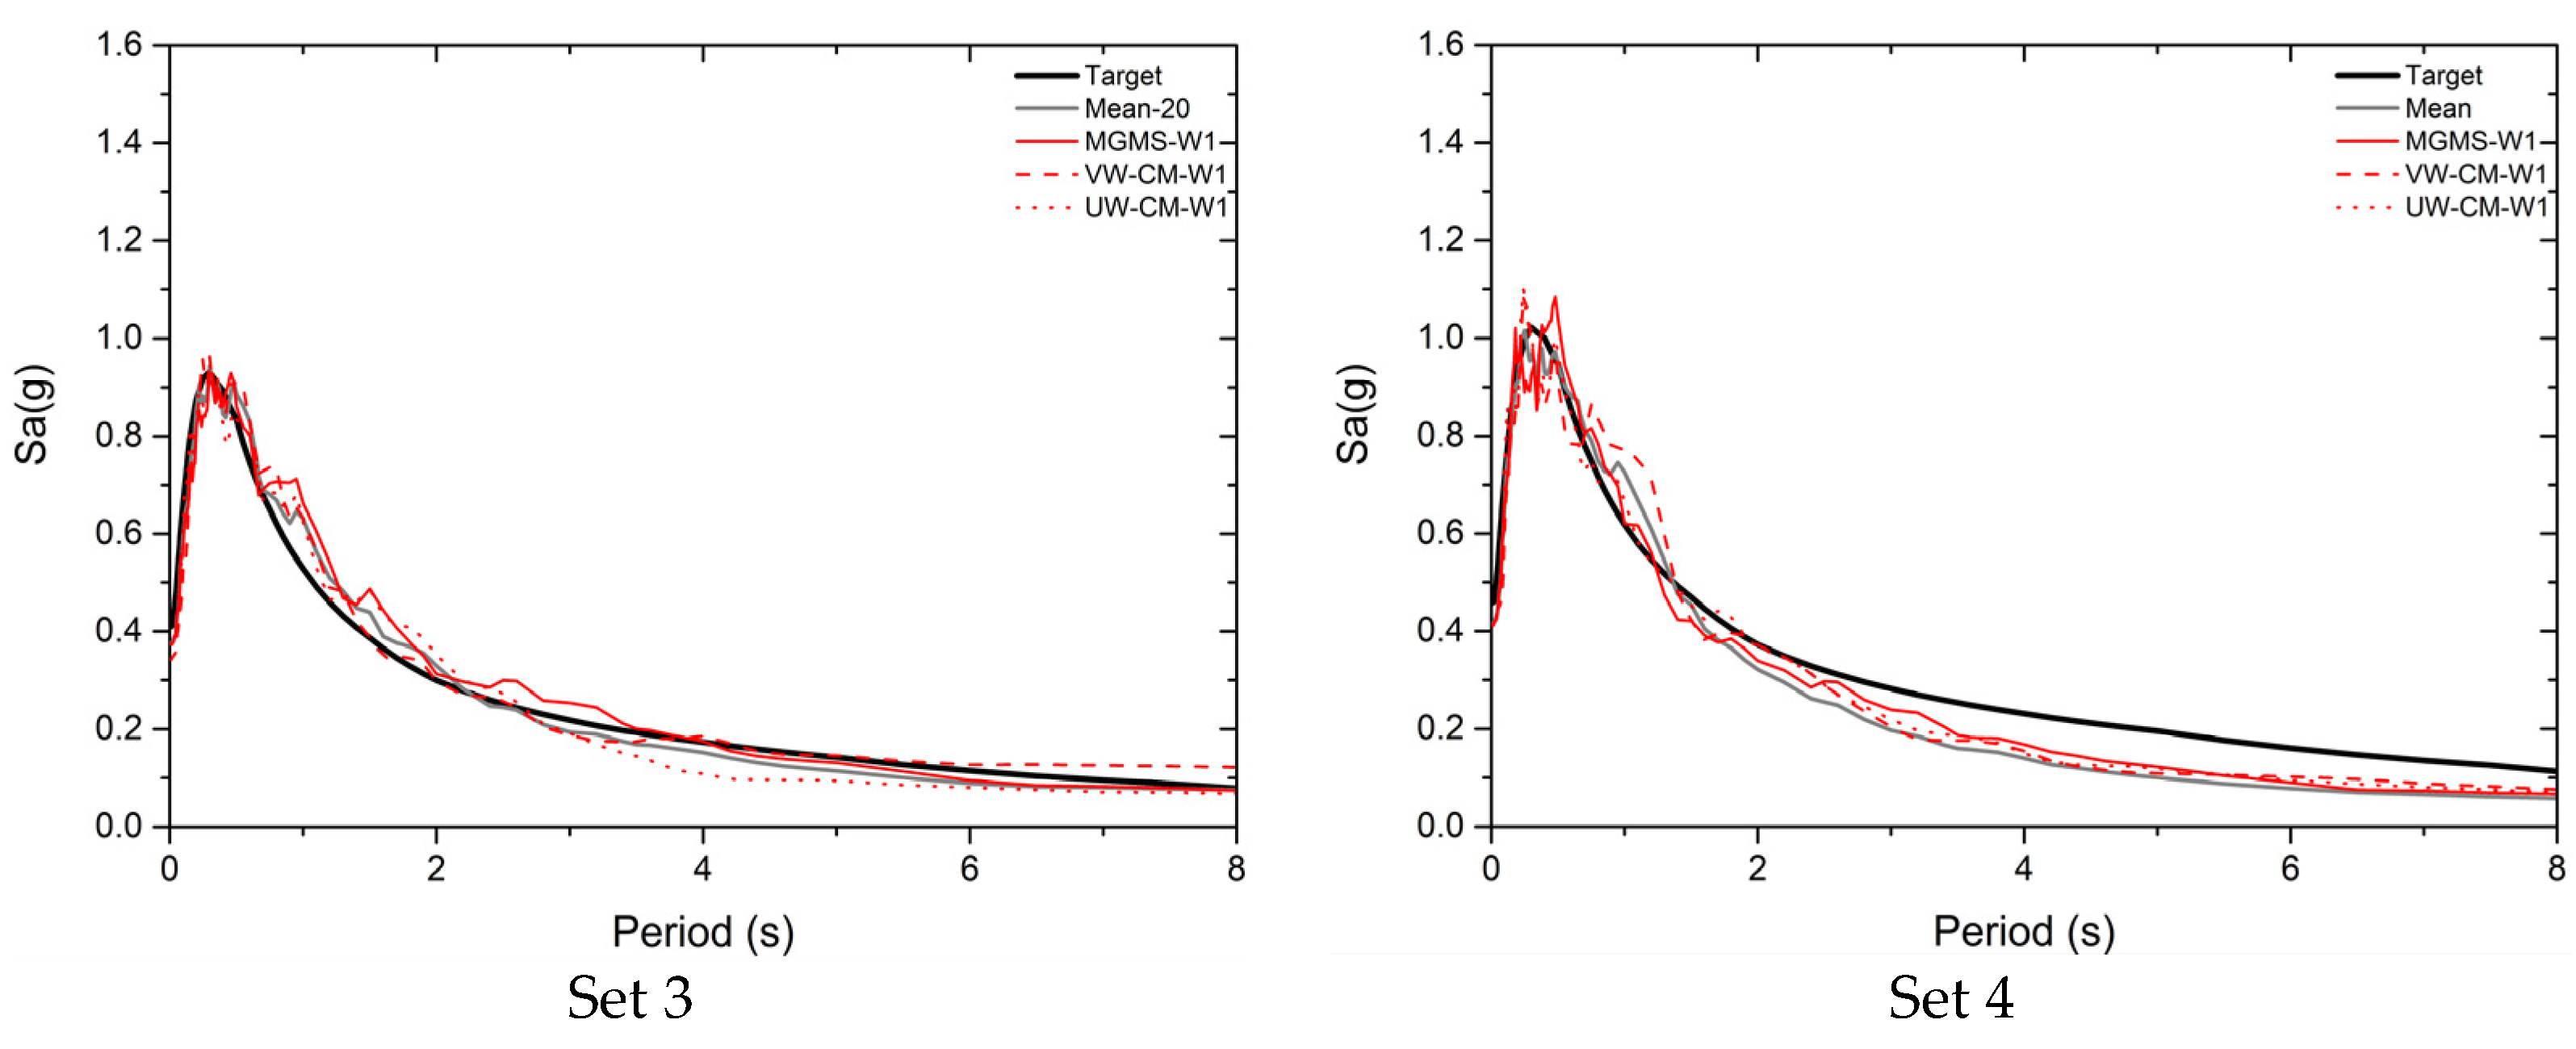
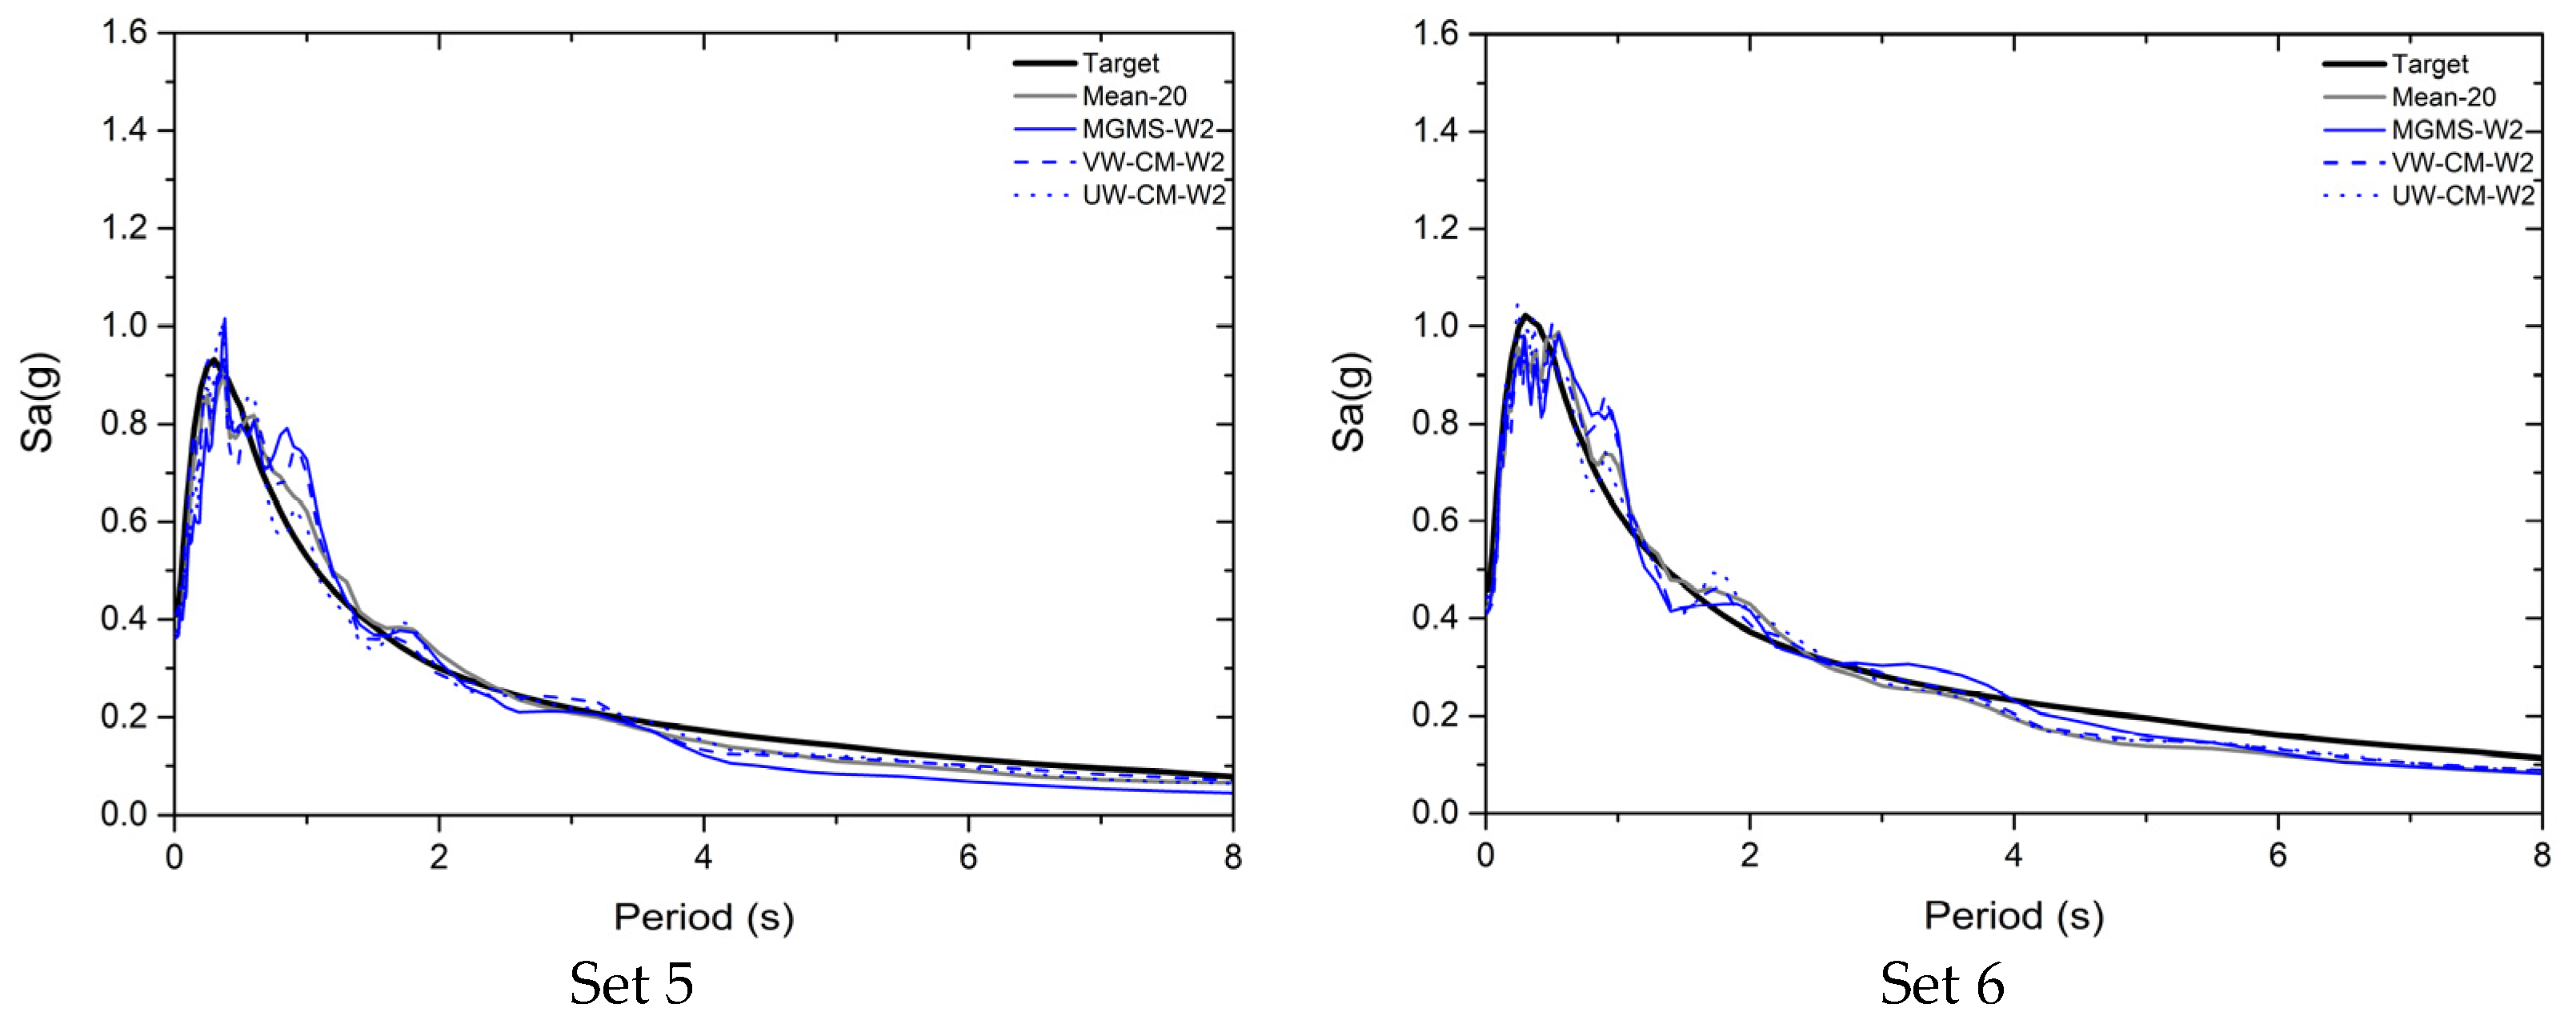
In this paper, the MGMS procedure is modified to take the modal response characteristics of RC shear wall structures into account in selecting IGMs for the NLRHA of the structure. In the MGMS procedure for wall structures, selected IGMs can induce the most significant interaction of the first two dominated modes, of which the modal mass coefficients are larger than the sum of modal mass coefficients of all the higher-order modes. A comprehensive case study was conducted on three RC shear wall structures with different heights. Seed IGMs were selected and scaled, with target spectra being conditional mean spectra [33] and ASCE 7 design spectra [6] to investigate the reliability and reasonability of the MGMS procedure when the target spectra vary. The results show that the MGMS procedure can effectively and consistently select suitable IGMs for the NLRHA of RC shear wall structures.
This paper has six sections, and the first section presents the background introduction, research significance and structure of the paper. Section 2 first provides the basic information on the MGMS procedure and discusses why modifications should be made to the selection procedure to ensure a more reasonable selection of IGMs for the NLRHA of RC shear wall structures. Then, Section 2 presents details about the proposed MGMS procedure for RC shear structures. 
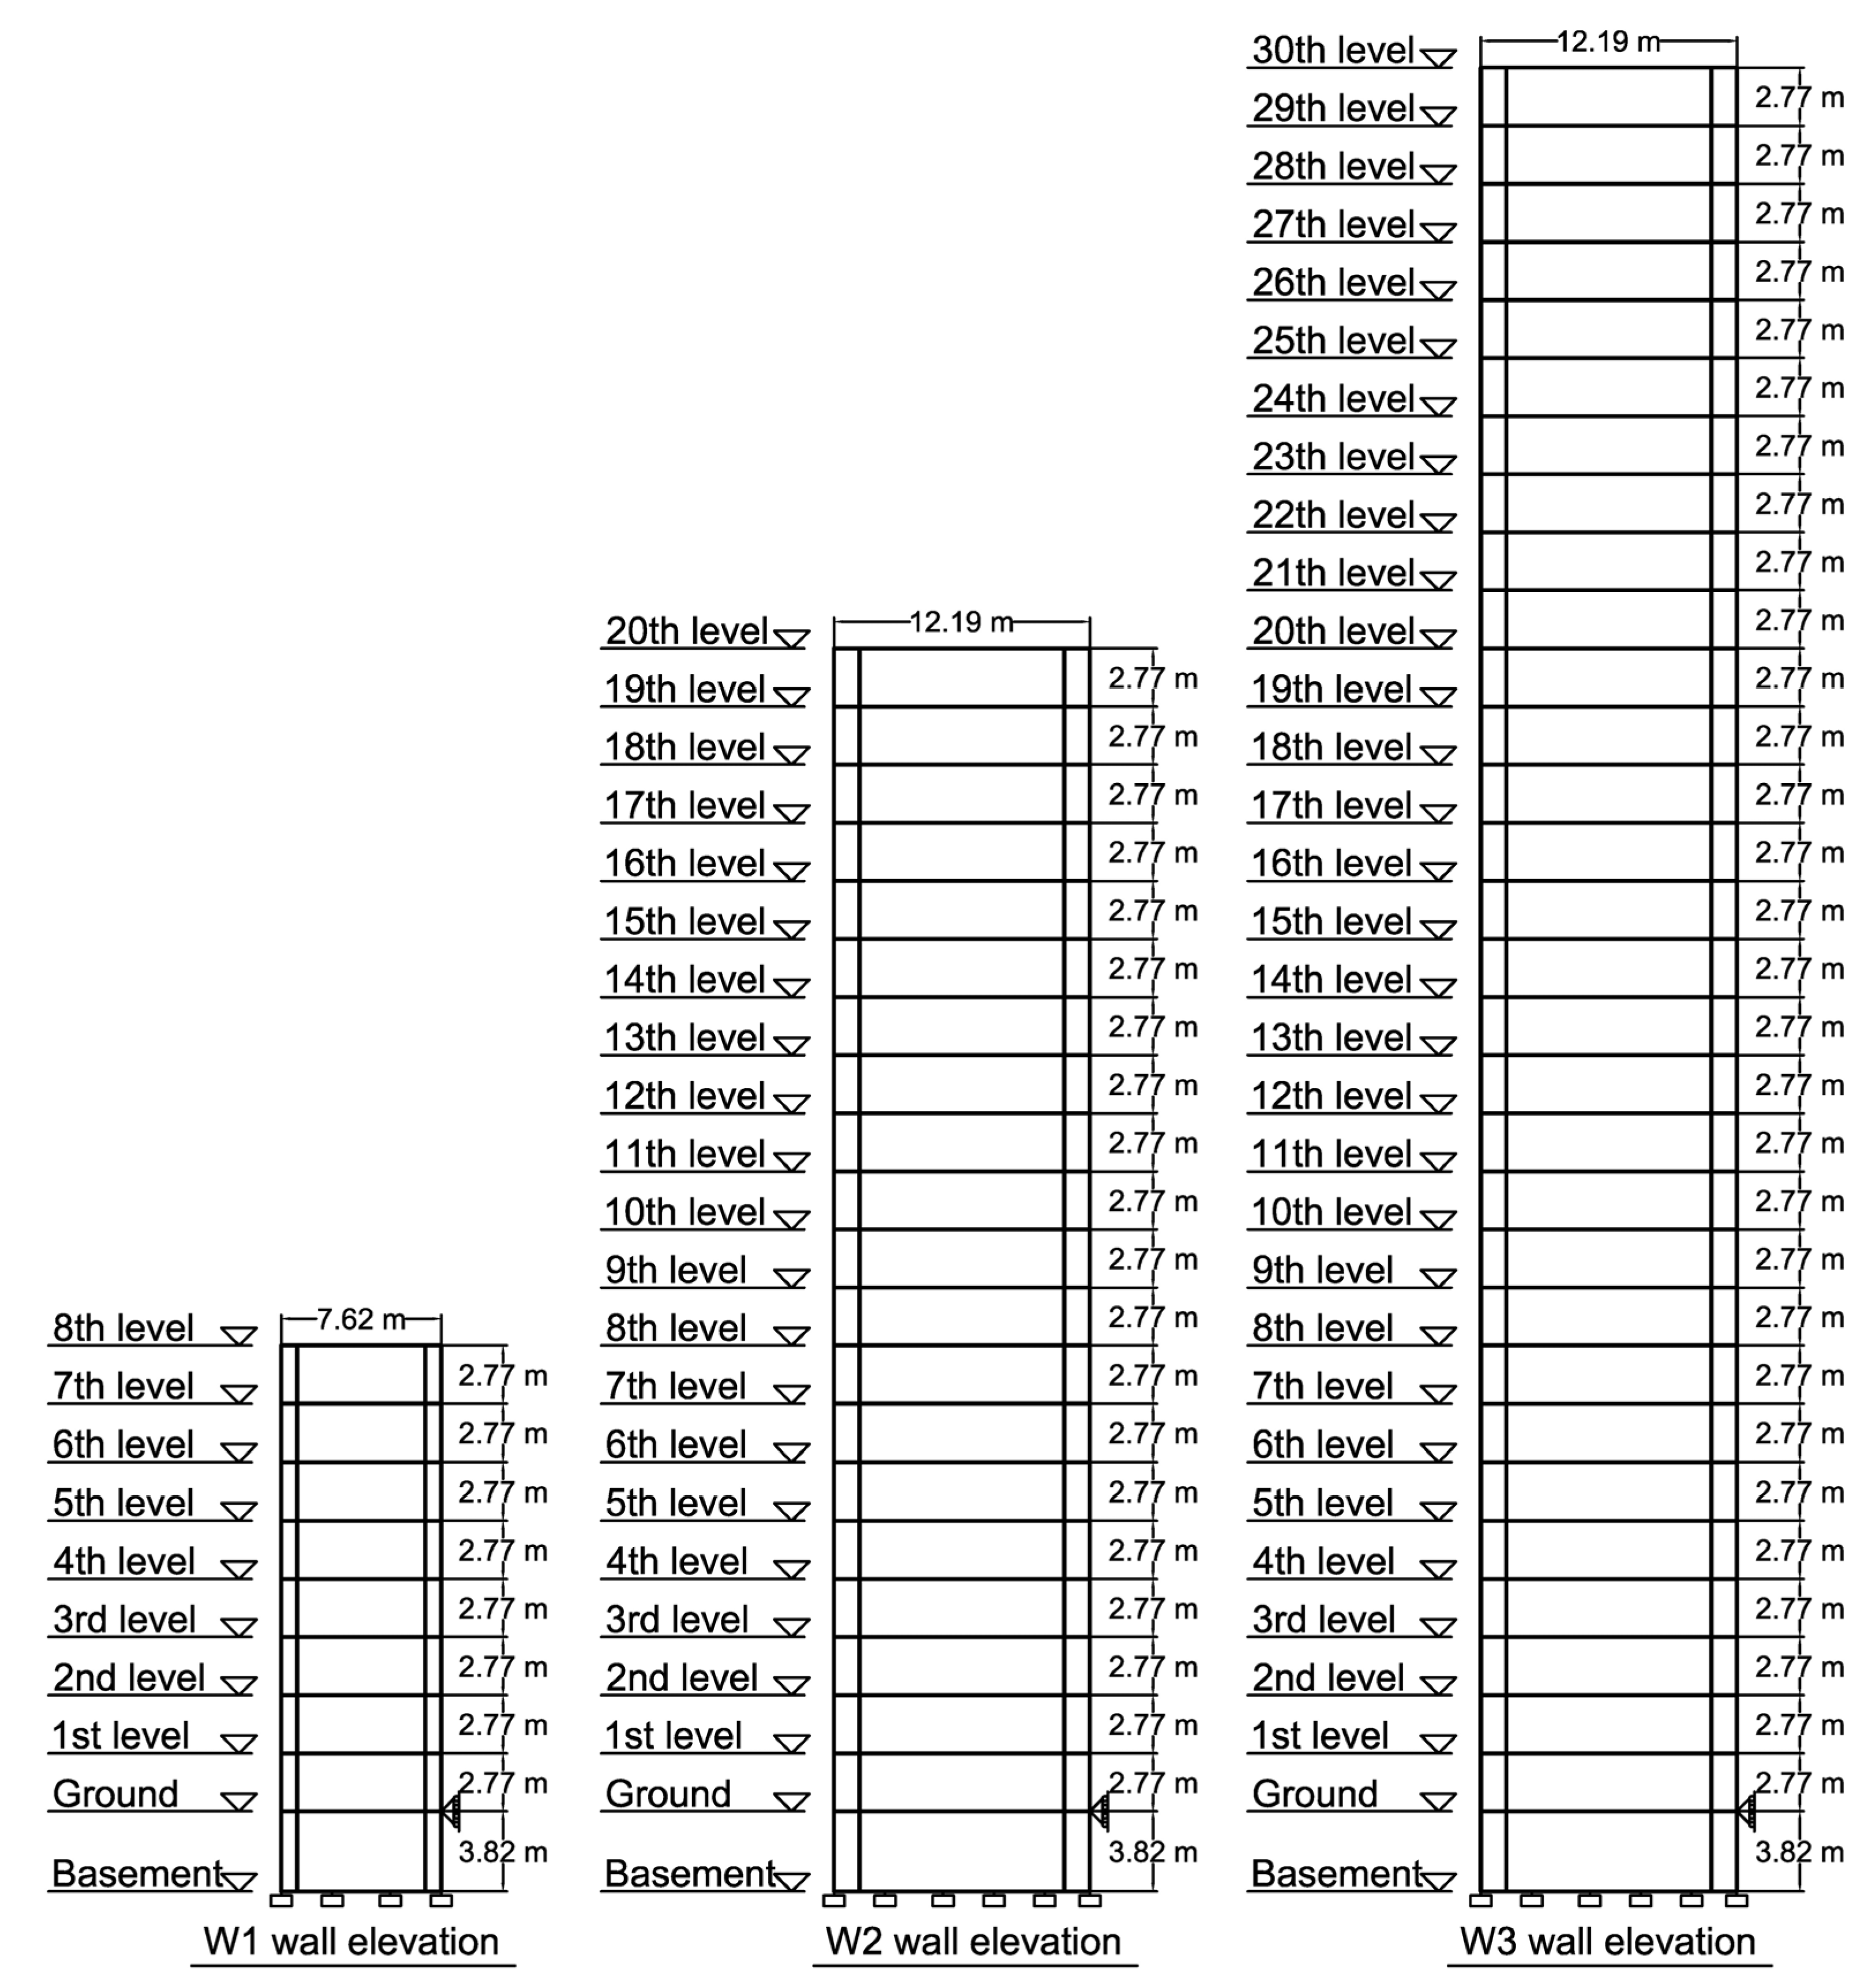
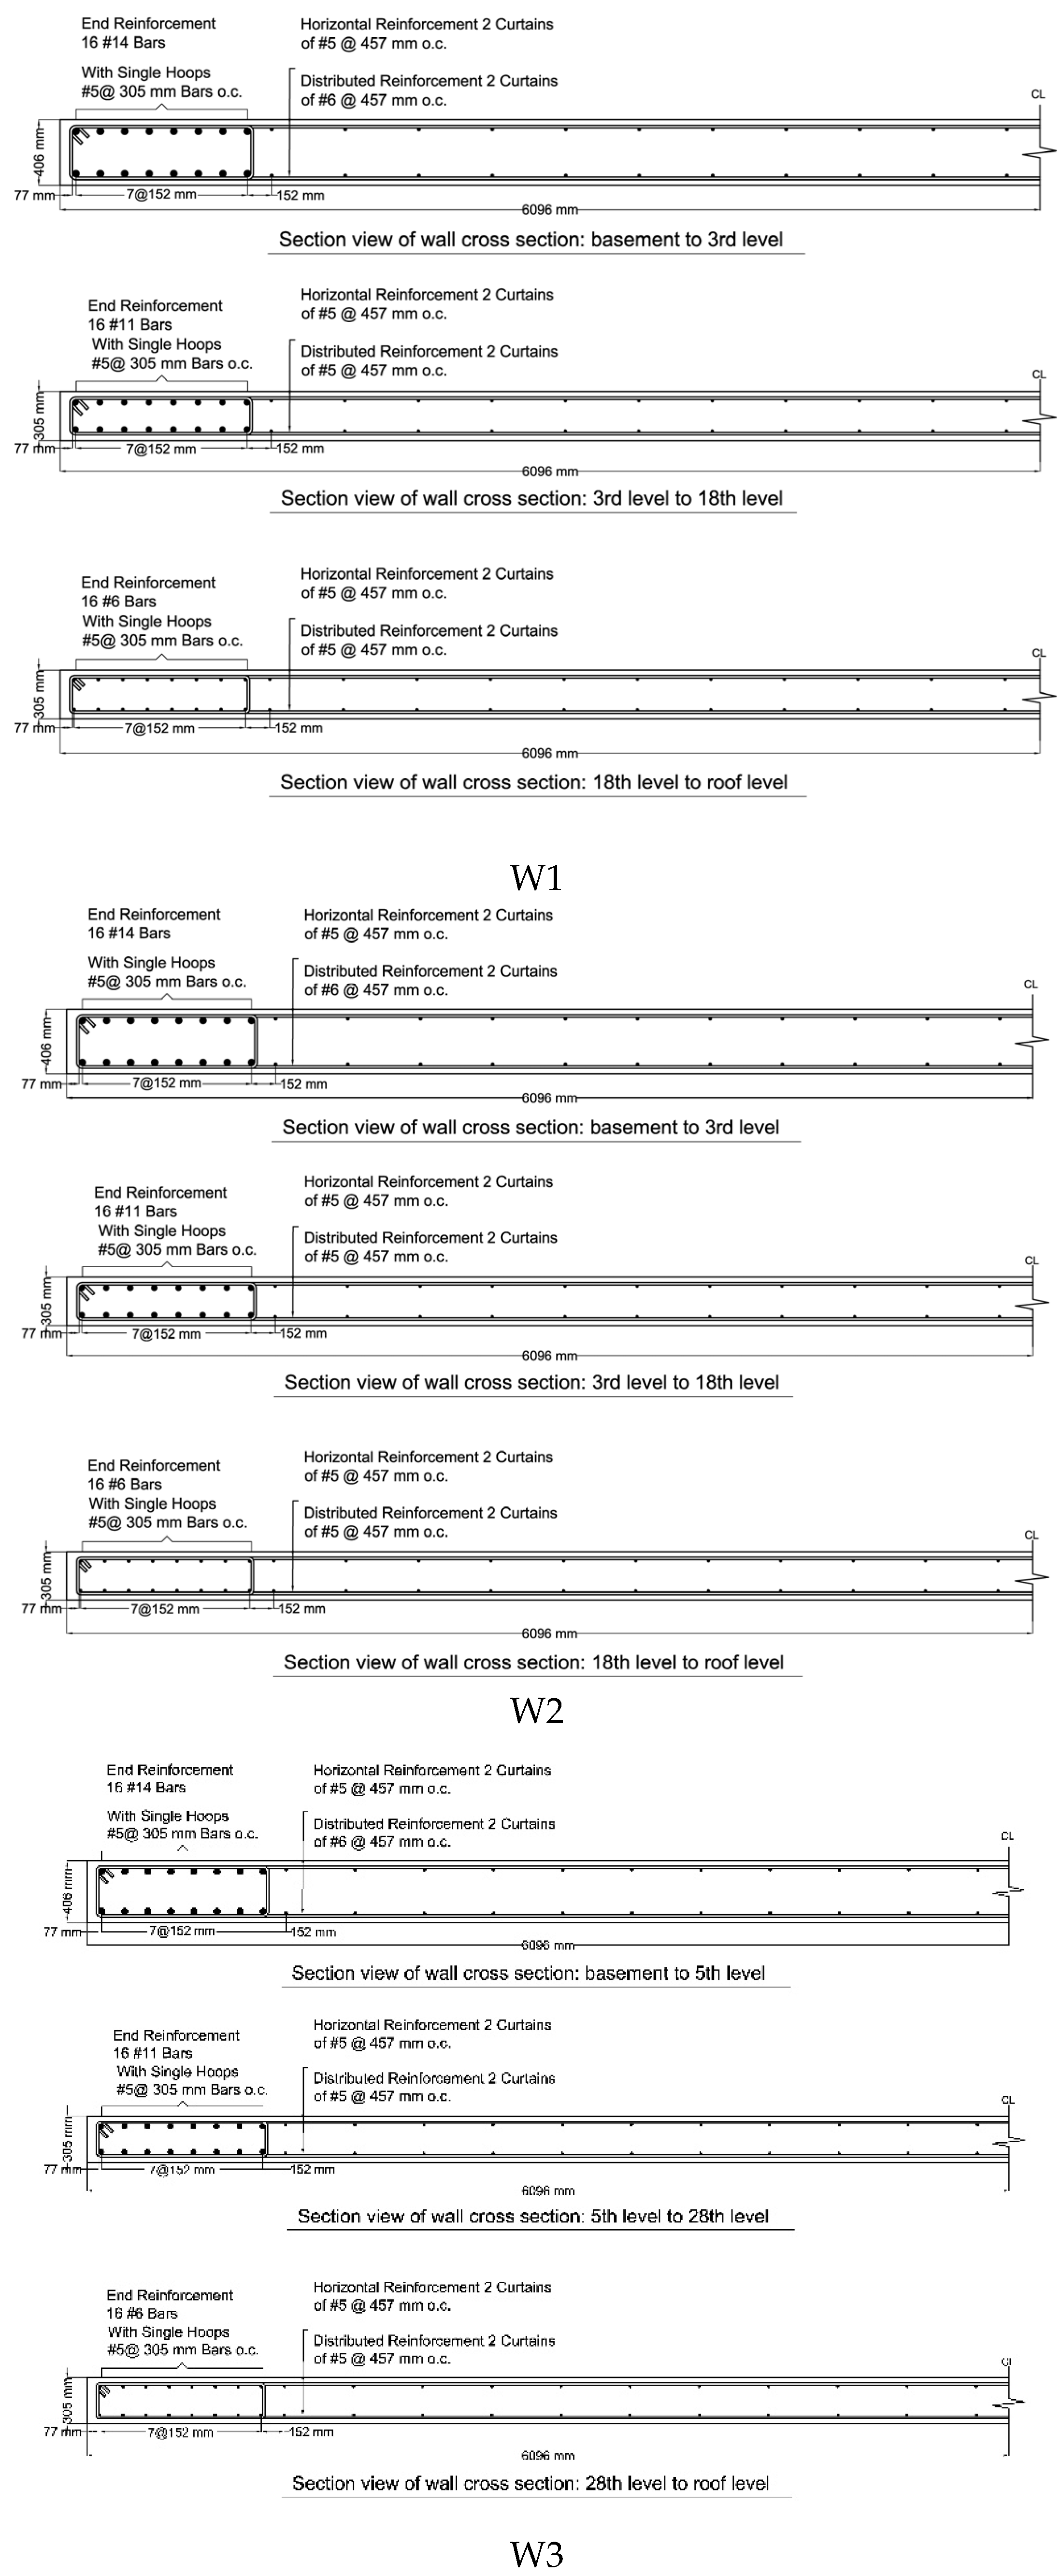
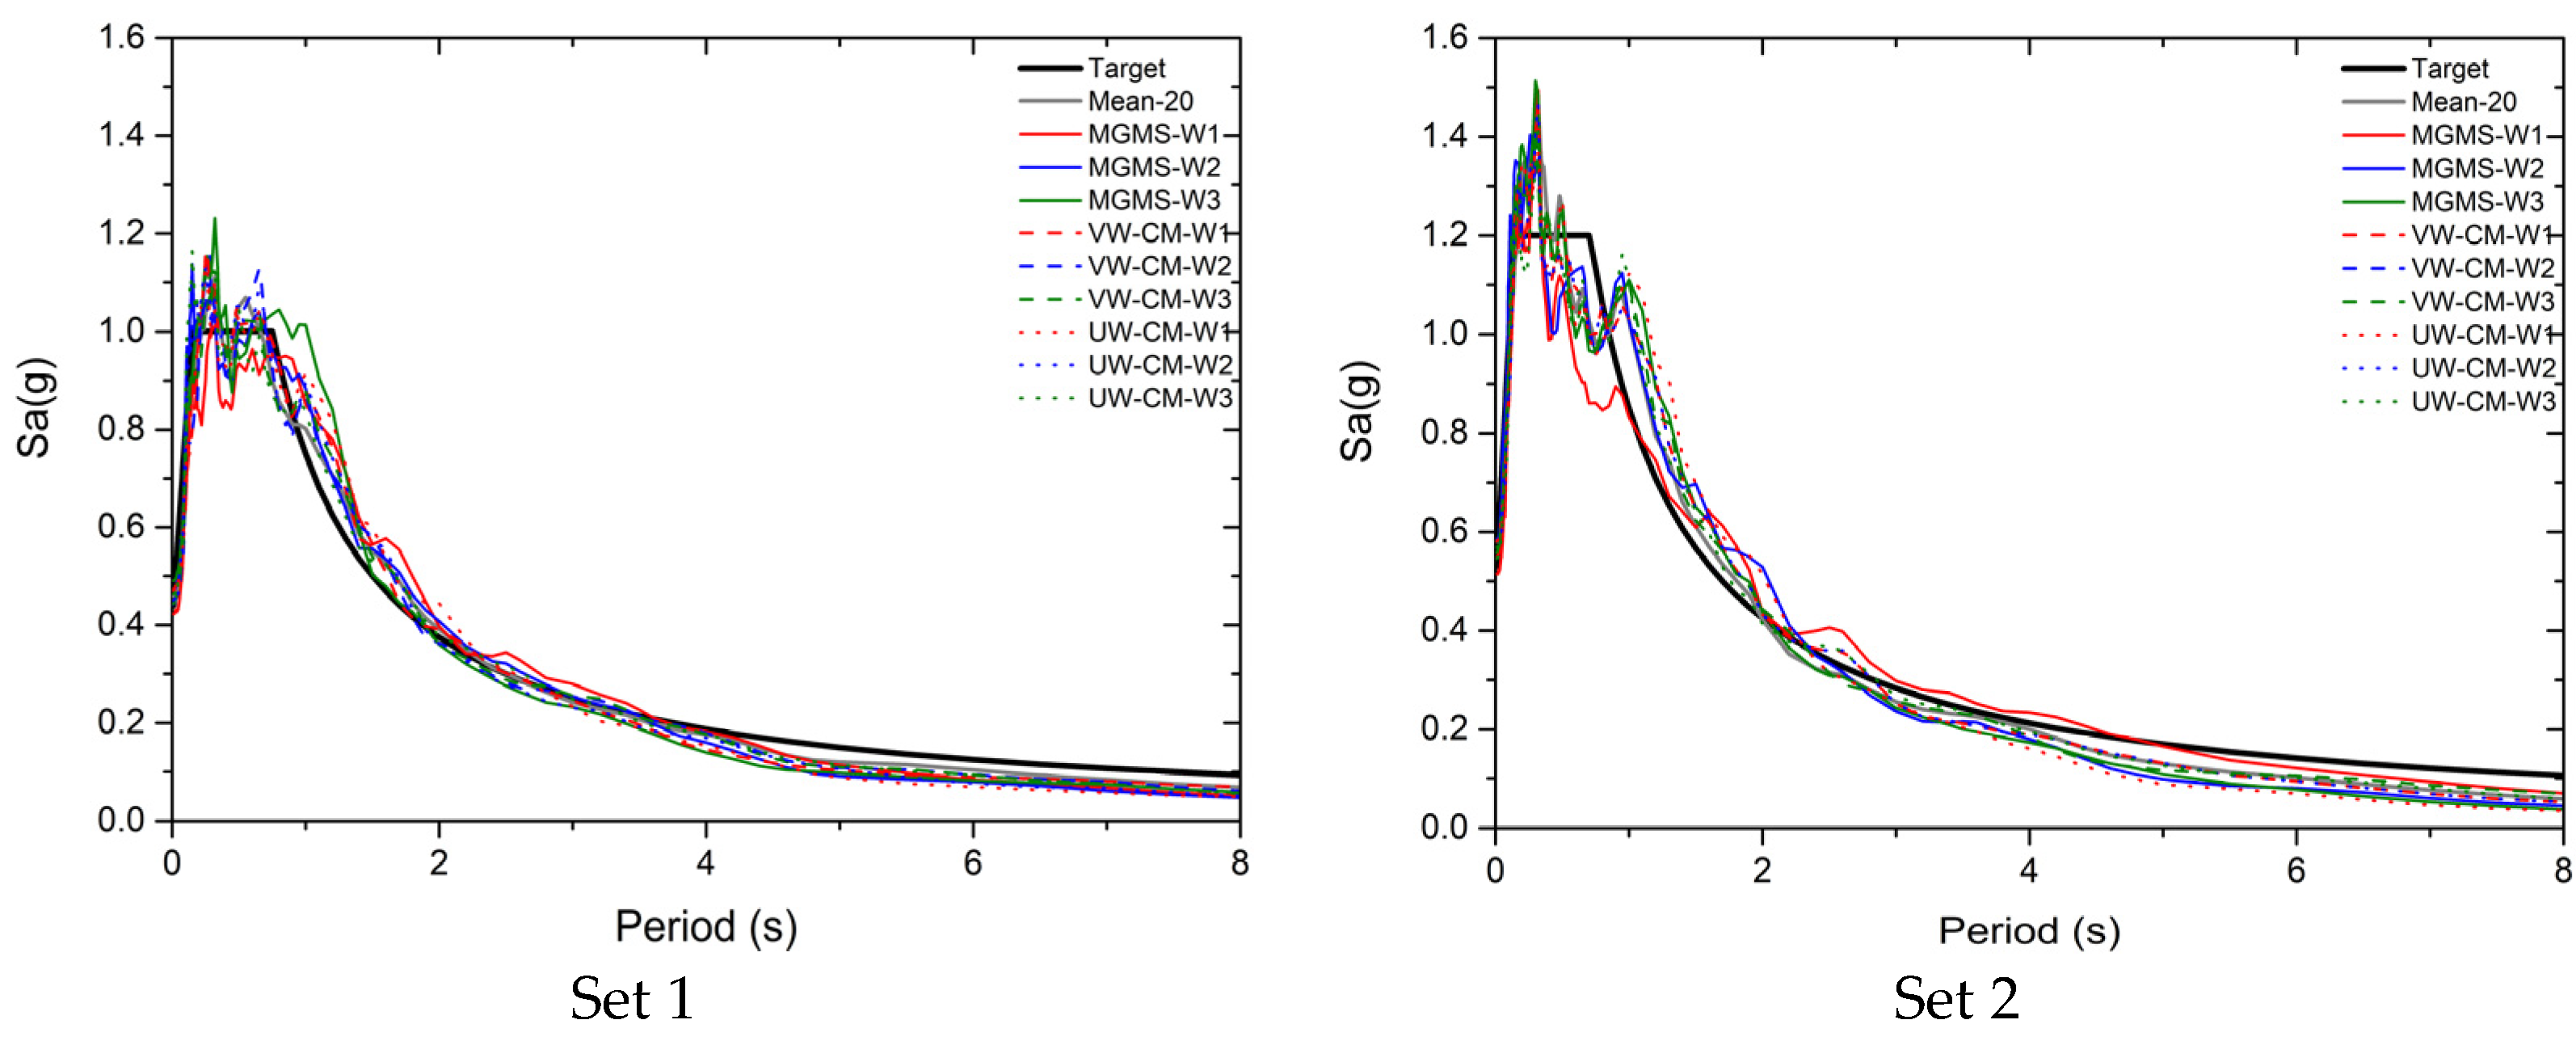
Section 3 shows detailed information on a comprehensive case study, including structural prototypes, seed IGMs and IGM selection for the NLRHA of RC shear wall structures. Section 4 presents the NLRHA results adopting IGMs of different selection methods and discussions. Section 5 summarizes the findings of the paper and draws conclusions based on the findings. Appendix A provides details of the RC shear wall structures and seed IGMs.

2. Modal-Based Ground Motion Selection Procedure for RC Shear Wall Structures

2.1. Original Modal-Based Ground Motion Selection Procedure

The structural dynamics theory is firstly adopted to demonstrate the effect of IGMs on the peak modal responses and modal response combinations in the time domain. The equation of motion of a multi-degree-of-freedom system under the IGM is expressed as [29]
m u ¨ + c u ˙ + k u = m i u ¨ g ( t )
where u is story displacements vector, k, c and m stand for the stiffness, damping and mass matrices, respectively, and i is the influence vector. u ¨ g ( t ) is the acceleration history of the input ground motion. As the loading history does not affect the independence of the lateral force, the solution of Equation (1) can be expressed as:
u ( t ) = n = 1 N u n ( t ) = n = 1 N Γ n ϕ n D n ( t ) = n = 1 N Γ n ϕ n D n a n ( t )
where
Γ n = L n M n ,   L n = ϕ n T m i   and   M n = ϕ n T m ϕ n
and u n ( t ) is the displacement history of nth mode; ϕ n is the mode shape of nth vibration mode, and N is the total number of mode; Γ n is the modal participating factor; M n is the generalised mass of mode n; L n is the modal excitation factor of mode n; D n ( t ) is the top displacement time history the ESDOF of nth mode; D n is the peak displacement of the ESDOF of nth mode; a n ( t ) = D n ( t ) D n is the normalized top displacement time history of nth mode.
It is clear from Equation (2) that the seismic demand of tall buildings is determined by both peak modal response D n , and modal response combination in the time domain a n ( t ) . The D n and a n ( t ) are of the same importance when the higher-mode effect is significant. Spectrum matching-based IGM selecting and scaling procedures only ensure that the value of D n fulfils specific requirements but ignores the impact of a n ( t ) on the structural seismic demand, resulting in significant variations in the computed seismic demand [20,21,24].
Driven by the need to take the effect of FCCTD of IGMs on the structural seismic demand into account in the selection of IGMs and improve the reliability of NLRHA, the modal-based ground motion selection (MGMS) procedure [30] was developed. The MGMS procedure selects seven IGMs that lead to the most severe interaction of the first three modes from a group of twenty seed IGMs, primarily obtained through the common two-step IGMs selection method. A previous study has shown that with reasonable consideration of the effect of FCCTD of IGMs, the MGMS procedure can select more reasonable IGMs for the NLRHA of frame structures.

2.2. Proposed Modal-Based Ground Motion Selection Procedure for RC Shear Wall Structures

The modal mass coefficient α n , which can be calculated using Equation (4), is the primary factor that affects the number of modes considered in the MGMS procedure.
α n = m e f f i = 1 N m j = 1 i = 1 N m j L n 2 M n
For most structures with symmetric plane arrangements, the sum of modal mass coefficients of the first three modes is higher than 90% [29]. Thus, the MGMS included the first three modes to account for the effect of IGMs on the multi-mode interaction. At the same time, it is found that for RC shear wall structures with a symmetric plan, the modal mass coefficients of the first two modes are larger than the sum of the modal mass coefficients of the higher-order modes [31,34]. At the same time, the modal mass coefficients of other higher modes are smaller than the sum of the modal mass coefficients of the higher-order modes. The relations of the modal mass coefficients of RC shear wall structures with a symmetric plan can be expressed as:
α i i + 1 N α n   for   i = 1 ,   2
α i < i + 1 N α n   for   i = 3 ,   4 , ,   N 2
The large modal mass coefficient values of the first two modes show the overwhelming domination of the first two modes in the vibration of the RC shear wall structures. Thus, considering the effect of IGMs on the interaction of the first two dominated modes is more reasonable in selecting IGMs for the NLRHA of RC shear walls with a symmetric plan. Otherwise, the higher-order mode effect will be exaggerated in the IGM selection, and the reliability of the NLRHA of shear wall structures will be affected.
Accounting for the domination of the first two modes in the vibration of the RC shear wall structures, the MGMS procedure was modified by considering the first two modes’ interaction in the IGMs selection. After selecting twenty seed IGMs through a spectrum-matching procedure, the NL-ESDOFs of the first two modes were developed through the modal pushover analysis procedure:
(1).
Apply lateral force whose distribution is m ϕ n , where n = 1, 2, to the structure separately, and generate two sets of curves of base shear-roof displacement ( V b n u r n ). Convert the ( V b n u r n ) curves to bilinear curves.
(2).
Transfer the ( V b n u r n ) bilinear curves to the ( F s n / L n D n ) pushover curves of the NL-ESDOFs using Equation (7):
F s n L n = V b n M n *   and   D n = u r n Γ n ϕ r n
(3).
The vibration period of NL-ESDOFs can be calculated as:
T n * = 2 π L n D n y F s n y   and   D n y = u r n y Γ n ϕ r n
(4).
Develop the NL-ESDOFs model using the base shear-top displacement relations of ( F s n / L n D n ) curves and T n * as the vibration period of NL-ESDOFs.
After obtaining the model of the NL-ESDOFs, NLRHA of NL-ESDOFs are conducted with twenty seed IGMs to compute the roof displacement time histories and the peak absolute roof displacement of the NL-ESDOFs u j n ( t k ) and u ^ j n = m a x t k T 0 | u j n ( t k ) | . Where n = 1, 2, is the mode ID; j = 1, 2,…, 20, is the ID of the seed IGMs; t k is the time point within the duration of the IGM j, T j 0 . The level of multi-mode interaction caused by IGM j was then quantified by the combination factor β j , which is the largest value of the factor β j k that establishes the following inequalities simultaneously for all t k T j 0 :
( | u j 1 ( t k ) | | Γ 1 | β j k u ^ j 1 )
( | u j 2 ( t k ) | β j k u ^ j 2 )
The β j shall range from 0 to 1 / | Γ 1 | . If β j equals to 0, it means that under the action of motion j, at least one dominated mode does not contribute to the seismic response of the wall structures for all t k T j 0 . On the other hand, if β j equals 1 / | Γ 1 | , the first mode reaches the largest roof displacement, and the second mode has roof displacement just below the largest value simultaneously for at least one time point within the duration of IGM j. These two cases are sporadic when the wall structures are subjected to natural earthquakes. The MGMS procedure then selects seven IGMs with the largest value of β j to carry out NLRHA of the full RC wall structure model. The average demands of NLRHA adopting the 7 MGMS-selected IGMs are the seismic demand of the RC wall structure. The procedure of selecting IGMs with the MGMS procedure for RC shear wall structures with a symmetric building plan is shown in Figure 1.

3. Case Study

3.1. Structure Prototype

In the case study, three RC shear walls, namely W1, W2 and W3, with story numbers of 8, 20 and 30, respectively, were studied. These three wall structures were all modified from the 8-story RC shear walls in the FEMA-440 [34]. Detailed information of design procedure of the RC shear walls can be found in [34,35]. The elevation and the reinforcement details of the three RC shear wall structure models can be found in Appendix A. The assumed gravity load for each story was 1468 kN for the 8-story wall structure and 2348.48 kN for the 20-story and 30-story shear wall structures.
The SAP 2000 Software nonlinear version [36] was employed to model the RC shear wall structures. The direct integration method adopting Wilson-θ algorithm was used to conduct NLRHA of wall structures, and the value of θ was set to be 1.4 to ensure the convergence of the integration algorithm. Grade 60 steel rebar was adopted for the W1 and W2, and Grade 75 steel rebar was adopted for W3. The yield strength of the Grade 60 and Grade 75 steel rebar is 413.7 MPa and 517.1 MPa, respectively. The Park parametric stress-strain relation was employed to model the nonlinear property of the steel rebar. The concrete property was modeled adopting the Mander concrete stress–strain curve. The unconfined concrete has a specified compressive strength of 27.6 MPa for W1 and W2 and 34.4 MPa for W3. The steel and concrete hysteresis behavior was modeled using the kinematic and concrete hysteresis models [36], respectively.
A multi-layer shell element was used to model the shear walls. In all the wall models, only the flexural inelasticity of shear walls was modeled, and the shear deformation of walls was set to be elastic since it was assumed that walls have sufficient shear strength. Table 1 summarizes the properties of the first five modes of the wall structures, where it is found that the modal mass coefficients of all the RC shear wall structures fulfill the relations of Equations (5) and (6) simultaneously, and the first two modes dominate the structural response of all the wall structures.
In this study, 5% Rayleigh damping was assigned to the first and third modes to model the inherent damping of the structure. A few studies in the past [37,38,39] illustrated that this approach could result in fictitiously large damping forces, which underestimated the first-mode and higher-mode dominated responses. These studies proposed solutions to mitigate this shortcoming. Future studies should also consider alternative approaches proposed in the literature for modelling the viscous damping of the structure and investigate the effect of modelling damping on record-to-record variabilities.

3.2. Characteristics of the Seed IGMs

The target spectra for selecting and scaling the seed IGMs are conditional mean spectra (CMSs) and the ASCE 7 design spectra (DSs). Two DSs were constructed using two suites of parameters to consider different intensity levels. Table 2 summarizes the design parameters for the construction of the DSs.
For wall structure Wn (n = 1, 2, 3), two CMSs, namely Wn CMS 1 and Wn CMS 2, was constructed adopting the fundamental mode of the structure T1 of Wn as the conditional period. Thus, overall six CMSs have been built. The Abrahamson–Silva-Kamai model, Boore–Stewart–Seyhan–Atkinson, Campbell–Bozorgnia, and Chiou–Youngs models were adopted to construct CMSs. Each target CMS is the average spectrum of CMSs built with the four ground motion models mentioned above using the same construction conditions. The moment magnitude was 8.5 and 9.0 for Wn CMS 1 and Wn CMS 2, respectively. The fault type is a strike-slip fault, and the distance from the site to the rupture plane is not less than 12 km. The Vs30 of site soil is the average shear velocity of top 30 m site soil and is assumed to be 400 m/s. Therefore, the site is classified as Class C of NEHRP. Detailed information for constructing the CMS are summarizes in Table 3, and the target CMSs and DSs are shown in Figure 2. It is seen from Figure 2 that CMSs built with the exact moment magnitude, but different conditioning periods are identical.
A set of twenty seed IGMs were selected and scaled from the strong ground motion database of the Pacific Earthquake Engineering Research Centre (PEER) [40], concerning each target spectrum. Therefore, eight sets of seed IGMs were selected. The criteria for the IGMs selection were: (1) the soil type of the site is class C of NEHRP for all the IGMs; (2) the distance from the recording stations to the epicentre should be not less than 12 km; (3) the range of moment magnitudes of earthquake events for all the IGMs is 6.5 to 9.0.
To ensure the response spectra of selected IGMs fit well with the target spectra, the average computed weighted mean squared error (MSE) between the response spectrum of each IGMs and target spectrum was minimized. When selecting and scaling seed IGMs for motion sets 1 and 2 with respect to the DSs, the scale factor has a value range of 1.0 to 5.0, and the weight value of 1.0 is set for periods ranging from 0.1 s to 5.0 s in the computation of MSE. The scale factor value ranges from 3.0 to 5.0 for motion sets 3–8, whose IGMs were selected and scaled with respect to CMS [41]. When minimizing the MSE for motion sets 3–8, the weight value is set to be 1.0 for from 0.2 T1 to 2 T1, where T1 is the conditioning period for the target CMS. Detailed criteria for the scaling of IGMs are listed in Table 4. Detailed information on the seed IGMs is provided in Appendix A.

3.3. IGM Selection for the NLRHA of RC Shear Wall Structures

To investigate the capability of the MGMS on selecting more proper IGMs for the NLRHA of RC shear wall structures, two spectra-matching-based IGM selection methods were employed to select IGMs from the seed motion sets. These two IGM selection procedures are uniformly weighted closest spectra matching procedure (UW-CM), which is widely used in the research and engineering practice, and variably weighted closest spectra matching procedure (VW-CM), which was recently developed in [28]. The UW-CM selects seven IGMs that have the lowest MSE, for which the weight value is 1.0 for all the period points within the period range of 0.2 Tl and 2 Tl, between the response spectra of the IGMs and target spectrum. The VW-CM method also selects seven IGMs with the lowest MSE. Still, the weight value for different periods varies to take into account the contribution of the different modes to the structural seismic responses. The VW-CM method calculates the MSE of motion j with the following equation:
M S E j V W = i = 1 n [ α i T = 0.5 ( T i + 1 + T i ) 0.5 ( T i + 1 + T i ) o r 1.5 T 1 ( S a j ( T ) S a t ( T ) ) 2 i = 1 n α i ]
where S a j ( T ) and S a t ( T ) are the spectrum acceleration value of motion j and target spectrum, respectively; T i is period of ith mode; α i is the modal mass coefficient of ith mode; n is the number of modes that ensure the sum of modal mass coefficients is not less than 90%.
Since the whole set of seed IGMs have similar response spectra and the broadest range of FCCTD, the mean seismic demand of NLRHA with the entire set of seed IGMs is the most reliable seismic demand. Thus, in this study, the mean seismic demand computed with all the seed IGMs of the set was employed as the reference seismic demand, and the average spectrum of IGMs of the whole motion set was adopted as the target spectrum, when adopting CM procedures to select IGMs from each seed motion set. The mean seismic demands from NLRHA with IGMs selected with different IGM selection methods were compared to investigate the rationality of the selected IGMs. NLRHA with motion sets 1 and 2 were conducted for all the shear wall structures. IGMs of sets 3–8 were adopted for the NLRHA of wall structures whose fundamental mode period is the same as the conditioning period of the target CMS of the set. Table 4 summarizes the motion sets for the NLHRA of different wall structures.
It is known from the selection process that the MGMS procedure ensures that the response spectra of the selected IGMs match well with the mean spectrum of the set, and the chosen IGMs can cause the most significant interaction of the first two dominated modes. Although both UW-CM and VW-CM procedures ensure that the response spectra of the selected IGMs match best with the mean spectrum of the set, the VW-CM considers the different contributions of modes to the seismic response of structures. The mean spectra of the twenty seed IGMs of the set (symbolized as Mean-20), mean spectra of MGMS selected IGMs (symbolized as MGMS-Wn), mean spectra of UW-CM-selected IGMs (symbolized as UW-CM-Wn) and mean spectra of VW-CM-selected IGMs (symbolized as VW-CM-Wn) are presented in Appendix A.

4. Results and Discussions

4.1. Comparison of the Results of MGMS Procedures

Figure 3 presents the seismic demands of wall structure W2 under motion set 6 adopting IGMs selected by MGMS procedures with and without considering the modal response characteristics of the RC shear wall structures, which is denoted as 2-mode and 3-mode, respectively. In Figure 3, the mean demands of the NLRHA with the whole set of IGMs are plotted and marked as “Mean”. The presented MGMS procedure for RC shear wall structures, considering modal response characteristics of shear wall structures, selected seven IGMs that induced the most significant interaction of the first two modes from the seed IGMs set. The original MGMS procedure that does not take modal response characteristics of the RC shear wall structures into account selected seven IGMs that caused the most significant interaction of the first three modes for the NLRHA of the shear wall structures following the procedure in Reference [30].
It is found that no matter whether the modal response characteristics of the shear walls were considered, the MGMS procedures can select proper IGMs for the NLRHA of the structure and seismic demands by both MGMS procedures are close to the benchmark demands. It is also noticed that IGMs selected by the MGMS procedure considers the modal response characteristics of the RC shear walls led to a more accurate computation of most of the seismic demands since the seismic demands approximated the benchmark demand better. The more reliable computed seismic demand shows the necessity and rationality of considering the modal response characteristics of shear wall structures in selecting IGMs with the MGMS procedure.

4.2. Comparison of Seismic Demands by Different IGM Selection Procedures

Figure 4, Figure 5, Figure 6 and 
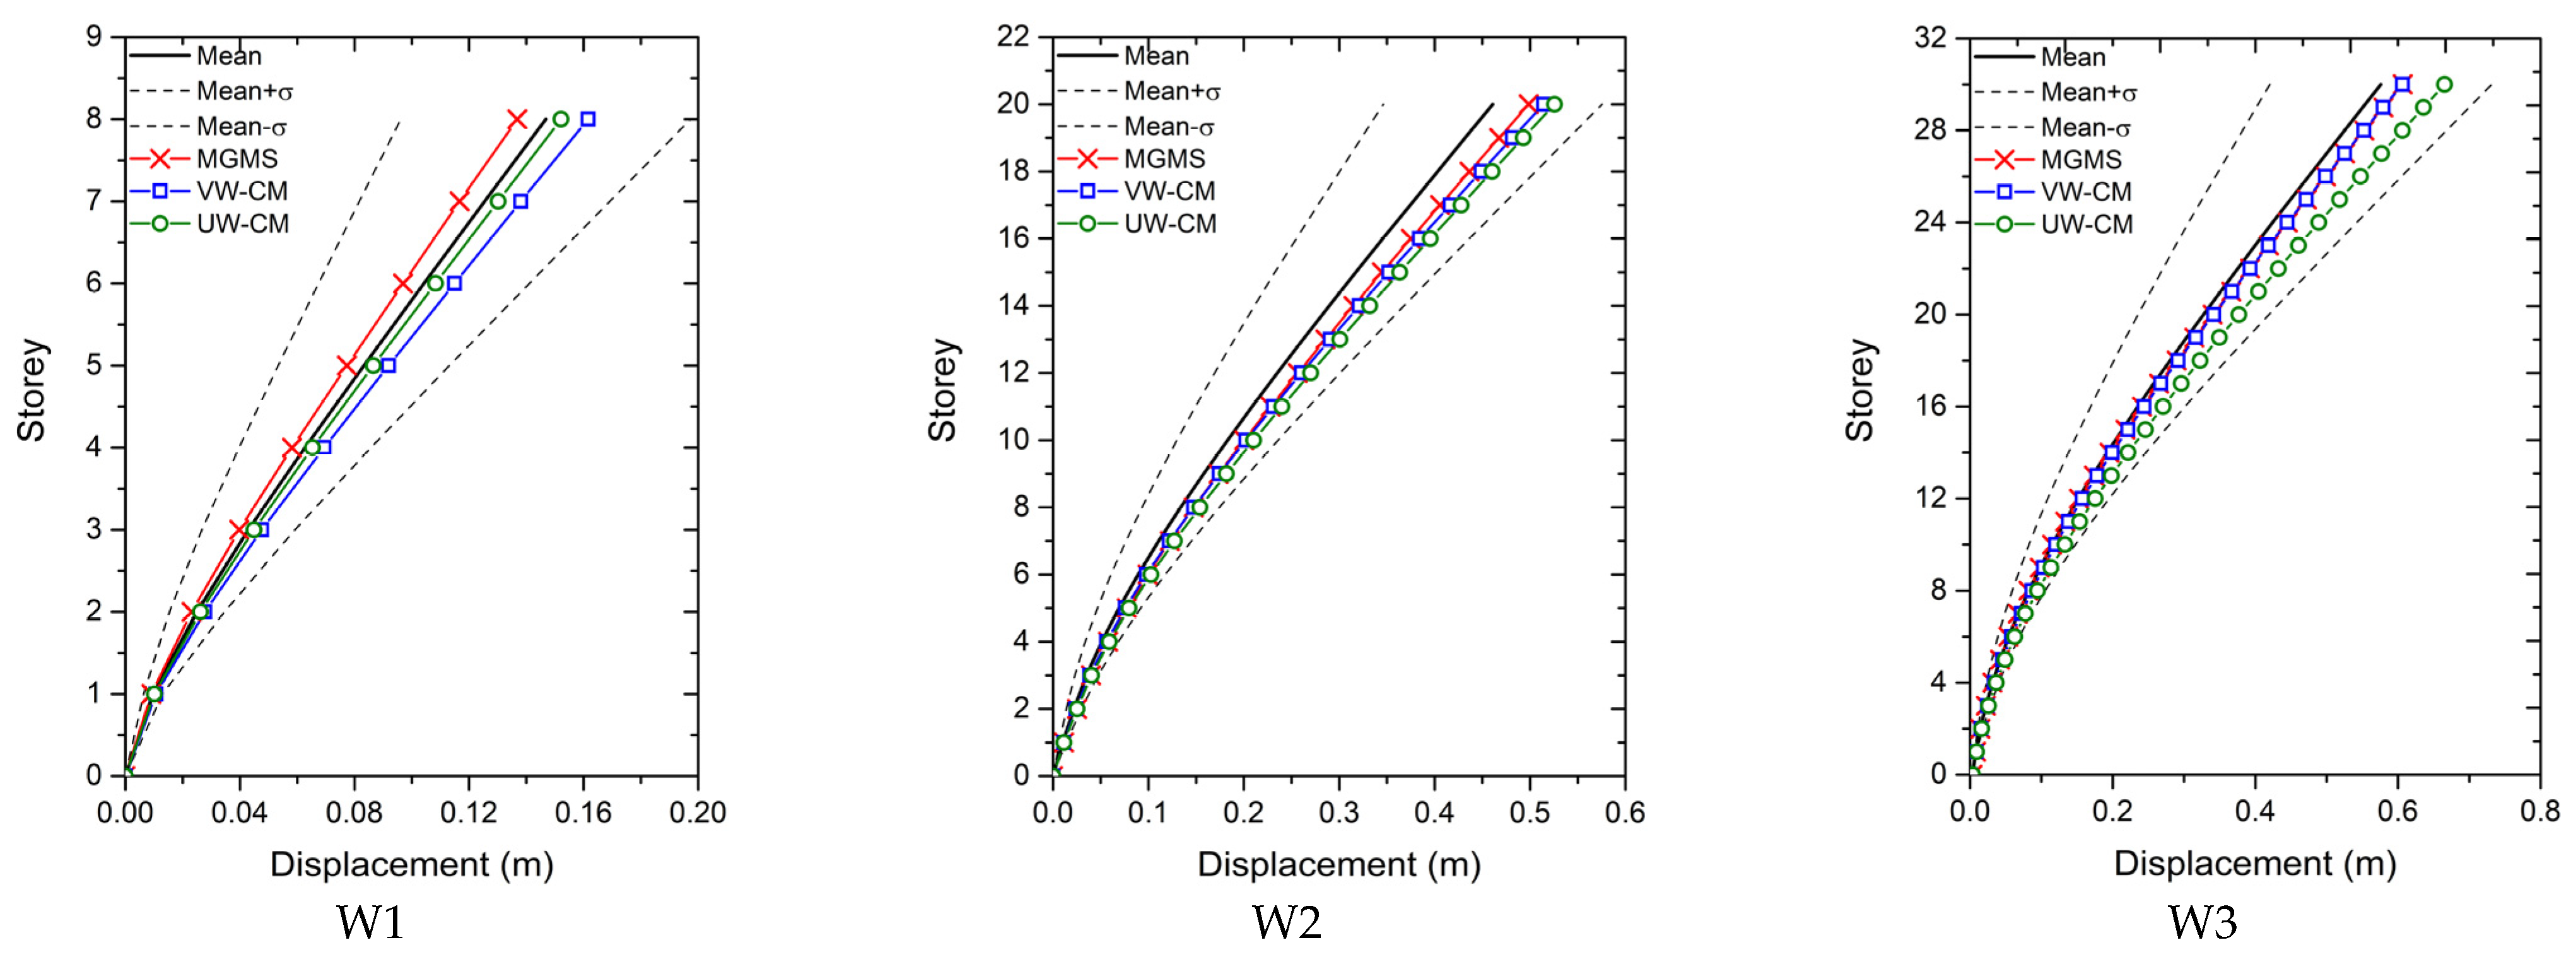
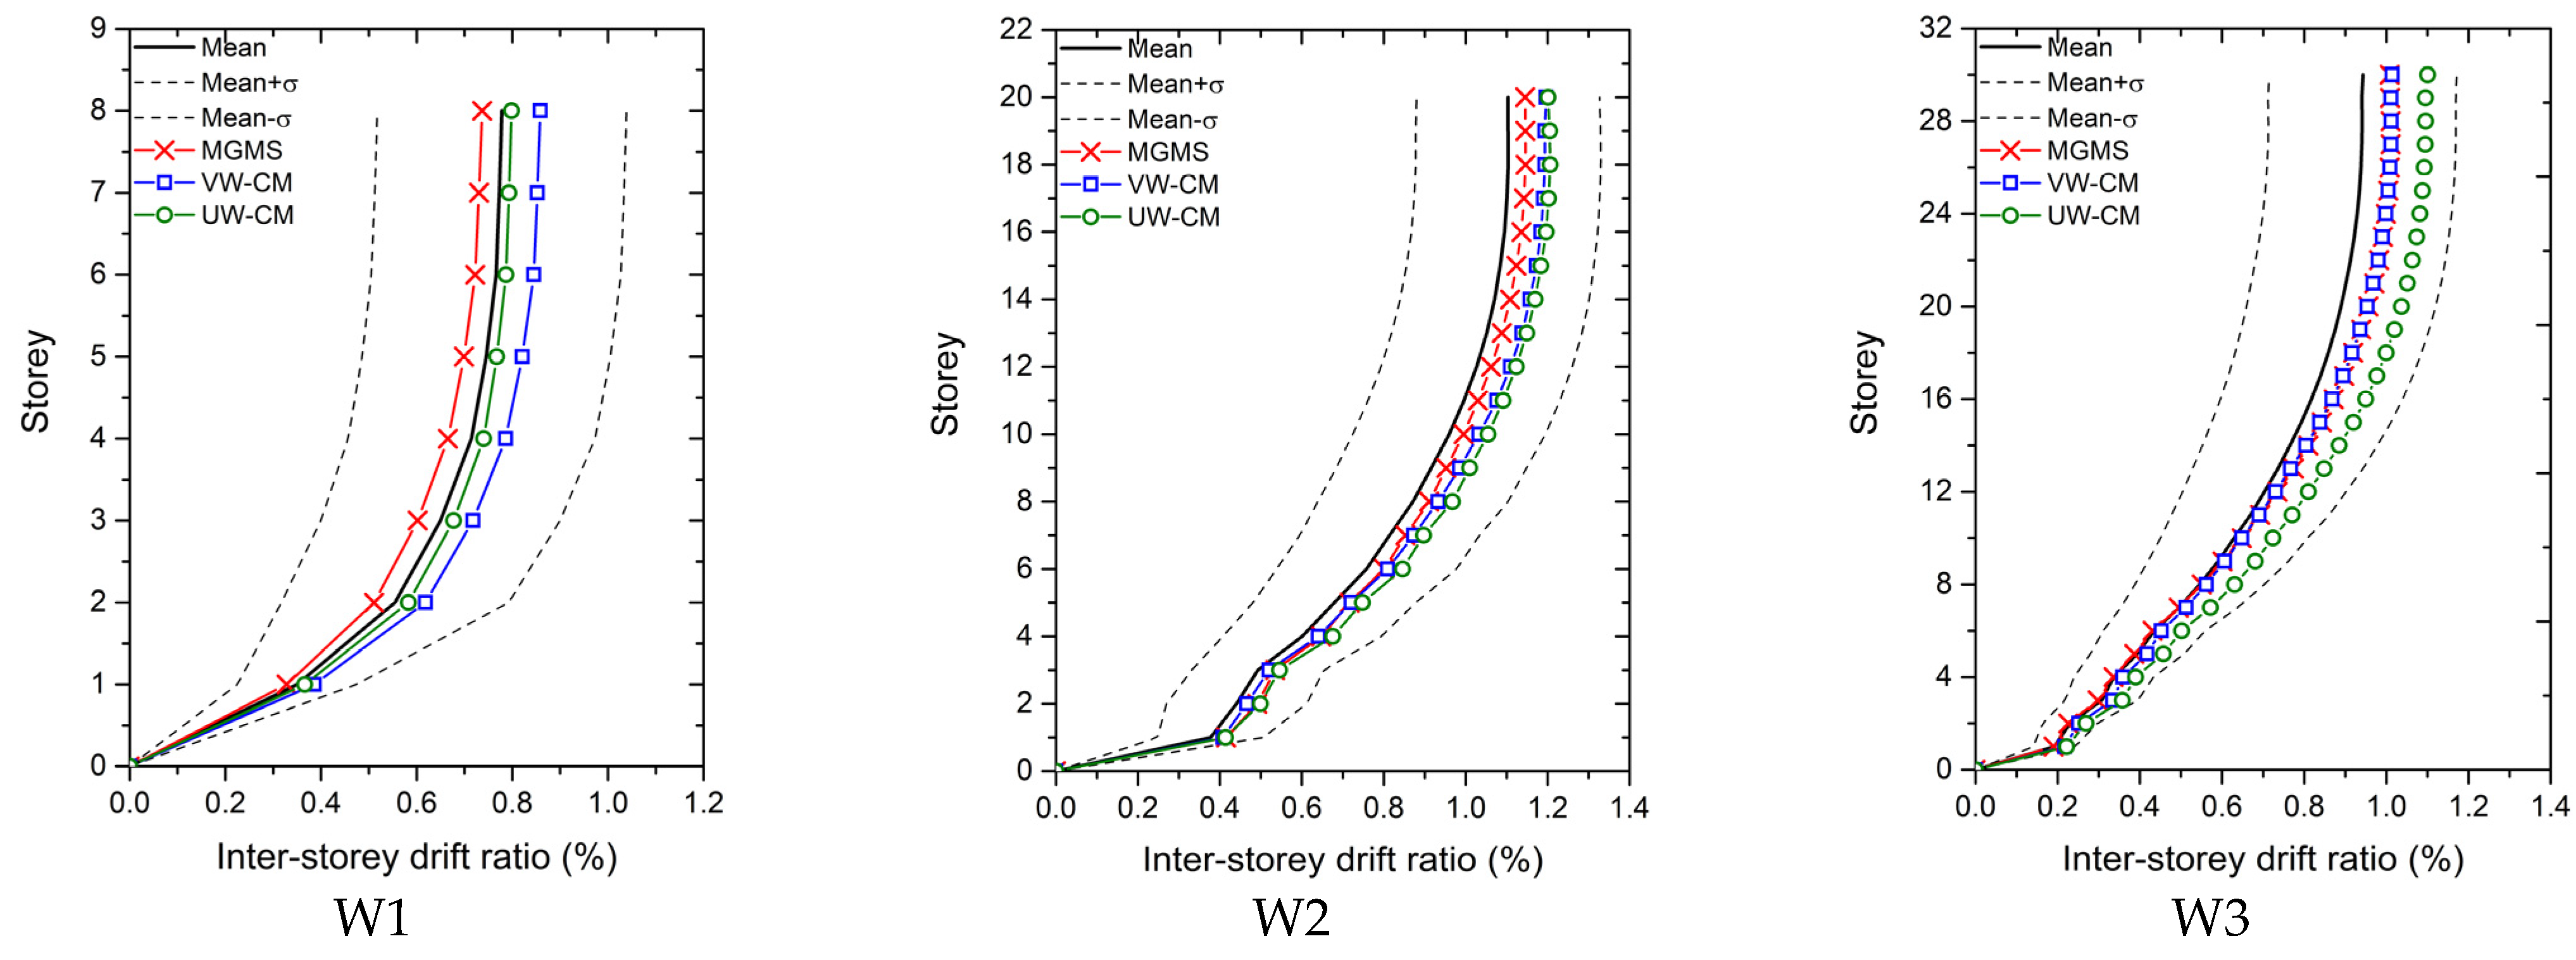
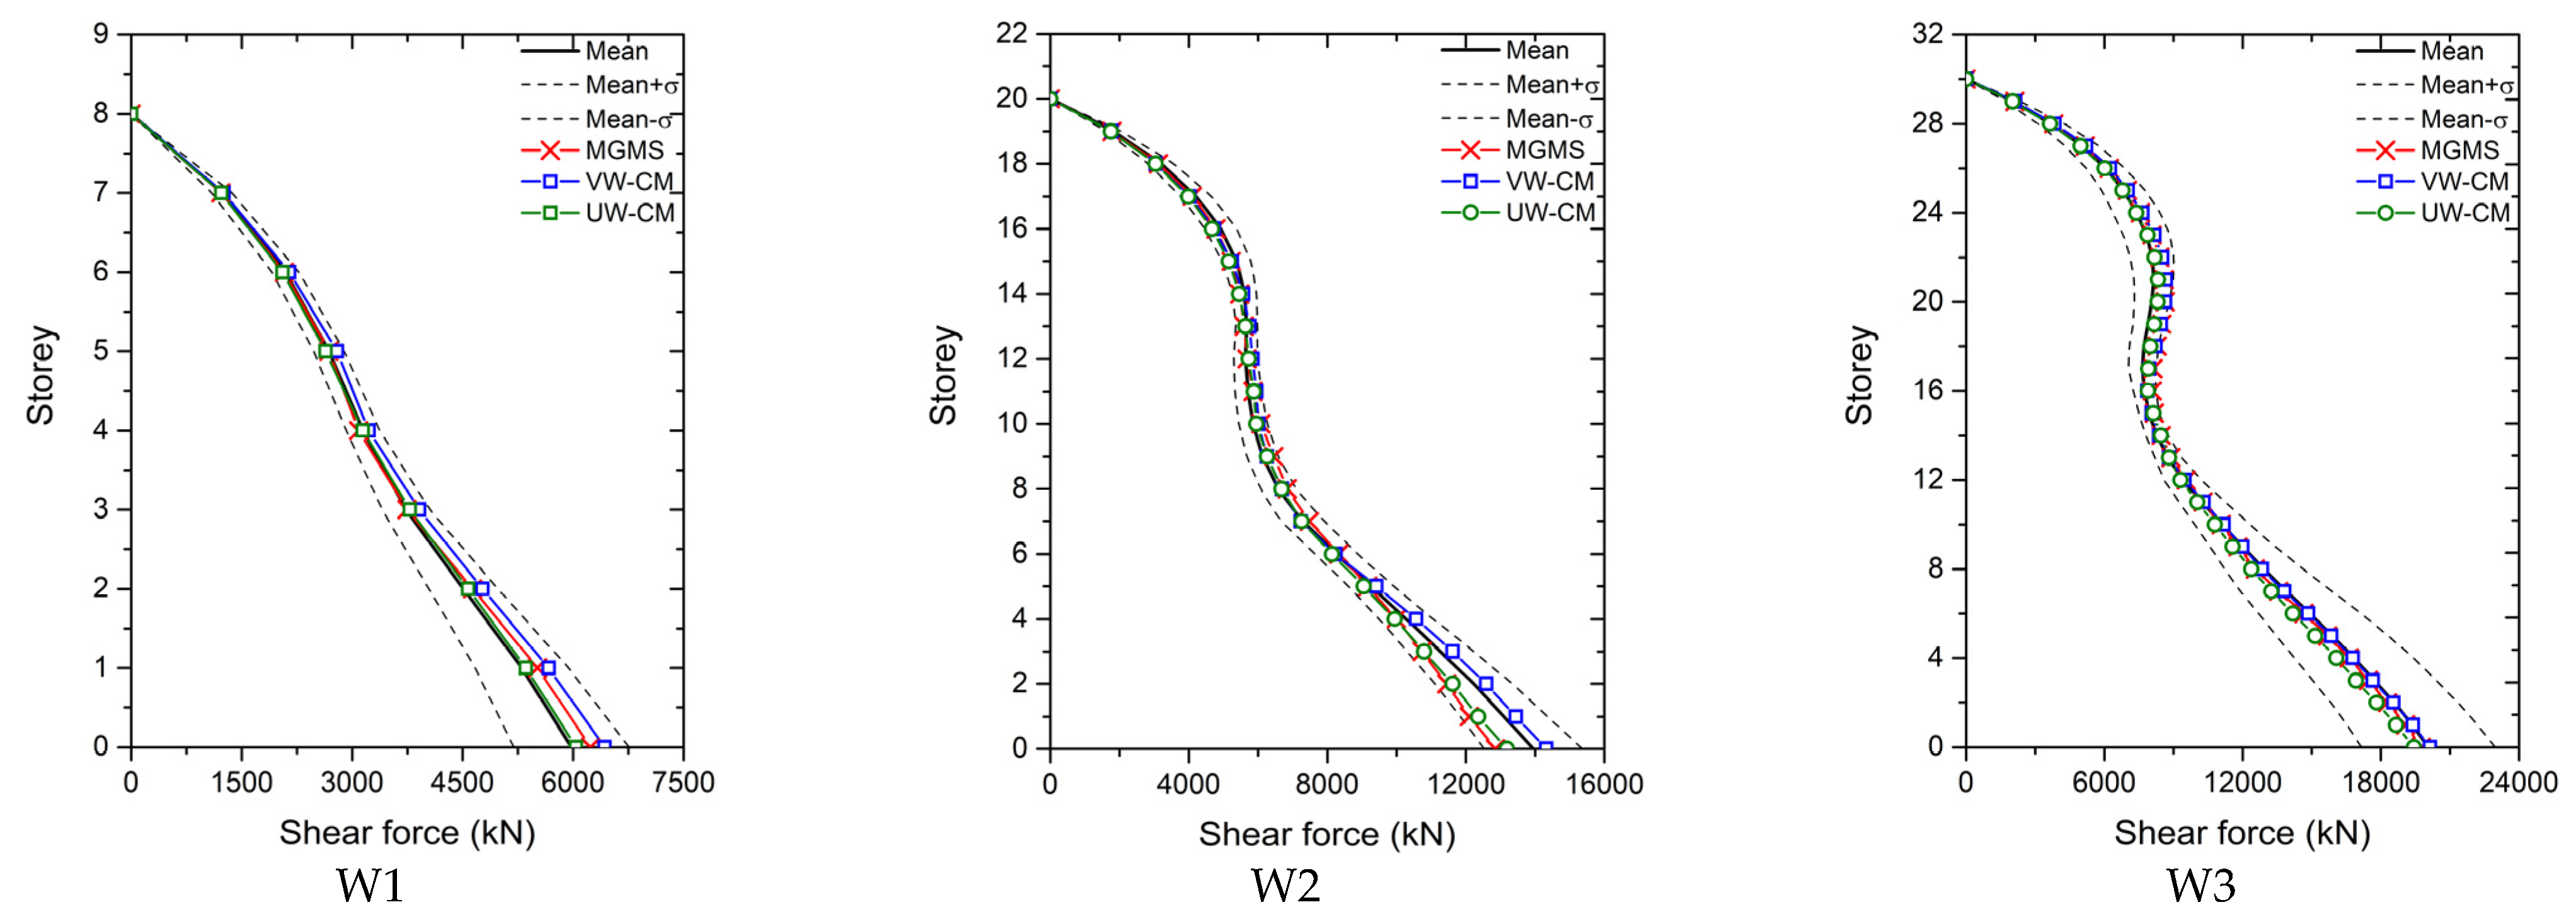
Figure 7 present the floor displacements, inter-story drift ratio, shear force, and bending moment computed by the IGMs from motion sets 2. The mean seismic demands of the set plus and minus one standard deviation of the demands, denoted as Mean + σ and Mean − σ, are also plotted. It is clear from Figure 4, Figure 5, Figure 6 and Figure 7 that the ratio of one standard deviation of seismic deformation to the mean deformation is much larger than that of seismically induced force. As a result, the seismic deformation is more sensitive to the variation of IGMs, compared with seismically induced force.
As shown in Figure 4, the IGMs selected by the MGMS procedure and CM procedures caused a less and more conservative prediction of the floor displacement for all the stories of W1, respectively. Displacement calculated with UW-CM selected IGMs matched the best with the mean displacement of the set. When calculating the floor displacement of W2, NLRHA with IGMs chosen by all the selection methods led to an overestimated floor displacement. Still, the displacement by the MGMS-IGMs approximates the reference displacement the best. Floor displacement of W3 under motion set 2 calculated by IGMs selected by all the selection procedures is conservative. The displacements of MGMS-IGMs and VW-CM-IGMs are similar and close to the benchmark displacement.
Considering the inter-story drift ratio of W1, the UW-CM selected IGMs led to the most reliable computation of the drift ratio, although the drift ratio computed with UW-CM-IGMs is conservation. The MGMS selected IGMs and VW-CM selected IGMs induced an under- and overestimation of the inter-story drift ratio of W1, respectively. The results of the MGMS-IGMs are closer to the mean drift ratio of the set. As for W2 and W3, inter-story drift ratios were overestimated by IGMs selected by all the IGM selection methods, but those computed with the MGMS-IGMs matched the best with the reference drift ratio. Comparing the inter-story drift ratio of W2 and W3 calculated by the CM procedures, the results from NLRHA with VW-CM selected IGMs have better approximations to the benchmark drift ratio.
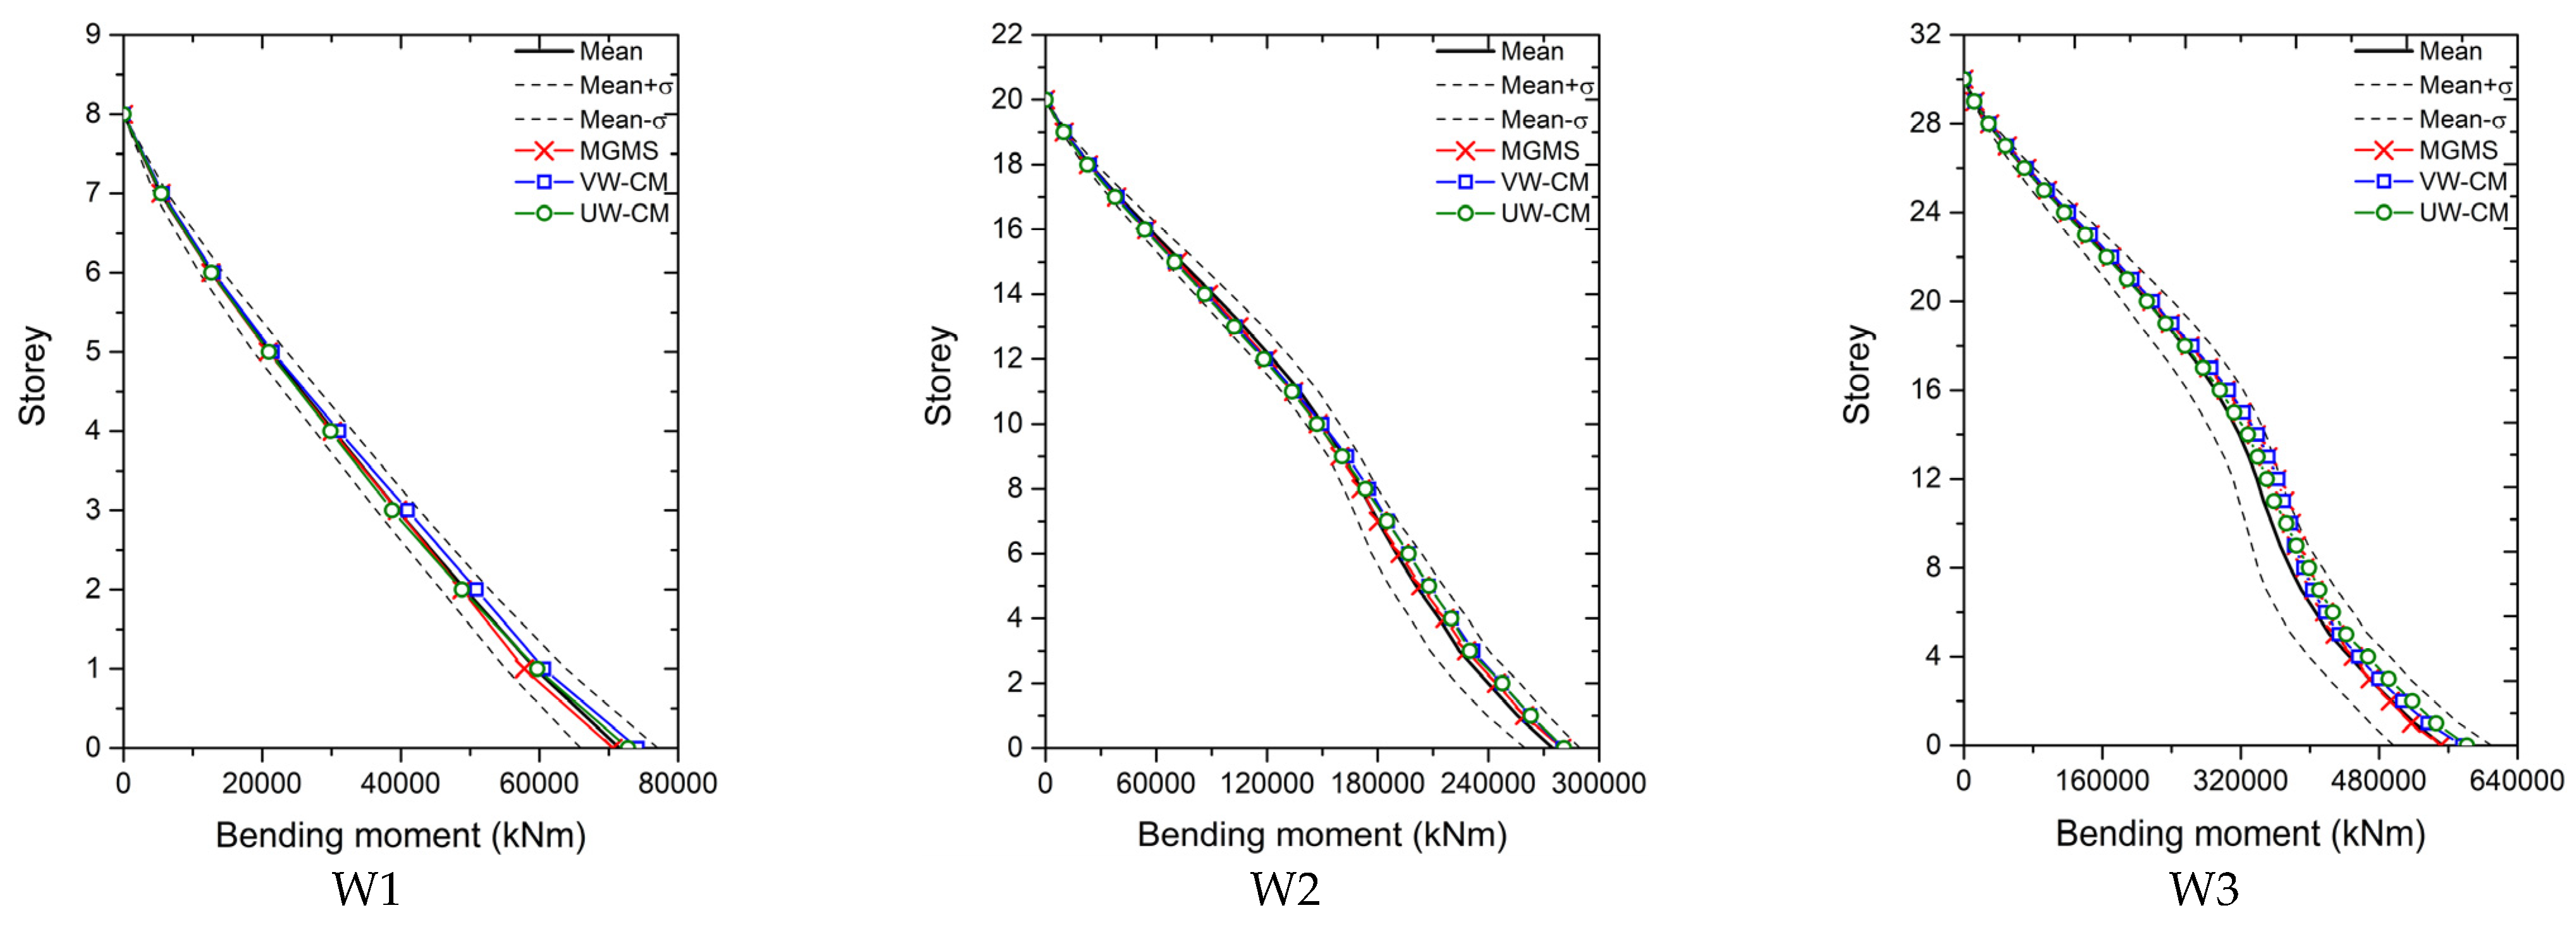
It can be found in Figure 7 and Figure 8 that IGMs of MGMS and both CM procedures could ensure shear force and bending moment of all the RC shear wall structures approximate the reference forces well in the upper floors. For shear force at lower stories, the UW-CM selected IGMs, VW-CM selected IGMs and MGMS-selected IGMs led to the most reliable computation of shear force of W1, W2 and W3, respectively. The bending moment of W1 at lower stories computed with UW-CM-IGMs is the closest to the reference bending moment, and the bending moment of W2 and W3 at lower floors from NLRHA with MGMS-IGMs has the best approximation to the mean moment of the set.
By comparing the seismically induced deformation and force of the wall structures under motion set 2, it is found that both MGMS procedure and CM procedures can select IGMs that ensure the seismic demands close to the mean demands of NLRHA with IGMs of the whole motion set. Additionally, MGMS-IGMs tend to provide a more reliable estimation of the seismic demands than CM procedures selected IGMs.

4.3. Comparison of the Deviation of the Computed Demands

The deviation between the seismic demands by different IGM selection procedures and the benchmark demands was calculated to quantitatively compare the reliability and reasonability of the seismic demands of NLRHA with a diverse selection of IGMs. The deviation δ N i j shows the relative difference between the benchmark demands of motion set j and demands computed using IGMs from IGM selection method N at the ith story, respectively, which are calculated as:
δ N i j = | d N i j d i j ¯ d i j ¯ | × 100 %
where N is the IGM selection methods, namely the MGMS method, UW-CM method and VW-CM method; d N i j is the i-th story’s seismic demands calculated using IGMs selected by method N for motion set j; d i j ¯ is the benchmark demands ith story for motion set j, which are the means demand of NLRHA with all IGMs of the set.
The statistics of the deviations are presented using box plots in Figure 8. Deviations of MGMS procedure and CM procedures are compared for motion sets containing seed IGMs selected and scaled concerning design spectra and conditional mean spectra. For each plot, the highest and lowest edges of the cirrus stand for the largest and lowest deviation. The horizontal axial value of the line inside the box is the mean deviation. The horizontal axial values of the upper and lower box edges are the deviation value of 75th and 25th percentiles, respectively. The mean deviation value shows the reliability of the IGM selection procedure. Additionally, as the smaller the difference between the 75th percentile deviation and 25th percentile deviation (75th-25th deviation difference) is, the trend of distribution of computed seismic demands along the height of the structure is closer to that of the benchmark seismic demands. Therefore, the 75th-25th deviation difference reveals the reasonability of the IGMs selected by the different selection methods.
Comparing the mean deviation of the seismic demands, it is evident that the MGMS-IGMs and VW-CM-IGMs can achieve a much lower mean deviation than that of the UW-CM selected IGMs, except for computing shear forces with IGMs selected with DSs being the target spectra. Therefore, the reliability of NLRHA with UW-CM-IGMs is lower than that of NLRHA with IGMs chosen by the other two IGM selection methods. The mean deviation of seismic deformation, including inter-story drift ratio and floor displacement, by MGMS-IGMs and VW-CM-IGMs is similar when using the DS as the target spectra. Meanwhile, a more than 27% lower mean deviation of seismic deformation by IGMs selected by MGMS procedure is noticed when selecting and scaling IGMs referring to CMSs. Considering the seismically induced forces, the MGMS selected IGMs, and the VW-CM selected IGMs have a higher mean deviation of shear force and bending moment, respectively, but the difference is insignificant.
The 75th-25th deviation difference of most seismic demands of the UW-CM method is much higher than that of MGMS and VW-CM methods, indicating lower reasonability of the UW-CM selected IGMs. Comparing the 75th-25th deviation difference of seismic deformation of the VW-CM and MGMS methods, it is found that the deviation difference of the MGMS procedure is over 38% and 54% lower than that of the VW-CM method when the target spectrum is DSs and CMSs, respectively. Compared with the VW-CM method, the MGMS procedure tends to have a slightly lower and higher 75th-25th deviation difference of seismically induced forces, when the target spectra for selecting and scaling the IGMs are DSs and CMs, respectively.
Based on the comparison of deviation of the computed demands, it is clear that considering the modal contribution in the IGM selection procedure, the VW-CM procedure can select more reliable and reasonable IGMs, compared with the UW-CM procedure. Compared with the VW-CM procedure, the MGMS procedure for RC shear wall structures can achieve a noticeable lower mean deviation and 75th-25th deviation difference of the seismic deformation while having a similar mean deviation and deviation difference of the seismically induced forces. Meanwhile, it is seen in Figure 8 that the seismically induced force is less sensitive to the variation of the IGMs and the seismic deformation is the control seismic demand in the seismic design and analysis of building structures. Therefore, selecting IGMs with MGMS procedure could considerably improve the reliability and reasonability of the NLRHA of RC shear wall structures.

5. Conclusions

This paper presents a modification on the modal-based ground motion selection (MGMS) procedure for more proper consideration of the modal response characteristics of the RC shear wall structures in the input ground motions (IGMs) selection procedure. The first two modes dominated the dynamic behaviour of most shear wall structures with a symmetric plan. Therefore, the proposed MGMS procedure for the wall structures considers the impact of frequency contents combinations in the time domain (FCCTD) of IGMs on the seismic demand of building structures with the interaction of the first two modes. The capability of the MGMS in selecting more proper IGMs for the NLRHA of RC shear wall structures was verified with a comprehensive case study, where three reinforced concrete shear wall structures with different heights are studied. The conditional mean spectra (CMSs) and ASCE 7-16 design spectra (DSs) were adopted to select eight overall sets of twenty seed IGMs. Mean seismic demands of the RC shear walls computed using the whole set of seed IGMs were employed as the reference demands for the comparison. Two spectrum-matching based IGM selection methods that select IGMs whose response spectra have the closest matching concerning the mean spectrum of the set were adopted to investigate the MGMS procedure’s capability to improve the reliability and reasonability of the NLRHA. These two IGM selection procedures are uniformly weighted closest spectra matching procedure (UW-CM) and variably weighted closest spectra matching procedure (VW-CM). From the comparison of the results, the following conclusions can be drawn:
  • Considering the modal response characteristics of RC shear wall structures, the MGMS procedure for shear wall structures presented led to a more reliable computation of seismic demands than the original version of the MGMS procedure.
  • Compared with the CM procedure with uniformly weight value for all the period points in computing difference between the response spectra of IGMs and mean spectra of the set (UW-CM), the CM procedure adopting variable weight value (VW-CM) procedure can ensure a more reliable and reasonable computation of seismic demands of RC shear wall structures.
  • Compared with the VW-CM procedure, the presented MGMS procedure could noticeably improve the reliability and reasonability of the computed seismic deformation, including the floor displacement and inter-story drift ratio, and achieve similar reliability and reasonability in calculating the seismically induced force.
  • Since the MGMS procedure just requires conducting NLRHA of equivalent single-degree-of-freedom systems, the computational consumption is minor. Taking advantage of high efficiency and great effectiveness in improving the reliability and reasonability of the NLRHA, the MGMS is an excellent supplement to the seismic design codes of practice’s IGM selection procedure for the NLRHA of wall structures.

Funding

This research was funded by Open Fund of Shock and Vibration of Engineering Materials and Structures Key Laboratory of Sichuan Province under grand No. 19kfgk06, and the National Natural Science Foundation of China under Grant No. 52108454, and Research Start-up Fund for High-level Talents of Huaqiao University under grand No. 20191XD042. The author is grateful to Professor Yang Liu from Huaqiao University for his valuable advice and help during the study.

Institutional Review Board Statement

Not applicable.

Informed Consent Statement

Not applicable.

Conflicts of Interest

The author declares no conflict of interest.

Nomenclature

The following acronyms and symbols are used in this paper.
CMSConditional mean spectrumiInfluence vector
CM-UWUniformly weighted closest spectra matching procedure L n Modal excitation factor of mode n
CM-VWVariably weighted closest spectra matching procedure m, c and kMass, damping, and stiffness matrices
DSdesign spectrum M n Generalized mass of mode n
FCCFDFrequency contents combination in the frequency domain S a j ( T ) Spectrum acceleration value of motion j at period T
FCCTDFrequency contents combination in the time domain S a t ( T ) Spectrum acceleration value of target spectra at period T
IDRInter-story drift ratio S d 1 Design spectrum acceleration at 1.0 s
IGMsInput ground motions S d s Design spectrum acceleration at 0.2 s
MGMSModal-based ground motion selection t k Any time point within the duration of IGM
MSEMean computed weighted mean squared error T j 0 duration of motion j
NL-ESDOFNonlinear equivalent single-degree-of-freedom system T L Long-period transition period
NLRHAnonlinear response time history analysis T n * Vibration period of NL-ESDOF of mode n
SDOFSingle-degree-of-freedom system u j n ^ The maximum displacement of NL-ESDOF of mode n under motion j
uDisplacement vector of floor u j n ( t k ) Displacement of NL-ESDOF of mode n under motion j at time tk
a n ( t ) Normalized top displacement time history of mode n u r n Roof displacement of mode n
d i j ¯ Benchmark demands ith story for motion set j V b n The base shear force of mode n
d M i j Seismic demands at ith story calculated using IGMs from selection method M for motion set j α i Modal mass coefficient of mode i
D n Peak displacement of mode n β j Maximum modal combination factor of motion j
d n Displacement of ESDOFs of mode n β j k Maximum modal combination factor of motion j at time tk
D n ( t ) Top displacement time history of the mode n Γ n the modal participating factor of mode n
d n y Yield displacement of ESDOFs of mode n δ M i j The relative difference between the benchmark demands of motion set j and demands computed using IGMs from selection method M at the ith story
F s n Restoring force of ESDOFs of mode n ϕ n Mode shape of mode n
F s n y Yield force of ESDOFs of mode n ϕ r n Mode shape value at the roof of mode n

Appendix A

Figure A1. Elevation and plan views of wall structures.
Applsci 11 08230 g0a1
Figure A2. Section views of wall structures.
Applsci 11 08230 g0a2
Table A1. Details of IGMs of motion sets 1 and 2.
Record IDMotion Set 1Motion Set 2
Scale FactorRSN No.Component (deg)Scale FactorRSN No.Component (deg)
14.764RSN76204.106RSN1521
24.582RSN76903.828RSN2890
32.303RSN7872704.319RSN7350
43.548RSN82703.975RSN755195
54.805RSN1261E4.168RSN8270
64.790RSN1263E4.620RSN100590
74.415RSN1277E3.888RSN1282E
84.663RSN127E4.179RSN1297N
94.332RSN1300N3.610RSN1471E
102.098RSN1484E2.247RSN1541E
112.348RSN1500E2.619RSN176290
124.396RSN1522E4.536RSN179490
132.326RSN1762901.404RSN3748270
143.832RSN1794902.127RSN3750270
151.133RSN3748703.357RSN3751270
163.021RSN37512704.136RSN375790
173.642RSN3757902.624RSN4865NS
184.190RSN4844NS4.146RSN4872NS
193.803RSN4872NS2.729RSN5778NS
203.756RSN6980E2.862RSN5806NS
Figure A3. Mean spectra of IGMs selected from motion sets 1 and 2 with different selection procedures.
Applsci 11 08230 g0a3
Table A2. Details of IGMs of motion sets 3 and 4.
Record IDMotion Set 3Motion Set 4
Scale FactorRSN No.Component (deg)Scale FactorRSN No.Component (deg)
14.572RSN2803.666RSN7960
23.839RSN7361373.656RSN8270
33.266RSN82703.281RSN8320
43.544RSN83803.976RSN10190
53.552RSN101903.009RSN1083170
64.657RSN102904.225RSN1166180
73.774RSN11661803.127RSN1208E
83.615RSN1277E4.047RSN1277E
94.153RSN1293N4.080RSN1280E
104.606RSN1346N4.649RSN1293N
114.136RSN1349N4.629RSN1349N
124.613RSN1436E3.281RSN1471E
133.340RSN1488E3.738RSN1488E
142.997RSN1548E3.178RSN179490
152.964RSN3757903.318RSN375790
163.370RSN4844NS3.772RSN4844NS
173.741RSN4892NS4.187RSN4892NS
184.702RSN5681NS3.154RSN5284NS
193.061RSN6948E3.426RSN6948E
203.277RSN6949W3.085RSN6980E
Figure A4. Mean spectra of IGMs selected from motion sets 3 and 4 with different selection procedures.
Applsci 11 08230 g0a4
Table A3. Details of IGMs of motion sets 5 and 6.
Record IDMotion Set 5Motion Set 6
Scale FactorRSN No.Component (deg)Scale FactorRSN No.Component (deg)
13.2018RSN73103.7418RSN7310
22.9568RSN83203.7123RSN736137
33.4254RSN83804.8197RSN8120
43.9506RSN1261E3.4185RSN8270
53.5022RSN1277E3.4556RSN8320
64.7352RSN1279E3.0436RSN1208E
74.5283RSN1285E4.617RSN1261E
84.6728RSN1335E4.093RSN1277E
94.0228RSN1339E4.7014RSN1339E
104.3041RSN1436E4.8635RSN1431E
114.5664RSN1470E4.2951RSN1466E
123.3515RSN1475E3.0868RSN1471E
132.9285RSN3757904.3791RSN1522E
144.796RSN3994903.4225RSN375790
153.3816RSN4844NS3.952RSN4844NS
162.9919RSN4872NS3.4966RSN4872NS
173.065RSN5284NS3.582RSN5284NS
184.4291RSN5681NS3.8479RSN5776NS
194.4052RSN5796NS3.7347RSN6901W
203.1957RSN6901W3.3329RSN6980E
Figure A5. Mean spectra of IGMs selected from motion sets 5 and 6 with different selection procedures.
Applsci 11 08230 g0a5
Table A4. Details of IGMs of motion sets 7 and 8.
Record IDMotion Set 7Motion Set 8
Scale FactorRSN No.Component (deg)Scale FactorRSN No.Component (deg)
13.233RSN73104.0338RSN7310
23.4122RSN81204.2574RSN8120
34.8609RSN1232E3.2824RSN8270
43.9131RSN1261E3.6365RSN8320
53.2159RSN1263E3.1732RSN1208E
64.0754RSN1285E4.0125RSN1263E
73.7487RSN1339E4.6773RSN1339E
84.3745RSN1358E3.9016RSN1464E
94.6811RSN1436E3.9419RSN1465E
103.1593RSN1465E3.3486RSN1467E
113.2727RSN1469E4.0834RSN1469E
123.9213RSN1470E4.1845RSN1473E
133.3015RSN1522E4.1193RSN1522E
144.1946RSN1575E3.682RSN1523E
154.2539RSN1588N3.8839RSN1525E
164.1117RSN3994902.9612RSN3747270
173.1024RSN4882NS3.2803RSN4848NS
183.8213RSN5472NS3.8709RSN4882NS
194.228RSN5681NS4.7679RSN5472NS
204.1963RSN5804NS4.7607RSN5783NS
Figure A6. Mean spectra of IGMs selected from motion sets 7 and 8 with different selection procedures.
Applsci 11 08230 g0a6

References

  1. Katsanos, E.; Sextos, A.; Manolis, G.D. Selection of earthquake ground motion records: A state-of-the-art review from a structural engineering perspective. Soil Dyn. Earthq. Eng. 2010, 30, 157–169. [Google Scholar] [CrossRef]
  2. Chieffo, N.; Clementi, F.; Formisano, A.; Lenci, S. Comparative fragility methods for seismic assessment of masonry buildings located in Muccia (Italy). J. Build. Eng. 2019, 25, 100813. [Google Scholar] [CrossRef]
  3. Forcellini, D. Numerical simulations of liquefaction on an ordinary building during Italian (20 May 2012) earthquake. Bull. Earthq. Eng. 2019, 17, 4797–4823. [Google Scholar] [CrossRef]
  4. Forcellini, D. Soil-structure interaction analyses of shallow-founded structures on a potential-liquefiable soil deposit. Soil Dyn. Earthq. Eng. 2020, 133, 106108. [Google Scholar] [CrossRef]
  5. Petridis, C.; Pitilakis, D. Fragility curve modifiers for RC dual buildings to include nonlinear site effects and SSI. Earthq. Spectra 2020, 36, 1930–1951. [Google Scholar] [CrossRef]
  6. ASCE. Minimum Design Loads for Buildings and Other Structures (ASCE/SEI 7-17); American Society of Civil Engineering: Reston, VA, USA, 2017. [Google Scholar]
  7. CEN. ENV 1998-1 Eurocode 8: Design of Structures for Earthquake Resistance—Part 1: General Rules, Seismic Actions and Rules for Buildings; European Committee for Standardisation: Brussels, Belgium, 2004. [Google Scholar]
  8. Chinese Standard. Code for Seismic Design of Buildings, GB 50011-2010; Chinese Building Press: Beijing, China, 2008. [Google Scholar]
  9. NZS. Structural Design Actions (NZS 1170.5); Standards New Zealand Technical Committee: Wellington, New Zealand, 2004.
  10. Baker, J.W.; Cornell, C.A. A vector-valued ground motion intensity measure consisting of spectral acceleration and epsilon. Earthq. Eng. Struct. Dyn. 2005, 34, 1193–1217. [Google Scholar] [CrossRef]
  11. Tarbali, K.; Bradley, B.A. The effect of causal parameter bounds in PSHA-based ground motion selection. Earthq. Eng. Struct. Dyn. 2016, 45, 1515–1535. [Google Scholar] [CrossRef]
  12. Barbosa, A.R.; Ribeiro, F.L.A.; Neves, L. Influence of earthquake ground-motion duration on damage estimation: Application to steel moment resisting frames. Earthq. Eng. Struct. Dyn. 2016, 46, 27–49. [Google Scholar] [CrossRef]
  13. Pan, Y.; Ventura, C.E.; Finn, W.L.; Xiong, H. Effects of ground motion duration on the seismic damage to and collapse capacity of a mid-rise woodframe building. Eng. Struct. 2019, 197, 109451. [Google Scholar] [CrossRef]
  14. Tao, D.; Ma, Q.; Li, S.; Xie, Z.; Lin, D.; Li, S. Support Vector Regression for the Relationships between Ground Motion Parameters and Macroseismic Intensity in the Sichuan–Yunnan Region. Appl. Sci. 2020, 10, 3086. [Google Scholar] [CrossRef]
  15. Nguyen, V.-Q.; Aaqib, M.; Nguyen, D.-D.; Luat, N.-V.; Park, D. A Site-Specific Response Analysis: A Case Study in Hanoi, Vietnam. Appl. Sci. 2020, 10, 3972. [Google Scholar] [CrossRef]
  16. O’Donnell, A.P.; Kurama, Y.C.; Kalkan, E.; Taflanidis, A. Experimental evaluation of four ground-motion scaling methods for dynamic response-history analysis of nonlinear structures. Bull. Earthq. Eng. 2017, 15, 1899–1924. [Google Scholar] [CrossRef]
  17. Naeim, F.; Alimoradi, A.; Pezeshk, S. Selection and Scaling of Ground Motion Time Histories for Structural Design Using Genetic Algorithms. Earthq. Spectra 2004, 20, 413–426. [Google Scholar] [CrossRef] [Green Version]
  18. Al Atik, L.; Abrahamson, N. An Improved Method for Nonstationary Spectral Matching. Earthq. Spectra 2010, 26, 601–617. [Google Scholar] [CrossRef] [Green Version]
  19. Kayhan, A.H.; Korkmaz, K.A.; Irfanoglu, A. Selecting and scaling real ground motion records using harmony search algorithm. Soil Dyn. Earthq. Eng. 2011, 31, 941–953. [Google Scholar] [CrossRef]
  20. Wang, G. A ground motion selection and modification method capturing response spectrum characteristics and variability of scenario earthquakes. Soil Dyn. Earthq. Eng. 2011, 31, 611–625. [Google Scholar] [CrossRef]
  21. Reyes, J.C.; Riaño, A.C.; Kalkan, E.; Quintero, O.A.; Arango, C.M. Assessment of spectrum matching procedure for nonlinear analysis of symmetric- and asymmetric-plan buildings. Eng. Struct. 2014, 72, 171–181. [Google Scholar] [CrossRef]
  22. Jiang, W.; Li, B.; Xie, W.-C.; Pandey, M.D. Generate floor response spectra: Part 1. Direct spectra-to-spectra method. Nucl. Eng. Des. 2015, 293, 525–546. [Google Scholar] [CrossRef]
  23. Han, S.W.; Ha, S.J. Assessment of ground motion selection criteria specified in current seismic provisions with an accurate selection algorithm. Bull. Earthq. Eng. 2017, 15, 4113–4132. [Google Scholar] [CrossRef]
  24. Anajafi, H.; Medina, R.A. Uncertainties in using the spectrum matching technique for generating synthetic ground motions. In Proceedings of the 11th National Conference in Earthquake Engineering, Los Angeles, CA, USA, 25–29 June 2018. [Google Scholar]
  25. Anajafimarzijarani, H. Improved Seismic Design of Non-Structural Components (NSCs) and Development of Innovative Control Approaches to Enhance the Seismic Performance of Buildings and NSCs. Master’s Thesis, University of New Hampshire, Durham, UK, 2018. [Google Scholar]
  26. Mergos, P.E.; Sextos, A.G. Selection of earthquake ground motions for multiple objectives using genetic algorithms. Eng. Struct. 2019, 187, 414–427. [Google Scholar] [CrossRef]
  27. Baker, J.W.; Lee, C. An Improved Algorithm for Selecting Ground Motions to Match a Conditional Spectrum. J. Earthq. Eng. 2018, 22, 708–723. [Google Scholar] [CrossRef]
  28. Zhang, R.; Wang, D.S.; Chen, X.Y.; Li, H.N. Weighted scaling and selecting method of ground motions in time-history analysis considering influence of higher modes. China Civil. Eng. J. 2019, 52, 53–68. [Google Scholar]
  29. Chopra, A. Dynamics of Structures: Theory and Applications to Earthquake Engineering, 5th ed.; Pearson Prentice Hall: Upper Saddle River, NJ, USA, 2017. [Google Scholar]
  30. Liu, Y.; Kuang, J.; Yuen, T.Y. Modal-based ground motion selection procedure for nonlinear response time history analysis of high-rise buildings. Earthq. Eng. Struct. Dyn. 2019, 49, 95–110. [Google Scholar] [CrossRef]
  31. Stafford, B.; Coull, A. Tall Building Structures: Analysis and Design; John Wily: New York, NY, USA, 1991. [Google Scholar]
  32. Moradi, M.J.; Hariri-Ardebili, M.A. Developing a Library of Shear Walls Database and the Neural Network Based Predictive Meta-Model. Appl. Sci. 2019, 9, 2562. [Google Scholar] [CrossRef] [Green Version]
  33. Baker, J.W. Conditional Mean Spectrum: Tool for Ground-Motion Selection. J. Struct. Eng. 2011, 137, 322–331. [Google Scholar] [CrossRef]
  34. FEMA. Improvement of Nonlinear Static Seismic Analysis Procedures: FEMA-440; Federal Emergency Management Agency: Redwood, CA, USA, 2005.
  35. Huang, K. Continuum MDOF Model for Seismic Analysis of Wall-Frame Structures. Master’s Thesis, Hong Kong University of Science and Technology, Hong Kong, China, 2014. [Google Scholar]
  36. CSI SV. 18: Integrated Finite Element Analysis and Design of Structures Basic Analysis Reference Manual; Computers and Structures Inc.: Berkeley, CA, USA, 2018. [Google Scholar]
  37. Ryan, K.L.; Polanco, J. Problems with Rayleigh Damping in Base-Isolated Buildings. J. Struct. Eng. 2008, 134, 1780–1784. [Google Scholar] [CrossRef]
  38. Anajafi, H.; Medina, R.A.; Santini-Bell, E. Effects of the improper modeling of viscous damping on the first-mode and higher-mode dominated responses of base-isolated buildings. Earthq. Eng. Struct. Dyn. 2019, 49, 51–73. [Google Scholar] [CrossRef]
  39. Kitayama, S.; Constantinou, M.C. Effect of superstructure modeling assumptions on the seismic performance of seismically isolated buildings. Earthq. Eng. Struct. Dyn. 2021, 50, 1805–1823. [Google Scholar] [CrossRef]
  40. Chiou, B.S.J.; Darragh, R.; Gregor, N.; Silva, W.J. NGA Project Strong-Motion Database. Earthq. Spectra 2008, 24, 23–44. [Google Scholar] [CrossRef] [Green Version]
  41. Du, W.; Ning, C.; Wang, G. The effect of amplitude scaling limits on conditional spectrum-based ground motion selection. Earthq. Eng. Struct. Dyn. 2019, 48, 1030–1044. [Google Scholar] [CrossRef]
Figure 1. Flowchart of MGMS procedure of wall structures.
Applsci 11 08230 g001
Figure 2. Target spectra for the IGM selection and scaling.
Applsci 11 08230 g002
Figure 3. Comparison of the benchmark seismic demands and seismic demands computed by IGMs selected by MGMS procedures for motion set 6.
Applsci 11 08230 g003
Figure 4. Comparison of the floor displacements of wall structures under motion Set 2.
Applsci 11 08230 g004
Figure 5. Comparison of the inter-story drift ratio of wall structures under motion Set 2.
Applsci 11 08230 g005
Figure 6. Comparison of the shear force of wall structures under motion Set 2.
Applsci 11 08230 g006
Figure 7. Comparison of the bending moment.
Applsci 11 08230 g007
Figure 8. Deviations between the seismic demands from different IGM selection procedures and benchmark demands.
Applsci 11 08230 g008
Table 1. Modal properties of shear wall structures.
NO.Mode
12345
T (s) α T (s) α T (s) α T (s) α T (s) α
W10.6250.6800.1270.2000.0610.0450.0470.0090.0410.016
W21.8300.6420.3410.2050.1450.0600.0900.0270.0660.015
W32.3920.6300.4360.2000.1820.0640.1100.0310.0790.020
Table 2. Design parameters of the ASCE design spectra.
Spectrum No.Sds (g)Sd1 (g)TL (s)
DS 11.000.7512
DS 21.200.8510
Note: Sds and Sd1 are spectral accelerations at 0.2 s and 1 s, respectively. TL is the transition period of the long-period.
Table 3. Conditions for the construction of the CMSs.
Conditional Mean SpectrumConditioning PeriodMoment MagnitudeDistance to Rupture PlaneVs30
W1 CMS 10.625 s8.5 ≥12 km 400 m/s
W2 CMS 11.830 s
W3 CMS 12.391 s
W1 CMS 20.625 s9.0
W2 CMS 21.830 s
W3 CMS 22.391 s
Table 4. IGMs scaling criteria.
Motion Set Target SpectrumScaling FactorThe Period Range for Minimizing the MSEStructures Adopted for
1DS 11.0–5.01.0 s–5.0 sW1, W2, W3
2DS 21.0–5.01.0 s–5.0 sW1, W2, W3
3W1 CMS 13.0–5.00.125 s–1.250 sW1
4W1 CMS 23.0–5.00.125 s–1.250 sW1
5W2 CMS 13.0–5.00.366 s–3.660 sW2
6W2 CMS 23.0–5.00.366 s–3.660 sW2
7W3 CMS 13.0–5.00.478 s–4.781 s W3
8W3 CMS 23.0–5.00.478 s–4.781 s W3
Publisher’s Note: MDPI stays neutral with regard to jurisdictional claims in published maps and institutional affiliations.

