
Metabolomic Investigation of Synergistic Mechanism for Fangfeng Extract Preventing LPS Induced Neuroinflammation in BV-2 Microglia Cells

Abstract
:1. Introduction
2. Materials and Methods
2.1. Materials
2.2. Cell Culture and Drug Treatment
2.3. Real-Time PCR Assay
2.4. Statistical Analysis
2.5. Sample Preparation for LC-MS/MS
2.6. LC-MS Analysis
2.7. Metabolomics Data Analysis
3. Results
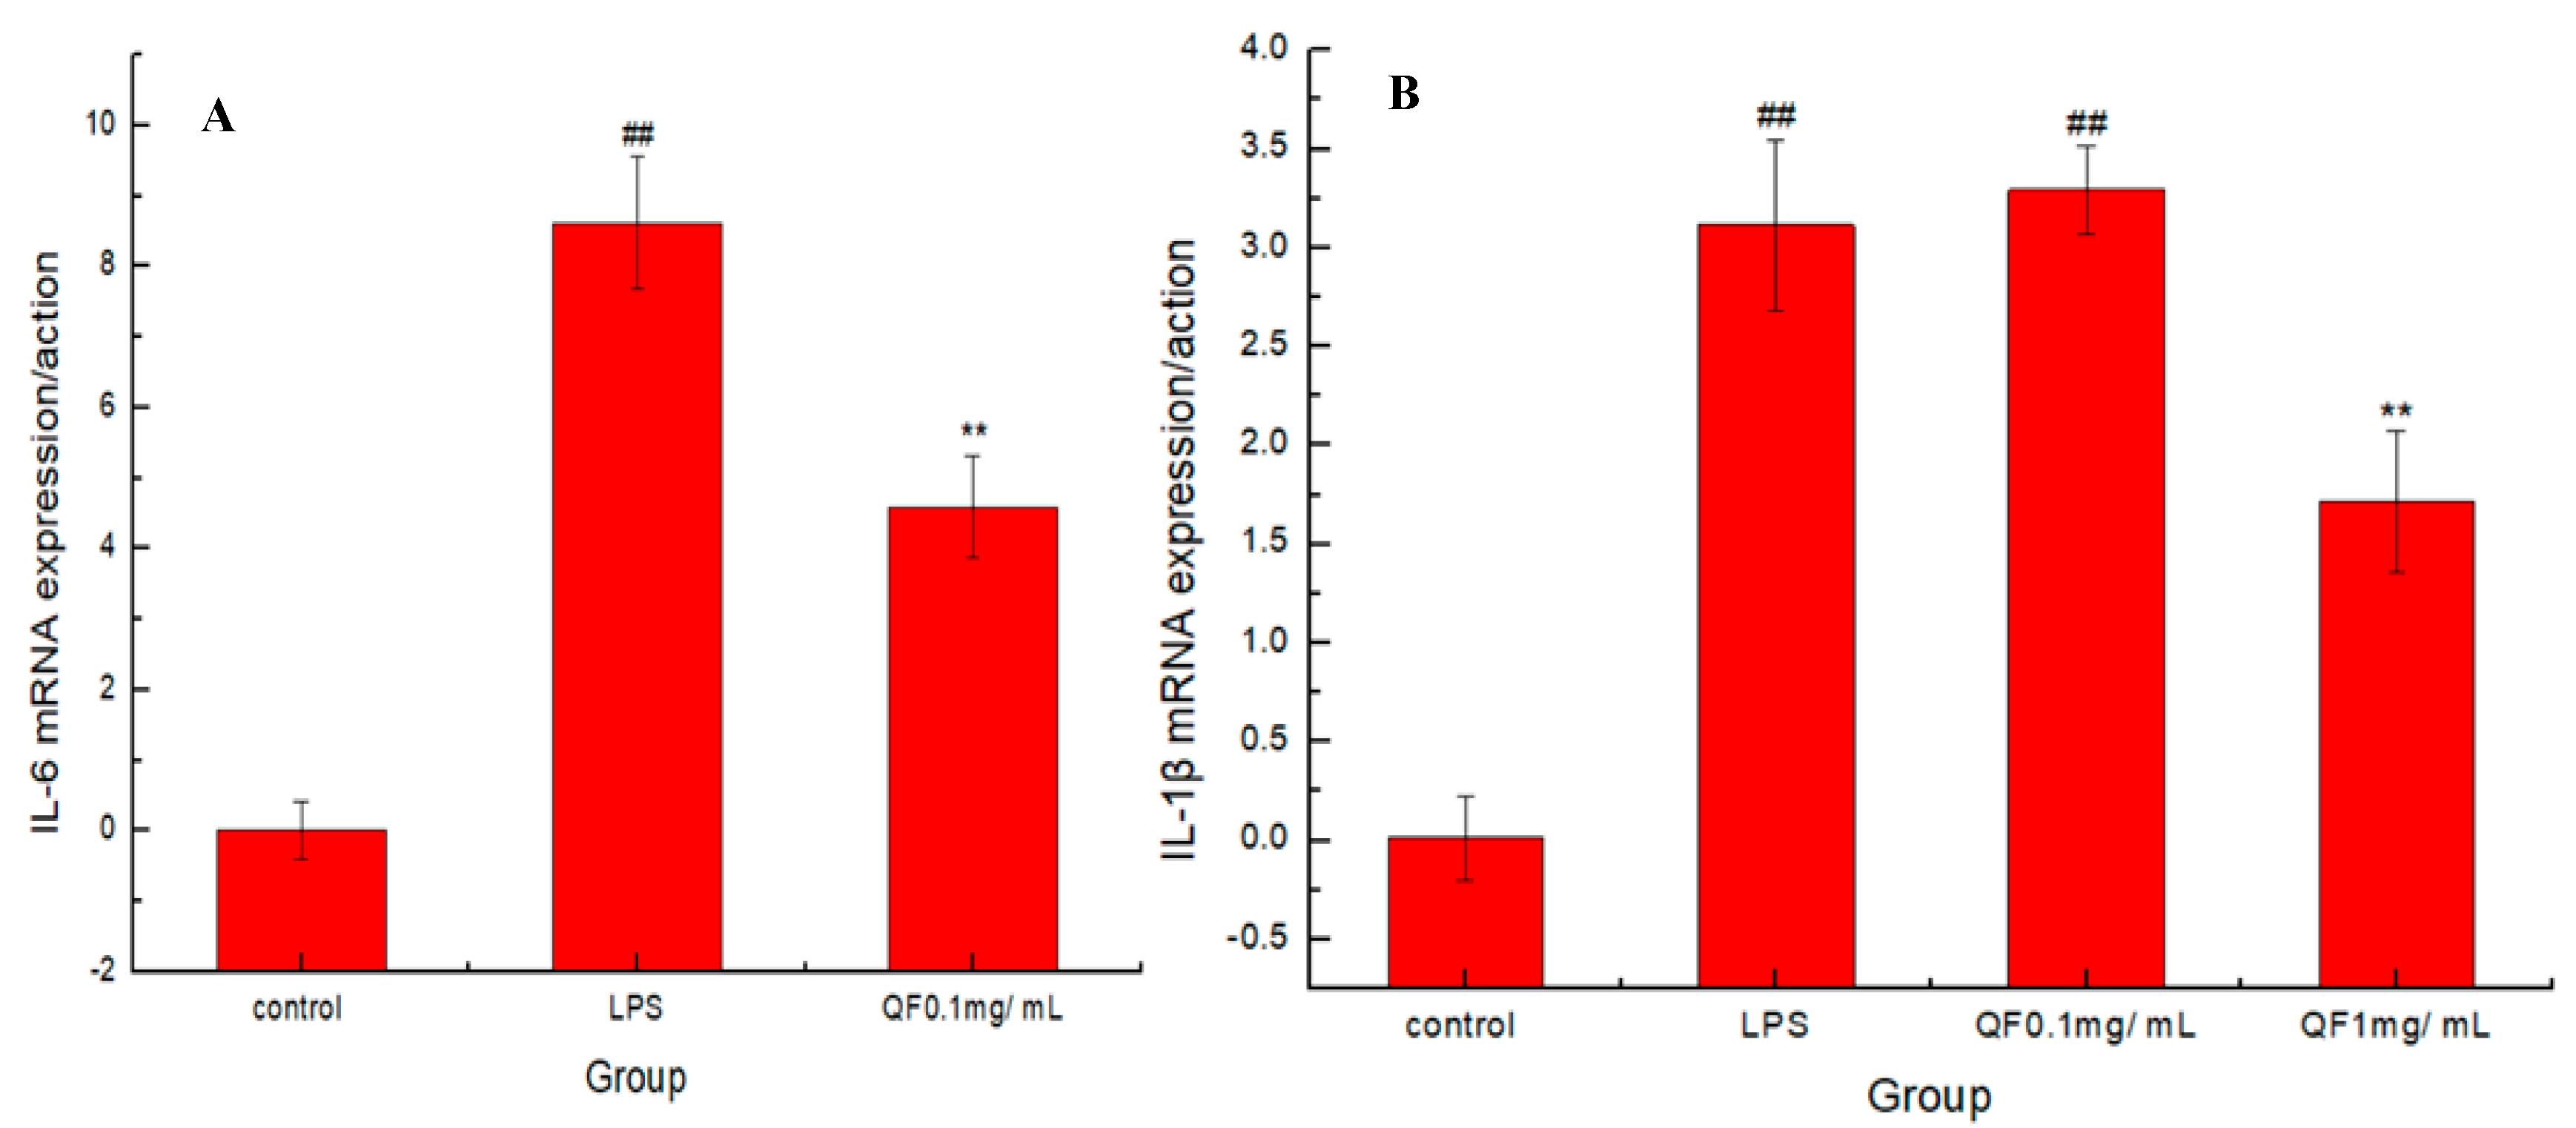
3.1. Protective Effect of Fangfeng Extract
3.2. Metabolomics Profiling and Differential Accumulated Metabolite (DAM) Analysis
4. Discussion
Supplementary Materials
Author Contributions
Funding
Institutional Review Board Statement
Acknowledgments
Conflicts of Interest
References
- Labzin, L.I.; Heneka, M.T.; Latz, E. Innate Immunity and Neurodegeneration. Annu. Rev. Med. 2018, 69, 437–449. [Google Scholar] [CrossRef]
- Ransohoff, R.M. How neuroinflammation contributes to neurodegeneration. Science 2016, 353, 777–783. [Google Scholar] [CrossRef] [PubMed]
- Lue, L.F.; Walker, D.G.; Brachova, L.; Beach, T.G.; Rogers, J.; Schmidt, A.M.; Stern, D.M.; Yan, S.D. Involvement of microglial receptor for advanced glycation endproducts (RAGE) in Alzheimer’s disease: Identification of a cellular activation mechanism. Exp. Neurol. 2001, 171, 29–45. [Google Scholar] [CrossRef]
- Gordon, R.; Albornoz, E.A.; Christie, D.C.; Langley, M.R.; Kumar, V.; Mantovani, S.; Robertson, A.A.B.; Butler, M.S.; Rowe, D.B.; O’Neill, L.A.; et al. Inflammasome inhibition prevents α-synuclein pathology and dopaminergic neurodegeneration in mice. Sci. Transl. Med. 2018, 10, eaah4066. [Google Scholar] [CrossRef] [Green Version]
- Crotti, A.; Glass, C.K. The choreography of neuroinflammation in Huntington’s disease. Trends Immunol. 2015, 36, 364–373. [Google Scholar] [CrossRef] [PubMed] [Green Version]
- Badshah, H.; Ikram, M.; Ali, W.; Ahmad, S.; Hahm, J.R.; Kim, M.O. Caffeine May Abrogate LPS-Induced Oxidative Stress and Neuroinflammation by Regulating Nrf2/TLR4 in Adult Mouse Brains. Biomolecules 2019, 9, 719. [Google Scholar] [CrossRef] [Green Version]
- Yu, L.F.; Li, X.R.; Liu, S.Y.; Xu, G.W.; Liang, Y.Z. Comparative analysis of essential components between the herbal pair Radix Saposhnikoviae-Rhizoma seu Radix Notopterygii and its single herbs by GC-MS combined with a chemometric resolution method. Anal. Methods Adv. Methods Appl. 2009, 1, 45–51. [Google Scholar] [CrossRef]
- Wang, S.; Hu, Y.; Tan, W.; Wu, X.; Chen, R.; Cao, J.; Chen, M.; Wang, Y. Compatibility art of traditional Chinese medicine: From the perspective of herb pairs. J. Ethnopharmacol. 2012, 143, 412–423. [Google Scholar] [CrossRef]
- Dennis, G., Jr.; Sherman, B.T.; Hosack, D.A.; Yang, J.; Gao, W.; Lane, H.C.; Lempicki, R.A. DAVID: Database for Annotation, Visualization, and Integrated Discovery. Genome Biol. 2003, 4, P3. [Google Scholar] [CrossRef] [PubMed]
- Jiang, X.W.; Liu, W.W.; Wu, Y.T.; Wu, Q.; Lu, H.Y.; Xu, Z.H.; Gao, H.Y.; Zhao, Q.C. Notopterygium incisum extract (NRE) rescues cognitive deficits in APP/PS1 Alzhneimer’s disease mice by attenuating amyloid-beta, tau, and neuroinflammation pathology. J. Ethnopharmacol. 2020, 249, 112433. [Google Scholar] [CrossRef]
- Chang, C.Z.; Wu, S.C.; Kwan, A.L.; Lin, C.L. 4′-O-β-D-glucosyl-5-O-methylvisamminol, an active ingredient of Saposhnikovia divaricata, attenuates high-mobility group box 1 and subarachnoid hemorrhage-induced vasospasm in a rat model. Behav. Brain Funct. 2015, 11, 28. [Google Scholar] [CrossRef] [Green Version]
- Zheng, G.Q. Therapeutic history of Parkinson’s disease in Chinese medical treatises. J. Altern. Complement. Med. 2009, 15, 1223–1230. [Google Scholar] [CrossRef] [PubMed]
- Kim, H. Neuroprotective herbs for stroke therapy in traditional eastern medicine. Neurol. Res. 2005, 27, 287–301. [Google Scholar] [CrossRef]
- Wang, H.; Wang, L.; Zhang, N.; Zhang, Q.; Zhao, H.; Zhang, Q. Houshiheisan compound prescription protects neurovascular units after cerebral ischemia. Neural Regen. Res. 2014, 9, 741–748. [Google Scholar] [CrossRef] [PubMed]
- Kim, M.G.; Choi, J.H.; Lim, J.P.; Kim, D.K.; Shin, T.Y.; Boo, Y.; Kim, S.Y.; Kim, H.; Ha, E.; Park, H.K.; et al. Protective effects of a novel herbal decoction on focal cerebral ischemia in a rodent model. Neurol. Res. 2007, 29 (Suppl. S1), S16–S22. [Google Scholar] [CrossRef]
- Sun, X.; Zhang, T.; Zhao, Y.; Cai, E.; Zhu, H.; Liu, S. Corrigendum to ‘The protective effect of 5-O-methylvisammioside on LPS-induced depression in mice by inhibiting the over activation of BV-2 microglia through Nf-κB/IκB-α pathway’ [Phytomedicine 79 (2020) 153348]. Phytomedicine 2021, 85, 153506. [Google Scholar] [CrossRef] [PubMed]
- Meng, F.; Yu, W.; Duan, W.; Wang, T.; Liu, Y. Dexmedetomidine attenuates LPS-mediated BV2 microglia cells inflammation via inhibition of glycolysis. Fundam. Clin. Pharmacol. 2020, 34, 313–320. [Google Scholar] [CrossRef] [PubMed]
- Lee, J.S.; Jeon, Y.J.; Kang, J.Y.; Lee, S.K.; Lee, H.D.; Son, C.G. Aquilariae Lignum Methylene Chloride Fraction Attenuates IL-1β-Driven Neuroinflammation in BV2 Microglial Cells. Int. J. Mol. Sci. 2020, 21, 5465. [Google Scholar] [CrossRef]
- Zhou, J.; Chen, J.; Hu, C.; Xie, Z.; Li, H.; Wei, S.; Wang, D.; Wen, C.; Xu, G. Exploration of the serum metabolite signature in patients with rheumatoid arthritis using gas chromatography-mass spectrometry. J. Pharm. Biomed. Anal. 2016, 127, 60–67. [Google Scholar] [CrossRef] [PubMed]
- Priori, R.; Scrivo, R.; Brandt, J.; Valerio, M.; Casadei, L.; Valesini, G.; Manetti, C. Metabolomics in rheumatic diseases: The potential of an emerging methodology for improved patient diagnosis, prognosis, and treatment efficacy. Autoimmun. Rev. 2013, 12, 1022–1030. [Google Scholar] [CrossRef]
- Li, R.; Guo, L.X.; Li, Y.; Chang, W.Q.; Liu, J.Q.; Liu, L.F.; Xin, G.Z. Dose-response characteristics of Clematis triterpenoid saponins and clematichinenoside AR in rheumatoid arthritis rats by liquid chromatography/mass spectrometry-based serum and urine metabolomics. J. Pharm. Biomed. Anal. 2017, 136, 81–91. [Google Scholar] [CrossRef]
- Levite, M. Neurotransmitters activate T-cells and elicit crucial functions via neurotransmitter receptors. Curr. Opin. Pharmacol. 2008, 8, 460–471. [Google Scholar] [CrossRef]
- Sarkar, C.; Basu, B.; Chakroborty, D.; Dasgupta, P.S.; Basu, S. The immunoregulatory role of dopamine: An update. Brain Behav. Immun. 2010, 24, 525–528. [Google Scholar] [CrossRef] [Green Version]
- Zhang, Y.; Jiang, X.; Qin, C.; Cuevas, S.; Jose, P.A.; Armo, I. Dopamine D2 receptors’ effects on renal inflammation are mediated by regulation of PP2A function. American journal of physiology. Renal Physiol. 2016, 310, F128–F134. [Google Scholar] [CrossRef] [PubMed] [Green Version]
- Orr, S.K.; Palumbo, S.; Bosetti, F.; Mount, H.T.; Kang, J.X.; Greenwood, C.E.; Ma, D.W.; Serhan, C.N.; Bazinet, R.P. Unesterified docosahexaenoic acid is protective in neuroinflammation. J. Neurochem. 2013, 127, 378–393. [Google Scholar] [CrossRef] [Green Version]
- Schober, M.E.; Requena, D.F.; Casper, T.C.; Velhorst, A.K.; Lolofie, A.; McFarlane, K.E.; Otto, T.E.; Terry, C.; Gensel, J.C. Docosahexaenoic acid decreased neuroinflammation in rat pups after controlled cortical impact. Exp. Neurol. 2019, 320, 112971. [Google Scholar] [CrossRef]
- Wong, C.G.T.; Chan, K.F.Y.; Gibson, K.M.; Snead, O.C. γ-Hydroxybutyric Acid. Toxicol. Rev. 2004, 23, 3–20. [Google Scholar] [CrossRef]
- Schirinzi, T.; Martella, G.; Imbriani, P.; Di Lazzaro, G.; Franco, D.; Colona, V.L.; Alwardat, M.; Sinibaldi Salimei, P.; Mercuri, N.B.; Pierantozzi, M. Dietary Vitamin E as a protective factor for Parkinson’s disease: Clinical and experimental evidence. Front. Neurol. 2019, 10, 148. [Google Scholar] [CrossRef] [Green Version]
- Capuron, L.; Schroecksnadel, S.; Féart, C.; Aubert, A.; Higueret, D.; Barberger-Gateau, P.; Layé, S.; Fuchs, D. Chronic low-grade inflammation in elderly persons is associated with altered tryptophan and tyrosine metabolism: Role in neuropsychiatric symptoms. Biol. Psychiatry 2011, 70, 175–182. [Google Scholar] [CrossRef] [PubMed]
- Wang, X.; Sun, G.; Feng, T.; Zhang, J.; Huang, X.; Wang, T.; Xie, Z.; Chu, X.; Yang, J.; Wang, H. Sodium oligomannate therapeutically remodels gut microbiota and suppresses gut bacterial amino acids-shaped neuroinflammation to inhibit Alzheimer’s disease progression. Cell Res. 2019, 29, 787–803. [Google Scholar] [CrossRef]
- Obeid, R.; McCaddon, A.; Herrmann, W. The role of hyperhomocysteinemia and B-vitamin deficiency in neurological and psychiatric diseases. Clin. Chem. Lab. Med. 2007, 45, 1590–1606. [Google Scholar] [CrossRef] [PubMed]
- Annibal, A.; Tharyan, R.G.; Schonewolff, M.F.; Tam, H.; Latza, C.; Auler, M.M.K.; Antebi, A. Regulation of the one carbon folate cycle as a shared metabolic signature of longevity. Nat. Commun. 2021, 12, 3486. [Google Scholar] [CrossRef] [PubMed]
- Karsai, G.; Kraft, F.; Haag, N.; Korenke, G.C.; Hänisch, B.; Othman, A.; Suriyanarayanan, S.; Steiner, R.; Knopp, C.; Mull, M. DEGS1-associated aberrant sphingolipid metabolism impairs nervous system function in humans. J. Clin. Investig. 2019, 129, 1229–1239. [Google Scholar] [CrossRef] [Green Version]
- Lucki, N.C.; Sewer, M.B. Multiple roles for sphingolipids in steroid hormone biosynthesis. Lipids Health Dis. 2008, 49, 387–412. [Google Scholar]
- Lee, H.; Villacreses, N.E.; Rapoport, S.I.; Rosenberger, T.A. In vivo imaging detects a transient increase in brain arachidonic acid metabolism: A potential marker of neuroinflammation. J. Neurochem. 2004, 91, 936–945. [Google Scholar] [CrossRef]
- Jarc, E.; Petan, T. A twist of FATe: Lipid droplets and inflammatory lipid mediators. Biochimie 2020, 169, 69–87. [Google Scholar] [CrossRef]


| Figures | Data Points (Metabolic Pathways) |
|---|---|
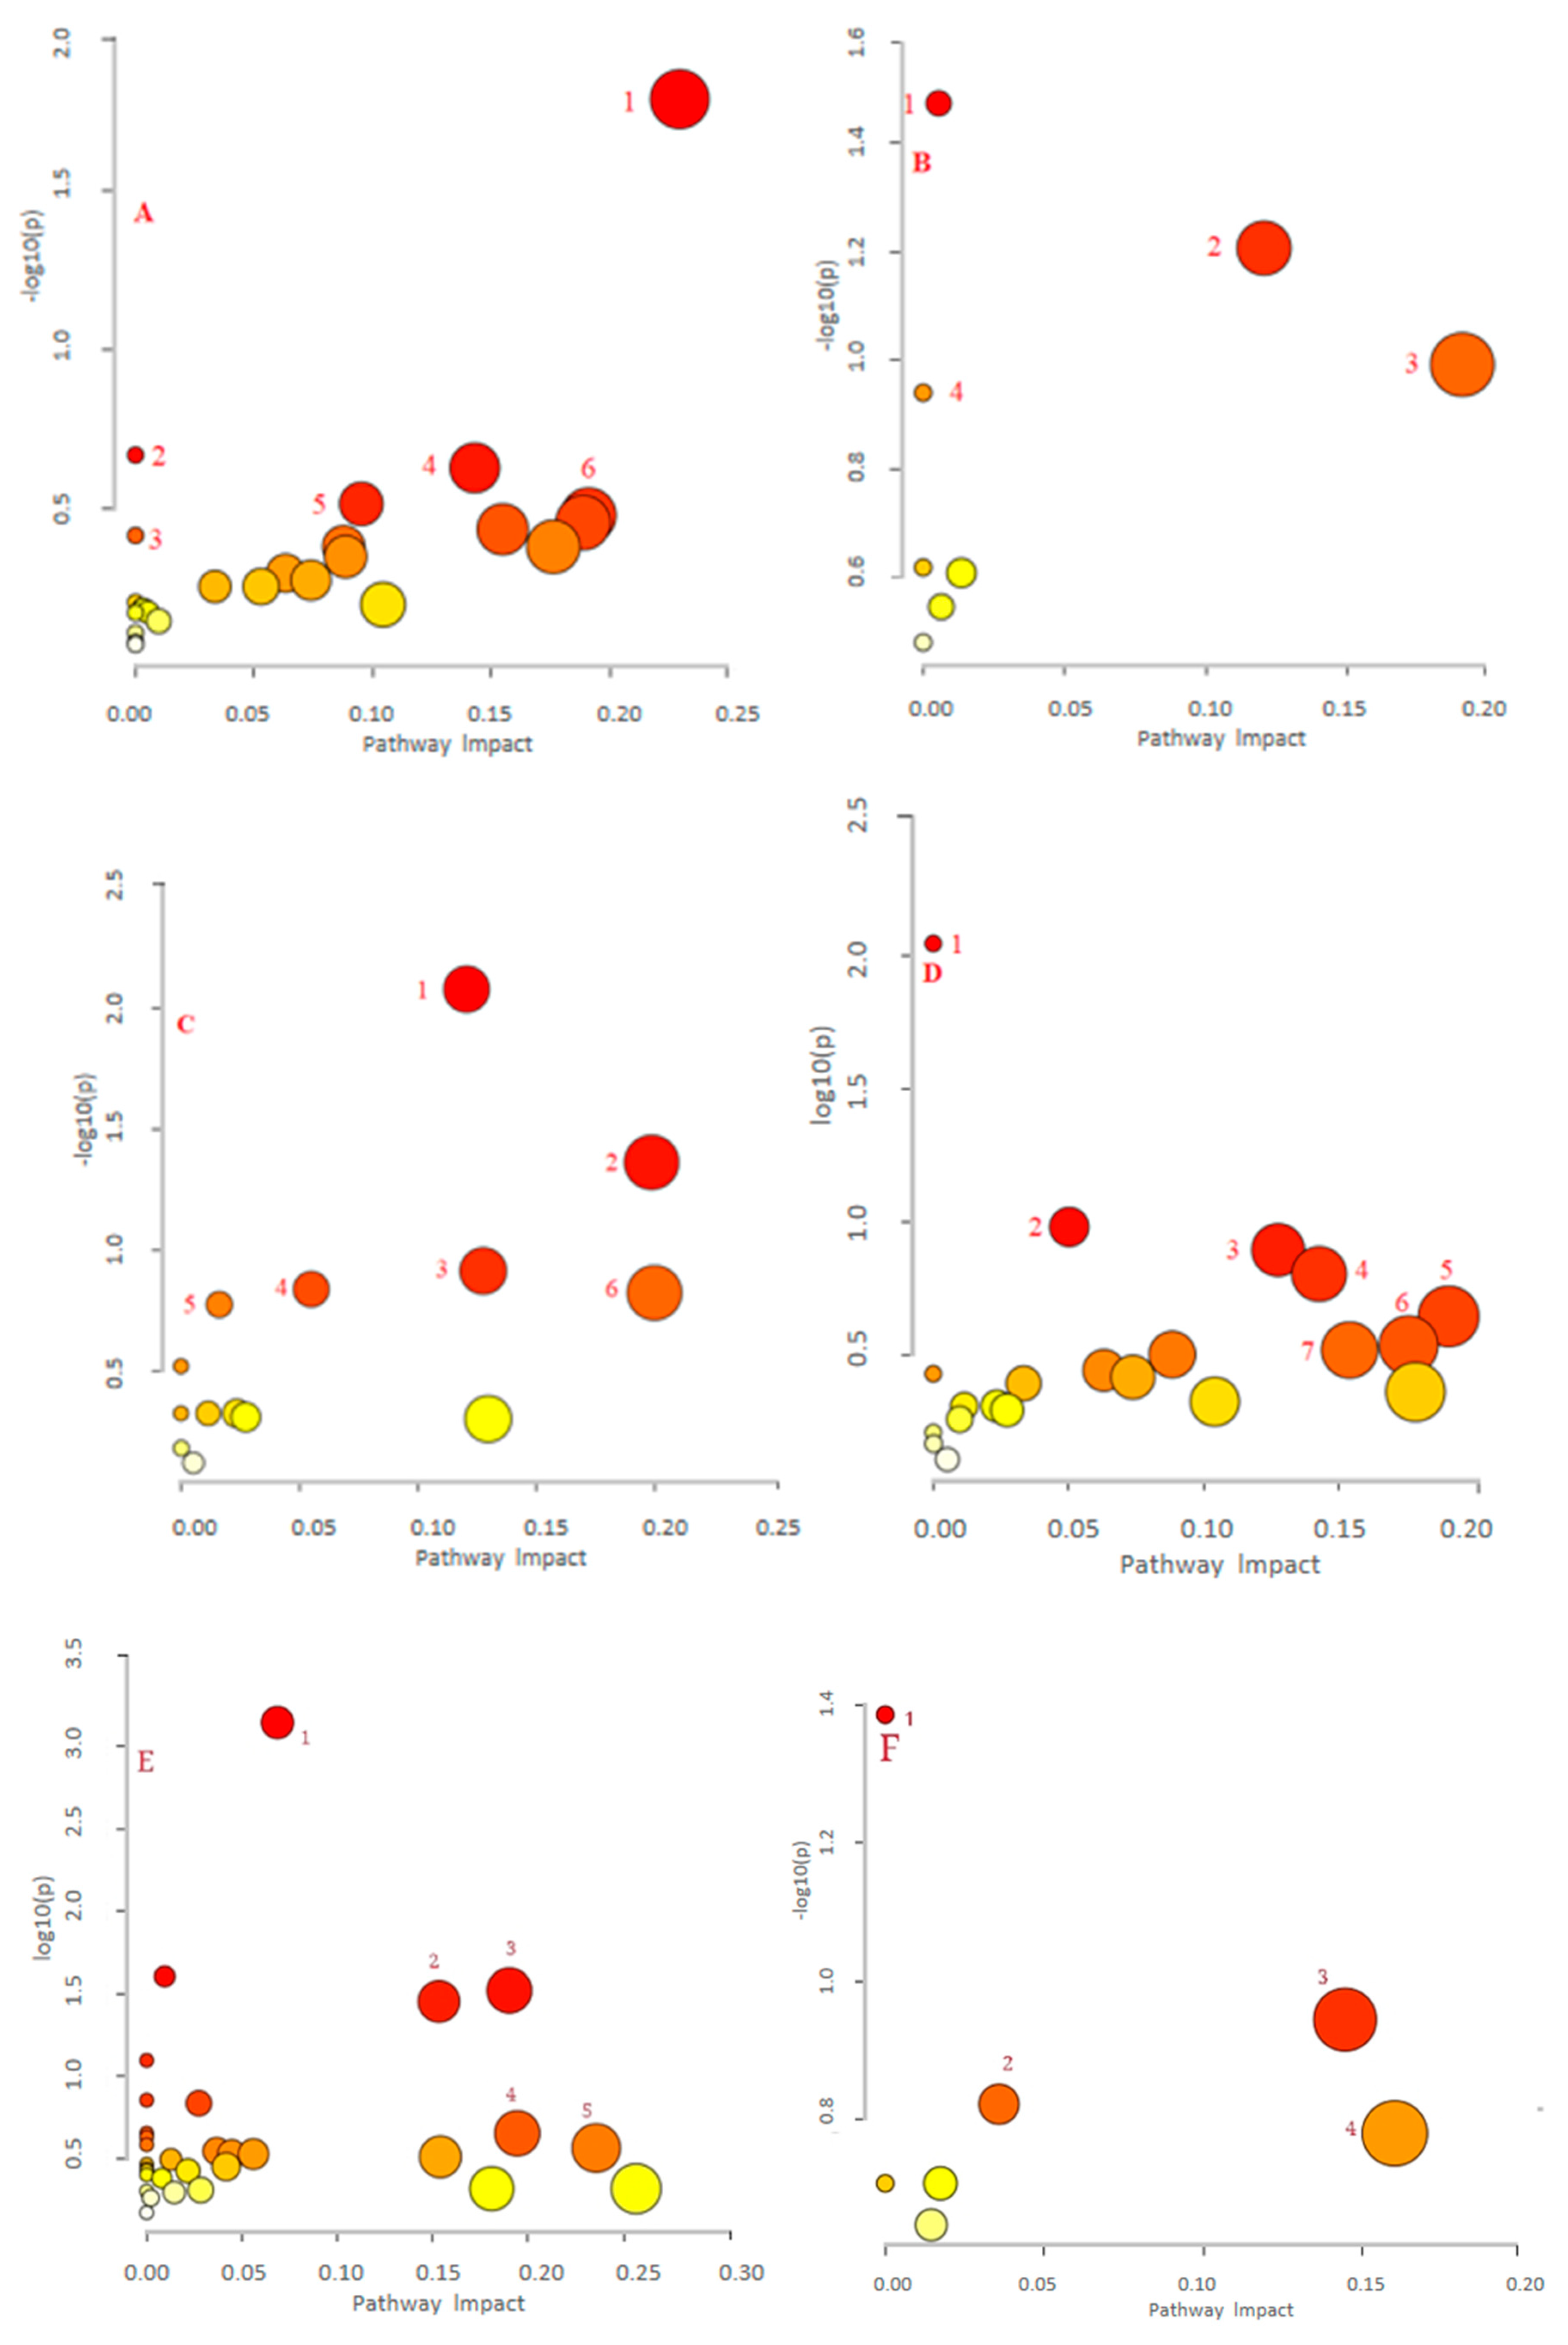
| (A) LPS vs. QF0.1 (negative) | 1. Alanine, aspartate and glutamate metabolism; 2. Purine metabolism; 3. Pyrimidine metabolism; 4. Steroid biosynthesis; 5. Starch and sucrose metabolism; 6. Butanoate metabolism |
| (B) LPS vs. QF1 (negative) | 1. Purine metabolism; 2. Alanine, aspartate, and glutamate metabolism; 3. Aminoacyl-tRNA biosynthesis; 4. Butanoate metabolism; 5. Selenocompound metabolism; 6. Citrate cycle (TCA cycle); 7. Tyrosine metabolism |
| (C) LPS vs. QF10 (negative) | 1. Tyrosine metabolism; 2. Butanoate metabolism; 3. Galactose metabolism; 4. Porphyrin and chlorophyll metabolism; 5. Taurine and hypotaurine metabolism; 6. Citrate cycle (TCA cycle); 7. Purine metabolism; 8. Propanoate metabolism; 9. Alanine, aspartate, and glutamate metabolism |
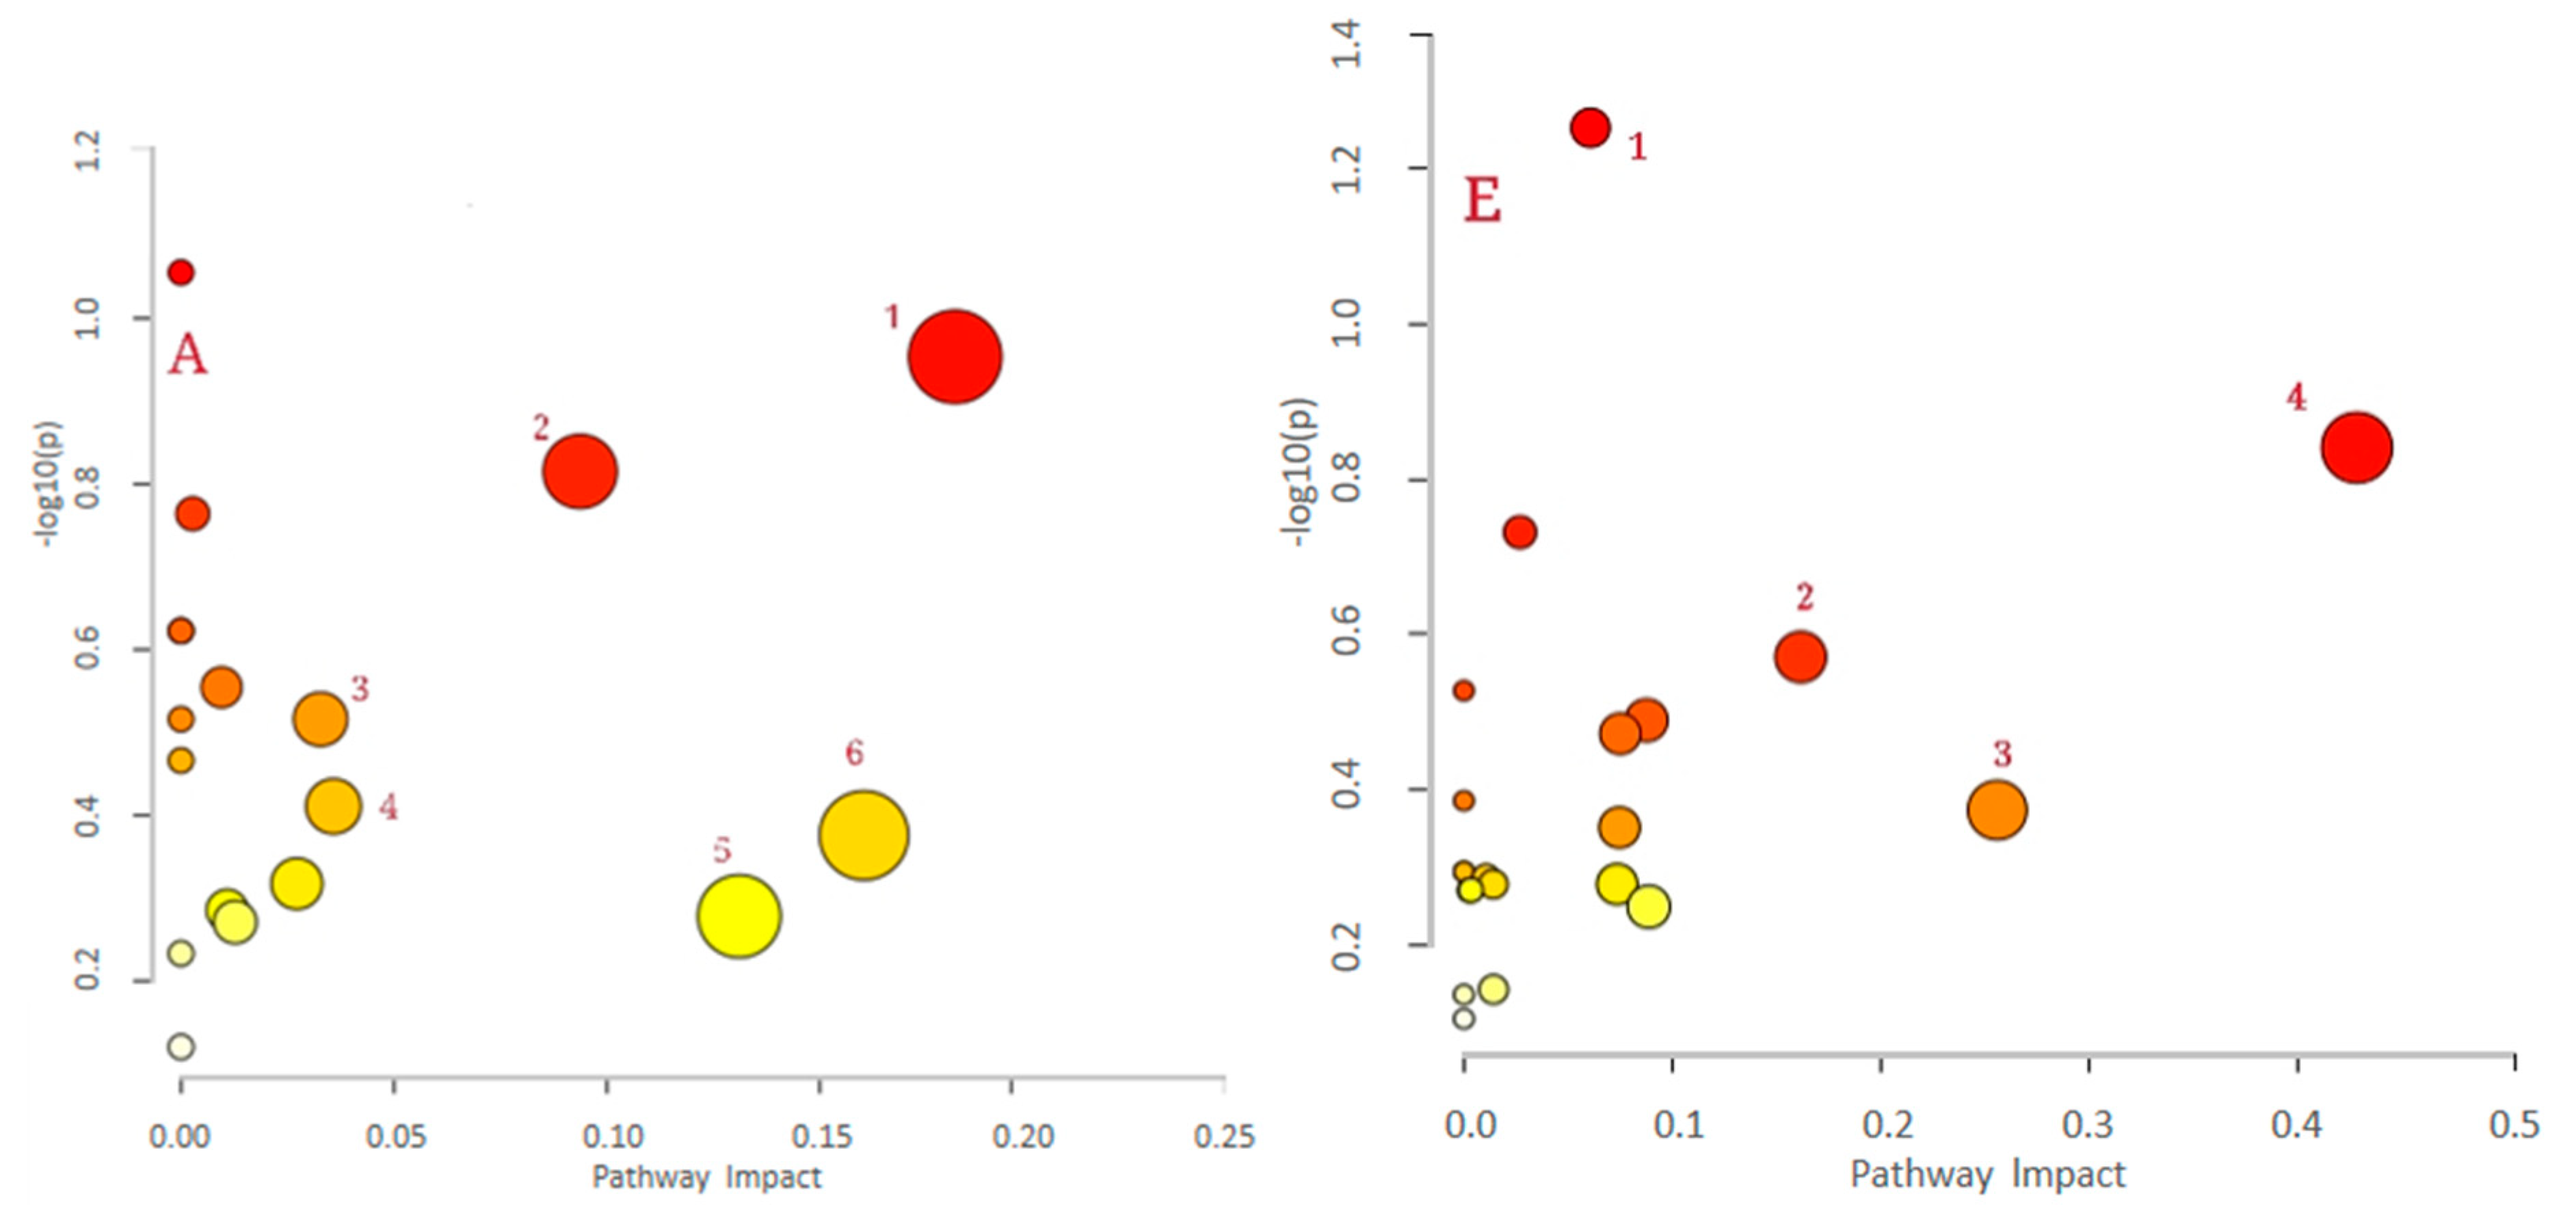
| (D) LPS vs. QF0.1 (positive) | 1. Butanoate metabolism; 2. Arginine biosynthesis; 3. Starch and sucrose metabolism 4. Sphingolipid metabolism; 5. D-Glutamine and D-glutamate metabolism; 6. Tyrosine metabolism; 7. Purine metabolism; 8. Primary bile acid biosynthesis |
| (E) LPS vs. QF1 (positive) | 1. Primary bile acid biosynthesis; 2.Taurine and hypotaurine metabolism; 3. Tryptophan metabolism; 4. Retinol metabolism |
| (F) LPS vs. QF10 (positive) | 1. Tryptophan metabolism; 2. Sphingolipid metabolism; 3. Tyrosine metabolism; 4. Retinol metabolism; 5. Histidine metabolism; 6. Pentose and glucuronate interconversions; 7. Pentose phosphate pathway |
| (G) control vs. LPS (positive) | 1. Primary bile acid biosynthesis; 2. One carbon pool by folate; 3. Nicotinate and nicotinamide metabolism; 4. Vitamin B6 metabolism; 5. Tryptophan metabolism; 6. beta-Alanine metabolism; 7. Pentose phosphate pathway; 8. Pyruvate metabolism |
| (H) control vs. LPS (negative) | 1.Vitamin B6 metabolism; 2. Primary bile acid biosynthesis; 3. Fatty acid biosynthesis |
| Figures | Data Points (Metabolic Pathways) |
|---|---|
| (A) LPS vs. QF0.1 (negative) | 1. Sphingolipid metabolism; 2. One carbon pool by folate; 3. Phenylalanine metabolism; 4. Tyrosine metabolism; 5. Nicotinate and nicotinamide metabolism; 6. Histidine metabolism |
| (B) LPS vs. QF1 (negative) | 1. Steroid biosynthesis; 2. One carbon pool by folate; 3. Nicotinate and nicotinamide metabolism; 4. Mannose type O-glycan biosynthesis |
| (C) LPS vs. QF10 (negative) | 1. One carbon pool by folate; 2. Sphingolipid metabolism; 3. Sulfur metabolism; 4. Steroid biosynthesis; 5. Biotin metabolism; 6. Primary bile acid biosynthesis |
| (D) LPS vs. QF0.1 (positive) | 1. One carbon pool by folate; 2. Glycine serine and threonine metabolism; 3. Sulfur metabolism; 4. Phenylalanine metabolism; 5. Nicotinate and nicotinamide metabolism; 6. Fructose and mannose metabolism; 7. Sphingolipid metabolism |
| (E) LPS vs. QF1 (positive) | 1. Primary bile acid biosynthesis; 2. Pyrimidine metabolism; 3. Tyrosine metabolism; 4. Steroid hormone biosynthesis; 5. Synthesis and degradation of ketone bodies |
| (F) LPS vs. QF10 (positive) | 1. Thiamine metabolism; 2. Ether lipid metabolism; 3. Galactose metabolism; 4. Porphyrin and chlorophyll metabolism |
| (G) control vs. LPS (positive) | 1. One carbon pool by folate; 2. Biosynthesis of unsaturated fatty acids; 3. Purine metabolism; 4. Fatty acid biosynthesis; 5. Synthesis and degradation of ketone bodies; 6. Porphyrin and chlorophyll metabolism; 7. Thiamine metabolism; 8. Taurine and hypotaurine metabolism; 9. Sulfur metabolism; 10. Glycerophospholipid metabolism |
| (H) control vs. LPS (negative) | 1. One carbon pool by folate; 2. Porphyrin and chlorophyll metabolism; 3. Thiamine metabolism; 4. Pyrimidine metabolism; 5. Starch and sucrose metabolism; 6. Pantothenate and CoA biosynthesis; 7. Ether lipid metabolism; 8. Sphingolipid metabolism; 9. beta-Alanine metabolism |
Publisher’s Note: MDPI stays neutral with regard to jurisdictional claims in published maps and institutional affiliations. |
© 2021 by the authors. Licensee MDPI, Basel, Switzerland. This article is an open access article distributed under the terms and conditions of the Creative Commons Attribution (CC BY) license (https://creativecommons.org/licenses/by/4.0/).
Share and Cite
Zhu, X.; Wang, X.; Zhang, S.; Li, X.; Li, Z.; Chen, X.; Liu, X.; Li, H.; Zhang, J. Metabolomic Investigation of Synergistic Mechanism for Fangfeng Extract Preventing LPS Induced Neuroinflammation in BV-2 Microglia Cells. Appl. Sci. 2021, 11, 8155. https://doi.org/10.3390/app11178155
Zhu X, Wang X, Zhang S, Li X, Li Z, Chen X, Liu X, Li H, Zhang J. Metabolomic Investigation of Synergistic Mechanism for Fangfeng Extract Preventing LPS Induced Neuroinflammation in BV-2 Microglia Cells. Applied Sciences. 2021; 11(17):8155. https://doi.org/10.3390/app11178155
Chicago/Turabian StyleZhu, Xinliang, Xueqi Wang, Shunbin Zhang, Xu Li, Zhengdou Li, Xia Chen, Xiaoxiao Liu, Huixia Li, and Ji Zhang. 2021. "Metabolomic Investigation of Synergistic Mechanism for Fangfeng Extract Preventing LPS Induced Neuroinflammation in BV-2 Microglia Cells" Applied Sciences 11, no. 17: 8155. https://doi.org/10.3390/app11178155