Article

Unveiling the Invisible in Uffizi Gallery’s Drawing 8P by Leonardo with Non-Invasive Optical Techniques

National Research Council—National Institute of Optics (CNR-INO), L.go E. Fermi 6, 50125 Firenze, Italy
*
Author to whom correspondence should be addressed.
Appl. Sci. 2021, 11(17), 7995; https://doi.org/10.3390/app11177995
Submission received: 27 July 2021 / Revised: 20 August 2021 / Accepted: 23 August 2021 / Published: 29 August 2021
(This article belongs to the Special Issue Application of Materials Science in the Study of Cultural Heritage)

Abstract

:
Until recently, the study of drawings by old masters has been confined to the art history conservation field. More specifically, scientific investigations of Leonardo’s drawings are still very few, possibly due to the latter’s extreme fragility and artistic value. However, analytical data are crucial to develop a solid knowledge base of the drawing materials and techniques used by artists in the past. In this work, we report on the application of non-invasive optical techniques on a double-sided drawing by Leonardo belonging to the Uffizi Gallery (8P). We used multispectral reflectography in the visible (Vis) and near-infrared (NIR) regions to obtain a spectral mapping of the drawing materials, to be subsequently integrated with technical information provided by art historians and conservators. Morphological analysis by microprofilometry allowed for the identification of the typical wave-like texture impressed in the paper during the sheet’s manufacture, as well as of further paper-impressed traits attributable to the drawing transfer method used by Leonardo. Optical coherence tomography revealed a set of micrometric engraved details in the blank background, which lack any trace of colored material, nor display any apparent relation to the drawn landscape. The disclosure of hidden technical features allowed us to offer new insights into Leonardo’s still under-investigated graphic practices.

1. Introduction

Scientific analysis of artworks is often performed within the limits of non-invasiveness requirements, which automatically exclude any material sampling or contact measurement. Meeting such requirements, however, may prove especially challenging when studying paper-based drawings and paintings, whose extremely light-sensitive nature often demands fixed lighting conditions. Minimizing light exposure during measurements without compromising data significance means striking an effective balance between spatial sampling (pixel size) and spectral resolution— an extremely delicate task at best [1,2,3]. Furthermore, the limited variety of artistic materials typically found in ancient drawings makes it difficult to assess their provenance and authenticity in the absence of proper historical documentation [4]. Numerous studies indicate that analysis of paper-based artworks is best performed when applying a synergic approach that combines non-invasive analytical tools and complementary optical techniques [5]. In the past few decades, spectral imaging processing has been successfully combined with site-specific chemical methods, e.g., Raman spectroscopy [6,7], X-ray fluorescence (XRF) [8,9], fiber optics reflectance spectroscopy (FORS) [10], and particle-induced X-ray emission (PIXE) [11], mainly for the identification and mapping of pigments in medieval illuminated manuscripts and painted books [2,4,8,12,13]. Stratigraphic analysis of miniatures and ancient books has also been performed with infrared thermography (IRT) [14,15] and XRF [15] to highlight the presence of structural defects, such as detachments of the gildings. However, fewer scientific data are available when it comes to drawings on paper, possibly due to their extreme fragility. As a result, analysis of paper-based drawings has thus far been primarily conducted within the historical-conservative field, with only a handful of published studies on drawings by old masters over the 15th–17th centuries contributing to the relevant literature [16,17,18,19]. Despite such limitations, the supporting value of scientific data in this regard has proved increasingly crucial in order to gain further insights into drawing materials and techniques used by artists in the past. For instance, art history investigations on Leonardo da Vinci’s drawings carried out in the past two decades have successfully integrated analytical measurements to identify constituting materials, delineate the artist’s modus operandi, and characterize material deterioration over time [20,21,22]. Suffice to mention Leonardo’s drawings belonging to the Biblioteca Reale in Turin, which were recently analyzed with macro X-ray Fluorescence (MA-XRF), μ-Raman spectroscopy, and atomic force microscopy (AFM) to identify their constituting materials and assess their state of conservation [23,24]. This line of research clearly points to the need for further integration of scientific methods to gain a thorough understanding of Leonardo’s creative process.
In this work, we report on the application of non-invasive multi-modal analysis on a double-side drawn sheet by Leonardo, Drawing 8P (Figure 1), from the Uffizi Gallery of Florence, Italy. Our study is part of a research campaign carried out by Opificio delle Pietre Dure in collaboration with the National Research Council (CNR) and the National Institute of Nuclear Physics (INFN) within the framework of the exhibition held in Leonardo’s birth town (Vinci) to commemorate the five hundredth anniversary of his death (2 May 1519) [25]. The commemoration year also saw other research campaigns, such as the set of investigations on this sheet performed at the University of Bologna (for further reference see [26]). We used multispectral reflectography in the visible (Vis) and near-infrared (NIR) to perform the spectral mapping of the drawing materials, whose elemental composition had been previously characterized by XRF [27]. Morphological micro-features, i.e., not visible to the naked eye, were revealed thanks to the combined application of laser scanning microprofilometry and spectral-domain optical coherence tomography (Sd-OCT). The resulting visible set of hidden details related to the drawing technique allowed us to provide new insights into Leonardo’s still under-investigated graphic production.

2. Materials and Methods
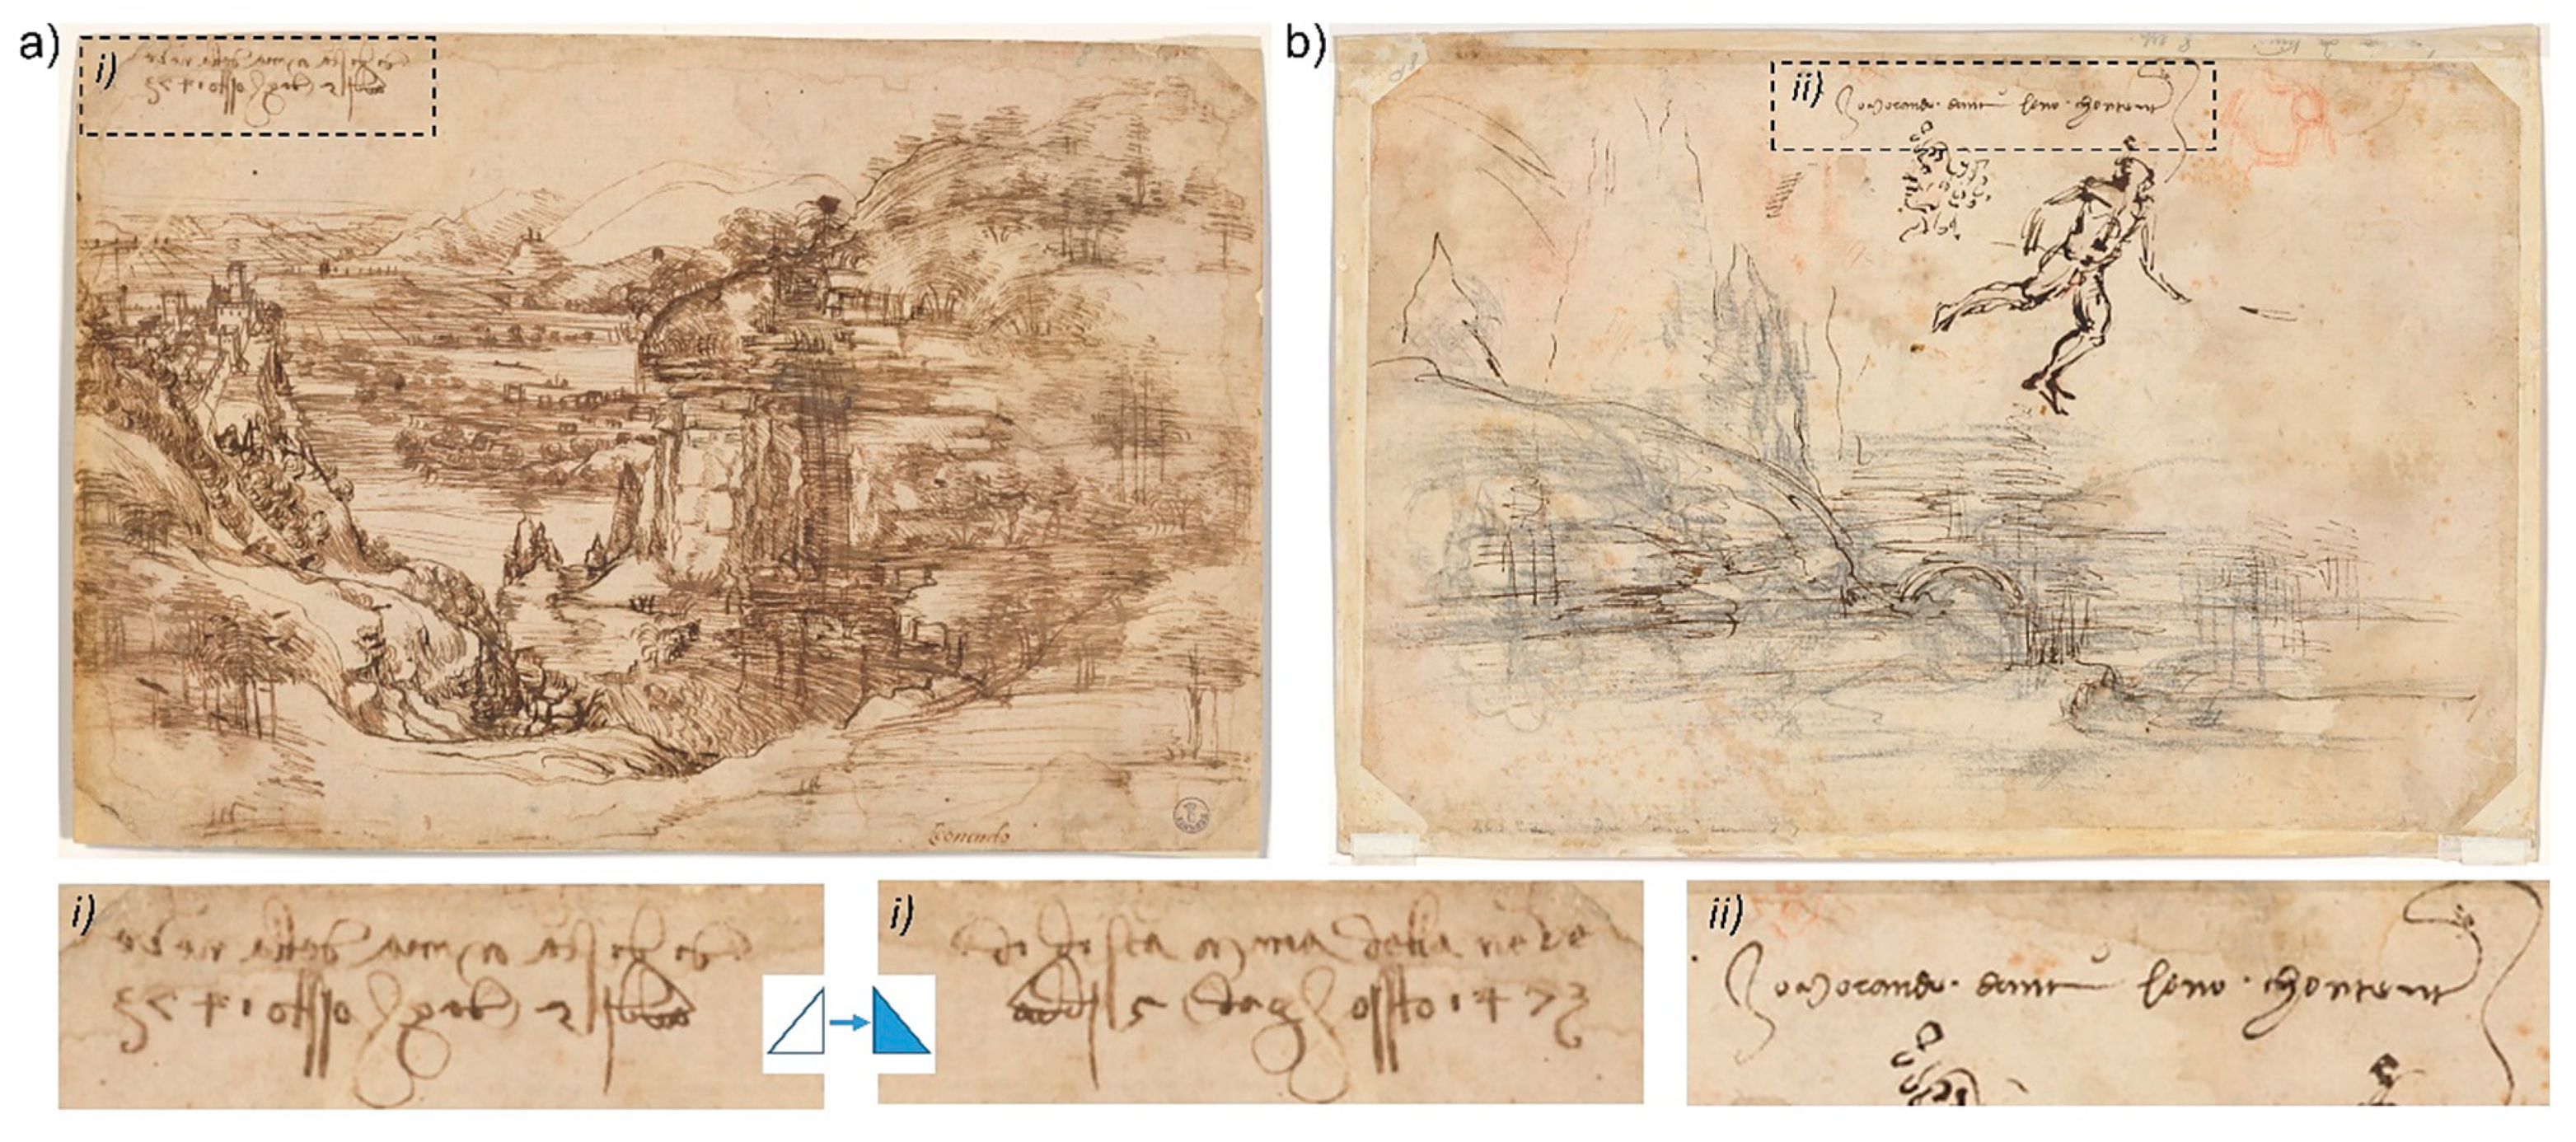
2.1. Drawing 8P

Drawing 8P (Uffizi Gallery), named after its inventory number, is considered by many to be the first known drawing by the great Tuscan artist and scientist Leonardo da Vinci. He is believed to have depicted the landscape on the front side or recto of the sheet (Figure 1a) when he was twenty-one-years-old and still an apprentice at the prestigious Florentine workshop of Verrocchio. The autograph heading on the top-left margin (Figure 1a, region i), “Dì di s[an]ta Maria della neve/addj 5 dhaghossto1473”, written in Leonardo’s typical right-to-left handwriting, indicates the date and the feast associated with the creation of the drawing (5 August 1473, Day of Our Lady of the Snow) [28]. This inscription makes Drawing 8P the only known landscape by Leonardo with an autograph date. There is a signature in the lower right corner of the sheet, which is considered apocryphal, possibly added at the end of the 16th century, and related to the collecting history of the drawing. There is no visible sign of watermarks on the paper, thus making it impossible to determine the area of its provenance. Little is known about the drawing’s conservation history, due to the absence of attested documentation, such as technical and restoration reports. The circular stamp of the Uffizi collection is still visible in the bottom-left corner of the recto, dating to an old mounting of the drawing on a dark card, which is now missing. The small size of the sheet (around 19 × 28 cm), as well as the complexity of the composition, namely a view from above, suggest that the landscape was made in a workshop rather than outdoors. The scene is constructed through the sum of several elements, starting from the arid terrain with a few isolated trees in the foreground that opens the perspective on a rocky wall with a waterfall (on the right) and a promontory topped by a fortified citadel (on the left). A marshy area with grazing animals on the mainland is represented in the background, with outlines of hills and turreted villages fading into the distance. Leonardo’s exceptional drawing skills and speed of execution are made evident by the clear strokes synthesizing each detail, with the sfumato technique, invented by the artist himself, giving the whole scene a sense of vibrant suspension. The back of the sheet or verso (Figure 1b), on the other hand, shows a series of undefined figures and shapes, which have been mostly ignored by scholars in favor of the more evocative landscape on the recto. However, the group of hills with a river and a bridge sketched in the middle of the sheet is considered the initial idea of the landscape later developed on the front [28]. Faded sketches of a female bust and a man’s head are also outlined with red chalk on the up-right margin of the folio. Among the traces of geometric figures depicted on the left, one was identified as an early study of Leonardo’s famous knots. The left-to-right written inscription on the top margin (Figure 1b, region ii) was attributed to Leonardo and thus considered proof of his ability to write with both hands [28].

2.2. Vis-NIR Multispectral Reflectography

Multispectral analysis was performed with the scanner developed at the National Research Council—National Institute of Optics (CNR-INO), allowing for the simultaneous acquisition of 32 narrow-band images (16 VIS + 16 NIR images) through whiskbroom scanning in the range 390–2500 nm [5]. The optical head, i.e., the lighting system and catoptric collecting optics, is placed in a 45°/0° illumination/observation geometry, moving with a step of 250 μm and speed of 500 mm/s. The light reflected from the scanned surface is collected by a square-shaped fiber bundle and delivered to a set of Si and InGaAs photodiodes, each equipped with an individual interferential filter. The autofocus system maintains the optimal target-lens distance during scanning thanks to a high-speed triangulation distance meter and custom-made control software. The instrument’s output is a set of perfectly superimposed monochromatic images, which are aberration-free and metrically correct.
The multi-spectral image cube was processed with principal component analysis (PCA) to compress the informative content of large amounts of data in a new, reduced, non-redundant dataset [29]. PCA allows for the expression of the original spectral dataset within a new reference space identified by orthogonal and uncorrelated coordinates, called principal components (PCs), corresponding to linear combinations of the original variables (i.e., the different wavelengths). Since PC variables are hierarchically ordered, the few first PC images are typically representative of the substantial information of the original dataset [1]. Given our research aim, the initial 32 images were reduced to four significant PC images that effectively summarized the salient spectral variations of the drawing. Vis, NIR, and PC images were used to produce false-color (FC) images by combining either a near-infrared, a red, and a green image (NRG-FC), or three PCs (PC-FC). In the first case, traditional NRG→RGB mapping was used (namely, N→R, R→G, and G→B, with “R”, “G”, and “B” that indicate the red, the green, and the blue channel, respectively, and “N” the near-infrared spectral band). In the second case, three PCs were combined in the trichromatic RGB space. The resulting image provided a detailed outline of the drawings and their similarities—when present, which would otherwise remain undetected during a simple visual inspection, and to a traditional FC.

2.3. Laser Scanning Microprofilometry

Morphological analysis was carried out using a laser scanning micro-profilometer developed at CNR-INO for the survey of a wide range of materials and surfaces. A commercial conoprobe (Conoprobe 1000, Optimet, Jerusalem, Israel), equipped with a 50 mm lens, is moved by a scanning device allowing for measurements on a maximum area of 30 × 30 cm2. The profilometer has 1 μm axial resolution, 20 μm lateral resolution, and 8 mm dynamic range. The output is a faithful, high-resolution topographic map of the measured surface, which may be displayed either as a 3D model or as an image. The latter may be further processed through the application of digital filters and rendering techniques to enhance micrometric details and improve their readability.

2.4. Spectral-Domain Optical Coherence Tomography (Sd-OCT)

Cross-sectional analysis was performed with a commercial OCT device, Thorlabs Telesto-II, using a superluminescent diode (central wavelength: 1300 nm, bandwidth: about 100 nm) with axial resolution of 5.5 μm in air, and lateral resolution of 13 μm. The maximum field of view (FOV) is 10.0 × 10.0 mm2, with 3.5 mm imaging depth. The detector consists of a spectrograph made of a diffraction grating and a fast camera. The system is controlled via a 64-bit software preinstalled on a high-performance computer. The 3D scanning path probe with integrated video camera performs high-speed imaging (76 kHz) for rapid volume acquisition and live display. The sample stage provides XY translation and rotation of the sample along with axial travel of the probe.

3. Results

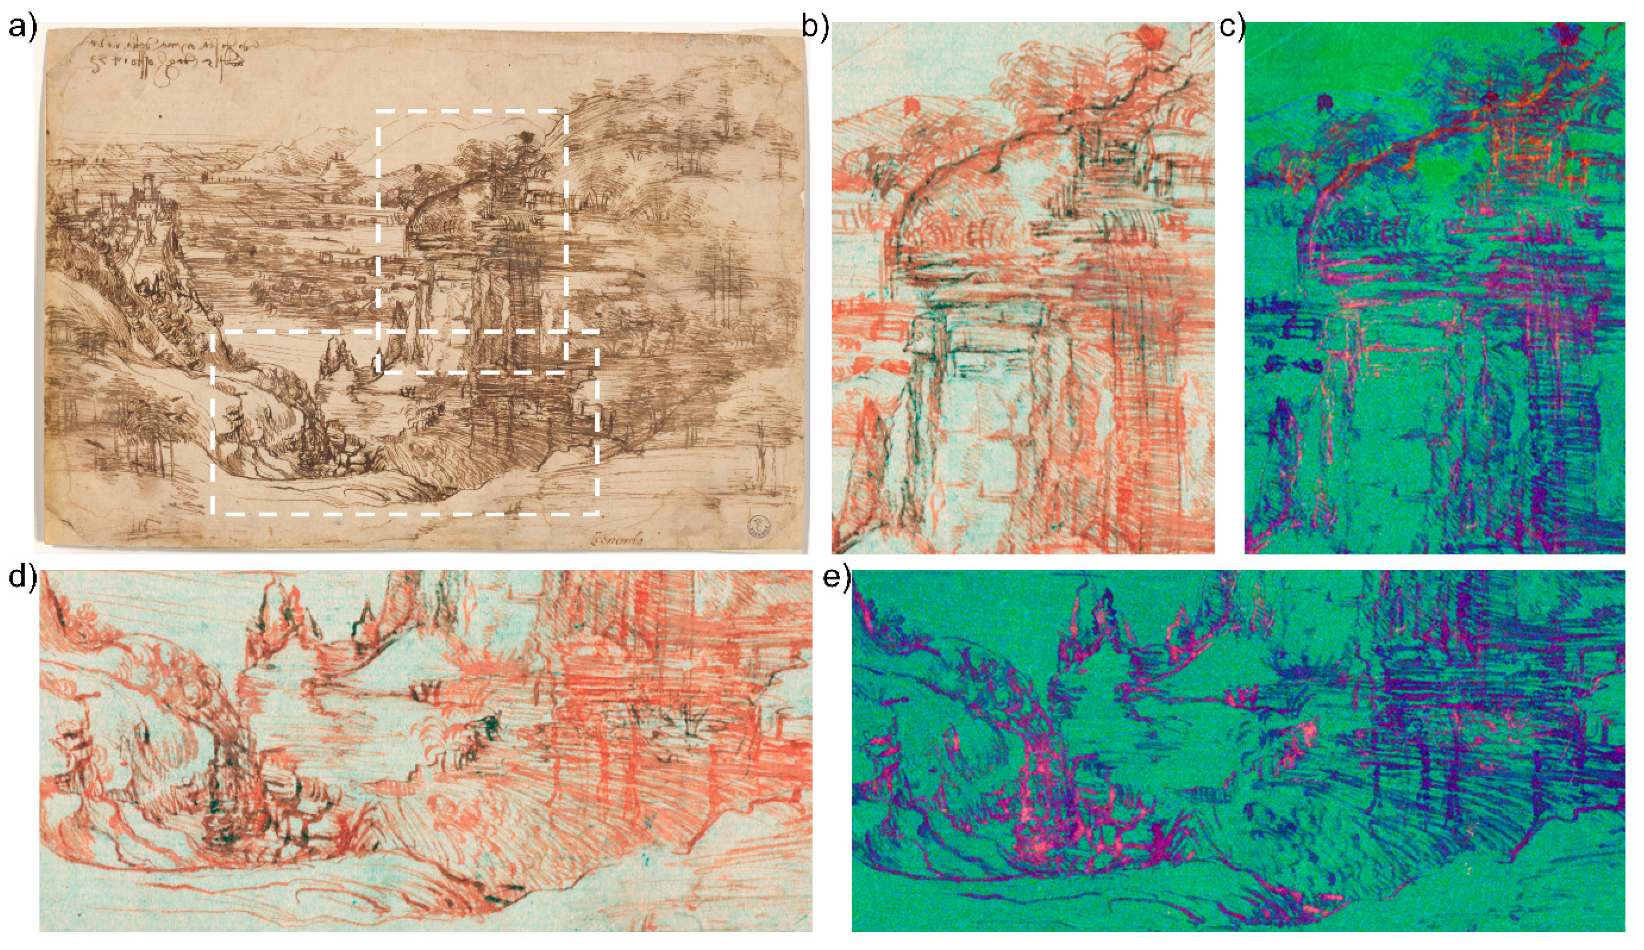
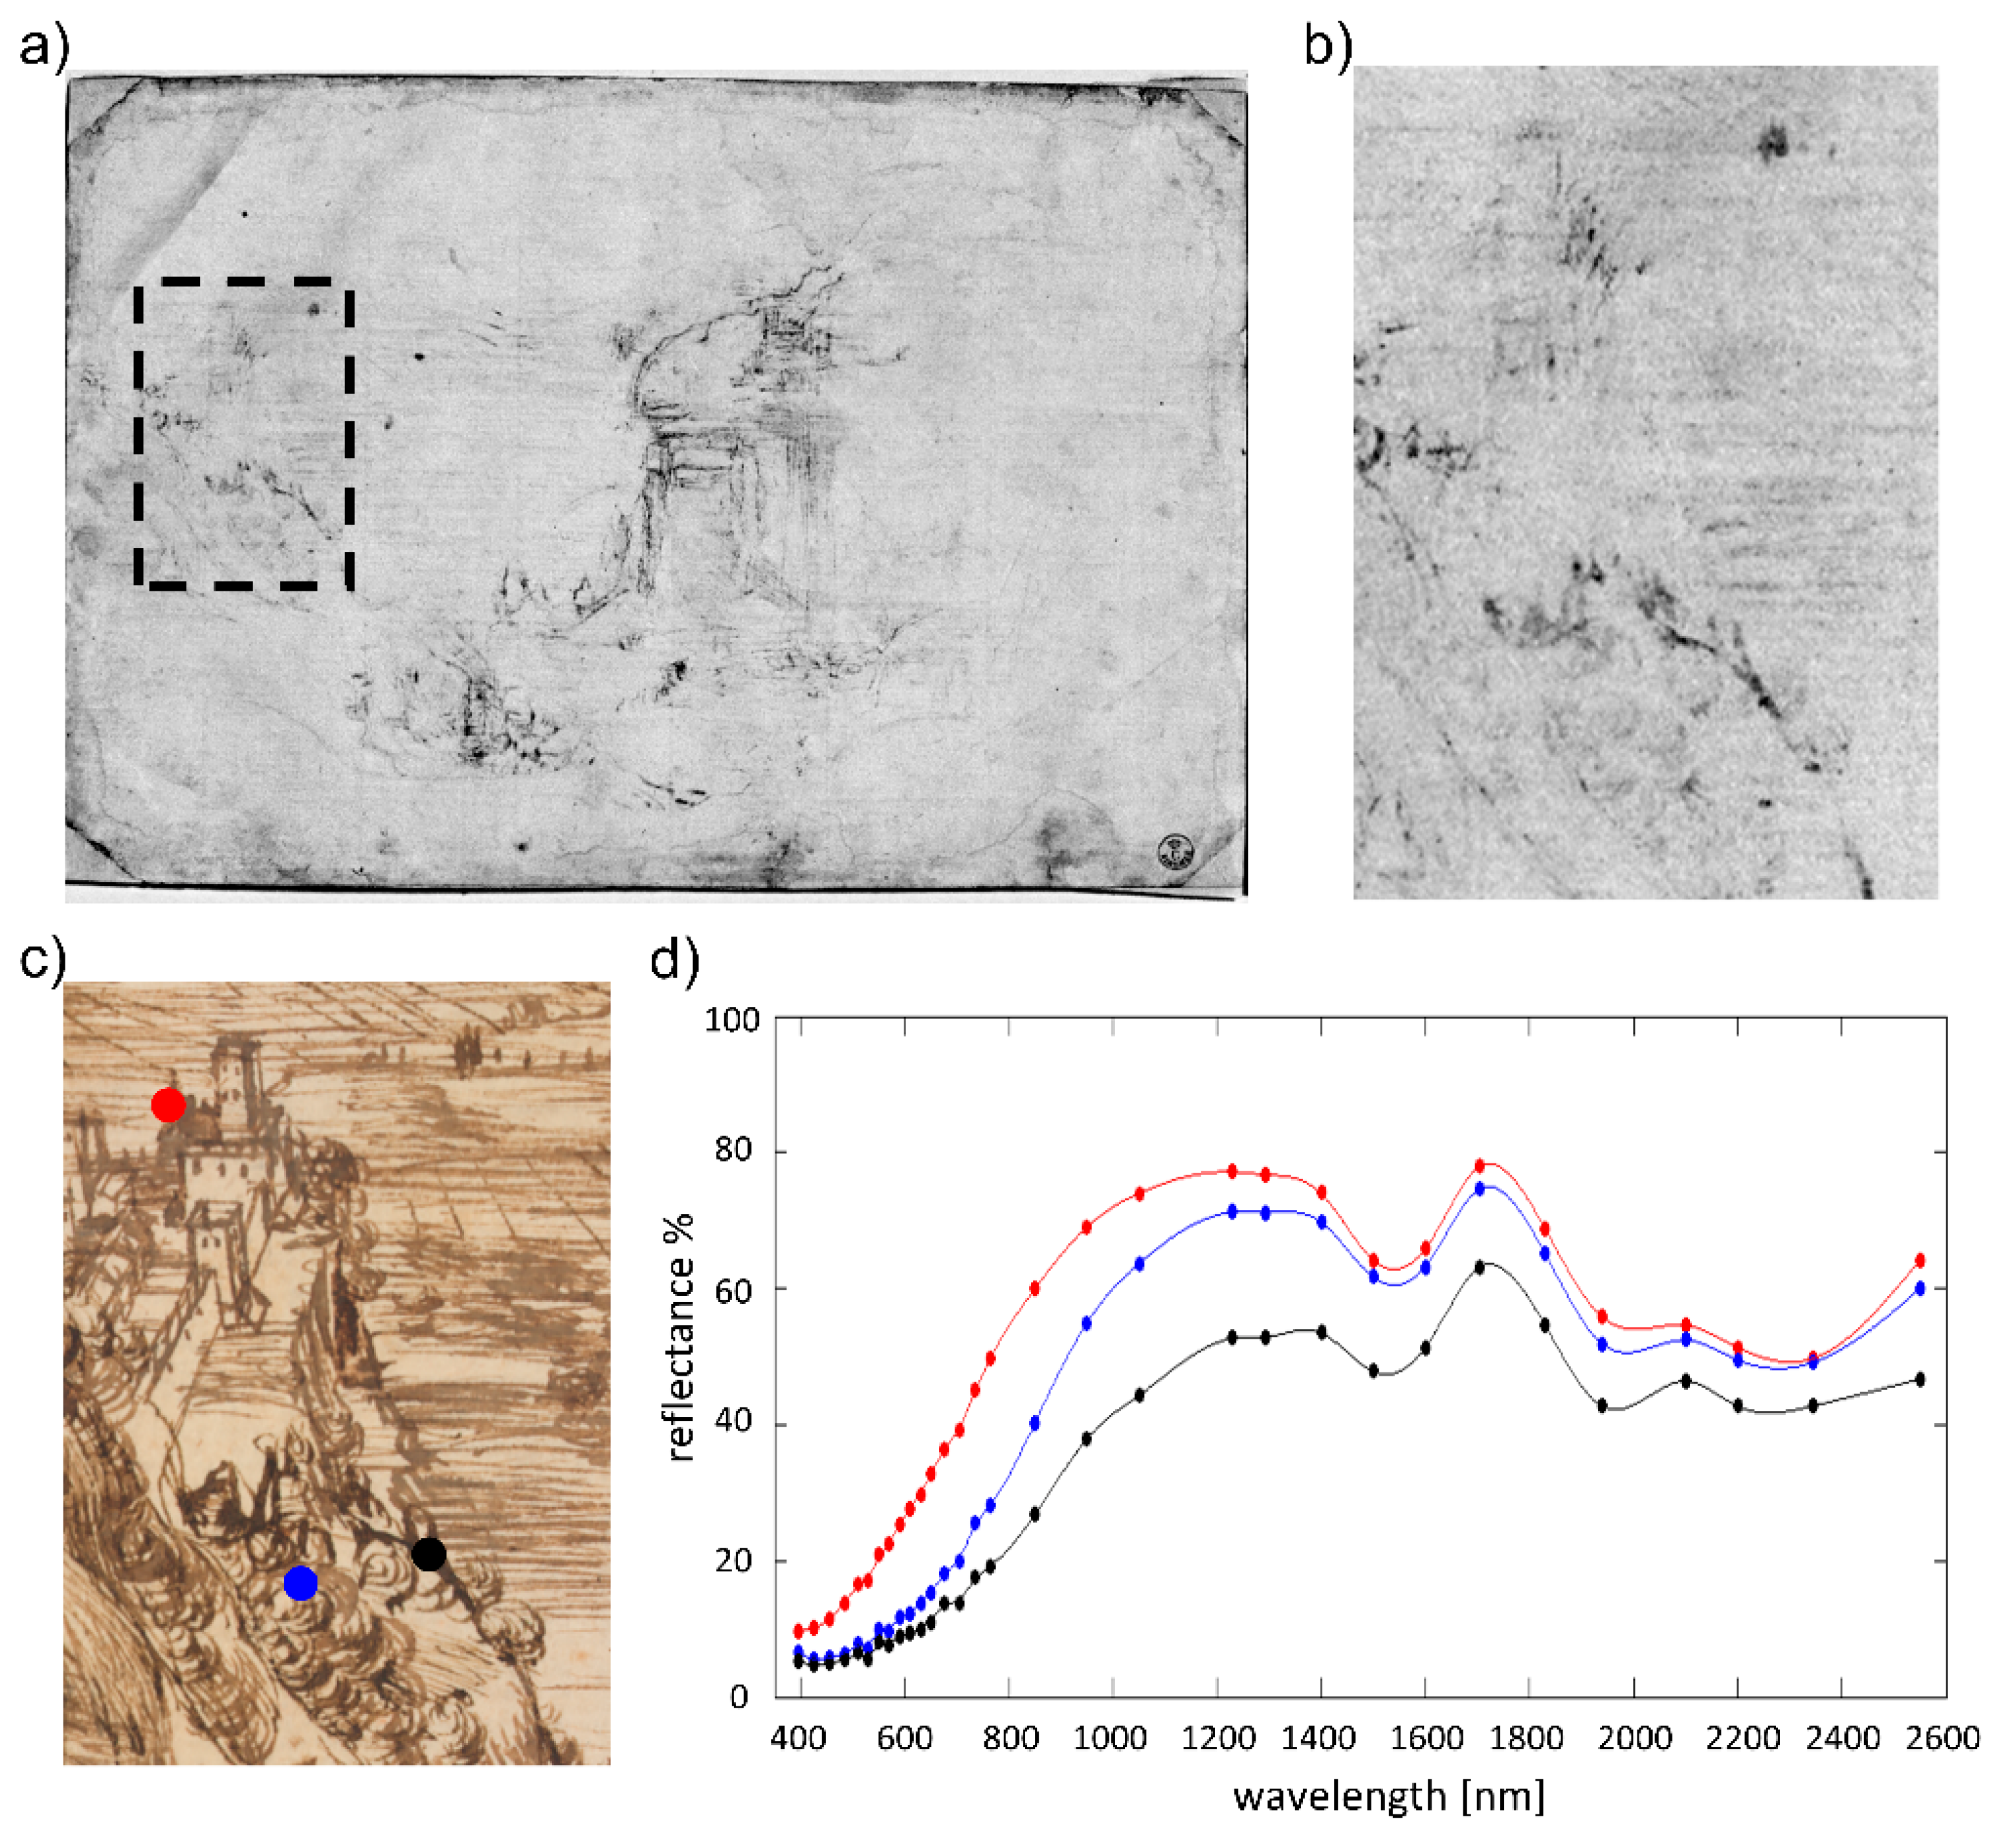
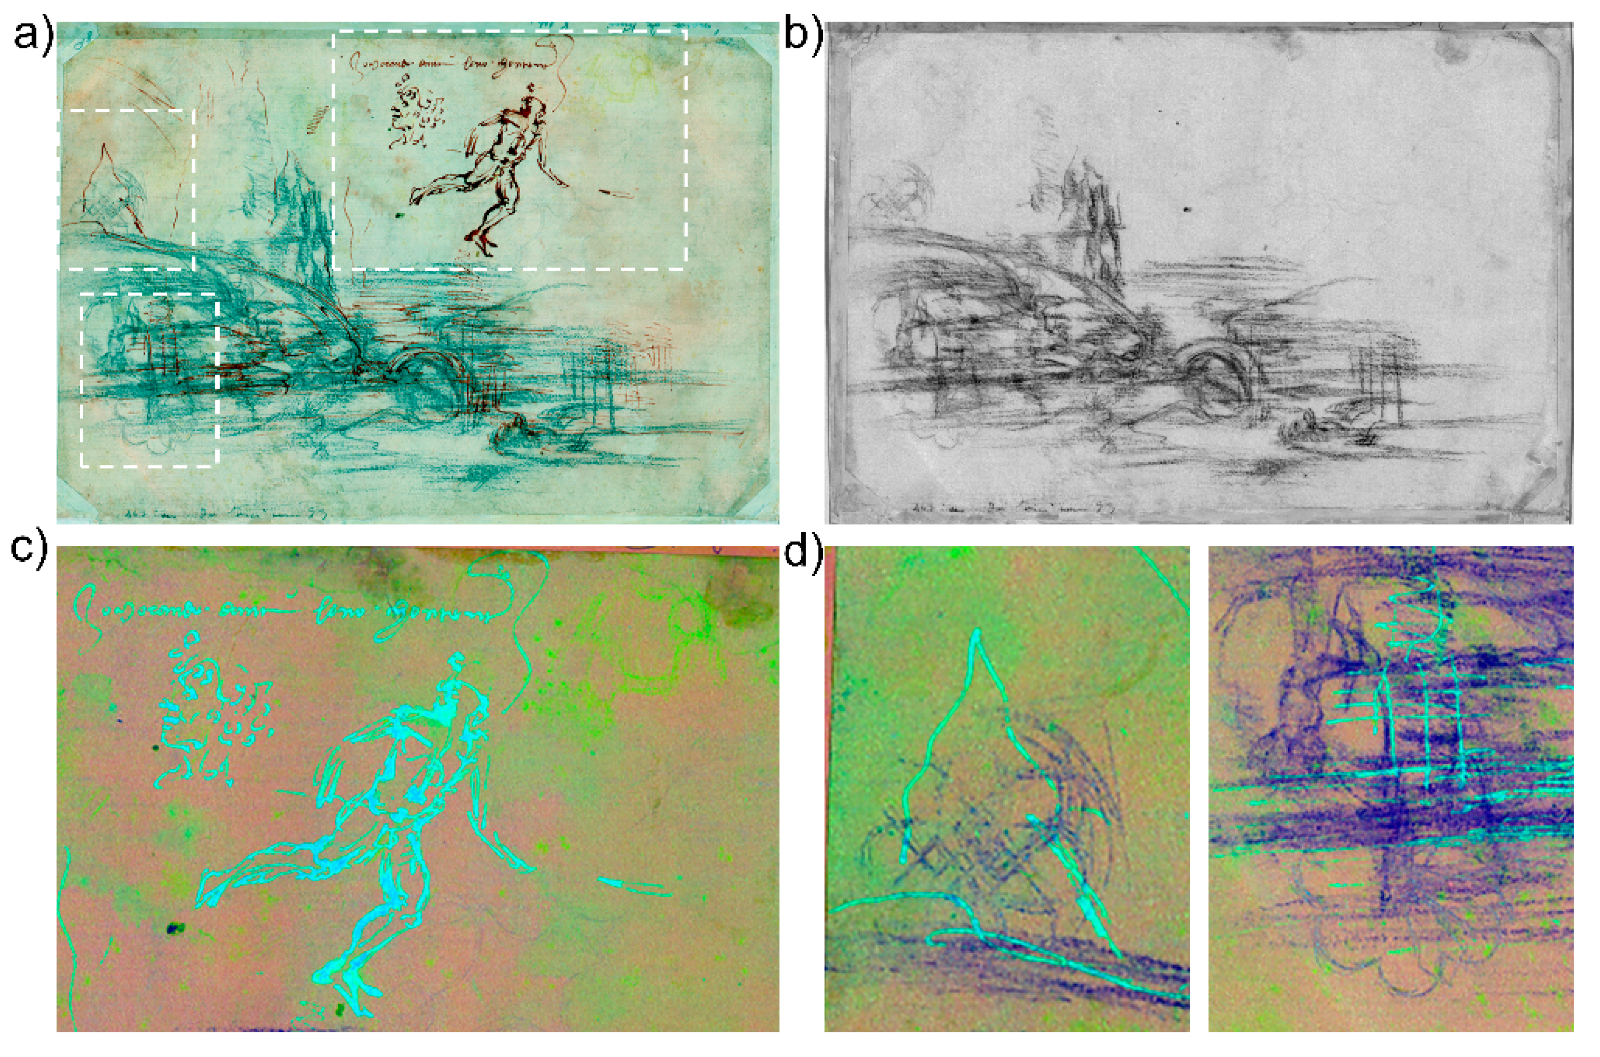
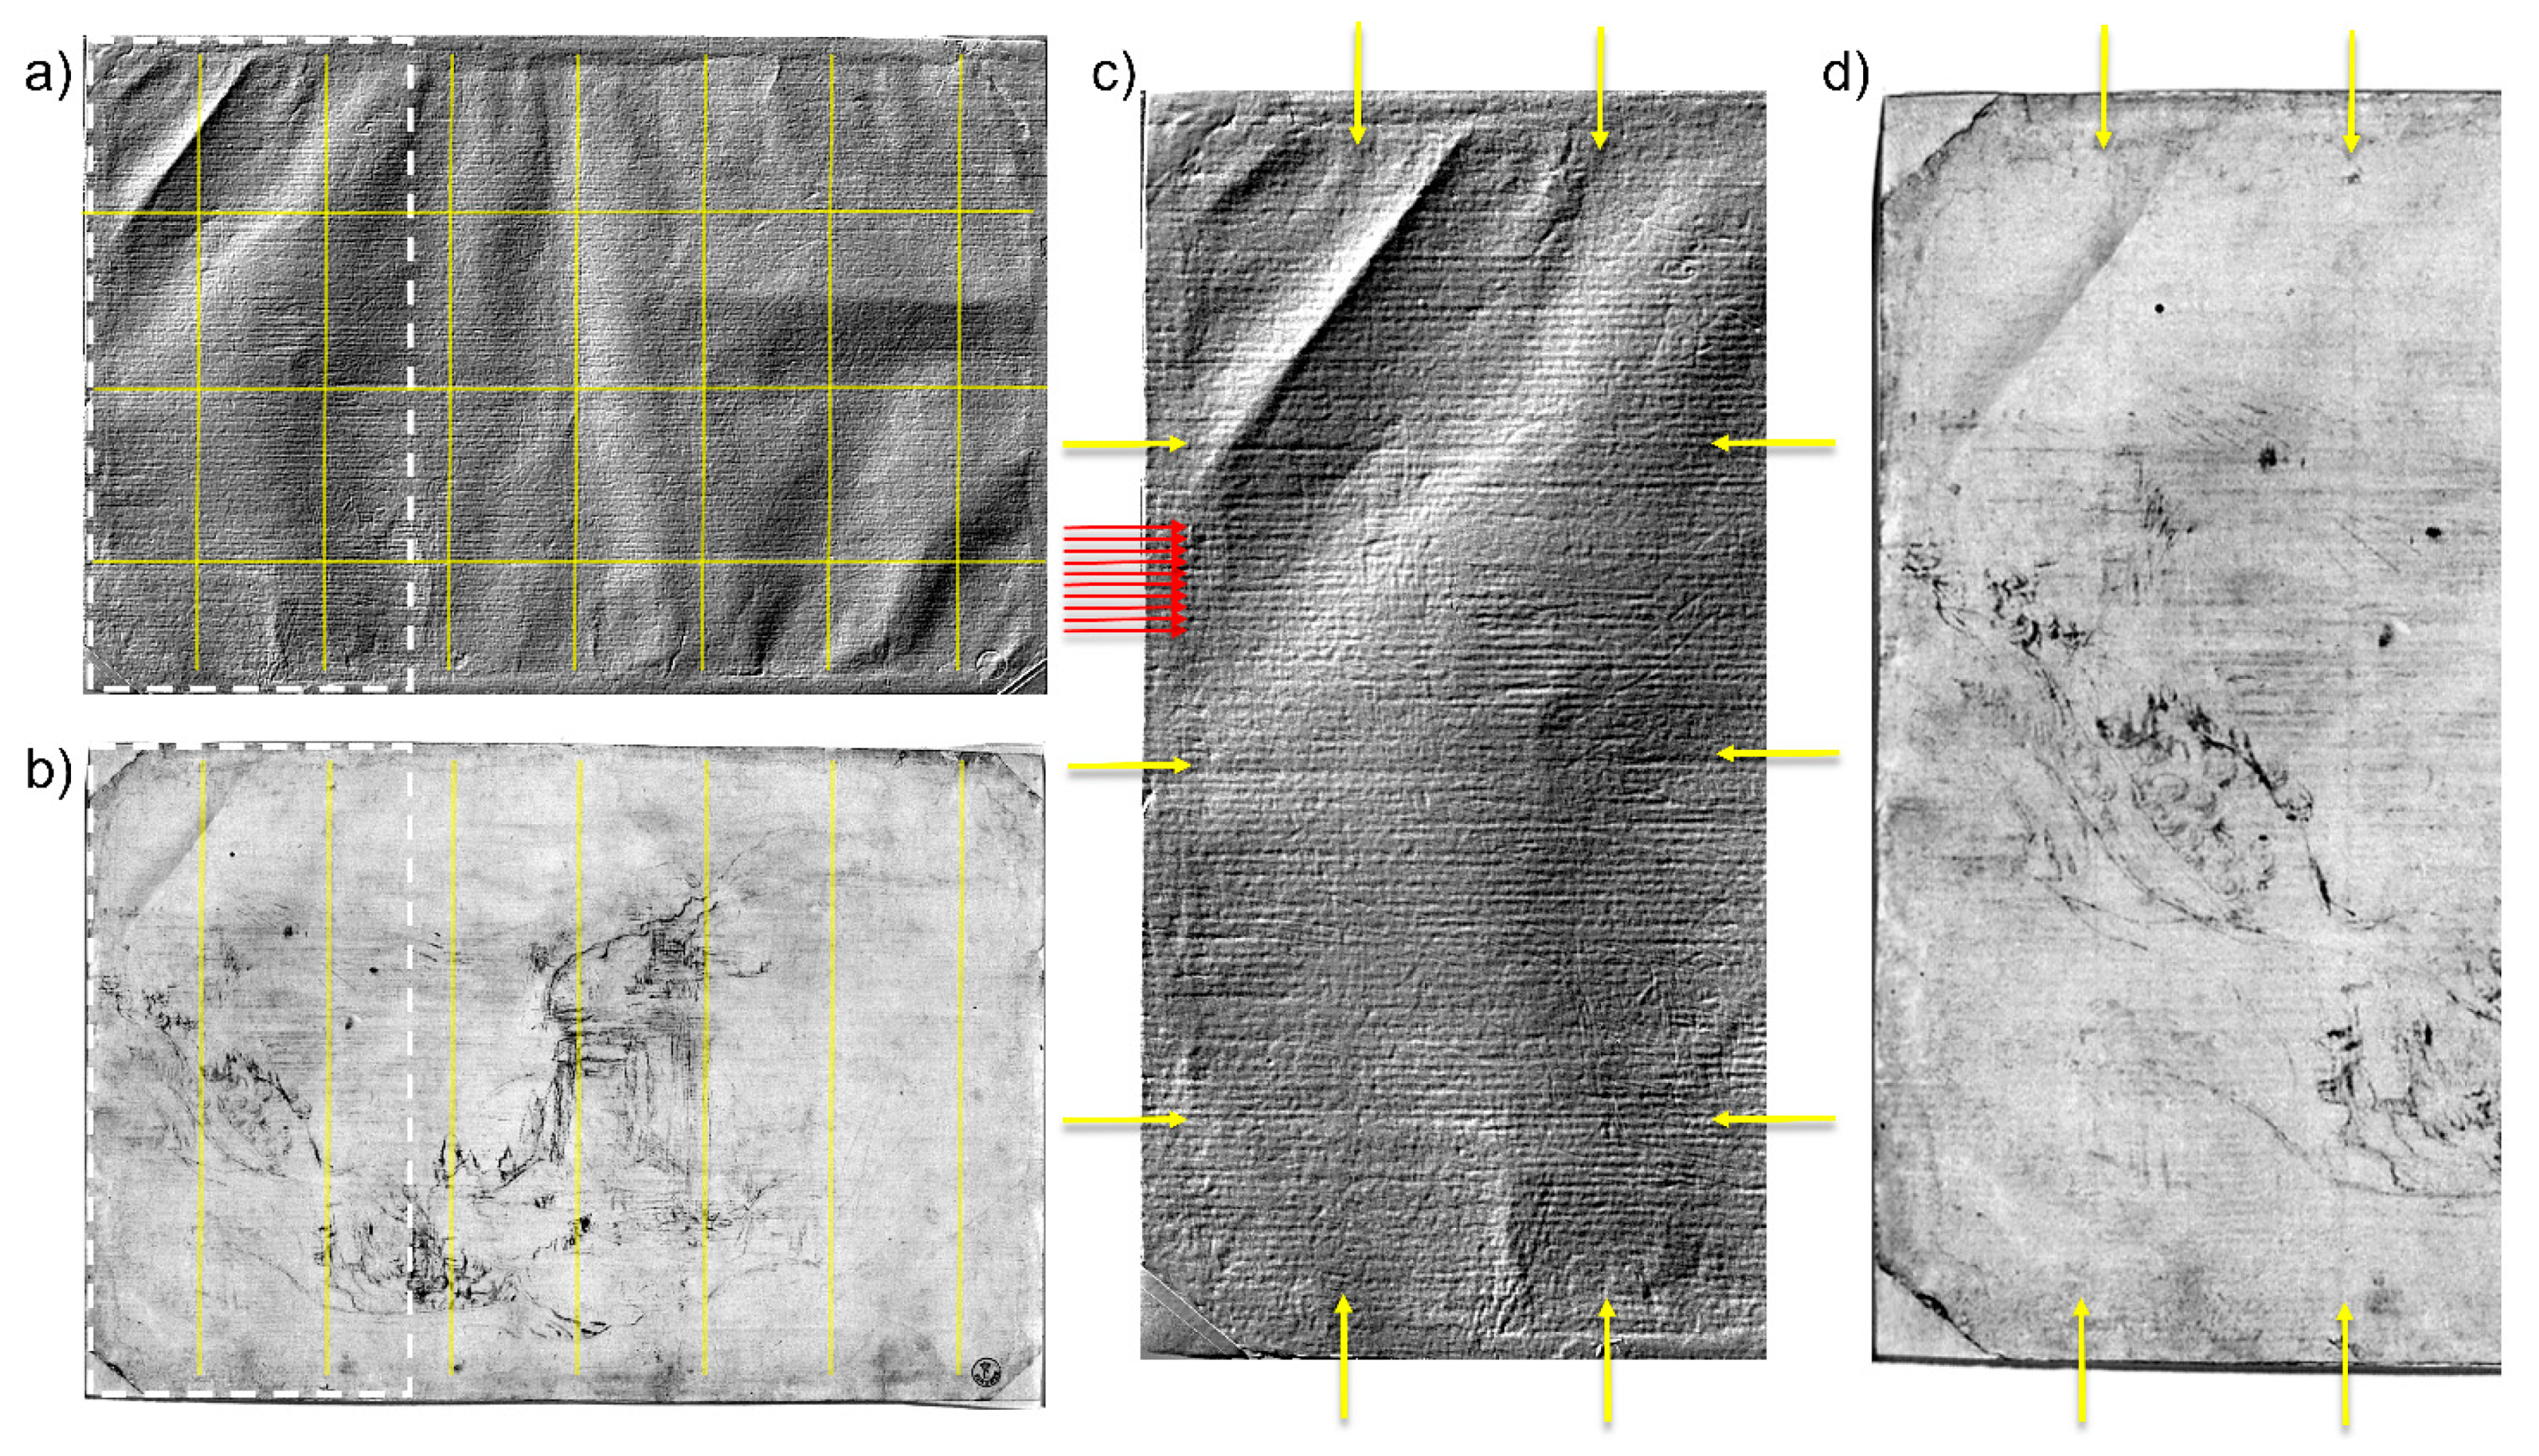
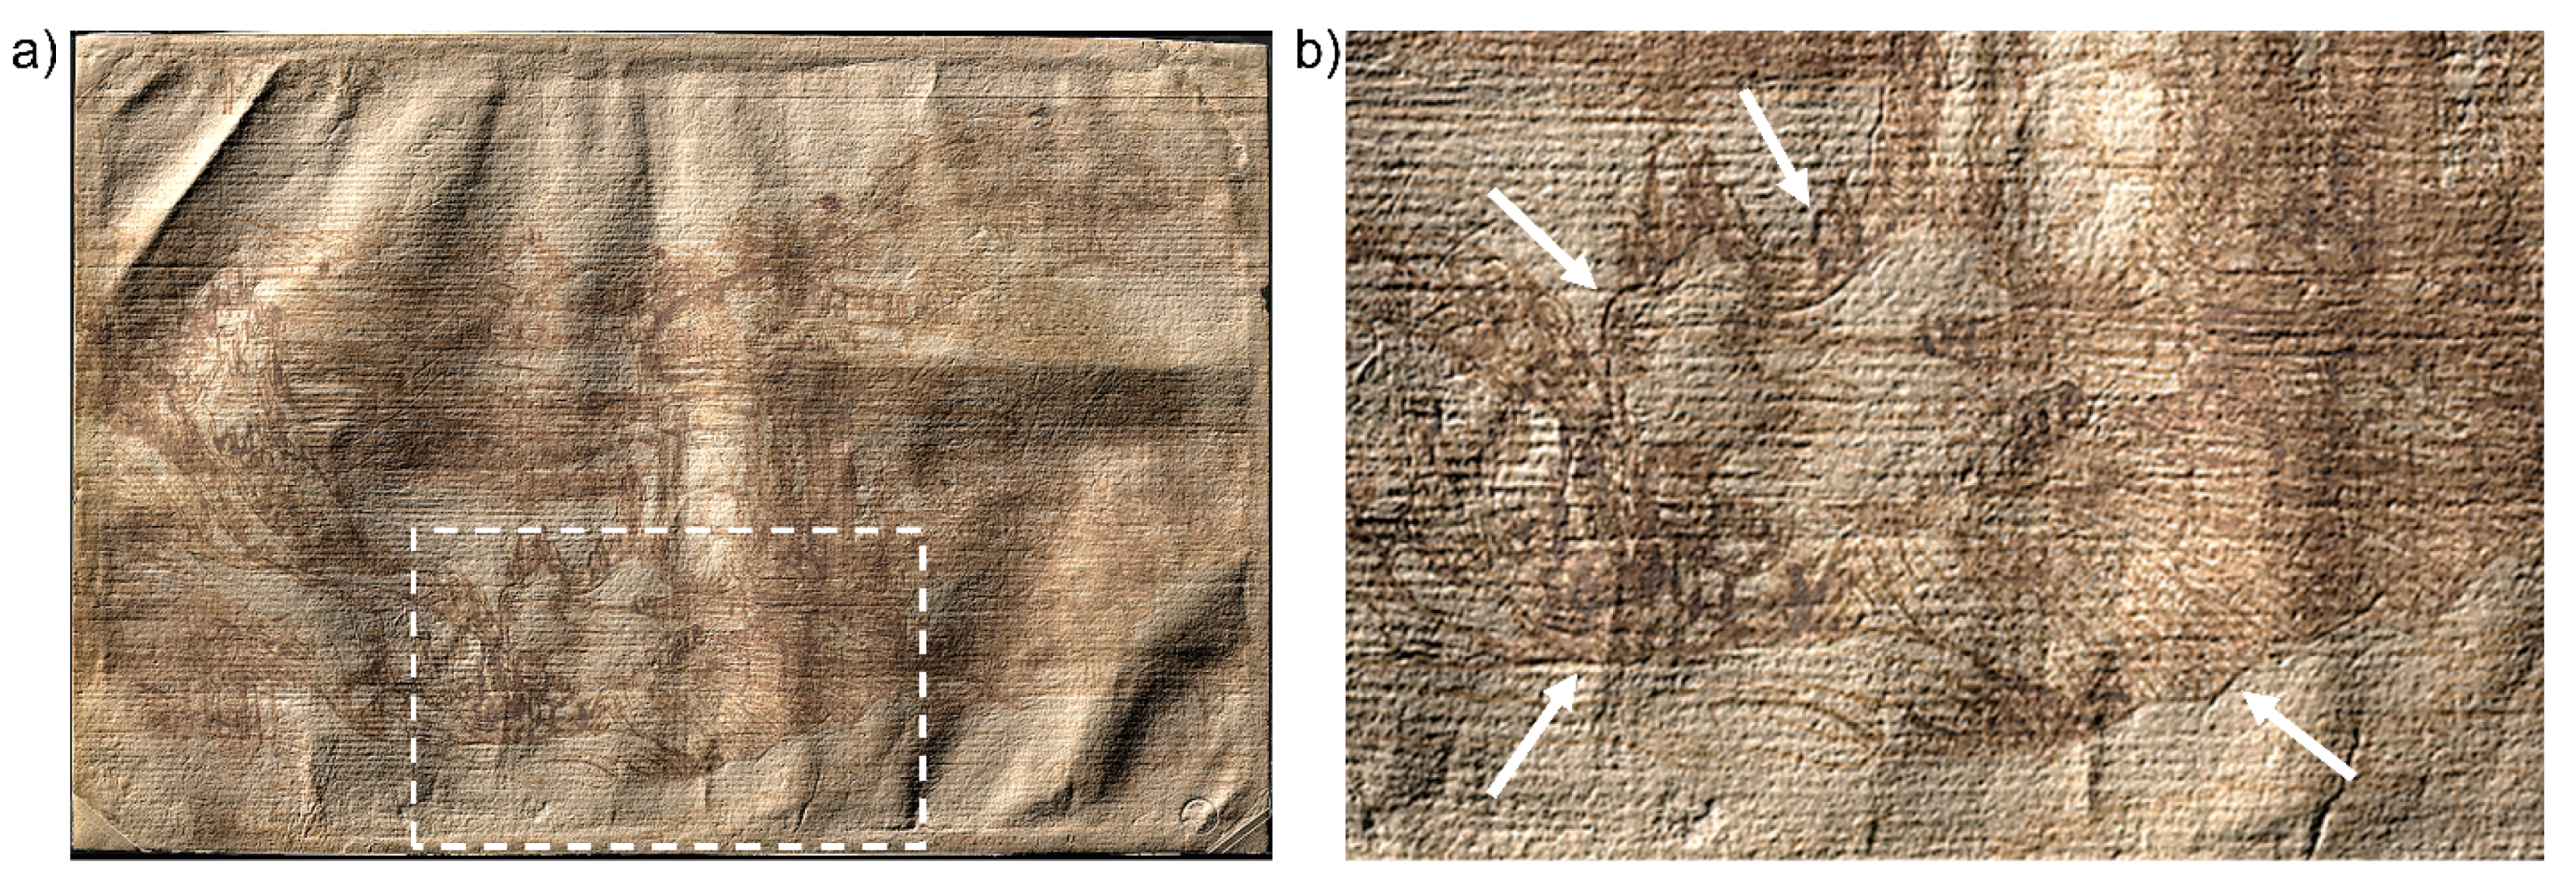
3.1. Vis-NIR Multispectral Reflectography

Enhanced instrumental resolution was ensured by raster acquisition performed with oversampling (4x) in both x and y scanning directions, while proper image deconvolution was applied to the datacube. False-color imaging, which was performed on the high-resolution images following the processing described above, revealed traces of the preliminary drawing that outlines the steep cliff on the left of the waterfall and the fortress on the promontory. Details of the rocky wall can be observed in Figure 2, which displays the FC images obtained by combining the NIR -at 1292 nm, the red, and the green images (Figure 2b,d), and PC2, PC3, and PC4 images (Figure 2c,e). According to XRF analysis of the same areas [27], the sketch was drawn with a lead stylus, which is consistent with findings pertaining to other drawings by the same author. The use of a lead stylus is particularly evident in the reported NRG-FC images, where a dark line is visible beneath the red of the main drawing. The same lines appear bright orange in the PC-FC images. Leonardo used to draw with different metal points: lead, which is soft and easy to erase, was used to sketch out drawings that were then refined with a pen; silver and metal alloys were preferred for figure sketches and studies, often completed with lead white highlights [30].
The preliminary sketch in metal point was completed with another tool, possibly a dip pen, in two successive steps [31]. Multispectral analyses showed the presence of two distinct drawings, one outlining the main composition with pale brown lines and the other defining more intense-colored details. The different spectral behavior of the two materials is especially evident in the NIR image at 1600 nm (Figure 3a), where all the main elements of the landscape become transparent except for the outline of the rocks, the fine strokes defining the vegetation in the foreground, and the maelstrom at the bottom of the waterfall. XRF identified common chemical elements in the two types of ink distribution, namely iron, copper, and sulphur. This is consistent with iron-gall ink, and, more specifically, with hydrated green and blue vitriol (FeSO4·nH2O and CuSO4·nH2O, respectively), which were typically added to tannic acid solutions to obtain ink [27,32]. The different absorption properties of the two drawings suggest that Leonardo may have used a more diluted, and therefore IR transparent, ink for the main composition, and a more concentrated one for defining specific details [27]. Reflectance spectra (Figure 3d) acquired in the three points shown in Figure 3c confirm the similarities between the two ink compositions. The marked rising in reflectance beyond the red region (inflection point occurring at ca. 730 nm), which accounts for the brownish tone perceived in the visible, is compatible with metal-gall inks [33]. In the analyzed drawing, the overall degree of reflectance appears lower as the ink’s hue becomes darker, with a rise occurring in the NIR. Conversely, the lower hiding power of the more diluted iron-gall ink mixture inevitably determines a higher contribution of the paper support, which, in its turn, affects the position of the inflection point in the resulting reflectance spectrum [34]. While there are studies relating the ink’s hue to its metal content [35], such a hypothesis requires further verification, especially when considering that artists would often add organic carbon to the mixture to enhance its dark tone. Moreover, recipes for iron-gall inks are numerous and varied, and may include very diverse components and impurities, each undergoing various degradation processes resulting in color changes. In our case, browning and darkening may have resulted from oxidation of ink components into quinonoid structures, as well as degradation products of the Arabic gum in the ink and cellulose in the paper support [32].
The use of a similar drawing technique was identified on the verso of the sheet (Figure 4). The main sketch, namely the stream with a bridge and a barely traced outline of hills in the distance, is executed with a dry-point technique [31]. The FC image at 950 nm (Figure 4a) allows for a distinction between this drawing (greenish in appearance) and a few darker details redefined with ink. The latter becomes increasingly transparent in the NIR spectral range and disappears completely at 1600 nm (Figure 4b), consistent with what is observed on the recto, whereas the rocks and the flowing stream in the foreground remain clearly visible. The material used for the main composition, appearing grey in the visible, was identified as lampblack, a dark material typically obtained from the combustion of oils and candles [31]. The soft and grainy appearance of the drawing lines suggests the use of the pastel technique, which originated in France and is believed to have been introduced in Italy by Leonardo himself [36]. The two studies of figures in the upper part of the sheet, both disappearing at 1600 nm, are pen-drawn with brown ink, with indistinct traces of an under-drawing, possibly made with hematite-based red chalk [27], a technique traditionally known as sanguine. These sketches, as well as the bust of a draped figure drawn with the same material, are particularly evident in the detail of the FC-PC image in Figure 4c (light blue traits and yellow traits, respectively).
Fine traces of geometric studies (Figure 4d), executed with a very fine lead point [31], can be seen in the details of the FC-PC image. The superimposed sequence of drawing lines made visible by multispectral imaging suggests that the geometric patterns were the first to be drawn and were then covered by the black pastel landscape and the other ink elements at a later point in time.

3.2. Laser Scanning Microprofilometry

Morphological analysis of the paper surface allowed for the identification of the typical wavy texture impressed in the sheet during the papermaking process. Papermaking between the 15th and the 16th centuries in Europe involved the use of stamping mills consisting of rows of wooden pestles or mallets, which were caused to rise and fall by means of a series of cams to reduce the linen or, more rarely, cotton fabrics to pulp [37,38]. The pulp was suspended in a vat of water. A papermaking mold, i.e., a wooden framework on which a screen made of wires was either placed or strung, was dipped into the vat and scooped up the pulp, thereby trapping the latter within the fine porous screen of the mold. The wires acted as a sieve, filtering out the pulp as the water drained through [39], causing the typical impressions of the wires running sideways (“laid lines”) and from top to bottom (“chain lines”) on the final sheet. Then, the sodden sheet was transferred onto a wool felt. Alternating wool felts and freshly formed sheets are built up to form a “post”, which was eventually transferred to a screw press to remove the excess water, thus impressing the wavy surface texture of the wool felt into the paper. The paper sheets so obtained were finally separated and taken to a loft to dry. The topographic map of the recto (Figure 5a,c), acquired with a sampling step of 50 μm, highlights the presence of seven chain lines with an interval of 3.5–3.7 cm among each, as well as a dense sequence of fine laid lines running parallel to the longer side of the sheet. Interestingly, the NIR reflectance images revealed the presence of seven lines drawn in the same position of the chain lines, which were interpreted as a preliminary grid (by way of example, see NIR image at 1292 nm in Figure 5b,d) [30]. The material used to trace the grid absorbs the Vis-NIR radiation in a manner similar to the above-mentioned preparatory drawing, corroborating the lead point hypothesis [18]. Another series of spaced lines etched parallel to the long side of the sheet appears to have been imprinted freehand by Leonardo with what seems to have been a blind stylus, considering both the width and irregularity of the strokes, and the absence of drawing traces.
The 3D model also highlighted the presence of deep incisions at the bottom of the sheet near the profile of the raised terrain in the foreground (Figure 6). These traces may be a by-product of the transferring method used, namely the interposition of transparent paper to transfer the preparatory drawing or assemble sketches to compose a whole scene [40]. In his Trattato della Pittura, Leonardo often reports using transparent paper, or even flat glass, not only to copy the preparatory drawing but also to verify the correspondence between the final work and the model previously copied by direct observation [41]. This particular method is still under-researched, due to both the almost total loss of the original materials and the analytic difficulty of detecting its traces. In fact, scholars have often interpreted drawings transferred by means of transparent paper as indirect incisions resulting from cartoon transposition, or even carbon-copying [30].

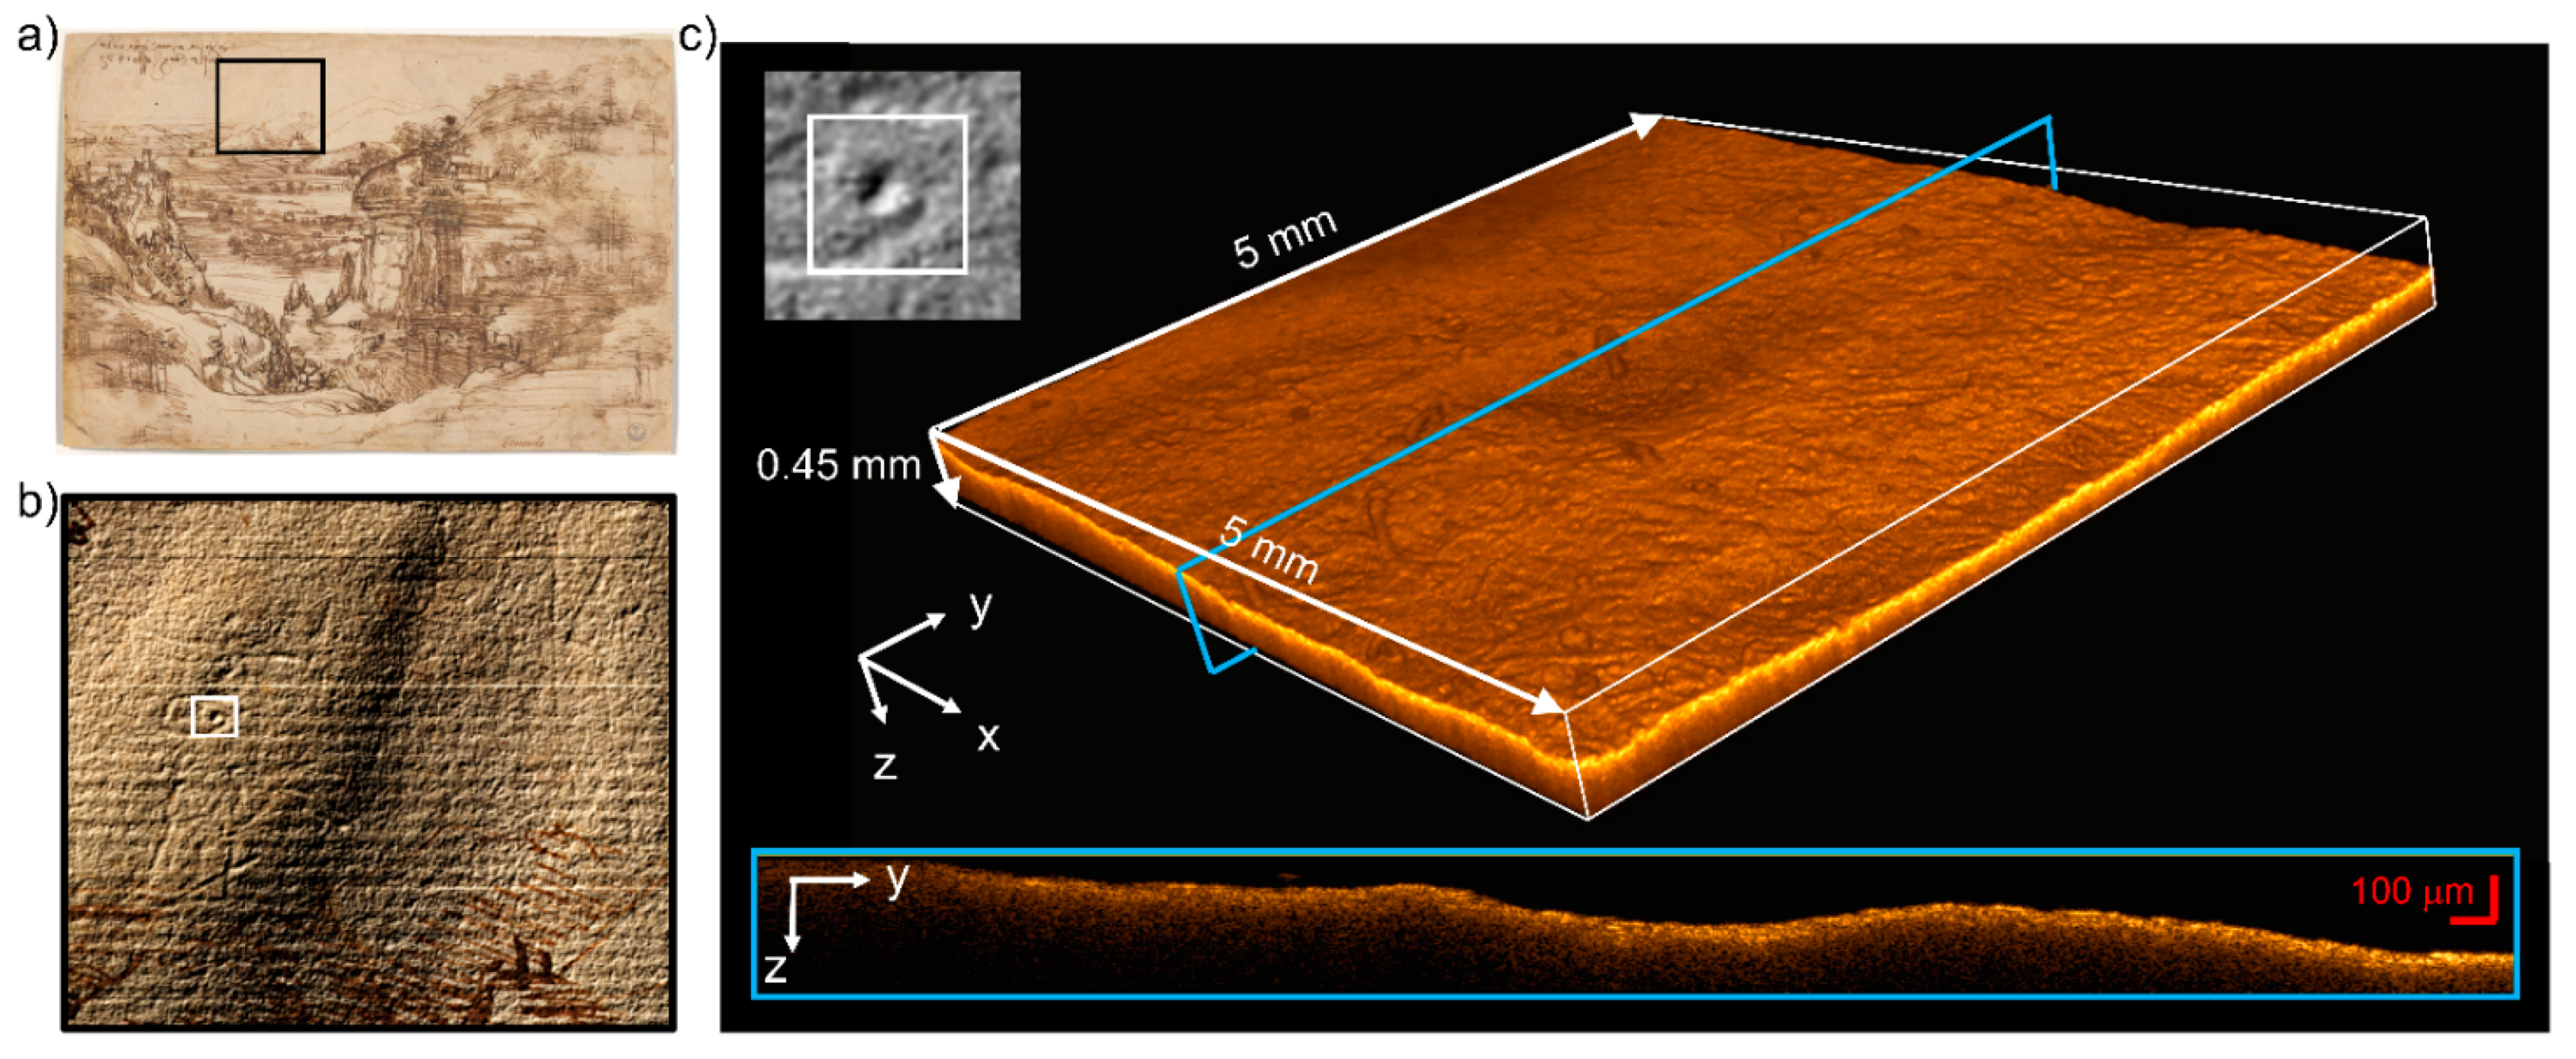
3.3. Spectral-Domain Optical Coherence Tomography (Sd-OCT)

OCT tomocubes (5 × 5 × 0.45 mm3, voxel size 3.5 μm3) allowed for the areal and cross-sectional visualization of micrometric features related to the artistic technique possibly used by Leonardo. Of particular interest are the traits engraved in the white background with no trace of colored material and no relation to the drawn landscape (Figure 7a,b). Some of these lines are interpreted as superficial scratches ascribed to mechanical damage [31], while others, likely drawn with a blind stylus, seem to outline graphic forms, such as a triangle and an indefinite sketch. The latter’s OCT tomocube (Figure 7b) shows a circular concavity, 1.5 mm in diameter and 40–45 μm-deep, which may indicate the use of a pointed tool in this area. Another possible explanation is that they were impressed in the paper while they were being drawn on another superimposed sheet, which would account for their hardly understandable location in the sky above the landscape. Further investigation and comparison with other drawings may clarify this point.

4. Discussion and Conclusions

At present there are very few scientific studies supporting the historical-artistic interpretation of paper-based artefacts, particularly those by Leonardo da Vinci. Our results offer a useful contribution to the literature on the drawing technique used by Leonardo in his early production. Drawing 8P was analyzed with complementary optical techniques that fully preserve its material integrity. Scientific data were accurately integrated with technical information provided by art historians and conservators involved in the measurement campaign to obtain an exhaustive and reliable characterization of the examined artwork.
False-color and PCA processing of the multispectral images revealed traces of a preliminary sketch of the landscape on the recto, which was drawn with a lead stylus, consistently with other drawings by the same author. Reflectance imaging and spectroscopy highlighted the presence of two distinct superimposed drawings, both made with iron-gal ink, and yet displaying different absorption properties. This seems to indicate that Leonardo used a diluted ink solution for the main composition, and a more concentrated one for the definition of specific details. Furthermore, our analysis revealed a similar superimposition of materials in the main sketch on the verso, also attributed to Leonardo, who outlined the scene with a lampblack pastel and then redefined it with ink and pen. The identification of the pastel technique in the early work of Leonardo is particularly significant, as it is believed that the artist himself was responsible for the introduction of said technique to Italy. The other sketches, caricatures, and writings observed on the backside of the sheet are made with ink, red chalk (sanguine), lead point, lampblack, and metal stylus. The concurrent presence of such diverse tools and materials suggests that they are the result of occasional drawing exercises not only by Leonardo but also by other artists attending the workshop of Verrocchio in the same period, or even later. The poor definition of the least visible sketches, in particular, does not allow for their precise attribution. The only exception are the sanguine sketches, which can be attributed to a later author, since the material used was extremely rare in the years comprised between the time the landscape was drawn and 1480 [42].
Morphological analysis of the sheet by microprofilometry showed the typical wavy texture and chain line/laid line impressions related to the papermaking method available at that time. The 3D model also highlighted the presence of deep incisions, possibly resulting from the use of transparent paper for transferring the preparatory drawing onto the final sheet—a method described by Leonardo himself, yet still poorly documented in terms of scientific investigations.
OCT analysis allowed for the visualization of micrometric details of traits engraved in the white background with no trace of coloured material and no apparent relation to the drawn landscape.
Our work provides corroborating evidence of the suitability of multimodal application of non-invasive techniques to gain new insights into Leonardo’s under-investigated modes of creation. The systematic application of complementary analytical methods proved essential for a deeper understanding of such complex and extremely valuable artworks.

Author Contributions

Conceptualization, R.F., A.D.F. and J.S.; methodology, R.F. and A.D.F.; software, E.P.; validation, R.F., J.S. and E.P.; formal analysis, R.F. and A.D.F.; investigation, R.F. and A.D.F.; resources, R.F.; writing—original draft preparation, A.D.F.; writing—review and editing, A.D.F.; visualization, R.F., J.S. and E.P.; supervision, R.F.; project administration, R.F. All authors have read and agreed to the published version of the manuscript.

Funding

This research was funded by Regione Toscana (POR FSE 2014–2020, “Giovanisì”, Intervention Program “CNR4C”, CUP B15J19001040004).

Institutional Review Board Statement

Not applicable.

Informed Consent Statement

Not applicable.

Acknowledgments

Marco Ciatti, Cecilia Frosinini, Conservator L. Montalbano from Opificio delle Pietre Dure are gratefully acknowledged.

Conflicts of Interest

The authors declare no conflict of interest.

References

  1. Bacci, M.; Casini, A.; Cucci, C.; Muzzi, A.; Porcinai, S. A study on a set of drawings by Parmigianino: Integration of art-historical analysis with imaging spectroscopy. J. Cult. Herit. 2005, 6, 329–336. [Google Scholar] [CrossRef]
  2. Delaney, J.K.; Ricciardi, P.; Glinsman, L.D.; Facini, M.; Thoury, M.; Palmer, M.; de la Rie, E.R. Use of imaging spectroscopy, fiber optic reflectance spectroscopy, and X-ray fluorescence to map and identify pigments in illuminated manuscripts. Stud. Conserv. 2014, 59, 91–101. [Google Scholar] [CrossRef] [Green Version]
  3. Thomson, G. The museum environment. In Butterworth-Heinemann series in Conservation and Museology, 2nd ed.; Butterworth-Heinemann: Oxford, UK, 1986; pp. 16–45. [Google Scholar]
  4. Ricciardi, P.; Delaney, J.K.; Glinsman, L.; Thoury, M.; Facini, M.; de la Rie, E.R. Use of visible and infrared reflectance and luminescence imaging spectroscopy to study illuminated manuscripts: Pigment identification and visualization of underdrawings. O3A 2009, 7391, 739106. [Google Scholar]
  5. Striova, J.; Dal Fovo, A.; Fontana, R. Reflectance imaging spectroscopy in heritage science. La Riv. Nuovo Cim. 2020, 43, 515–566. [Google Scholar] [CrossRef]
  6. Legrand, S.; Ricciardi, P.; Nodari, L.; Janssens, K. Non-invasive analysis of a 15th century illuminated manuscript fragment: Point-based vs. imaging spectroscopy. Microchem. J. 2018, 138, 162–172. [Google Scholar] [CrossRef]
  7. Lauwers, D.; Cattersel, V.; Vandamme, L.; Van Eester, A.; De Langhe, K.; Moens, L.; Vandenabeele, P. Pigment identification of an illuminated mediaeval manuscript De Civitate Dei by means of a portable Raman Equipment. J. Raman Spectrosc. 2014, 45, 1266–1271. [Google Scholar] [CrossRef] [Green Version]
  8. De Viguerie, L.; Rochut, S.; Alfeld, M.; Walter, P.; Astier, S.; Gontero, V.; Boulch, F. XRF and reflectance hyperspectral imaging on a 15th century illuminated manuscript: Combining imaging and quantitative analysis to understand the artist’s technique. Herit. Sci. 2018, 6, 1–11. [Google Scholar] [CrossRef]
  9. Van der Snickt, G.; De Nolf, W.; Vekemans, B.; Janssens, K. μ-XRF/μ-RS vs. SR μ-XRD for pigment identification in illuminated manuscripts. Appl. Phys. A Mater. Sci. Process. 2008, 92, 59–68. [Google Scholar] [CrossRef]
  10. Aceto, M.; Agostino, A.; Fenoglio, G.; Idone, A.; Gulmini, M.; Picollo, M.; Ricciardi, P.; Delaney, J.K. Characterisation of colourants on illuminated manuscripts by portable fibre optic UV-visible-NIR reflectance spectrophotometry. Anal. Methods 2014, 6, 1488–1500. [Google Scholar] [CrossRef]
  11. Kakuee, O.; Fathollahi, V.; Oliaiy, P.; Lamehi-Rachti, M.; Taheri, R.; Jafarian, H.A. External PIXE analysis of an Iranian 15th century poetry book. Nucl. Instrum. Methods Phys. Res. B Beam Interact. Mater. At. 2012, 273, 178–181. [Google Scholar]
  12. Delaney, J.K.; Facini, M.; Glinsman, L.D.; Thoury, M. Application of imaging spectroscopy to the study of illuminated manuscripts. In Proceedings of the American Institute for Conservation 37th Annual Meeting, Los Angeles, CA, USA, 19–20 May 2009. [Google Scholar]
  13. Melo, M.J.; Otero, V.; Vitorino, T.; Araújo, R.; Muralha, V.S.; Lemos, A.; Picollo, M. A spectroscopic study of brazilwood paints in medieval books of hours. Appl. Spectrosc. 2014, 68, 434–443. [Google Scholar] [CrossRef] [PubMed]
  14. Doni, G.; Orazi, N.; Mercuri, F.; Cicero, C.; Zammit, U.; Paoloni, S.; Marinelli, M. Thermographic study of the illuminations of a 15th century antiphonary. J. Cult. Herit. 2014, 15, 692–697. [Google Scholar] [CrossRef]
  15. Mercuri, F.; Gnoli, R.; Paoloni, S.; Orazi, N.; Zammit, U.; Cicero, C.; Marinelli, M.; Scudieri, F. Hidden text detection by infrared thermography. Restaurator 2013, 34, 195–211. [Google Scholar]
  16. Milota, P.; Reiche, I.; Duval, A.; Forstner, O.; Guicharnaud, H.; Kutschera, W.; Merchel, S.; Priller, A.; Schreiner, M.; Steier, P.; et al. PIXE measurements of Renaissance silverpoint drawings at VERA. Nucl. Instrum. Meth. Phys. Res. B 2008, 266, 2279–2285. [Google Scholar] [CrossRef]
  17. Radtke, I.M.; Berger, A.; Görner, W.; Ketelsen, T.; Merchel, S.; Riederer, J.; Riesemeier, H.; Roth, M. Spatially resolved synchrotron-induced X-ray fluorescence analyses of metal point drawings and their mysterious inscriptions. Spectrochim. Acta B 2004, 59, 1657–1662. [Google Scholar]
  18. Tanimoto, S.; Verri, G. A note on the examination of silverpoint drawings by nearinfrared reflectography. Stud. Conserv. 2009, 54, 106–116. [Google Scholar] [CrossRef]
  19. Reiche, I.; Radtke, M.; Berger, A.; Görner, W.; Merchel, S.; Riesemeier, H.; Bevers, H. Spatially resolved synchrotron radiation induced X-ray fluorescence analyses of rare Rembrandt silverpoint drawings. Appl. Phys. A 2006, 83, 169–173. [Google Scholar] [CrossRef]
  20. Bambach, C.C. On the role of scientific evidence in the study of Leonardo’ drawings. In Leonardo Da Vinci's Technical Practice: Paintings, Drawings and Influence; Menu, M., Ed.; Hermann: Paris, France, 2014; pp. 223–253. [Google Scholar]
  21. Ambers, J.; Higgitt, C.; Saunders, D. Italian Renaissance Drawings: Technical Examination and Analysis; London Archtype; British Museum: London, UK, 2010. [Google Scholar]
  22. Frosinini, C.; Montalbano, L.; Piccolo, M. Leonardo e Raffaello, per Esempio. Disegni e Studi D’artista. Catalogue of the Exhibition Held At Palazzo Medici Riccardi–Florence; Mandragora: Florence, Italy, 2008. [Google Scholar]
  23. Bicchieri, M.; Biocca, P.; Caliri, C.; Romano, F.P. New discoveries on Leonardo da Vinci drawings. Microchem. J. 2020, 157, 1–6. [Google Scholar] [CrossRef]
  24. Bicchieri, M.; Biocca, P.; Caliri, C.; Romano, F.P. Complementary MA-XRF and μ-Raman results on two Leonardo da Vinci drawings. X-ray Spectrom. 2021, 50, 401–409. [Google Scholar] [CrossRef]
  25. Barsanti, R. Introduction. In Leonardo in Vinci: At the Origins of the Genius, Catalogue of the Exhibition Held at the Museo Leonardiano, Vinci, Italy; Giunti: Milano, Italy, 2019. [Google Scholar]
  26. Marani, P. Leonardo, Anatomia dei Disegni. Sistema Museale di Ateneo; Università di Bologna: Bologna, Italy, 2019. [Google Scholar]
  27. Ruberto, C.; Mandò, P.A.; Taccetti, F. X-ray fluorescence scanning analysis. In Leonardo in Vinci: At the Origins of the Genius, Catalogue of the Exhibition Held at the Museo Leonardiano, Vinci, Italy; Barsanti, R., Ed.; Giunti: Milano, Italy, 2019. [Google Scholar]
  28. Barsanti, R. Leonardo’s landscape of 1473. Research and interpretations. In Leonardo in Vinci: At the Origins of the Genius, Catalogue of the Exhibition Held at the Museo Leonardiano, Vinci, Italy; Barsanti, R., Ed.; Giunti: Milano, Italy, 2019. [Google Scholar]
  29. Geladi, P.; Grahn, H.F. Multivariate image analysis. In Encyclopedia of Analytical Chemistry: Applications, Theory and Instrumentation; John Wiley & Sons: Hoboken, NJ, USA, 1996. [Google Scholar]
  30. Frosinini, C. Recto and verso, rightwise and leftwise. Drawing 8P in the Uffizi Gallery: In search of the meaning. In Leonardo in Vinci: At the Origins of the Genius, Catalogue of the Exhibition Held at the Museo Leonardiano, Vinci, Italy; Barsanti, R., Ed.; Giunti: Milano, Italy, 2019. [Google Scholar]
  31. Montalbano, L. Inks, metal points, chalks and “pastels”. An analysis of Leonardo’s drawing from a technical-scientific point of view. In Leonardo in Vinci: At the Origins of the Genius, Catalogue of the Exhibition Held at the Museo Leonardiano, Vinci, Italy; Barsanti, R., Ed.; Giunti: Milano, Italy, 2019. [Google Scholar]
  32. Carme Sistach, M.; Gibert, J.M.; Areal, R. Ageing of laboratory irongall inks studied by reflectance spectrometry. Restaurator 1999, 20, 151–166. [Google Scholar] [CrossRef]
  33. Bruni, S.; Caglio, S.; Guglielmi, V.; Poldi, G. The joined use of n.i. spectroscopic analyses–FTIR, Raman, visible reflectance spectrometry and EDXRF–to study drawings and illuminated manuscripts. Appl. Phys. A 2008, 92, 103–108. [Google Scholar] [CrossRef]
  34. Aceto, M.; Calà, E. Analytical evidences of the use of iron-gall ink as a pigment on miniature paintings. Spectrochim. Acta A 2017, 187, 1–8. [Google Scholar] [CrossRef] [PubMed]
  35. Jembrih-Simbürger, D.; Desnica, V.; Schreiner, M.; Thobois, E.; Singer, H.; Bovagnet, K. Micro-XRF analysis of watercolours and ink drawings by Albrecht Dürer in the Albertina in Vienna. Technè 2005, 22, 32–37. [Google Scholar]
  36. Burns, T. The Invention of Pastel Painting; Archetype: London, UK, 2007. [Google Scholar]
  37. Hunter, D. Papermaking: The History and Technique of an Ancient Craft; Dover Publications: New York, NY, USA, 1978. [Google Scholar]
  38. Thibault, X.; Bloch, J.F. Structural analysis by X-ray microtomography of a strained nonwoven papermaker felt. Text. Res. J. 2002, 72, 480–485. [Google Scholar] [CrossRef]
  39. Bloom, J.M. Papermaking: The historical diffusion of an ancient technique. In Mobilities of Knowledge; Jöns, H., Meusburger, P., Heffernan, M., Eds.; Springer: Cham, Switzerland, 2017; pp. 51–66. [Google Scholar]
  40. Frosinini, C. Carte lucide nella trattistica d’arte e nelle fonti. In Carte Lucide e Carte Trasparenti Nella Pratica Artistica tra Otto e Novecento: Uso, Conservazione e Restauro, Proceedings of Convegno Internazionale di Studio, Tortona, Italy, 3–4 October 2014; Scotti Tosini, A., Ed.; Fondazione Cassa di Risparmio di Tortona: Torona, Italy; Associazione Pellizza da Volpedo ONLUS: Volpedo, Italy; Opificio delle Pietre Dure: Firenze, Italy, 2016; pp. 14–28. [Google Scholar]
  41. Da Vinci, L. Libro di Pittura; Pedretti, C., Ed.; Giunti: Firenze, Italy, 1995. [Google Scholar]
  42. Meder, J. The Master of Drawing, Winslow Ames; Abaris Books, Inc.: New York, NY, USA, 1978. [Google Scholar]
Figure 1. Leonardo da Vinci, Landscape, 1473, Firenze, Gallerie degli Uffizi, Gabinetto dei Disegni e delle Stampe, inv. 8 P, size 194 × 285 mm, drawing on paper. RGB images of the recto (a) and the verso (b) acquired via multispectral scanner. The black dashed rectangles highlight the mirrored left-handed (i) and the right-handed (ii) writings magnified below. Region (i) is shown as it is and flipped horizontally (central image) to facilitate the reading of the inscription.
Applsci 11 07995 g001
Figure 2. Traditional false-color and trichromatic RGB PC processing reveals the presence of the underdrawing in lead stylus on the recto. (a) White dashed rectangles on the RGB image indicate the regions where the preliminary sketch was observed. NRG-FC at 1292 nm (b,d) and PC-FC (c,e) images offer a clearer outline of the sketches made with the metal point.
Applsci 11 07995 g002
Figure 3. (a) NIR image at 1600 nm showing the absorbing properties of the sketch drawn with one of the two inks; magnified detail of the fortress in the NIR (b) and RGB (c) images; (d) reflectance spectra of the ink in three different points indicated by the red, blue, and black circles in (c).
Applsci 11 07995 g003
Figure 4. Multispectral analysis of the verso: (a) NRG-FC image at 950 nm evidencing the lampblack pastel drawing (greenish to the eye) and the dark details redefined with iron-gall ink (white dashed rectangles indicating the regions magnified in (c,d); (b) NIR image at 1600 nm; (c,d) Details of the FC-PC image (PC1-3) showing the sketches of male figures in brown ink appearing light blue, and the bust of a female figure in hematite appearing yellow (c); geometric studies in lead point, appearing bluish (d).
Applsci 11 07995 g004
Figure 5. Visualization of the preparatory grid (yellow lines) in the micrometric topographic map (19 × 28 cm) rendered as an image (a) and in the NIR image at 1292 nm (b). The magnification of the region (19 × 9 cm) highlighted by the white dashed rectangle allows for a clearer identification of the drawn grid lines (pointed out by the yellow arrows in (c,d)), as well as the fine horizontal laid lines (red arrows in (c)) impressed in the paper by the felt.
Applsci 11 07995 g005
Figure 6. Topographic map of the drawing superimposed on the recto RGB image acquired with the multispectral scanner. The area highlighted by the dashed rectangle (7 × 11 cm) (a) is magnified in (b); the white arrows indicate the incisions profiling the main elements in the foreground, attributed to the method of transferring the sketch with the use of transparent paper.
Applsci 11 07995 g006
Figure 7. OCT analysis of the blind traits in the background. (a) RGB image detail showing the region of interest (ROI, black rectangle); (b) topographic map superimposed on the RGB image showing the magnified ROI (the white square showing the area measured with OCT); (c) tomocube of the circular impression—light blue rectangle highlighting the position of the z-y section reported below.
Applsci 11 07995 g007
Publisher’s Note: MDPI stays neutral with regard to jurisdictional claims in published maps and institutional affiliations.

