Article

Dense Robust 3D Reconstruction and Measurement for 3D Printing Process Based on Vision

1
School of Mechanical Engineering, Yangzhou Polytechnic College, Yangzhou 225009, China
2
School of Automation, Harbin University of Science and Technology, Harbin 150080, China
3
Robotics & ITS Engineering Research Center, Harbin University of Science and Technology, Harbin 150080, China
*
Author to whom correspondence should be addressed.
Appl. Sci. 2021, 11(17), 7961; https://doi.org/10.3390/app11177961
Submission received: 22 July 2021 / Revised: 25 August 2021 / Accepted: 25 August 2021 / Published: 28 August 2021
(This article belongs to the Topic Additive Manufacturing)

Abstract

:
The 3D printing process lacks real-time inspection, which is still an open-loop manufacturing process, and the molding accuracy is low. Based on the 3D reconstruction theory of machine vision, in order to meet the applicability requirements of 3D printing process detection, a matching fusion method is proposed. The fast nearest neighbor (FNN) method is used to search matching point pairs. The matching point information of FFT-SIFT algorithm based on fast Fourier transform is superimposed with the matching point information of AKAZE algorithm, and then fused to obtain more dense feature point matching information and rich edge feature information. Combining incremental SFM algorithm with global SFM algorithm, an integrated SFM sparse point cloud reconstruction method is developed. The dense point cloud is reconstructed by PMVs algorithm, the point cloud model is meshed by Delaunay triangulation, and then the accurate 3D reconstruction model is obtained by texture mapping. The experimental results show that compared with the classical SIFT algorithm, the speed of feature extraction is increased by 25.0%, the number of feature matching is increased by 72%, and the relative error of 3D reconstruction results is about 0.014%, which is close to the theoretical error.

1. Introduction

The emerging additive manufacturing methods represented by 3D printing have changed the traditional manufacturing mode [1,2,3]. 3D printing has the advantages of rapid prototyping, simple use, low cost, and high material utilization [4,5,6]. Due to the limitations of the process and the structure of the molding equipment, 3D printing manufacturing is still an open-loop manufacturing in essence. The parts model is uploaded to the printing device, and the tolerance of the structure cannot be measured during the printing process, leading to the failure of closed-loop control in the manufacturing process and the difficulty of guaranteeing the forming accuracy. At present, the research on the 3D printing molding accuracy mainly focuses on the model design in the early stage of printing [7,8], such as model improvement [9,10], optimization of printing path [11,12], and so on. Therefore, it is of great practical significance to carry out the real-time detection of printing parts process precision and realize the process precision control.
Existing detection methods for 3D printing process parts mainly use indirect detection. For example, the fused deposition modeling process can indirectly reflect defects by detecting the working current change of wire feeding motor, transmission mechanism tension, and other indicators, and detect specific defects of specific 3D printing structure through CT and X-ray [13,14]. However, the printing process is affected by many factors, and these methods have limitations in application. Obviously, the panoramic 3D information of the structure surface in the 3D printing process can better reflect the quality of the printed structure. Compared with the existing panoramic 3D reconstruction methods, the monocular vision 3D reconstruction method based on structure motion recovery (SFM) is suitable for 3D detection in the 3D printing process because of its low cost, simple structure and high reconstruction accuracy [15,16].The process of 3D reconstruction based on SFM generally includes image acquisition preprocessing, feature point extraction and matching, 3D sparse point cloud densification and surface texture reconstruction. The extraction and matching of feature points is the key of reconstruction, which determines the final accuracy of 3D reconstruction. The classic algorithm for feature point extraction is the SIFT algorithm [17], which has good robustness and stability when dealing with the change of image scale and image rotation, but involves a large amount of computation and has low efficiency. The SURF algorithm solves the shortcomings of SIFT algorithm, such as high computational complexity and long time-consuming, and improves the speed of feature extraction [18], but it is inferior to SIFT in the robustness of illumination and deformation. The KAZE algorithm is the most effective feature point extraction algorithm in recent years [19]; its efficiency is similar to that of SIFT algorithm, and its stability is better than the SIFT, but its scale robustness is not as good as the SIFT. Most of the 3D printed parts are of single color, and require high robustness and accuracy in the printing process detection, so the existing feature extraction algorithms are not fully applicable. The key to solve this problem is to improve the speed of feature extraction and acquire as many feature points as possible, especially to preserve the edge feature information. The generation methods of sparse point cloud mainly include the incremental SFM method and global SFM method [20,21]. The reconstruction accuracy of incremental SFM is higher, but it is greatly affected by initialization, and it is easy to accumulate errors with the reconstruction process, especially when the motion trajectory of the image collected by the camera is in loop state. The global SFM method is less affected by the initial model, less affected by drift and faster in reconstruction, but sensitive to noise.
Based on the structure of CoreXY 3D printing device, this paper adopts 3D detection of 3D printing process based on vision. By analyzing the technical requirements of visual inspection in 3D printing process, an FFT-SIFT-AKAZE algorithm is proposed, which combines the optimized SIFT algorithm [22] with the accelerated KAZE algorithm (AKAZE) [23] to solve the problem of edge information instability. In order to improve the robustness of 3D reconstruction, an Integrated SFM 3D reconstruction scheme is proposed to achieve robust, fast and accurate 3D reconstruction. The research laid a foundation for online quality monitoring and control of 3D printing process.

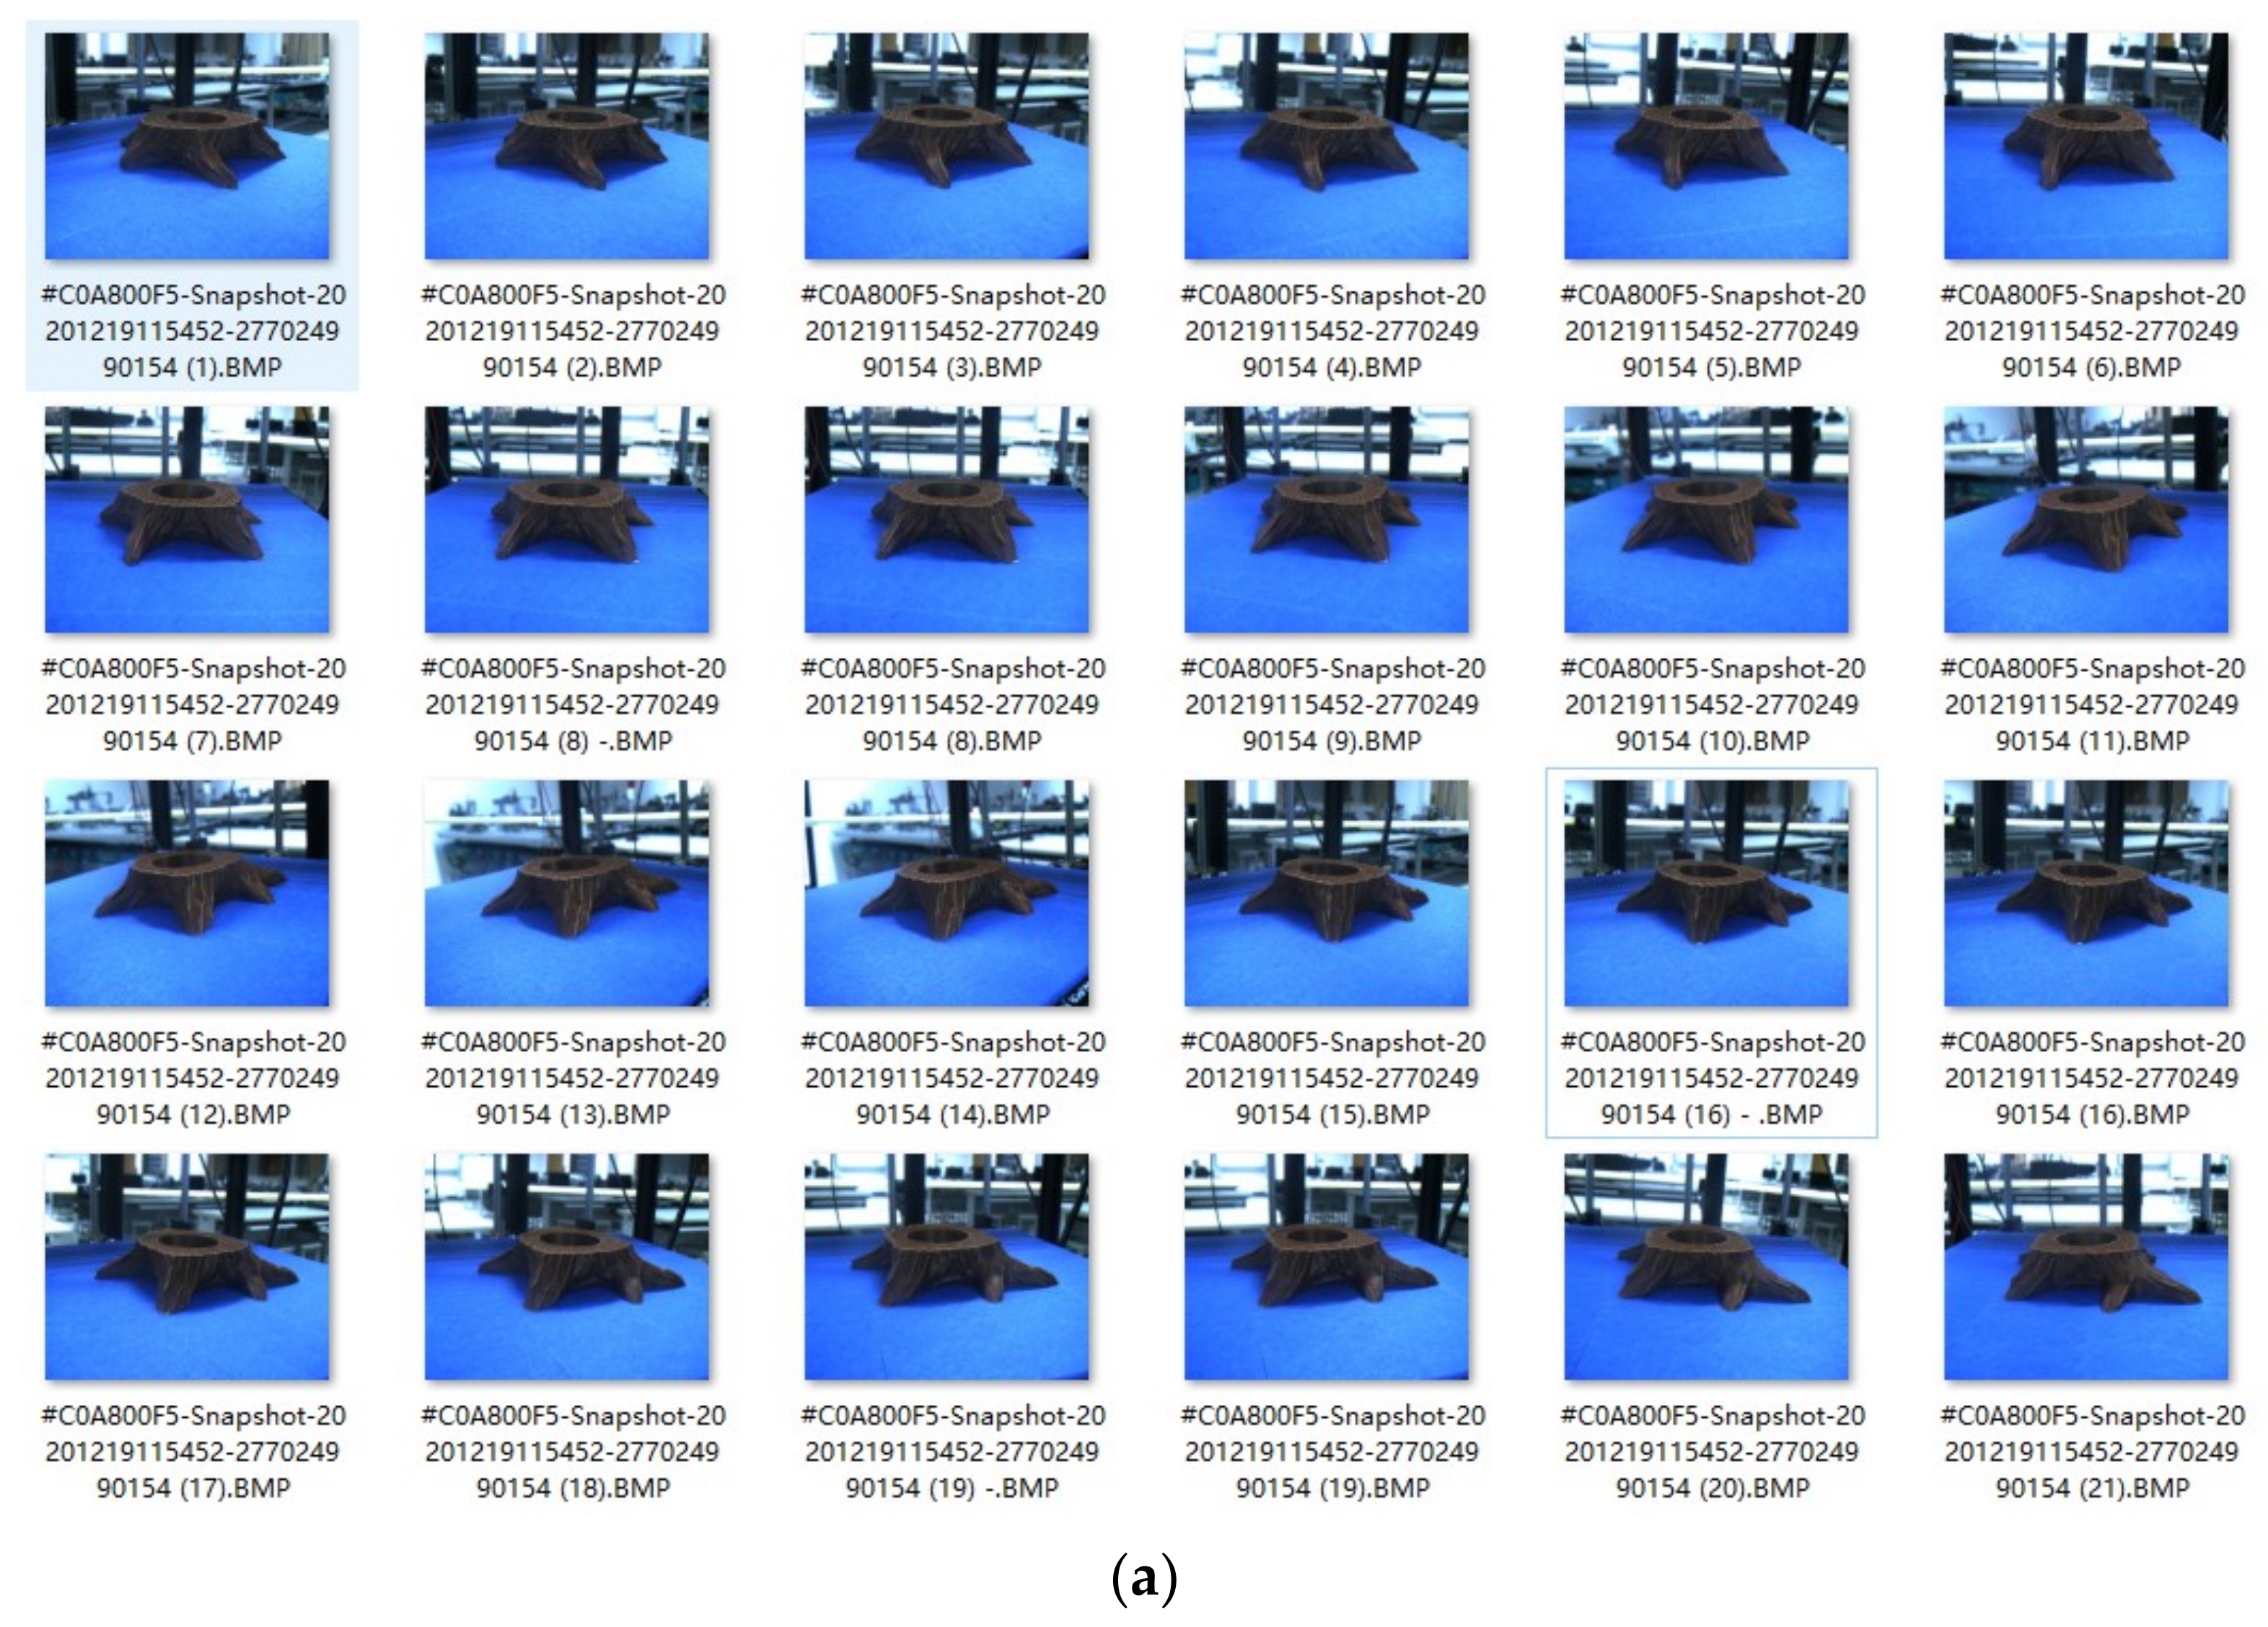
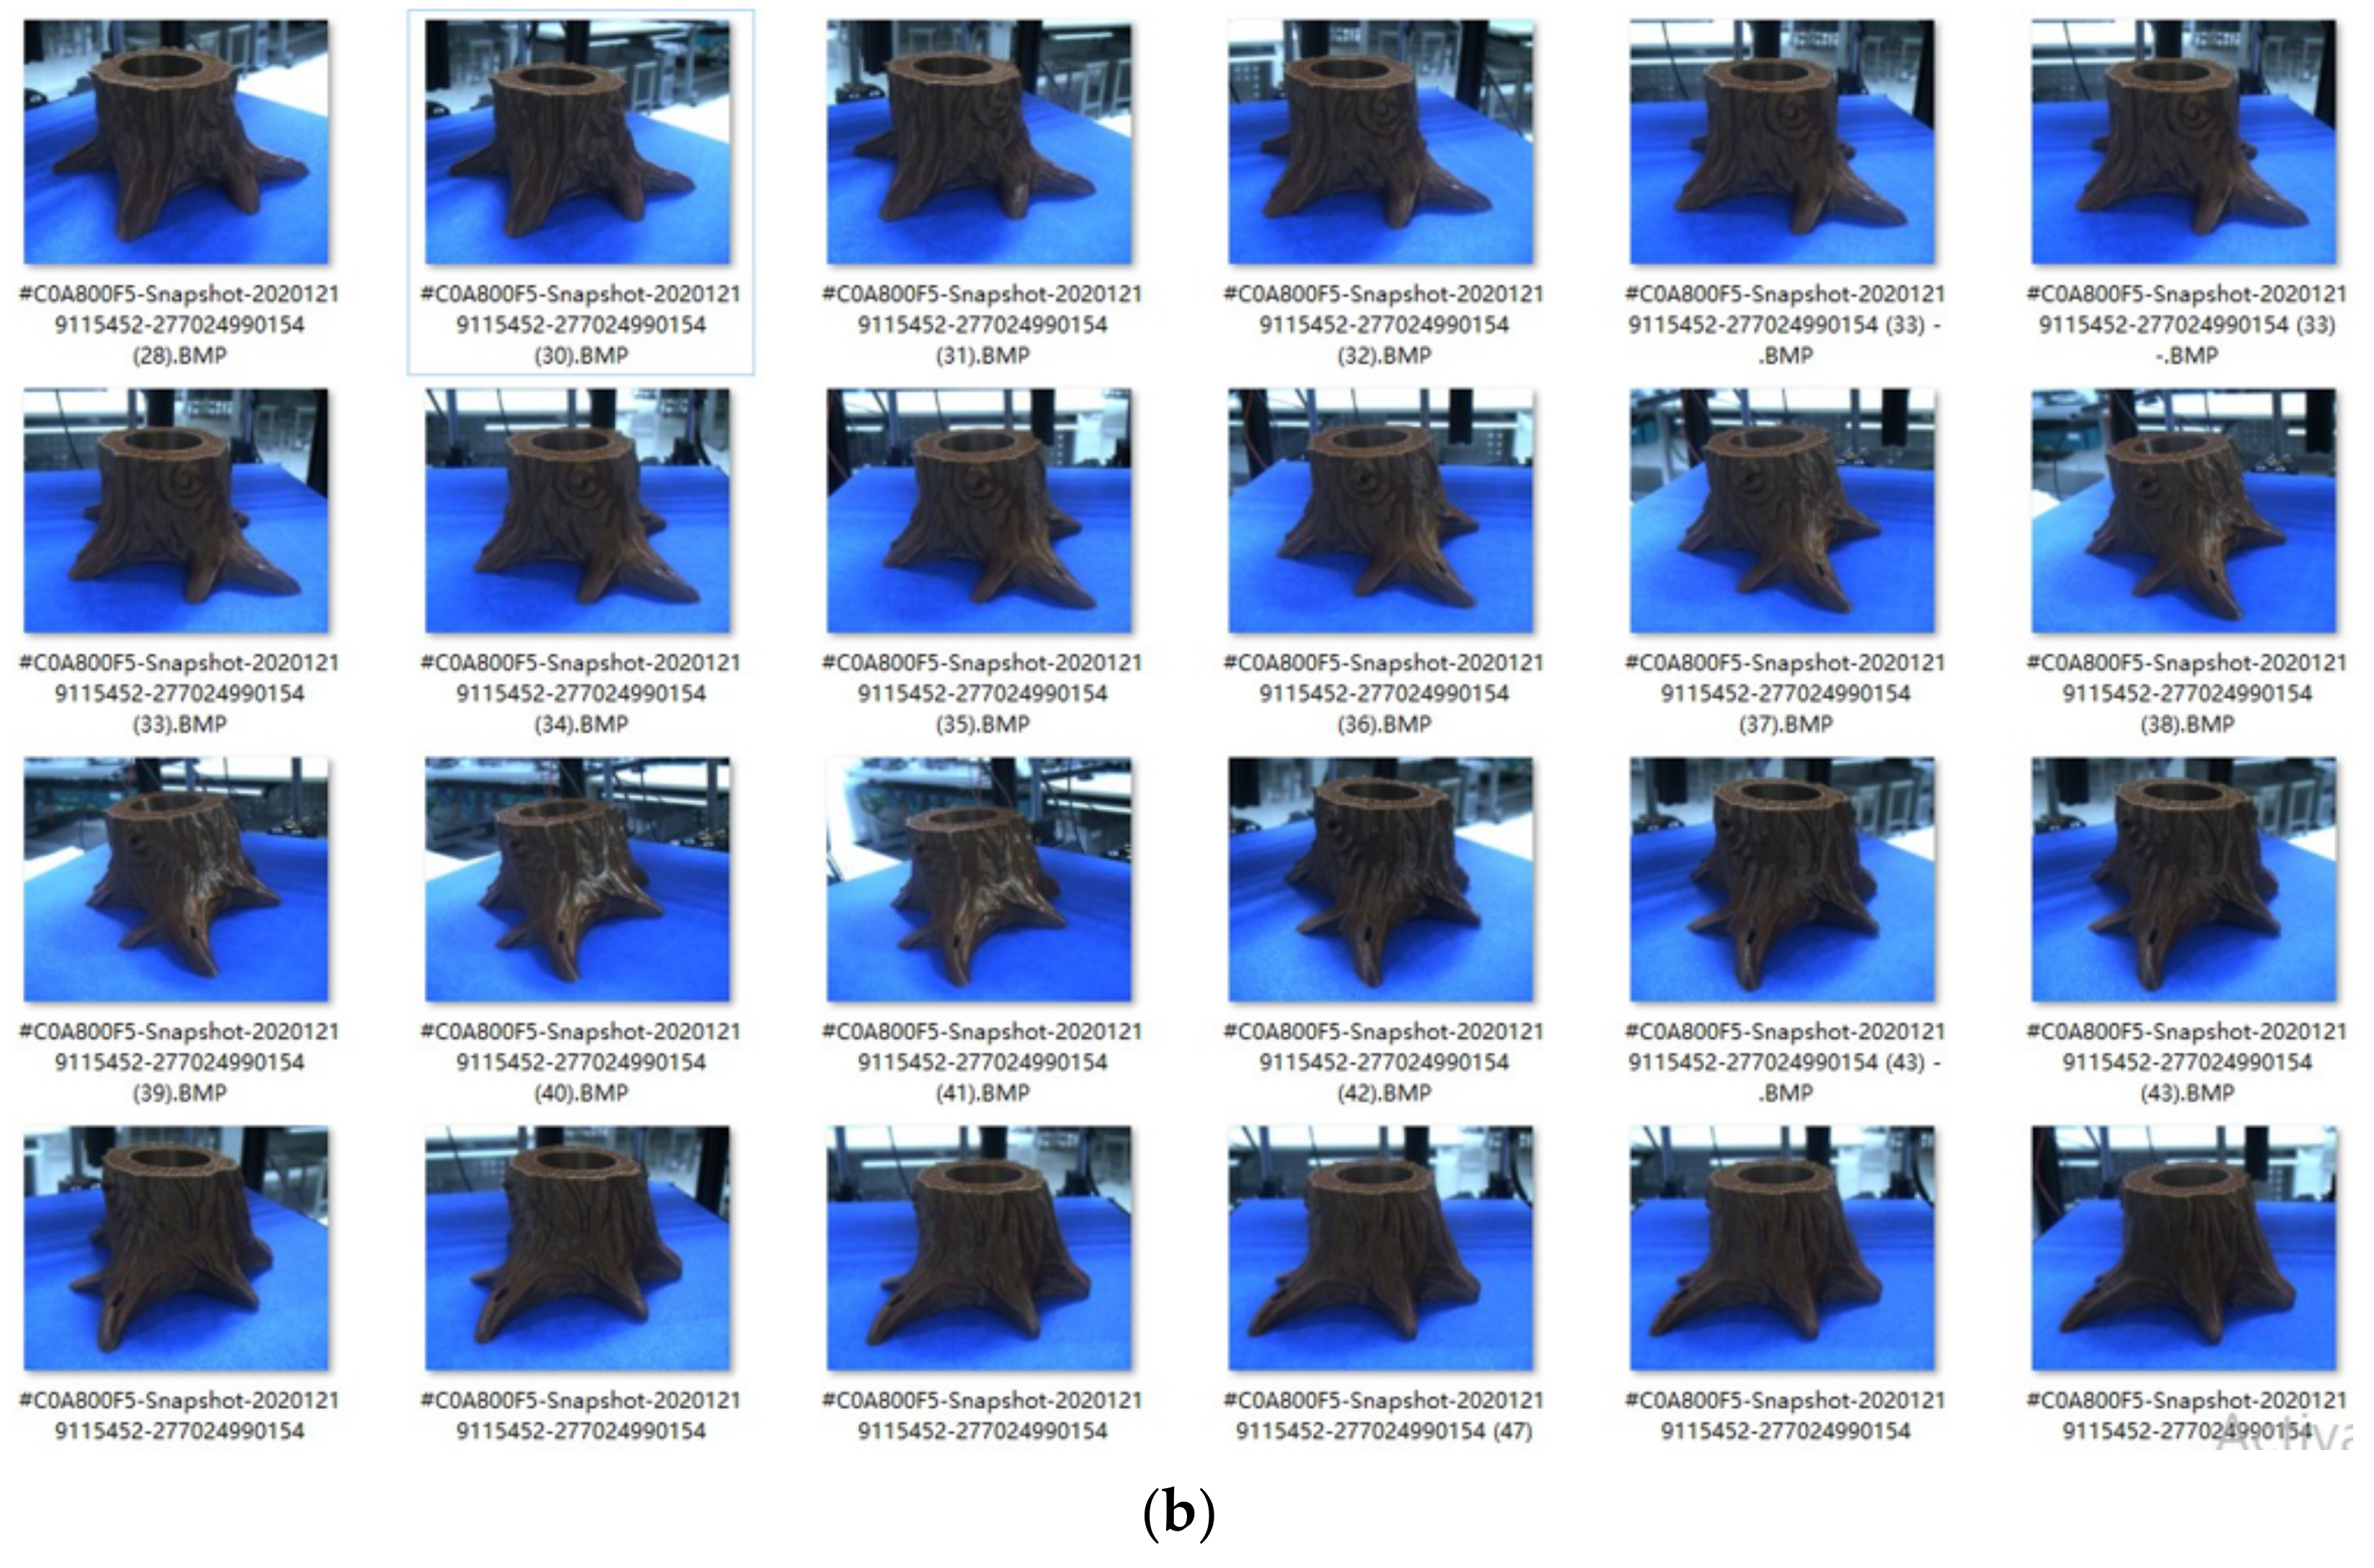
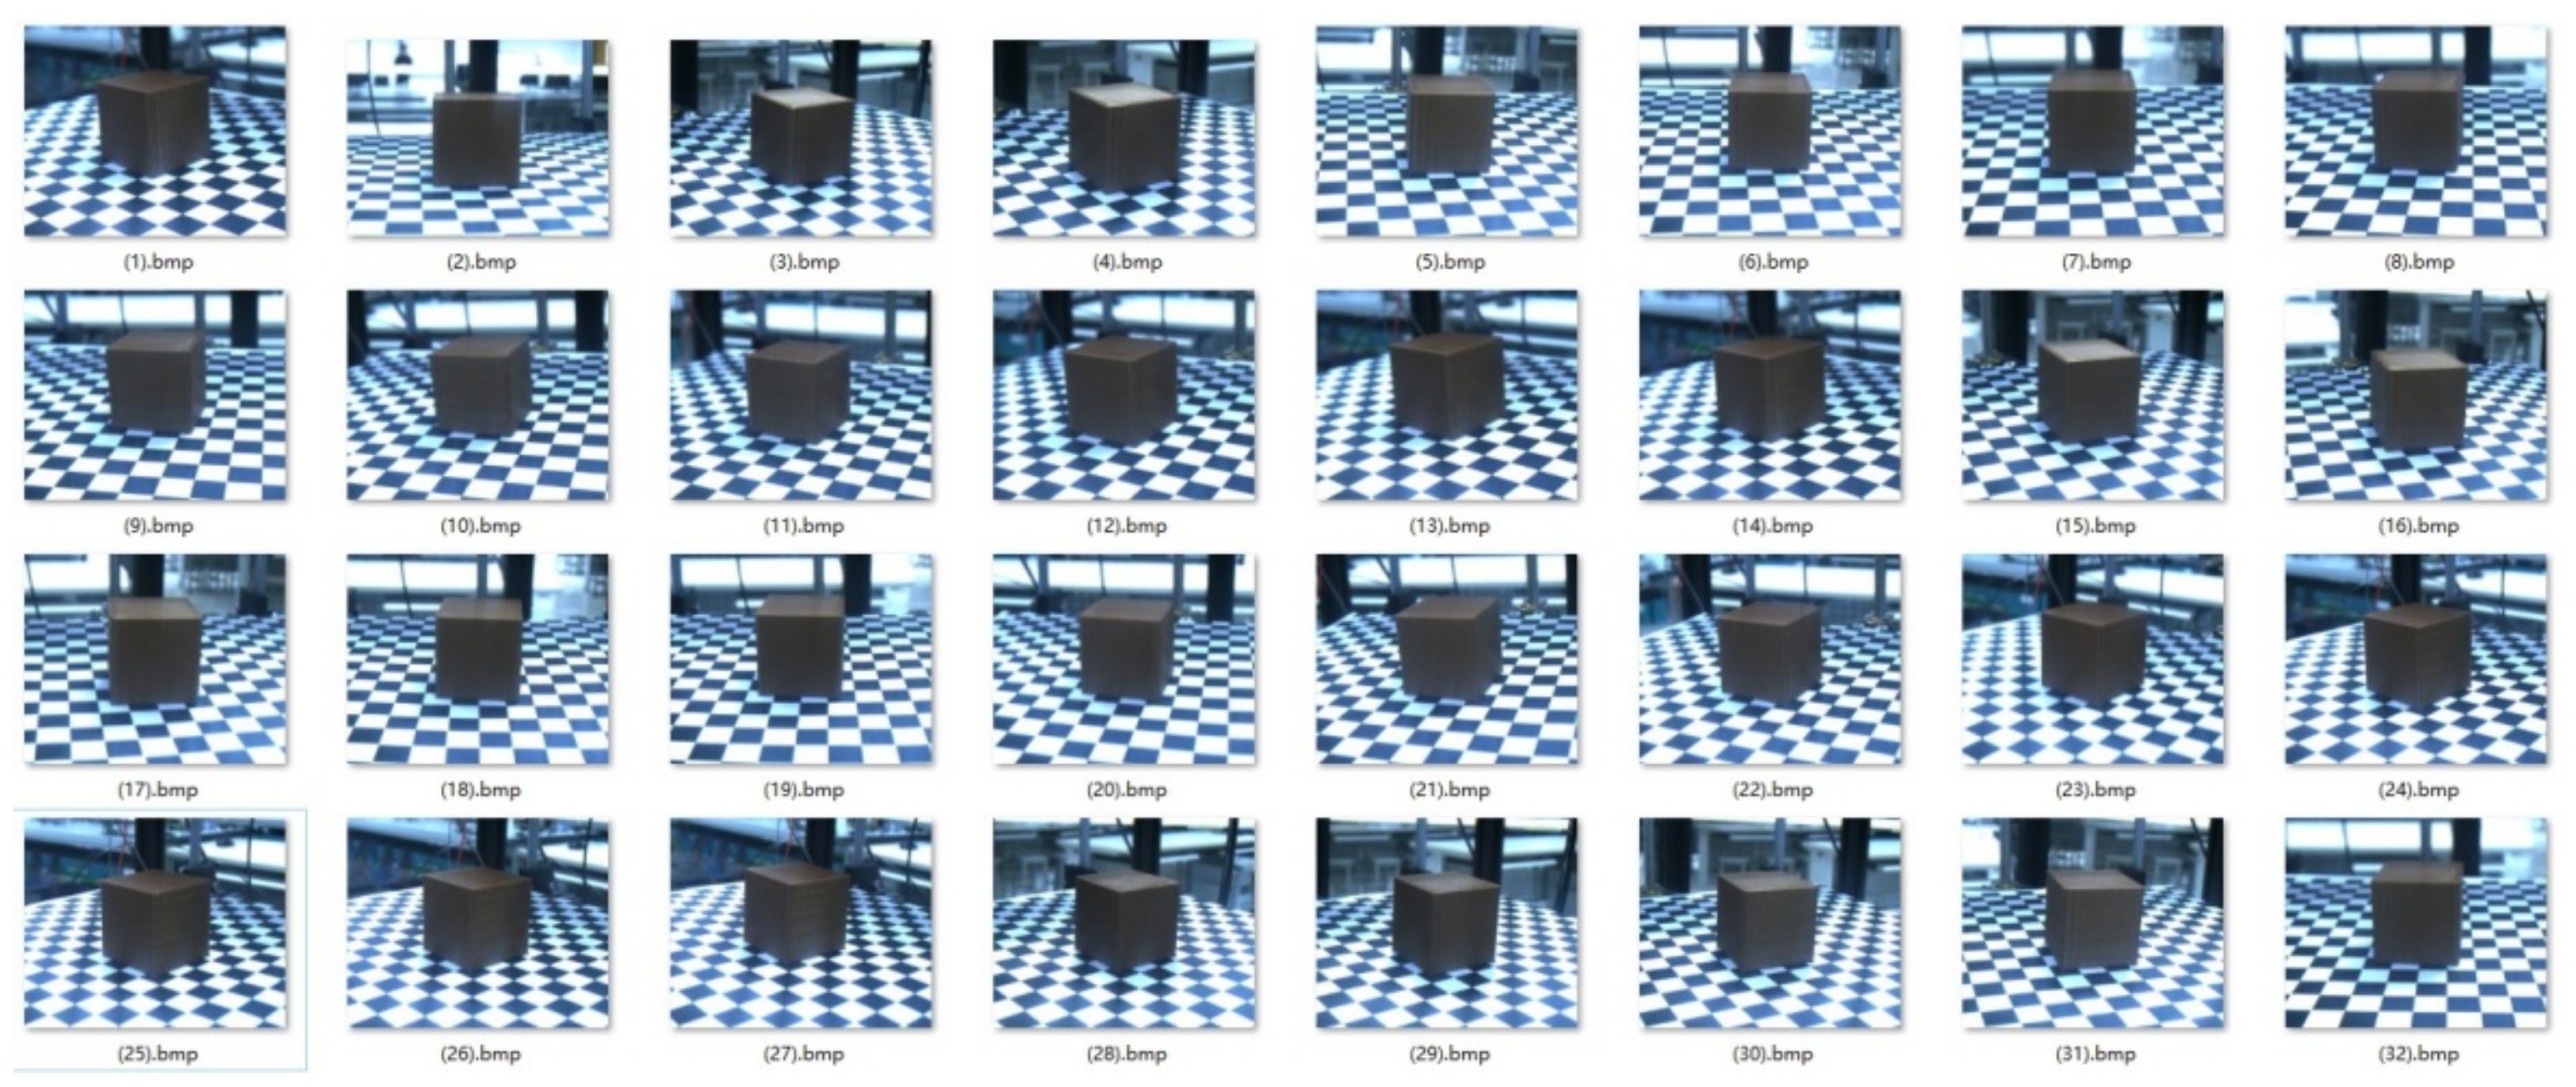
2. Image Acquisition and Preprocessing in 3D Printing Process

The vision detection device designed based on CORXY-3D printing device is shown in Figure 1, where (a) is the mechanism diagram of the detection device, and (b) is the physical diagram of the image acquisition device. The camera P is placed in a circular orbit with O as the origin. There are two coordinate systems in the figure. The O-XYZ is the coordinate system of the 3D printing platform, and the geometric center of the platform is set as the origin point, that is, the center point O of the printer frame square A1A2A3A4. The x-axis is parallel to edge A1A2, and the y-axis is on the same line with the center perpendicular of edge A1A2. O-XYZ′ is the coordinate system of the image acquisition target. Let the origin O′ be a point on the axis of the camera lens, and the two origins O and O′ are coaxial. Let OD = R, O′P = L, and the height from the camera to the printer platform is S1. Let the value of the coordinate of O′ in the coordinate system O-XYZ be (x′,y′,z′), and the perpendicular line of QD is extended through the point O′ to intersect at a point D on QD. It can be obtained by Pythagorean theorem:
O P 2 = O D 2 + D P 2
and we can get the following equation:
L 2 = ( R X ) 2 + Y 2 + ( S 1 z ) 2
According to the above formula, the camera height S1 can be solved as follows:
S 1 = z ± L 2 ( R X ) 2 Y 2
It can be seen from Figure 1a that the camera rotates around the Corexy printer on the ring track for image acquisition. If the camera angle is not changed during the shooting process, the height of any point on the ring is required to remain unchanged to ensure that the camera axis intersects at the same point. The designed machine vision detection system can change the field of view by adjusting the shooting angle of the camera in the vertical direction and the position of the camera in the circular orbit. The view position of the single camera in the process of motion is set to avoid the view occlusion of the detection device to the test structure, and then complete the collection of sequence images. When the image is collected, the printing platform is lowered to a certain distance so that the camera can sample the image around the 3D printed part. After the image is collected, it needs to be preprocessed, including image enhancement processing and image filtering.

3. The Matching Method Based on the FFT-SIFT-AKAZE

When the computer recognizes the image, the point with feature information is extracted as feature point. In the reconstruction of 3D finished parts, multi-angle shooting is required. In order to obtain more stable feature point information, the SIFT algorithm is preferred to extract feature points. However, the SIFT algorithm consumes a long time in constructing Gaussian pyramid, and the reconstruction of the system itself has certain real-time requirements. Secondly, the SIFT algorithm uses linear Gaussian filter to make the image smooth as a whole when constructing scale space, which cannot well retain the contour and texture information, and 3D print made from a single color, which often leads to insufficient feature point extraction. Therefore, the FFT-SIFT algorithm based on fast Fourier transform and the accelerated KAZE algorithm (AKAZE) are proposed to fuse the matching points after feature extraction, so as to obtain more abundant matching information of feature points.

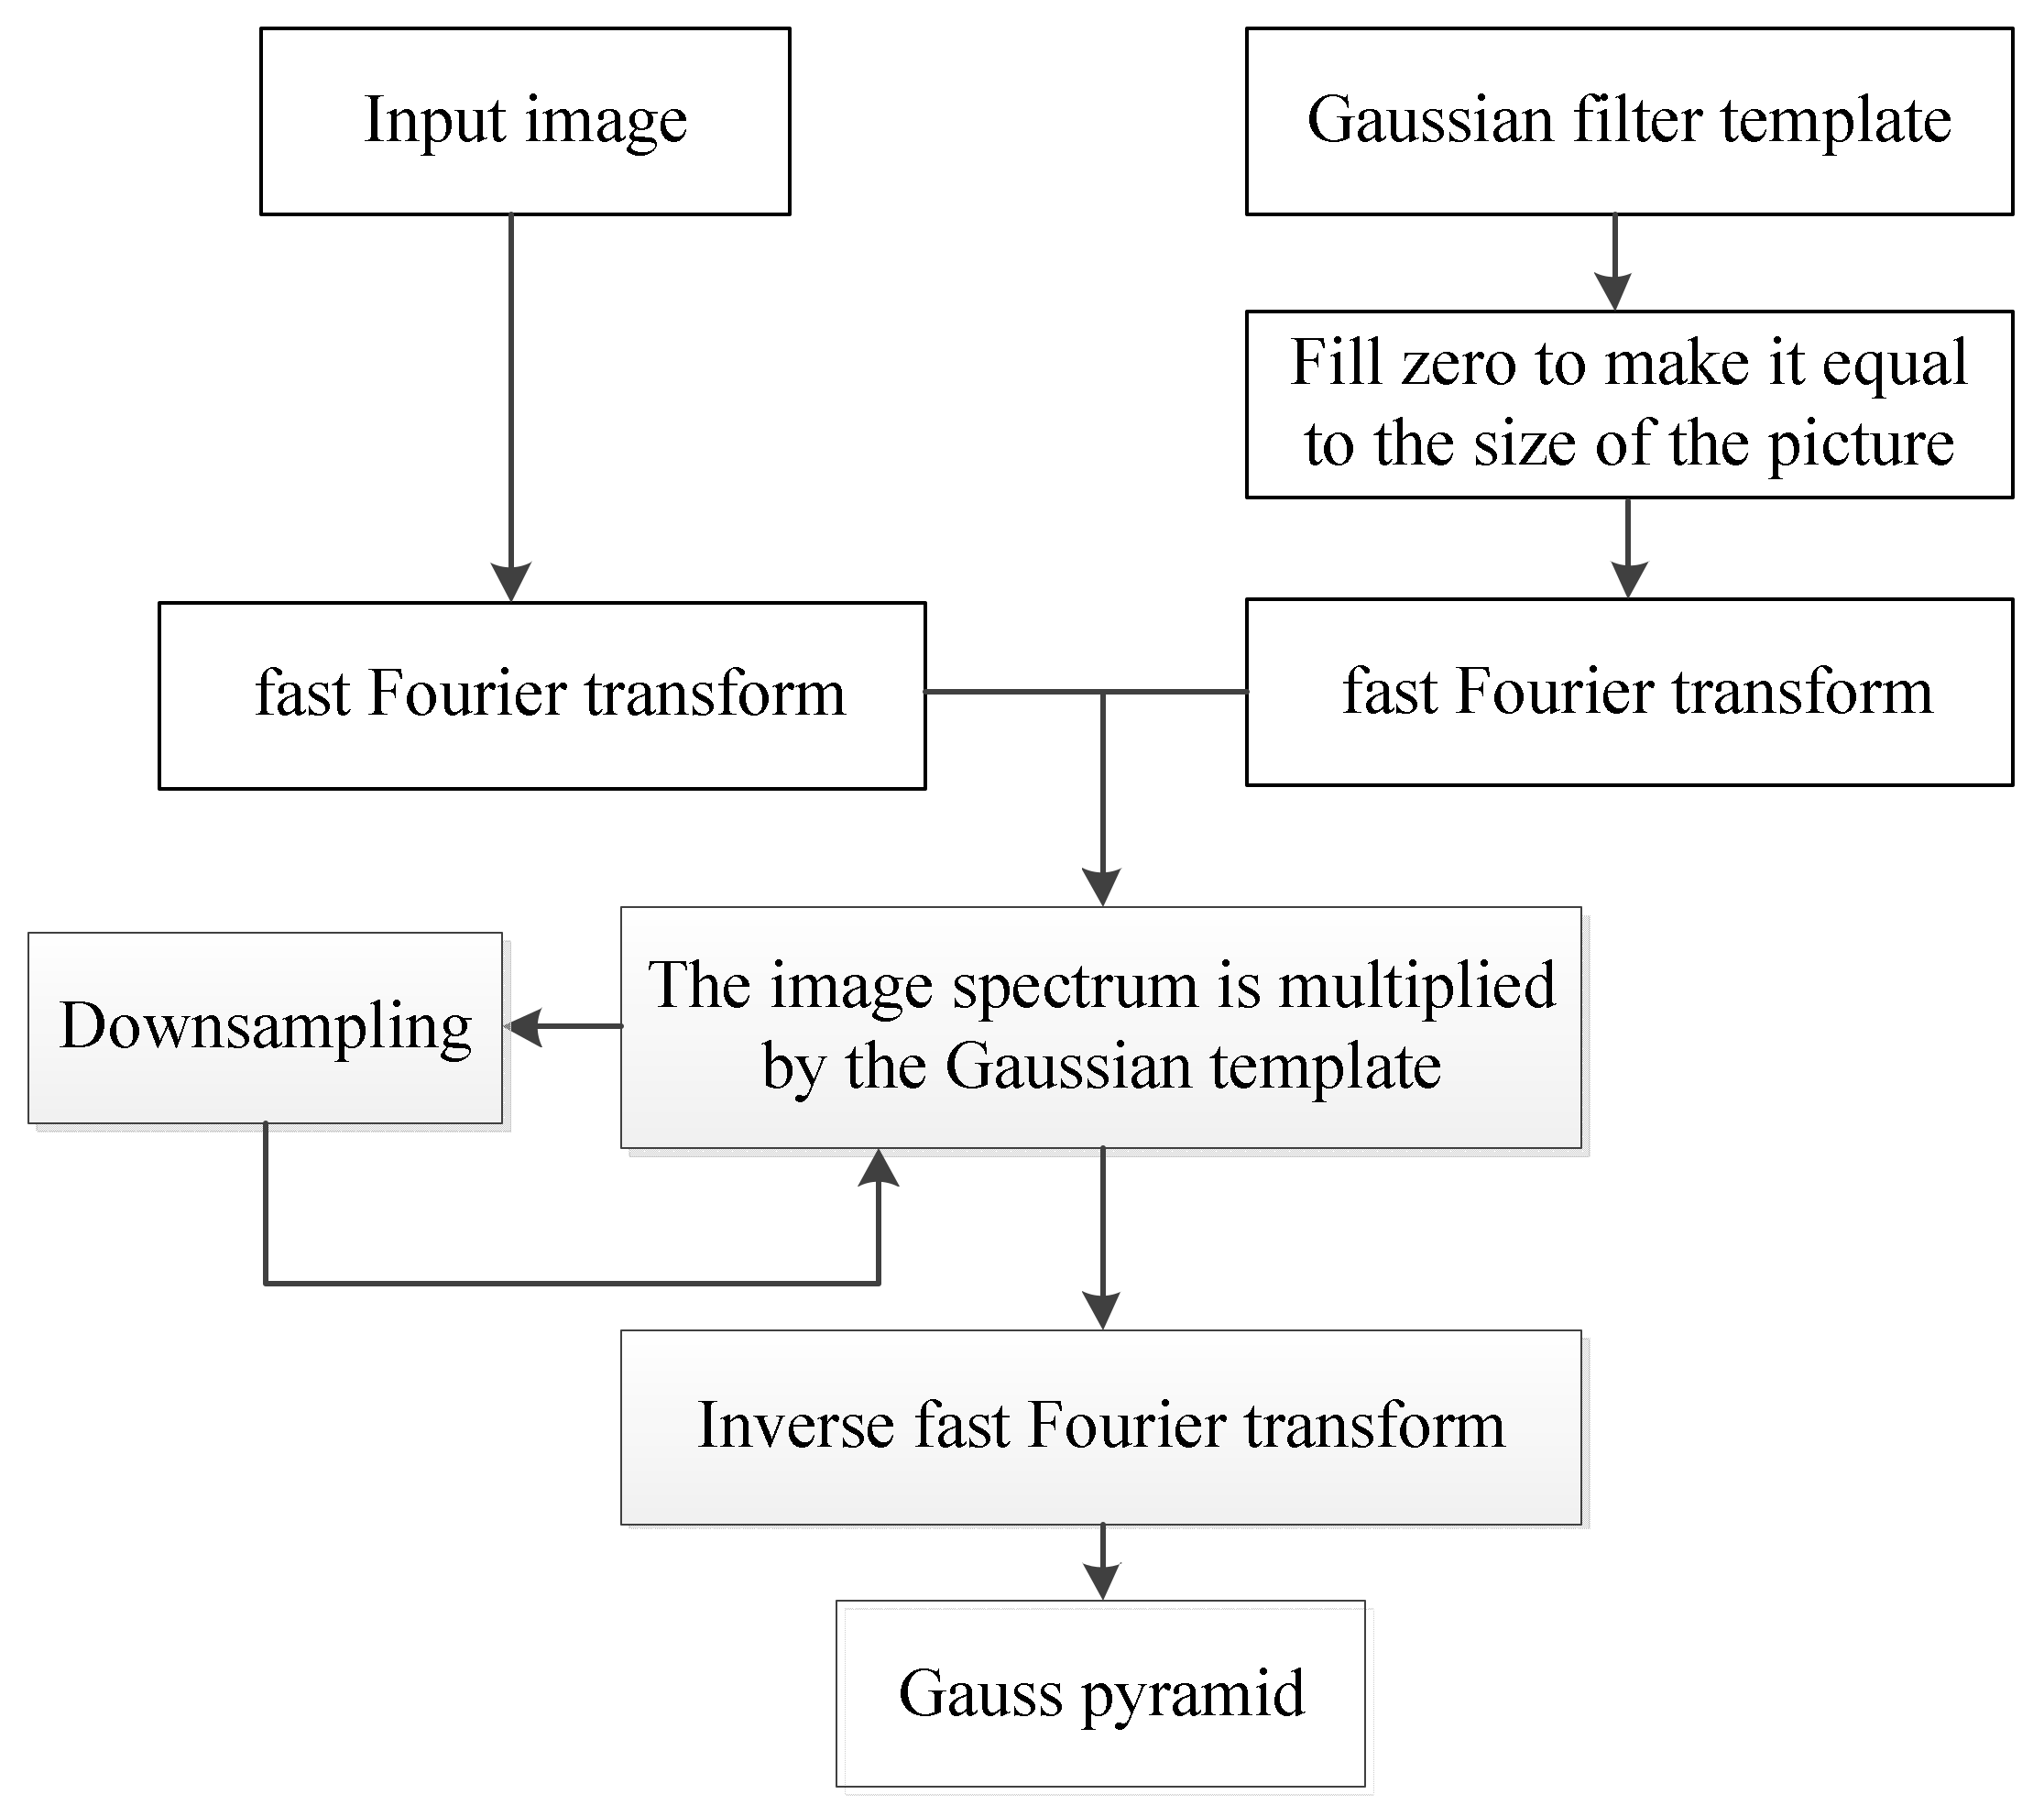
3.1. Improved SIFT Algorithm Based on Fast Fourier Transform (FFT-SIFT)

The traditional SIFT algorithm has four steps, which are constructing scale space to detect extreme points, the accurate positioning of the key points, determining direction parameters of key points, and generating descriptor of feature points. The process of constructing scale space occupies 72.85% of the time. Therefore, accelerating the construction of the Gaussian pyramid is the key to solving the above-mentioned problems.
The literature [22] theoretically proposed that the fast Fourier transform algorithm should be applied to the construction of the Gaussian pyramid to accelerate the process of convolution between the image and the Gaussian filter template, realize the rapid construction of the scale space, and then improve the feature extraction speed of the whole SIFT algorithm. The improved Gaussian pyramid creation process using FFT is shown in Figure 2.
The DoG (Difference of Gaussians) pyramid creation has three operations: image amplification, image smoothing using Gaussian convolution, and image down sampling [22]. A set of images with different scales can be obtained by convolution the image in the original SIFT algorithm. In practice, the last second images of a set of images is down sampling to become be the first image of the next set of images, and then produce the image of the O (Octave) group S (Level) layer by analogy. In the image Pyramid, images of two adjacent scale space are subtracted to form the DoG pyramid.
In the improved Gaussian pyramid, the input image f(x,y) is firstly transformed into the frequency domain f [u,v] by two-dimensional FFT transform, and then the Gaussian filter template is used to make its size consistent with the image by zero-filling operation, and the FFT transform is also carried out. M and N in the formula represent the two-dimensional sequence length, respectively.
F [ u , v ] = x = 0 M 1 y = 0 N 1 f [ x , y ] e j 2 π u M x e j 2 π v N y
f [ x , y ] = 1 M N u = 0 M 1 v = 0 N 1 F [ u , v ] e j 2 π u M x e j 2 π v N y
According to the convolution theorem, the scale space is constructed by multiplying the initial image in the frequency domain with the Gaussian template after FFT transformation. After convolution with Gaussian template, it is necessary to downsampling the image to create different groups of Gaussian pyramid. The third layer from the bottom of each group is downsampling as the first picture of the next group. Similarly, desampling can be achieved in the frequency domain by superposition of spectral signals according to the convolution theorem. The superimposed down-sampling signal is:
V ( k ) = 1 2 X k 2 + X k + N 2
where X(k) is the spectrum of the original image, and V(k) is the spectrum of the sampled signal of length N. Finally, the processed image is transformed into Gaussian pyramid by inverse FFT, and the subsequent operation is similar to the traditional SIFT. In theory, the reconstruction of the Gaussian pyramid based on FFT can significantly speed up the construction speed of the pyramid, and then the speed of the whole feature point extraction can be improved.

3.2. Feature Extraction Based on AKAZE Algorithm

Although the SIFT algorithm has good scale rotation invariance and robustness, the core of the algorithm is the scale space constructed by Gaussian filtering template with different scale parameters. Such linear filtering method will blur the whole image both in detail information and noise, resulting in the missing of contour information of the image. The accuracy of 3D reconstruction will be affected when it is applied to 3D printed parts. Referring to the reference [23], this paper introduces an accelerated KAZE algorithm, namely AKAZE algorithm. AKAZE realizes Fast Explicit Diffusion (FFD) embedded in the pyramid framework, improves the speed of feature detection in nonlinear scale space, and well preserves the boundary information of the target object. The process of AKAZE algorithm is nonlinear diffusion filtering, construction of nonlinear scale space, and generation of MLDB descriptor.
(1)
The change of image brightness in different scale space can be described by nonlinear diffusion filter, and the divergence factor of flow function is used to control the change of image brightness:
L t = d i v c ( x , y , t ) I
In the formula, the symbol ∇ and div represent the solution of gradient and divergence operation respectively, the L matrix represents the brightness of the image, and the conduction diffusion function is represented by c, so that the image can obtain the diffusion self-adaptability of local structure. The fast display diffusion method FFD is used to accelerate the solution of nonlinear partial differential equations.
(2)
In the process of constructing the nonlinear scale space, the images processed at different levels in each group of AKAZE have the same resolution as the original images. The FED algorithm is used to calculate the nonlinear diffusion image sequence.
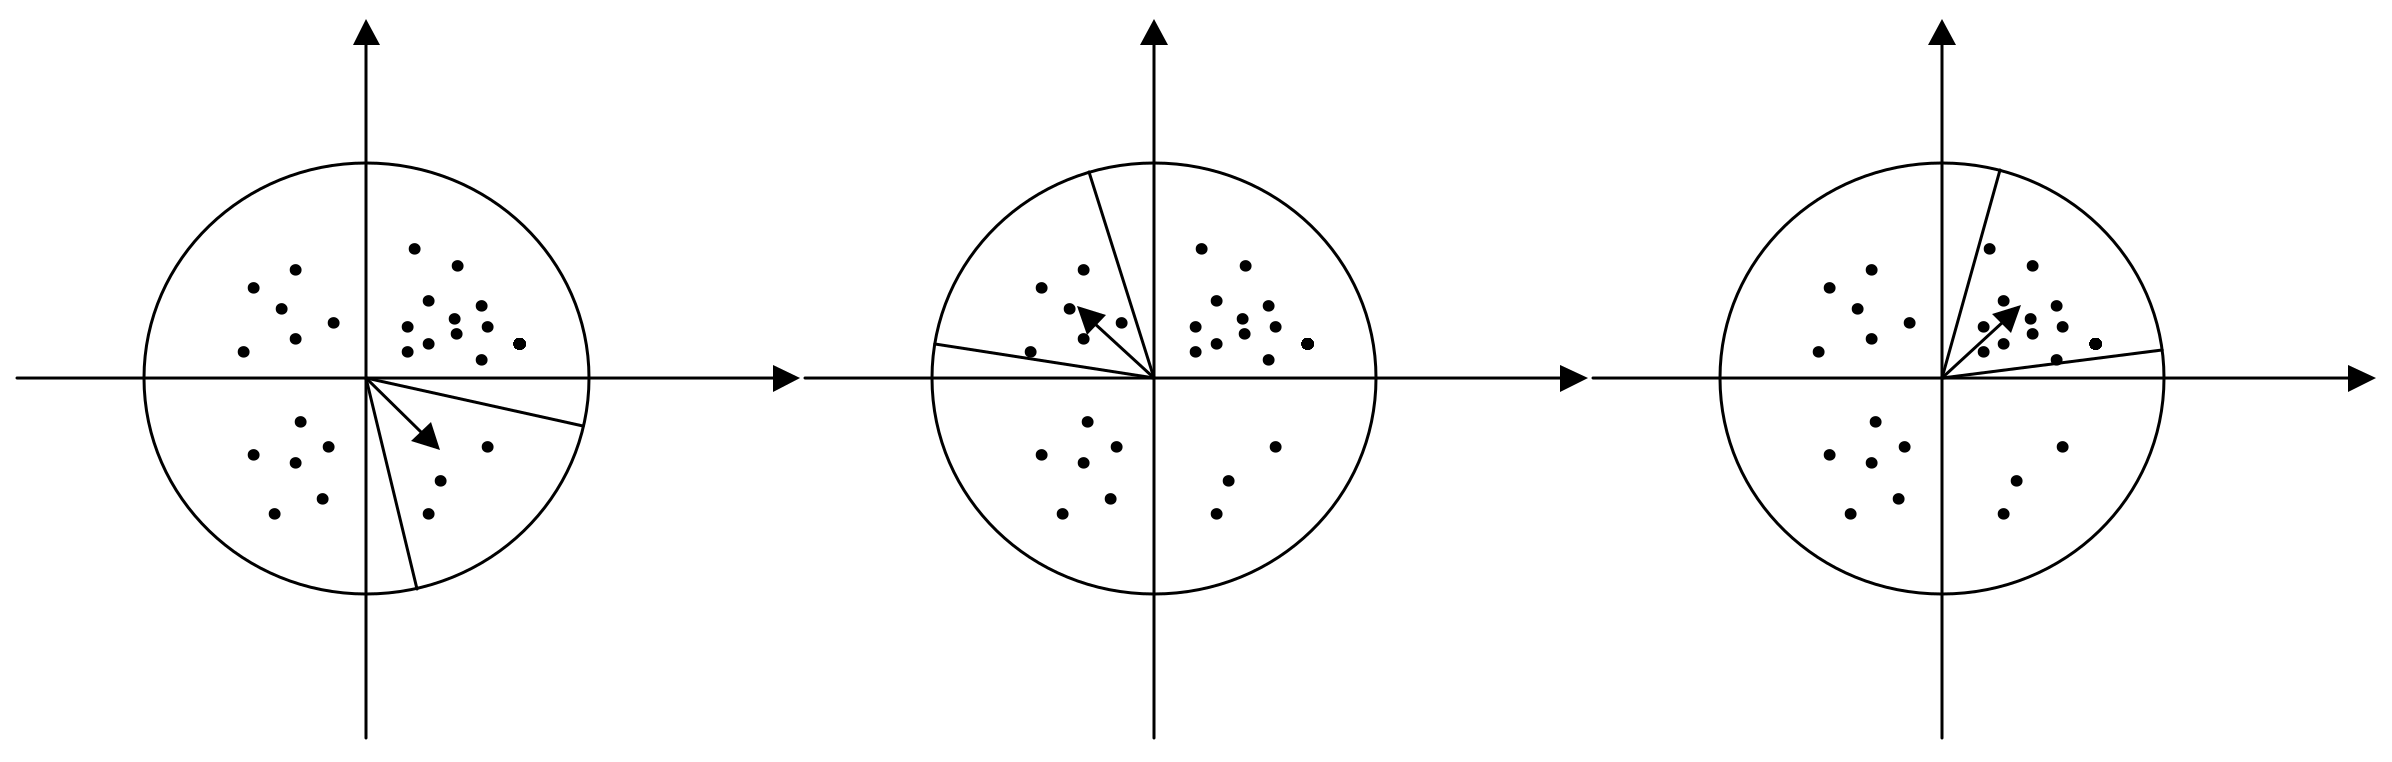
(3)
The generation process of MLDB descriptor is as follows. Firstly, the main direction of the feature point is determined. The feature points centered within the radius of 6σ, the neighborhood of the point at which a first order differential Lx and Ly are Gaussian weighted. The neighborhood of the feature point is traversed in a 60° sector. Accumulation of all of the weighted vectors will accumulate and the highest fan area direction as the main direction of feature points, as shown in Figure 3. The surrounding area of the feature points in accordance with the grid division, and the main direction of the feature points based on neighborhood rotate operation, after the rotation to interval within the grid resampling discrete point value, and through the calculation of horizontal and vertical direction of the scatter of grey value and gradient values, generate descriptor with rotation invariance.

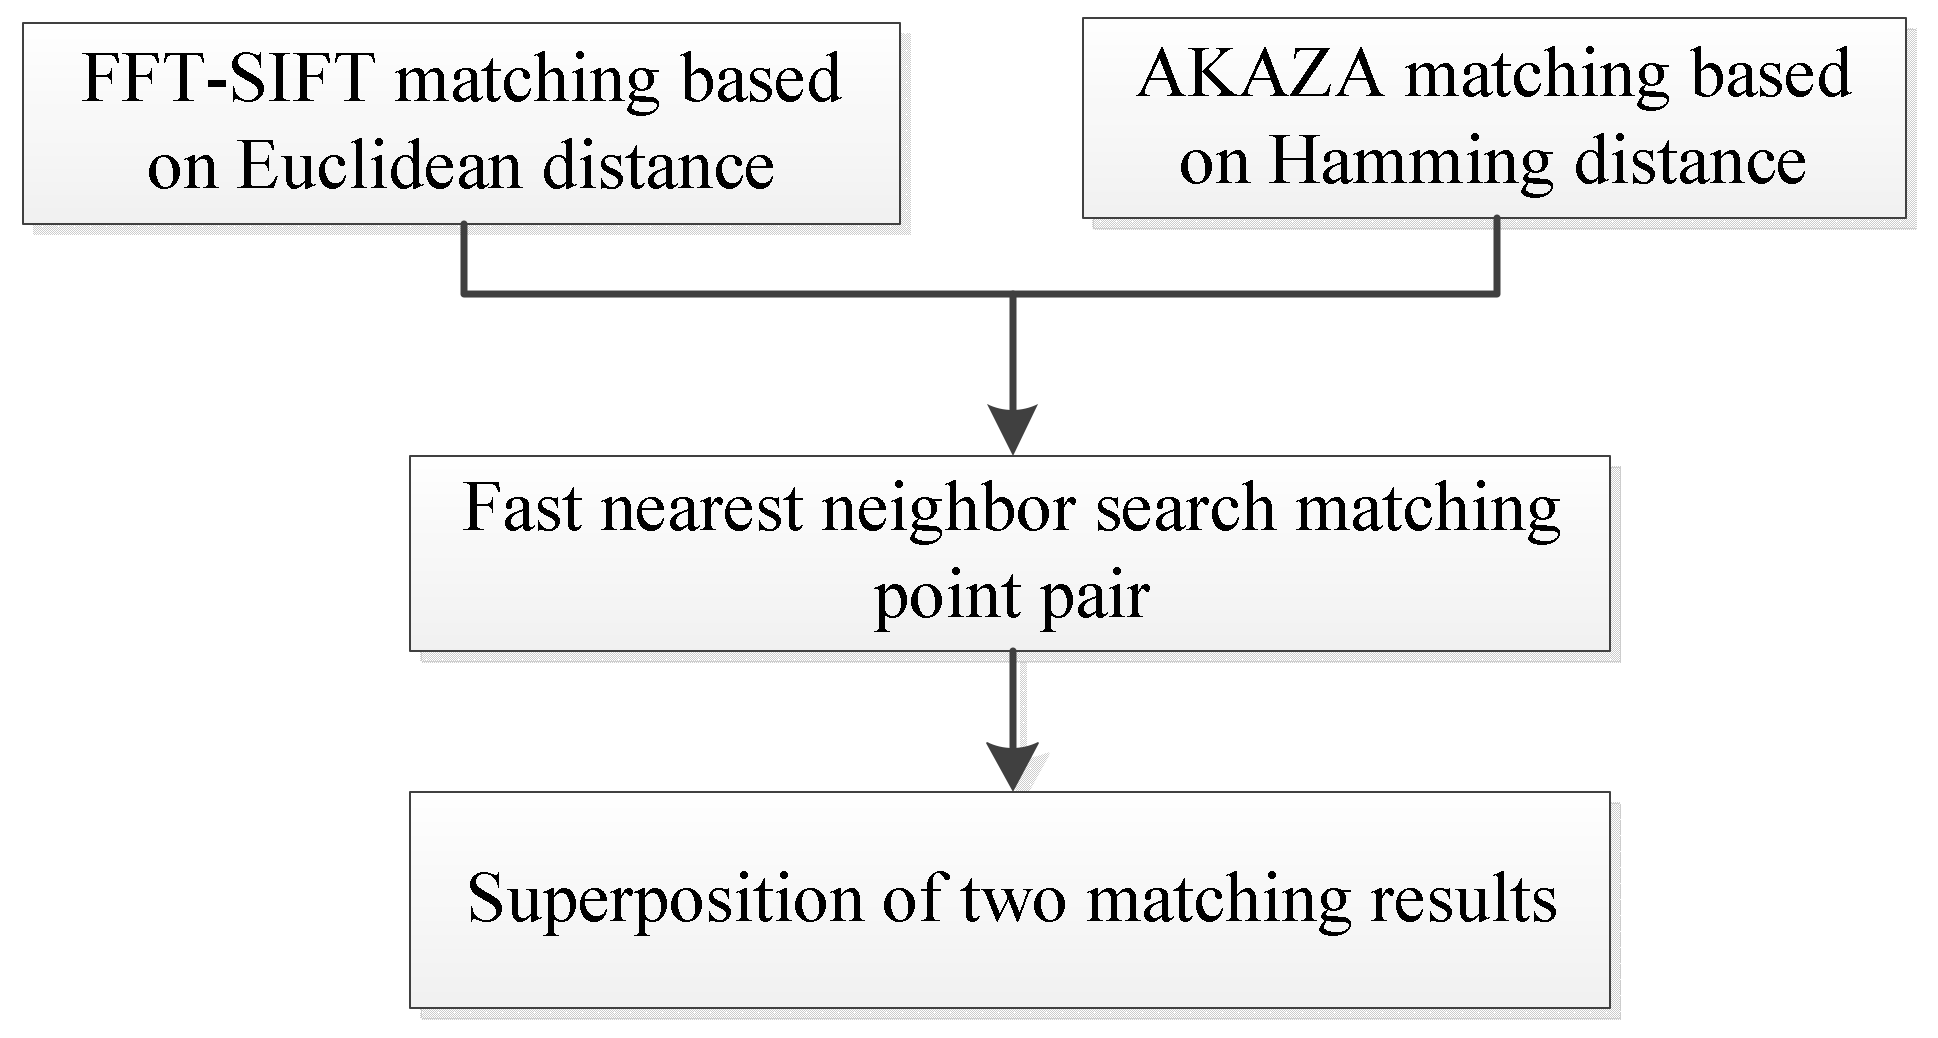
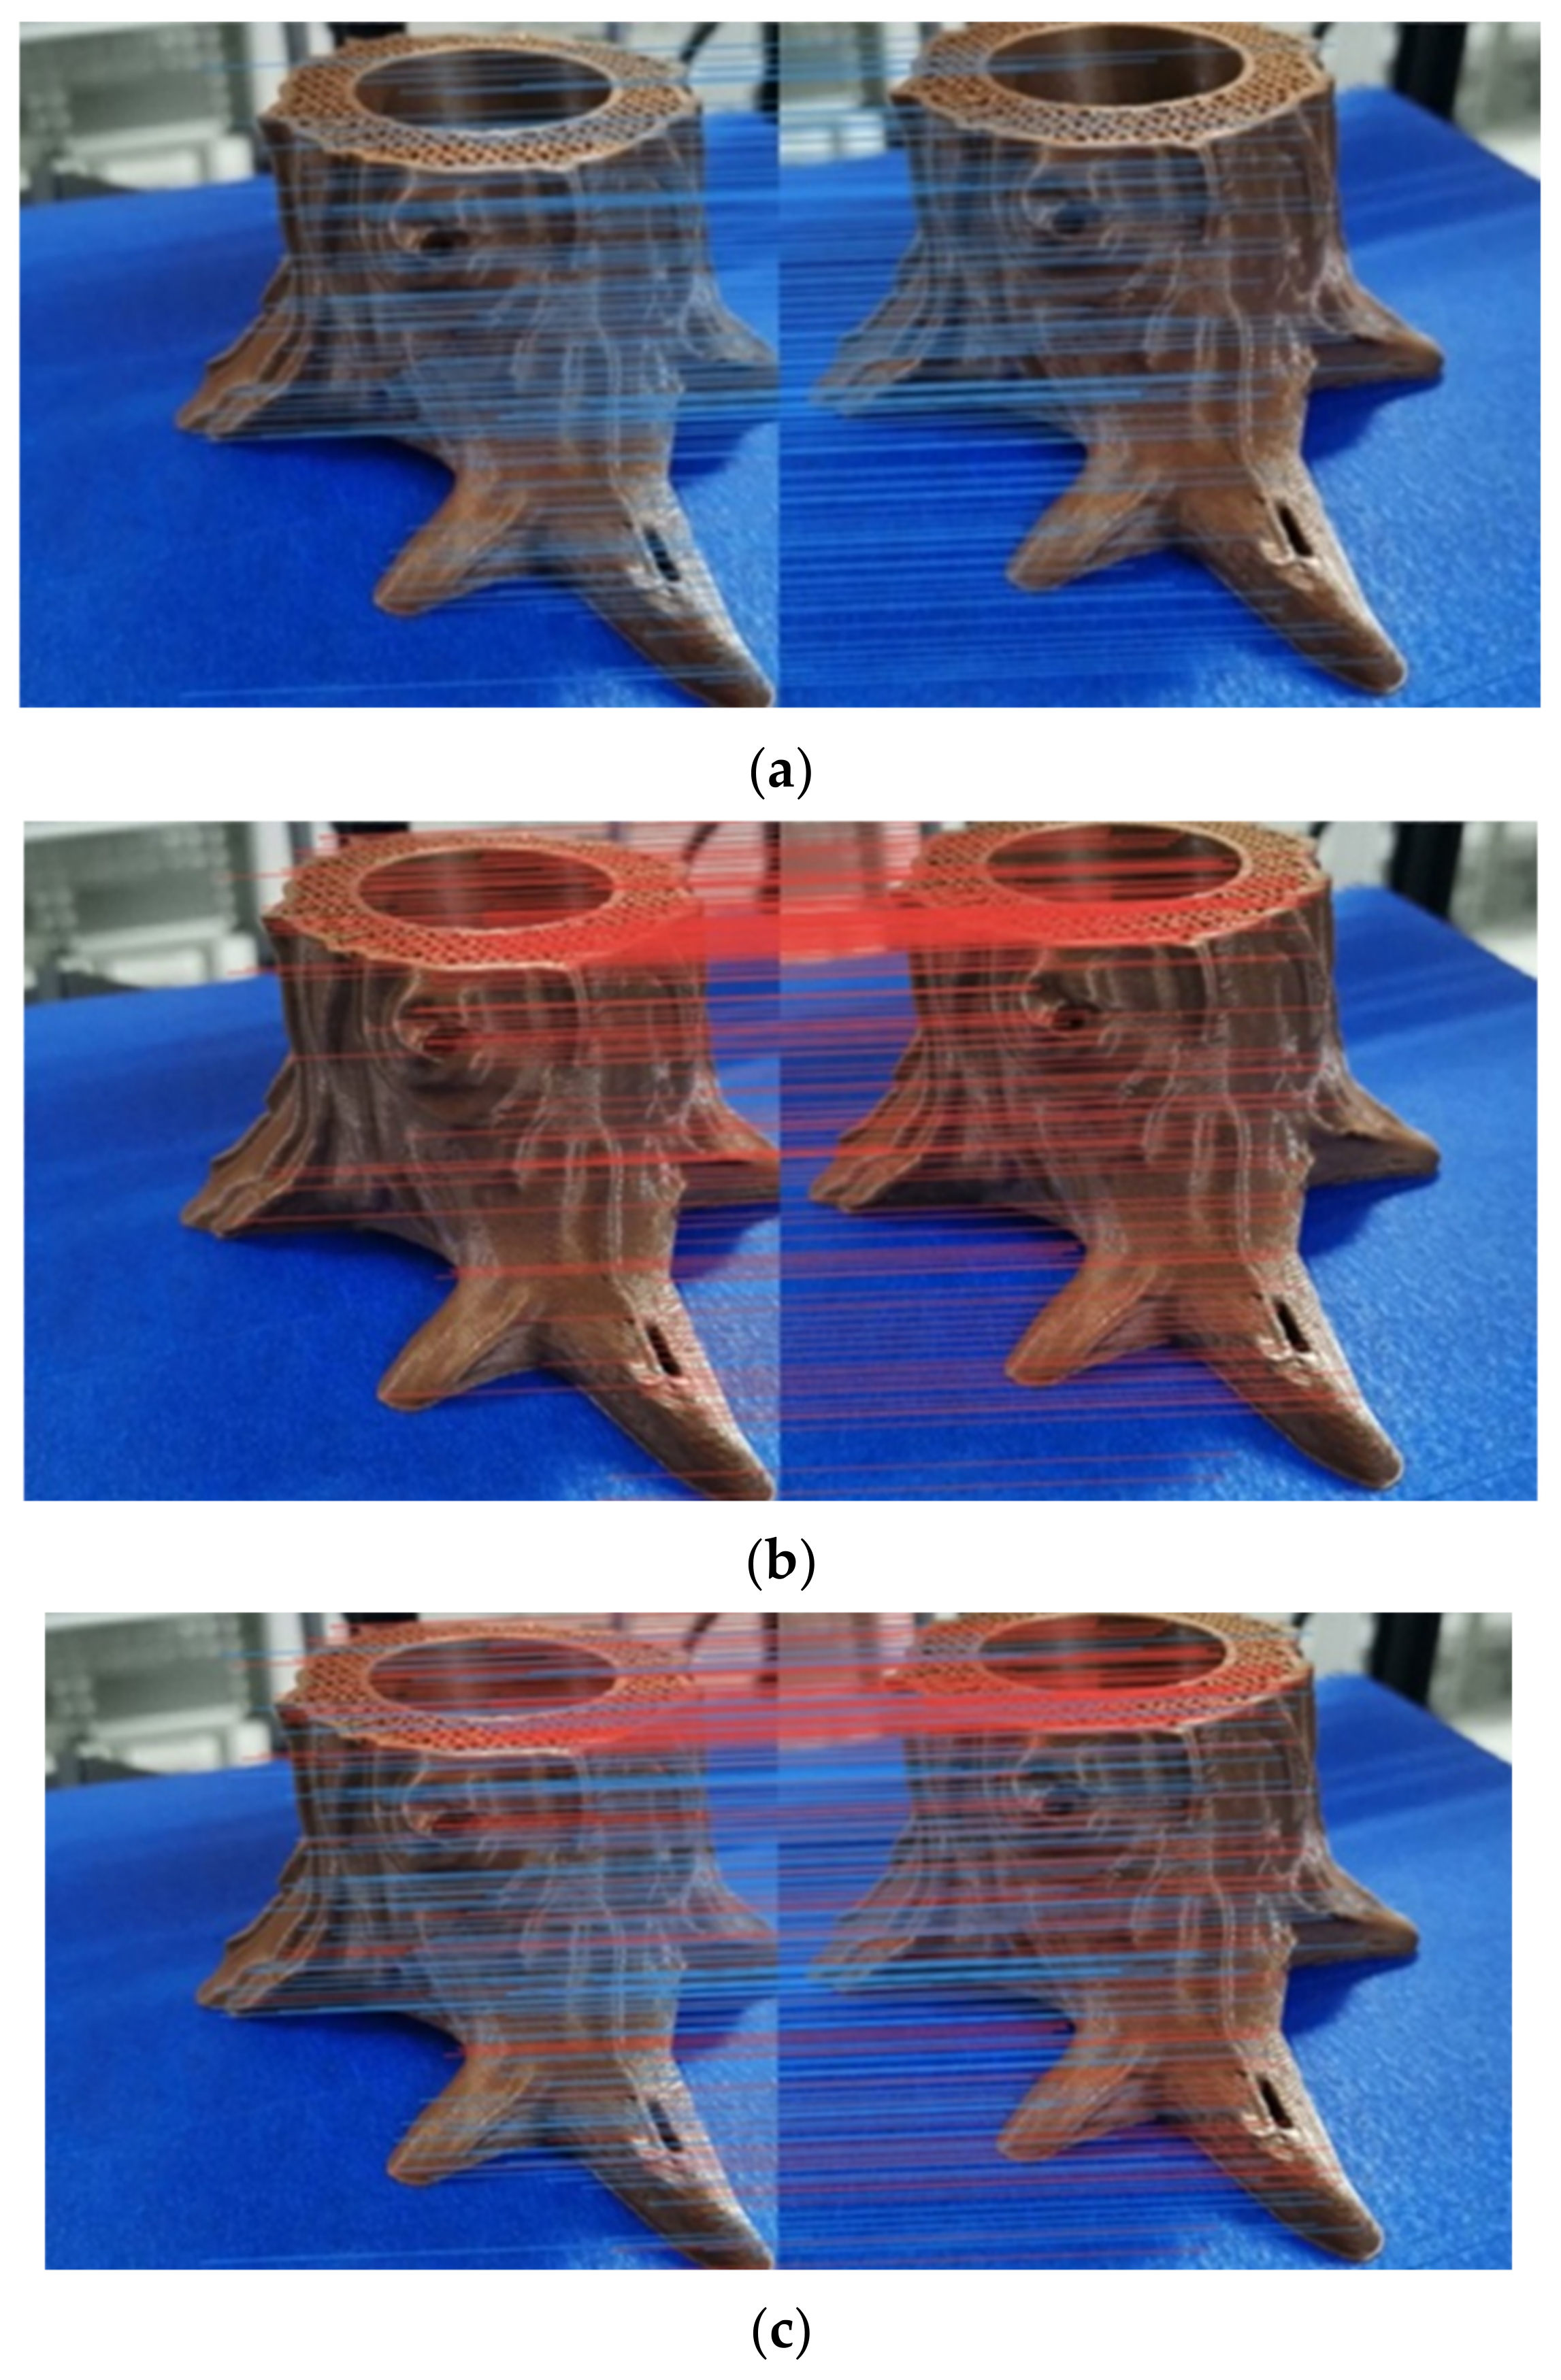
3.3. Strategy and Method of FFT-SIFT-AKAZE Feature Matching

The method flow of FFT-SIFT-AKAZE feature matching is presented in Figure 4:
In the feature matching stage, when SIFT feature matching is used, it is assumed that the i-th descriptor of the first graph R is set to Ri = (ri1, ri2, …, ri128), and the descriptor of the other graph S is Si = (si1, si2, …, si128). Finally, the two images are matched according to the similarity of the descriptor of the feature vector. The expression of the matching similarity parameter is as follows:
d R i , S l = j = 1 128 r i j s i j 2
Find the feature point whose Euclidean distance is minimum from the descriptor of the first graph R, and then take the next closest feature point. If the ratio of the two is smaller than the set threshold value, it is determined as a pair of feature points. AKAZE descriptors are stored in binary mode, so it is only necessary to calculate the Hamming distance between the two descriptors to judge the similarity between the two feature descriptors, as shown below:
D ham ( v , u ) = i = 1 n v i u i
where the vi and the ui represent the vectors of two descriptors respectively. The distance of binary descriptors can be calculated only by XOR operation. The criterion for judging the success of matching is still the ratio of the nearest neighbor and the next nearest neighbor.
In order to improve the matching speed, this paper uses the fast nearest neighbor search algorithm to search the matching feature points [24]. The coordinates of all feature points are taken as keywords, and different feature points are divided into different spaces according to their positions in the image and stored. A binary Tree KD-tree is constructed, and the balance of the binary Tree is maintained to reduce a lot of meaningless matching time. If the size of the image is n × n, according to the nature of binary tree, the search time complexity in the matching can be reduced to log2n, and the total time complexity can be reduced to O(n log2n). The minimum Euclidean distance of FFT-SIFT feature point and the Hamming distance of AKAZE feature point are selected as the matching result. Then, the two kinds of matching points are superimposed and fused to obtain more matching point information. Since the feature extraction algorithms used by the two matching algorithms are completely different, the coordinates of the feature points obtained by the two algorithms are different and accurate to the sub-pixel level, s so the feature points obtained by the two algorithms almost do not coincide. In this way, the superposition of matching points obtained by the two matching algorithms not only retains rich edge feature information, but also greatly improves the matching number of feature points.

4. Dense 3D Reconstruction of Point Clouds and Surface Texture Reconstruction in 3D Printing Process

According to the previous analysis of 3D reconstruction based on the SFM sparse point cloud, this paper proposes an integrated SFM reconstruction method. Firstly, the global SFM is used to obtain the high-precision rotation, which lays a foundation for the calculation of incremental SFM, and then the incremental SFM is used for more reliable translation estimation, so that the integrated SFM algorithm has the advantages of both precision and speed of reconstruction. On this basis, point cloud dense 3D reconstruction and surface texture reconstruction are performed.

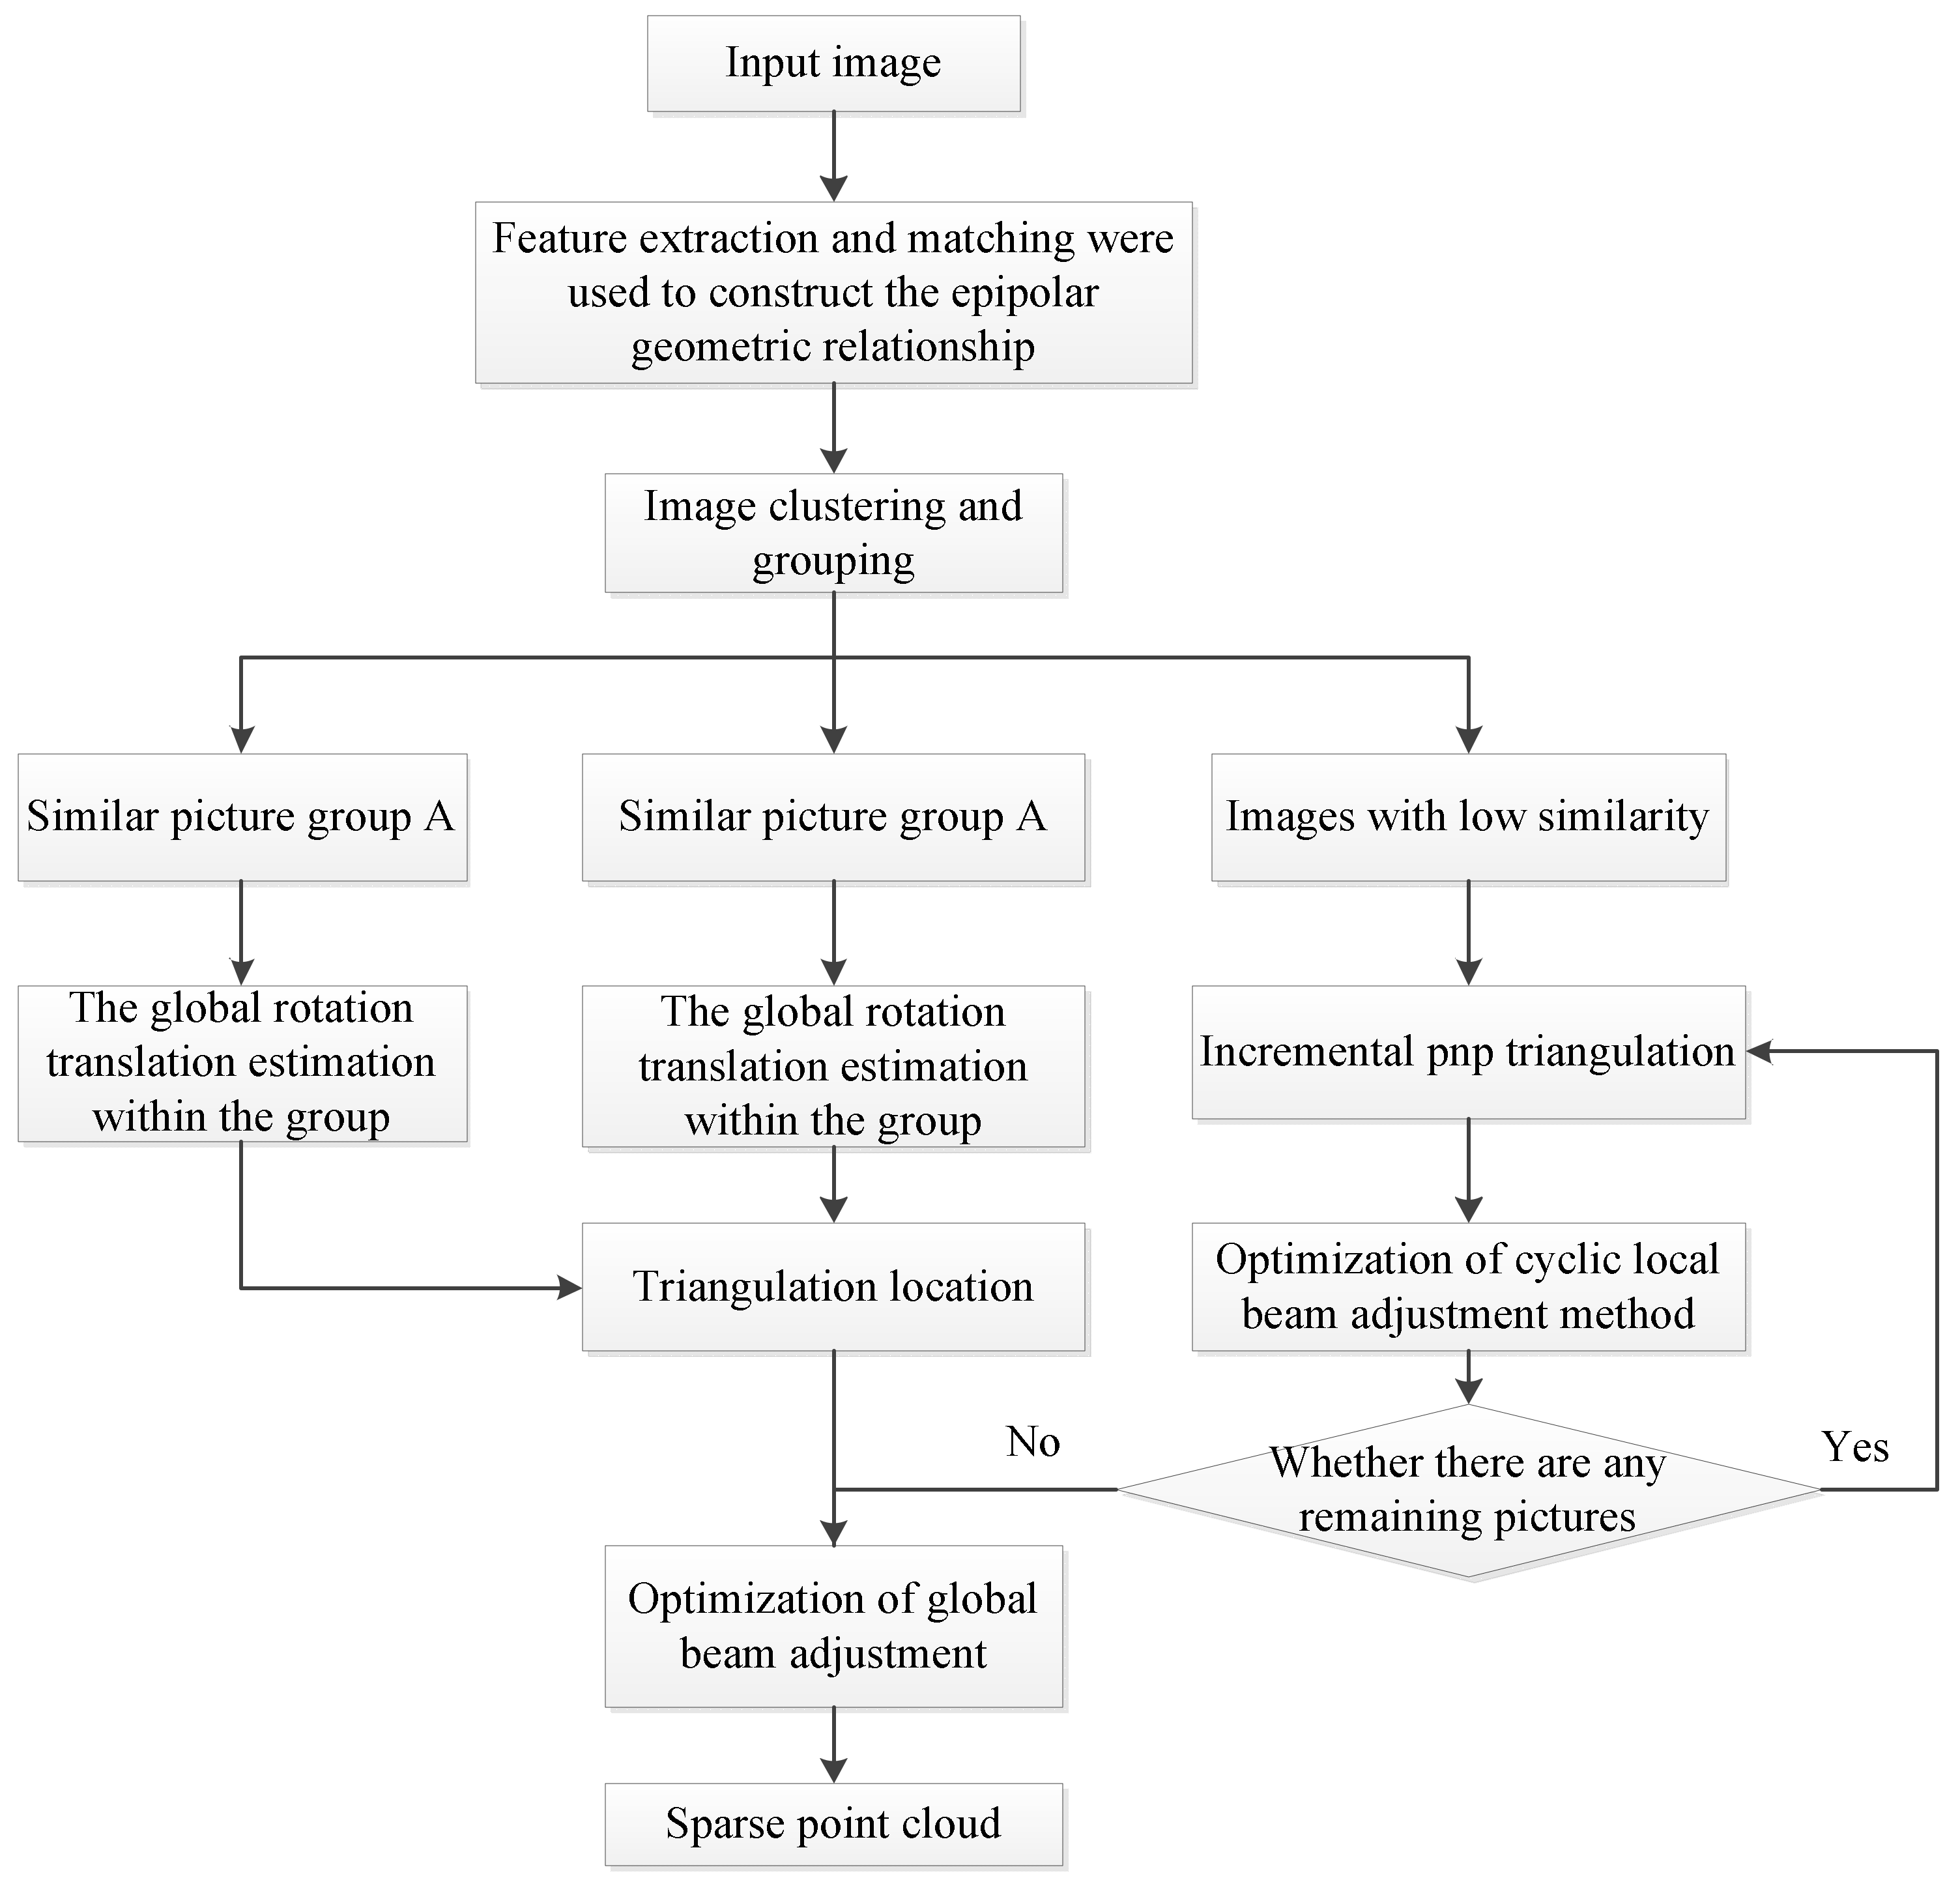
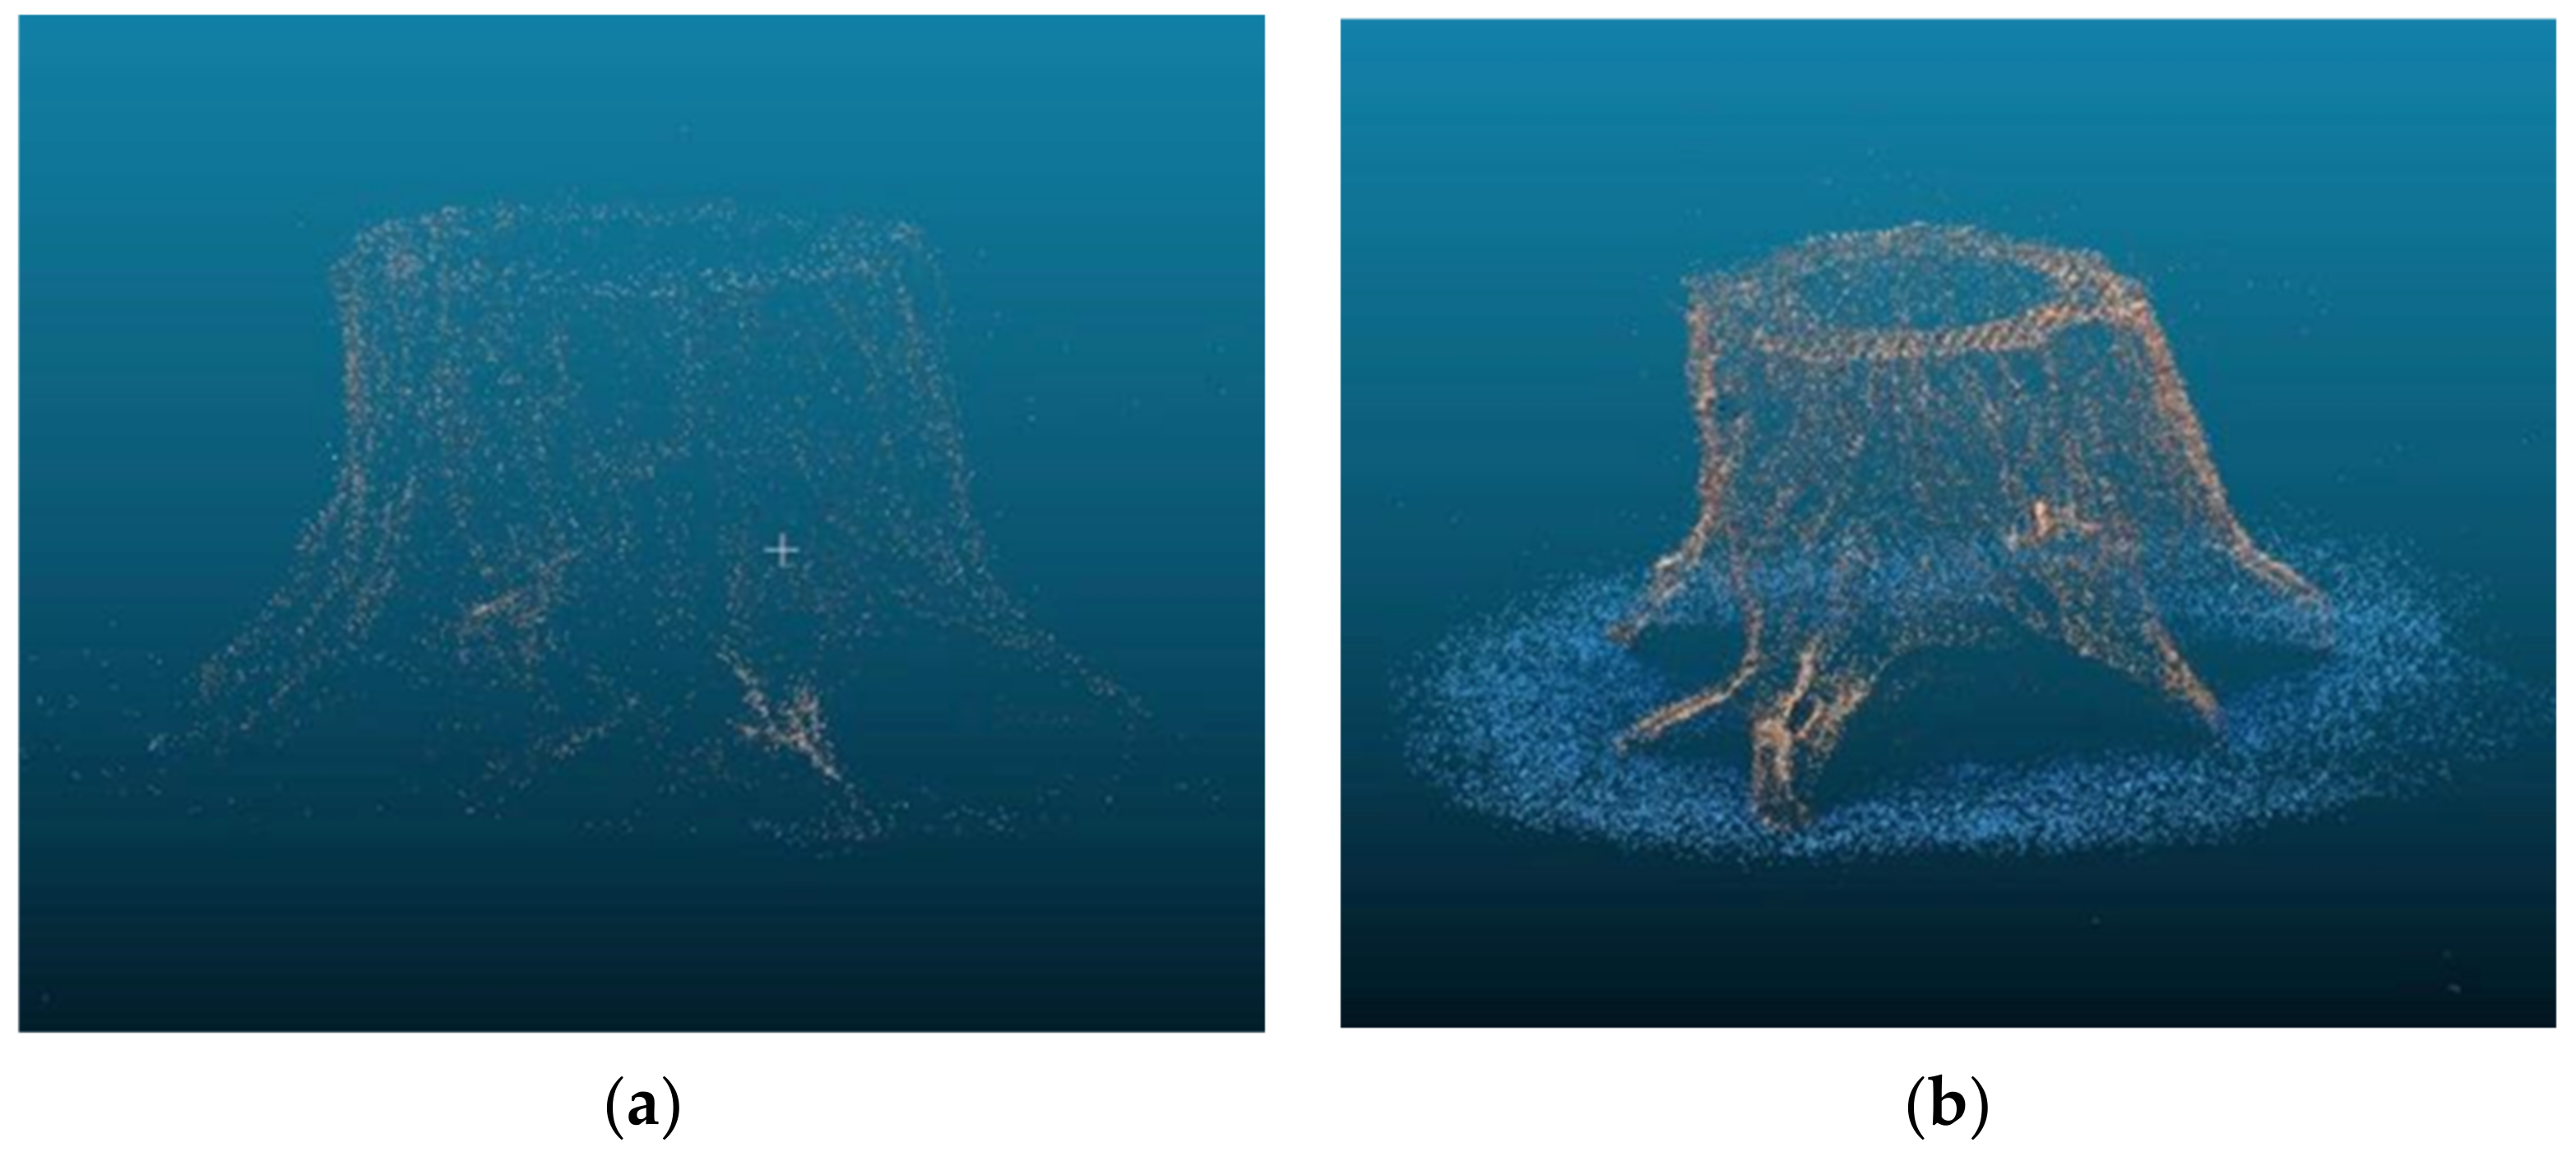
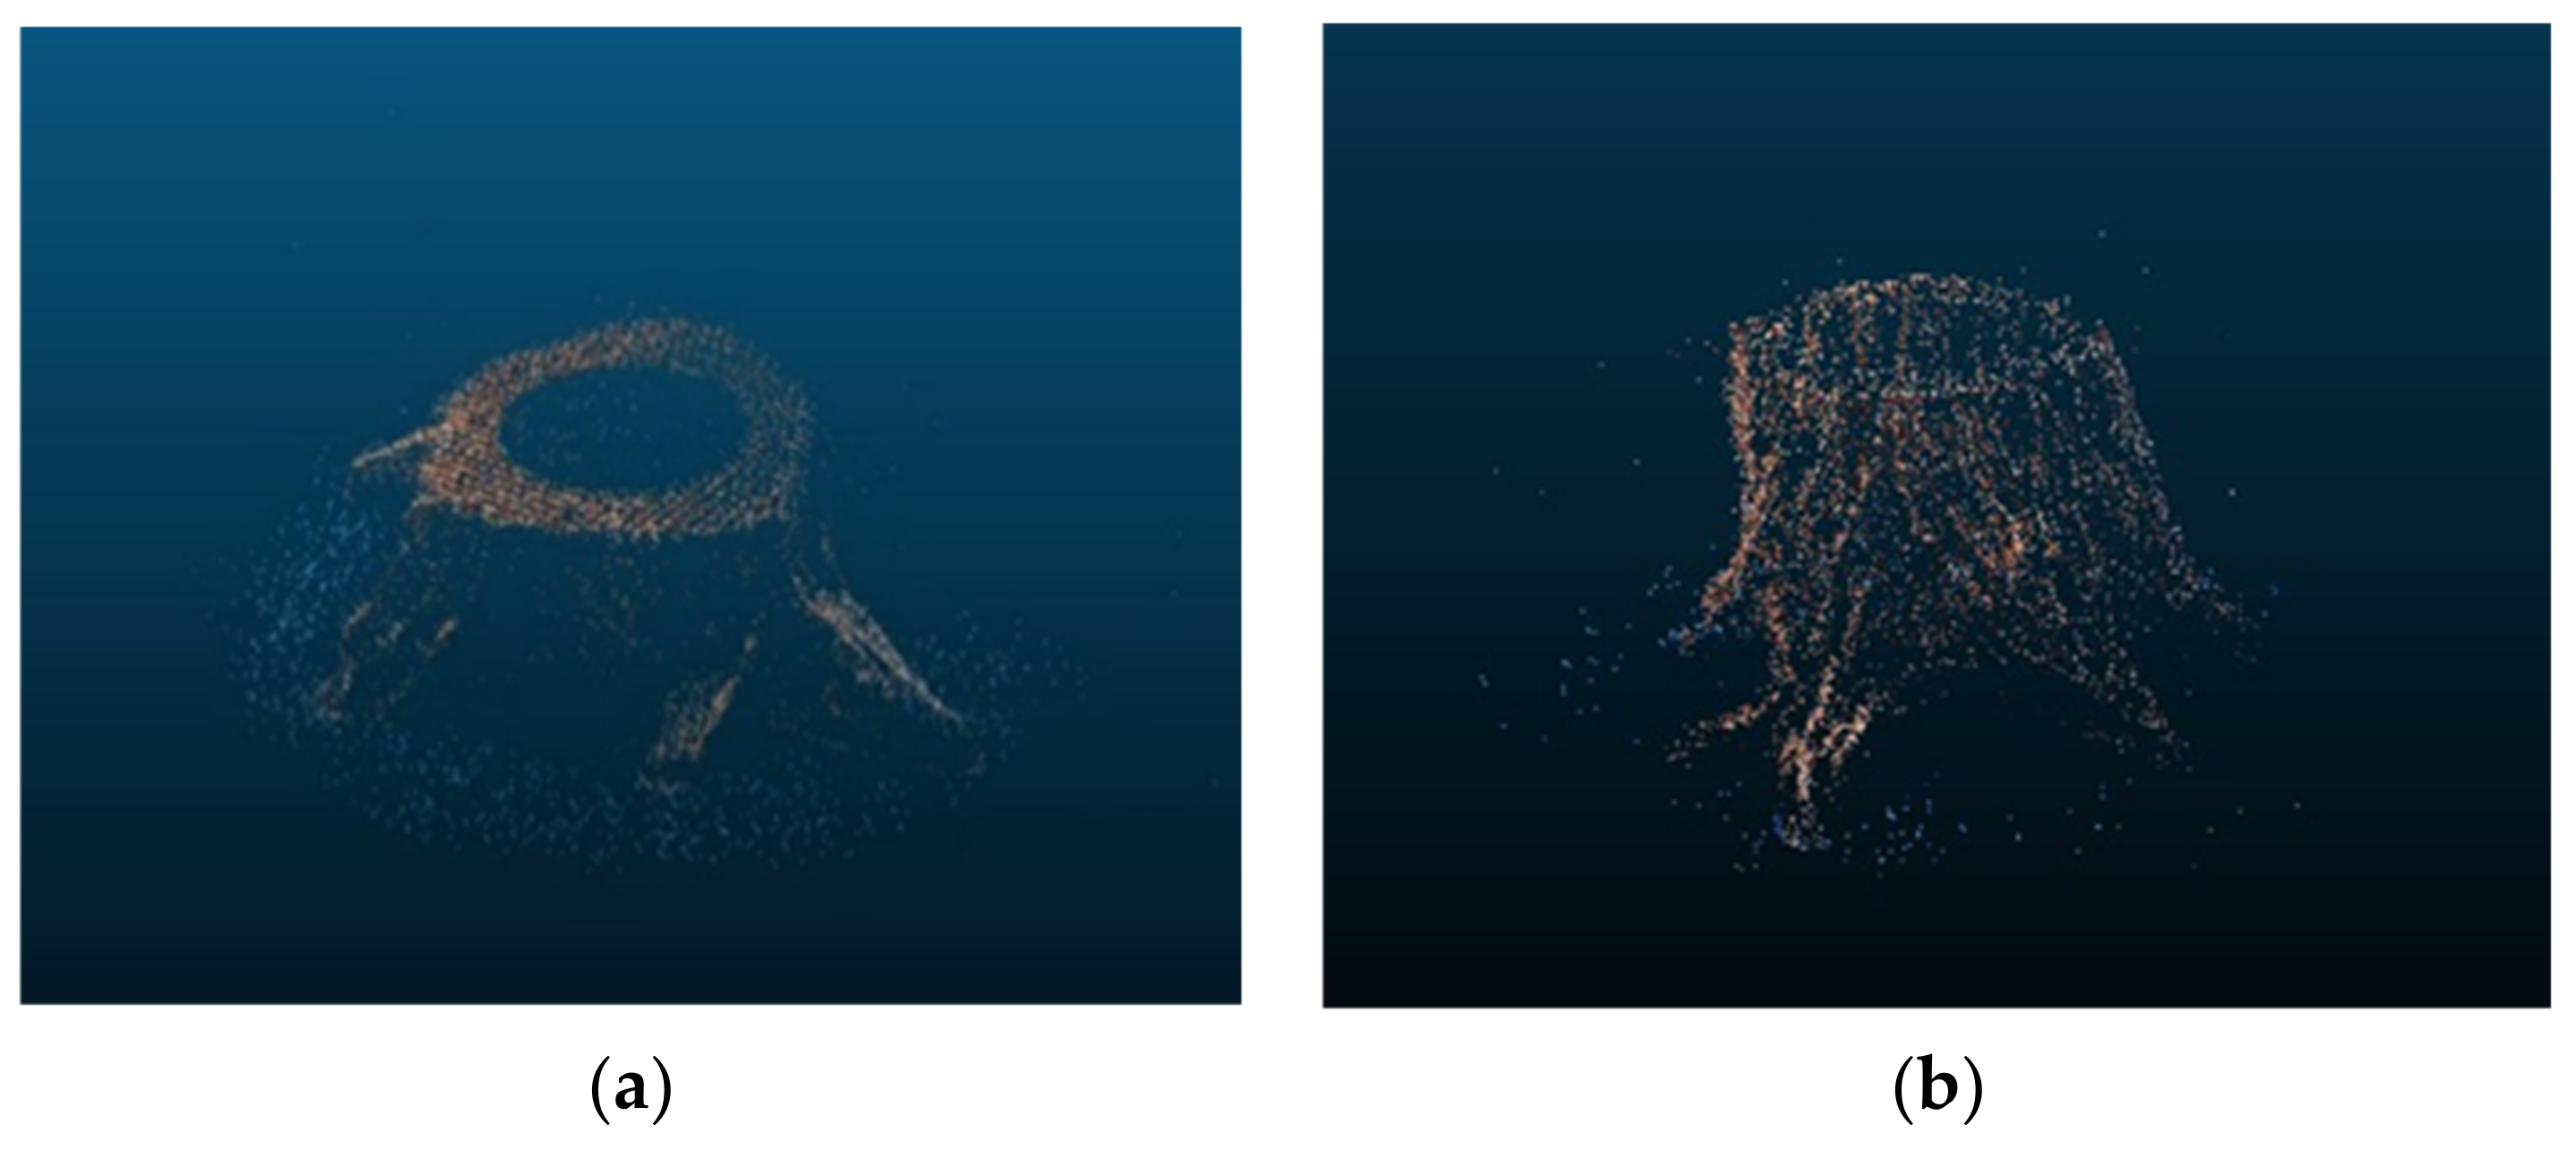
4.1. Sparse Point Cloud Reconstruction with Integrated SFM

The proposed integrated SFM 3D reconstruction process of sparse point cloud is shown in Figure 5.
Firstly, the collected images are grouped. The indicators to be considered in the grouping include the degree of overlap between images, the distribution of feature points among images, and the matching density of feature points, etc. Based on these characteristics, a correlation evaluation is proposed, and images are classified according to the correlation. The evaluation formula is as follows:
s i j = α C P i + C P j A P i + A P j + β N P i P j N P i P j + γ V P i + V P j V k
In the formula, sij represents the correlation score of image Pi and Pj, C represents the size of the graph area surrounded by the matching feature points of two images, A represents the area of the whole image, N represents the number of feature points, and V is the measure of the distribution of feature points in the image. The image is divided into 4k blocks of the same size by dividing the series k (k > 0), and the coefficient of each level is defined as 2k. Multiply by 1 or 0 (denoted as δ) according to whether there are feature points in the region, then the distribution of level k is V = 2kΣδ, and the value of V(*) is Vk = Σ8k in total. According to the experimental results, the values of coefficients α, β and γ are set as 0.4, 0.4, and 0.2, respectively.
Finally, the correlation between the images is used to construct the graph, and the AP clustering algorithm based on the graph is selected for grouping. The principle process is shown in Figure 6. Each image is the node of the graph, and the distance between two points is the size of correlation. The greater the correlation between two images, the closer the distance is. After the grouping is completed, the clustering center of each group is taken as the origin, and the similarity evaluation sij is used for constraint. The images with insufficient internal correlation in each cluster are filtered and removed to complete the image grouping.
In the process of reconstruction in the group, the set of relative rotation matrix is obtained in the stage of feature point matching, and then the global rotation matrix of the first camera viewpoint is set as the unit matrix to get a preliminary collection of global rotation matrix. However, there are still errors between it and the set of relative rotation matrices, so it is necessary to minimize the overall error to obtain the optimal global rotation matrix set Rv. The difference between the relative rotation Rij and the estimated RjRi−1 is calculated by using the minimization loss function:
R v = arg min { R 1 , R 2 , , R N ) ( i , j ) ε ρ d R i j , R j R i 1
where ρ(*) is the loss function and d(*) is the distance between the global rotation and the relative rotation. On the basis of the research in reference [25], Equation (11) is solved by the BCH formula. In the process of selecting loss function, L1 and L2 are commonly used for testing, but the effect is not ideal. By comparison, it is found that there is not much difference in the running time of different loss functions, but Lα has better accuracy when selecting α = 1/2, so the loss function is:
ρ x = 2 x 1 2
The cost function is converged to get the global rotation matrix. Final fusion within each group, in order to prevent the large gap between the fusion results of each group, requires that the correlation evaluation and rotation error information should be combined as the constraint conditions. The best image pair in the group was selected as the fusion benchmark, and the rotation information of the two images after fusion is taken as the input to carry out the intra-group fusion iteratively.
Then the global SFM method is used to recover the camera position of each view point. The global rotation of the camera has been calculated in the previous step, and Equation (13) is used to calculate the position in a nonlinear optimization way:
λ i j t ˜ i j = R i T t j t i
where t ˜ i j represents the relative displacement between the two views, λij represents the relative scale factor, tj and ti represent the global position vectors of camera i and camera j, respectively, and Rit represents the global rotation matrix of camera i. The solution process is based on the research results of Ozyesil et al. [26], and the cost equation is constructed by using the minimum deviation of the vector equation:
arg min t ρ d R t ˜ i j , t j t i t j t i
After testing and comparison, the better Geman–McClure function is selected for the loss function ρ(*), and its expression is as follows:
ρ x = x 2 / 2 σ 2 + x 2
After the global position information of rotation and translation is obtained by the above steps, the two-dimensional feature points can be located into the three-dimensional space by using triangle positioning. Before processing the subsequent steps with incremental PNP, the similarity between the remaining images and other groups of images is evaluated, and these images are sorted and processed in order to solve the rotation and position relationship between camera views.
After the 3D point cloud obtained by global SFM, the primary beam collimation algorithm is firstly carried out to optimize the 3D point cloud and the parameters of camera, and then the unprocessed images are successively added. The next step is to use the PNP algorithm to solve the parameters of camera and align them to the existing model coordinate system and then get the 3D point cloud of this image through triangulation. Finally, the new 3D point cloud is combined with the basic point cloud, and the beam collimation method is used for optimization when the new point cloud amount reaches a threshold. After all the images are processed, the beam collimation method is implemented again to get the final sparse point clouds.

4.2. Dense Reconstruction of Point Cloud and 3D Reconstruction of Surface

The SFM algorithm only gets a sparse three-dimensional point cloud, which also has a large range of voids inside, and the details are not sufficient, which cannot meet the reconstruction requirements of 3D printed parts, and further dense reconstruction is needed. Patch based multi view stereo vision (PMVS) has the characteristics of simple operation, more accurate reconstruction model, and can well deal with external point interference and occlusion [27]. This paper uses this method to obtain dense point clouds. However, in the actual application process, there will be more discrete points, which will affect the final reconstruction effect. In order to get a better effect, the traditional PMVS algorithm and the statistical outlier removal function encapsulated by PCL point cloud library are used in this paper to remove the discrete outer points through statistical analysis, so as to obtain a better dense reconstruction effect. The principle is to count the information of each point and its surroundings, solve the distance between each point and its surroundings, and calculate the average value. The result of the average value is expressed by Gaussian distribution as follows:
D = i = 1 n d i / n
where D is the average distance of the Gaussian distribution, n is the total number of neighborhood points around the point, and di is the distance between the neighborhood points and the point. According to the threshold value set by D, the discrete outer points that do not meet the requirements will be removed to obtain the dense point cloud with better effect. Since Delaunay triangulation has a strong adaptive ability and good anti-image noise effect when it is extended to three-dimensional space [28], Delaunay triangulation is applied to surface reconstruction after obtaining dense point clouds in this paper, and for the real-time requirement of 3D printing, divide and conquer algorithm with low computational complexity is selected. The common texture map operator encapsulated in OpenGL library is used to realize the texturization of mapping, restore and reconstruct the real texture of the object, and finally obtain the 3D reconstruction model of color restoration.

5. Comparison and Analysis of 3D Reconstruction Experiments in 3D Printing Process

The experiment of this paper consists of four parts, which are FFT-SIFT algorithm feature point extraction contrast experiment, feature point extraction and matching contrast experiment based on FFT-SIFT-AKAZE algorithm, the integrated SFM 3D reconstruction contrast analysis. Finally, the accuracy of 3D reconstruction results is analyzed.

5.1. Experimental and Comparative Analysis of FFT-SIFT Algorithm for Feature Point Extraction

The new method of Gaussian pyramid construction based on fast Fourier transform proposed in this paper can speed up the calculation speed of image two-dimensional convolution, thus accelerate the SIFT feature extraction process, and because it does not change the subsequent process of SIFT algorithm, it will not affect its scale and rotation invariance, and will not affect the number of feature points extraction in theory. The advantages of FFT-SIFT are summarized as follows:
(1)
The construction time of Gaussian difference pyramid is reduced, and the speed of feature point extraction is accelerated as a whole.
(2)
Not only the speed is accelerated, but also the number of feature points is not reduced.
In order to prove that the FFT-SIFT algorithm has the above characteristics, images collected in the printing process are selected to carry out comparative tests respectively between the traditional SIFT feature point extraction algorithm and the improved FFT-SIFT algorithm.
The five images of the printing process are collected and the effect of feature point extraction is compared and analyzed, as shown in Figure 7. The ai, bi and ci (i = 1~5) from left to right are the original image of the printing process, the feature point extraction of the traditional SIFT algorithm and the feature point extraction of the FFT-SIFT algorithm.
The experimental results show that the extraction effect of feature points is nearly the same, because the FFT-SIFT algorithm only changes the calculation method of Gaussian filter template convolution, and speeds up the calculation speed of convolution without changing other steps of SIFT. The comparison results of feature points of the two algorithms are shown in Table 1.
It can be seen from Table 1 that the speed of feature point extraction by the FFT-SIFT algorithm is higher than that of the traditional SIFT algorithm, but it is not obvious from a single image. Therefore, the FFT-SIFT algorithm is applied to the actual reconstruction system for the overall time statistics, and each image set has 48 photos. As can be seen from Table 2, with the increase of the number of pictures, the FFT-SIFT algorithm has a higher speed of feature point extraction. The efficiency of feature point extraction is obviously improved.
Based on the above experiments, the characteristics of the FFT-SIFT method are summarized as follows:
(1)
Compared with the traditional SIFT algorithm, the extraction speed of feature points is faster, and the extraction speed is increased by 25.0% in the application of this system
(2)
The number of feature points extraction does not change while accelerating the speed of feature points extraction.

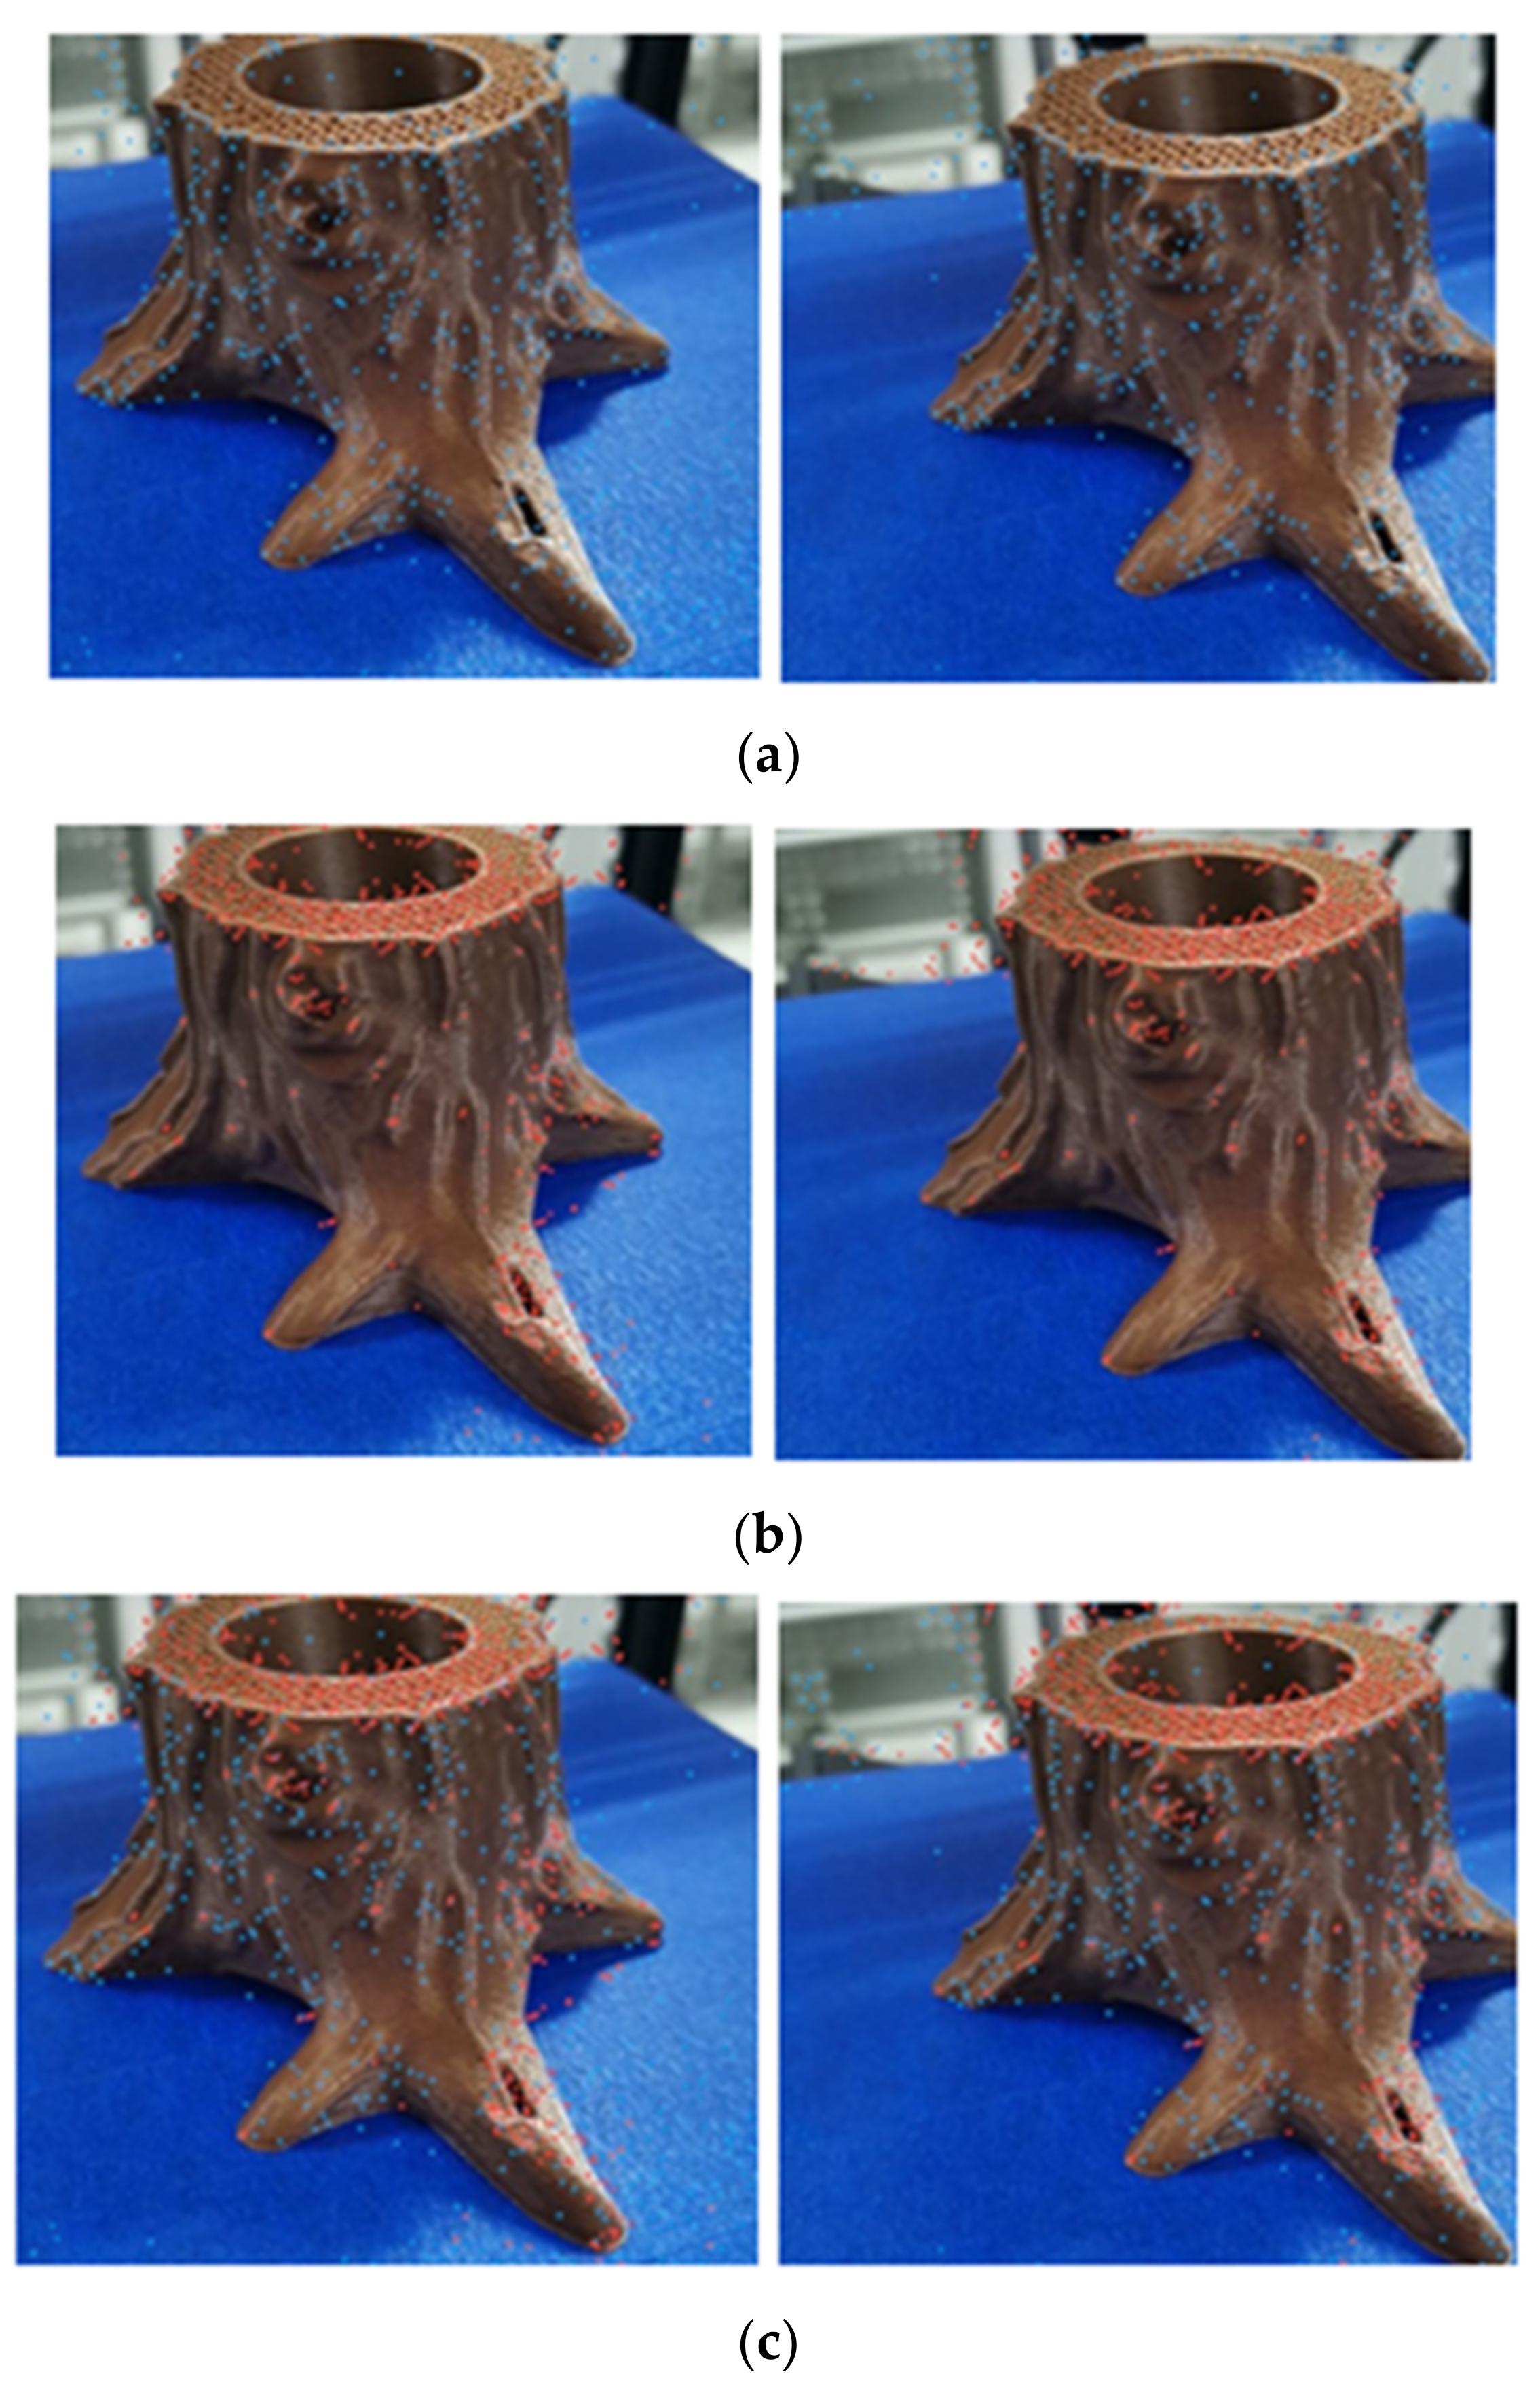
5.2. Experimental Comparison and Analysis of Feature Point Extraction and Matching Based on FFT-SIFT-AKAZE Algorithm

The previous experiments show that the FFT-SIFT algorithm has the advantages of scale rotation invariance, but the extraction effect of image edge contour features is limited, and the detailed acquisition of edge information is of great significance to the accurate reconstruction of 3D printed parts. Therefore, the AKAZE algorithm and the FFT-SIFT algorithm are fused to extract and match the feature points for comparative experiments to verify the effectiveness of the fusion method. The part of the images obtained from image acquisition in the printing process are used for experimental comparative analysis. Figure 8a is the result of feature extraction by the FFT-SIFT algorithm, Figure 8b is the result of feature extraction by the AKAZE algorithm, and Figure 8c is the result of feature extraction by the FFT-SIFT-AKAZE algorithm. The comparison shows that AKAZE is more sensitive to edge contour information, and more detailed feature point information can be extracted by combining the two algorithms.
Figure 9 is the verification of the feature matching results of the three algorithms. Figure 9a–c are the effect pictures of the FFT-SIFT algorithm, AKAZE algorithm and the FFT-SIFT-AKAZE algorithm for feature matching, respectively.
The Table 3 respectively records the average number of feature points extracted, feature points extraction time, feature points matching time and the number of final feature points matching based on the FFT-SIFT algorithm, AKAZE algorithm and FFT-SIFT-AKAZE algorithm in the actual printing process. Figure 10 shows the 3D reconstruction point clouds of traditional SIFT matching algorithm and FFT-SIFT-AKAZE 3D reconstruction point clouds.
The following conclusions can be drawn from the comparative analysis of the test results: Compared with FFT-SIFT algorithm alone, the fusion algorithm of FFT-SIFT-AKAZE increases the number of feature matches by 72.0%, which is far higher than the number of feature points extracted by the SIFT and AKAZE algorithms. Although the extraction and matching time of the algorithm in this paper is slightly increased, the matching results of the point cloud image obtained by the algorithm are more dense. The number of feature matching of edge contour increases significantly, and the details of contour become richer.

5.3. Experimental and Comparative Analysis of Integerated SFM

In order to prove the effectiveness and feasibility of the integrated SFM algorithm, the paper compares it with the incremental and global SFM algorithm. The images collected in the printing process are used as the experimental picture set, each picture set has 48 pictures. Some picture sets of the printing process are selected for display as shown in Figure 11a,b:
The comparison results of the three SFM reconstruction methods are shown in Table 4. The root mean square error of the reverse projection error optimized by the beam adjustment method is taken as the error evaluation standard, and the reconstruction time is taken as the reconstruction efficiency, where the root mean square of projection error is calculated as:
e = 1 n i = 1 n u i v i 2
where n is the total number of matching feature points, ui is the coordinate of feature points, and vi is the coordinate of projection.
In Table 4, Ti is the reconstruction time of incremental SFM, eI is the reconstruction error of incremental SFM, TG is the reconstruction time of global SFM, eG is the reconstruction error of global SFM, TH is the reconstruction time of comprehensive SFM, eH is the reconstruction error of comprehensive SFM, and × is the reconstruction failure of this image set. Table 4 shows that incremental SFM has the longest running time and global SFM has the shortest reconstruction time. The integrated SFM proposed in this paper is between the two, and the average reconstruction time is 39.3% shorter than incremental SFM. The main reason is that incremental SFM adds image registration camera in turn, locates the feature points through triangulation, and finally performs beam adjustment to optimize the reconstruction model. However, it takes a lot of time to perform beam adjustment optimization continuously. The global SFM is to calculate the pose parameters of all camera views at the same time, triangulate the positioning, and finally perform a global beam adjustment optimization, which reduces the calculation amount and improves the overall reconstruction efficiency. The integrated SFM proposed in this paper adopts the method of grouping similar images to carry out fast global reconstruction of related images within the group, and only incremental reconstruction of images that are not grouped into the group. In this way, compared with incremental SFM, the reconstruction efficiency is improved and the problem of scene drift that may occur in incremental SFM is alleviated.
In terms of reconstruction error, the incremental SFM reconstruction error is smaller, and the global SFM reconstruction error is larger. The integrated SFM reconstruction error is between the two, and the reconstruction error is 33.2% less than that of global SFM. The main reason for the above phenomenon is that the incremental PNP algorithm registers the image and the continuous beam adjustment method optimizes the point cloud model so that the reconstruction accuracy is relatively higher. However, the global reconstruction directly calculates all camera parameters at the same time, and finally the global beam adjustment is optimized once, so the relative reconstruction accuracy is lower. In order to solve the problem that global SFM is sensitive to the matching error, integrated SFM pre-groups the images, and filters the images with low correlation within the group. Finally, these filtered images are reconstructed by using the strong robustness of incremental SFM. It can also be seen from the Table 4 that global SFM failed to rebuild the two image sets with printing progress of 23% and 85%, which reflected that global SFM was not robust enough and was more sensitive to wrong matching, while integrated SFM made reconstruction more robust by grouping images. Figure 11 shows the final sparse reconstruction results of the two image sets in Figure 12.

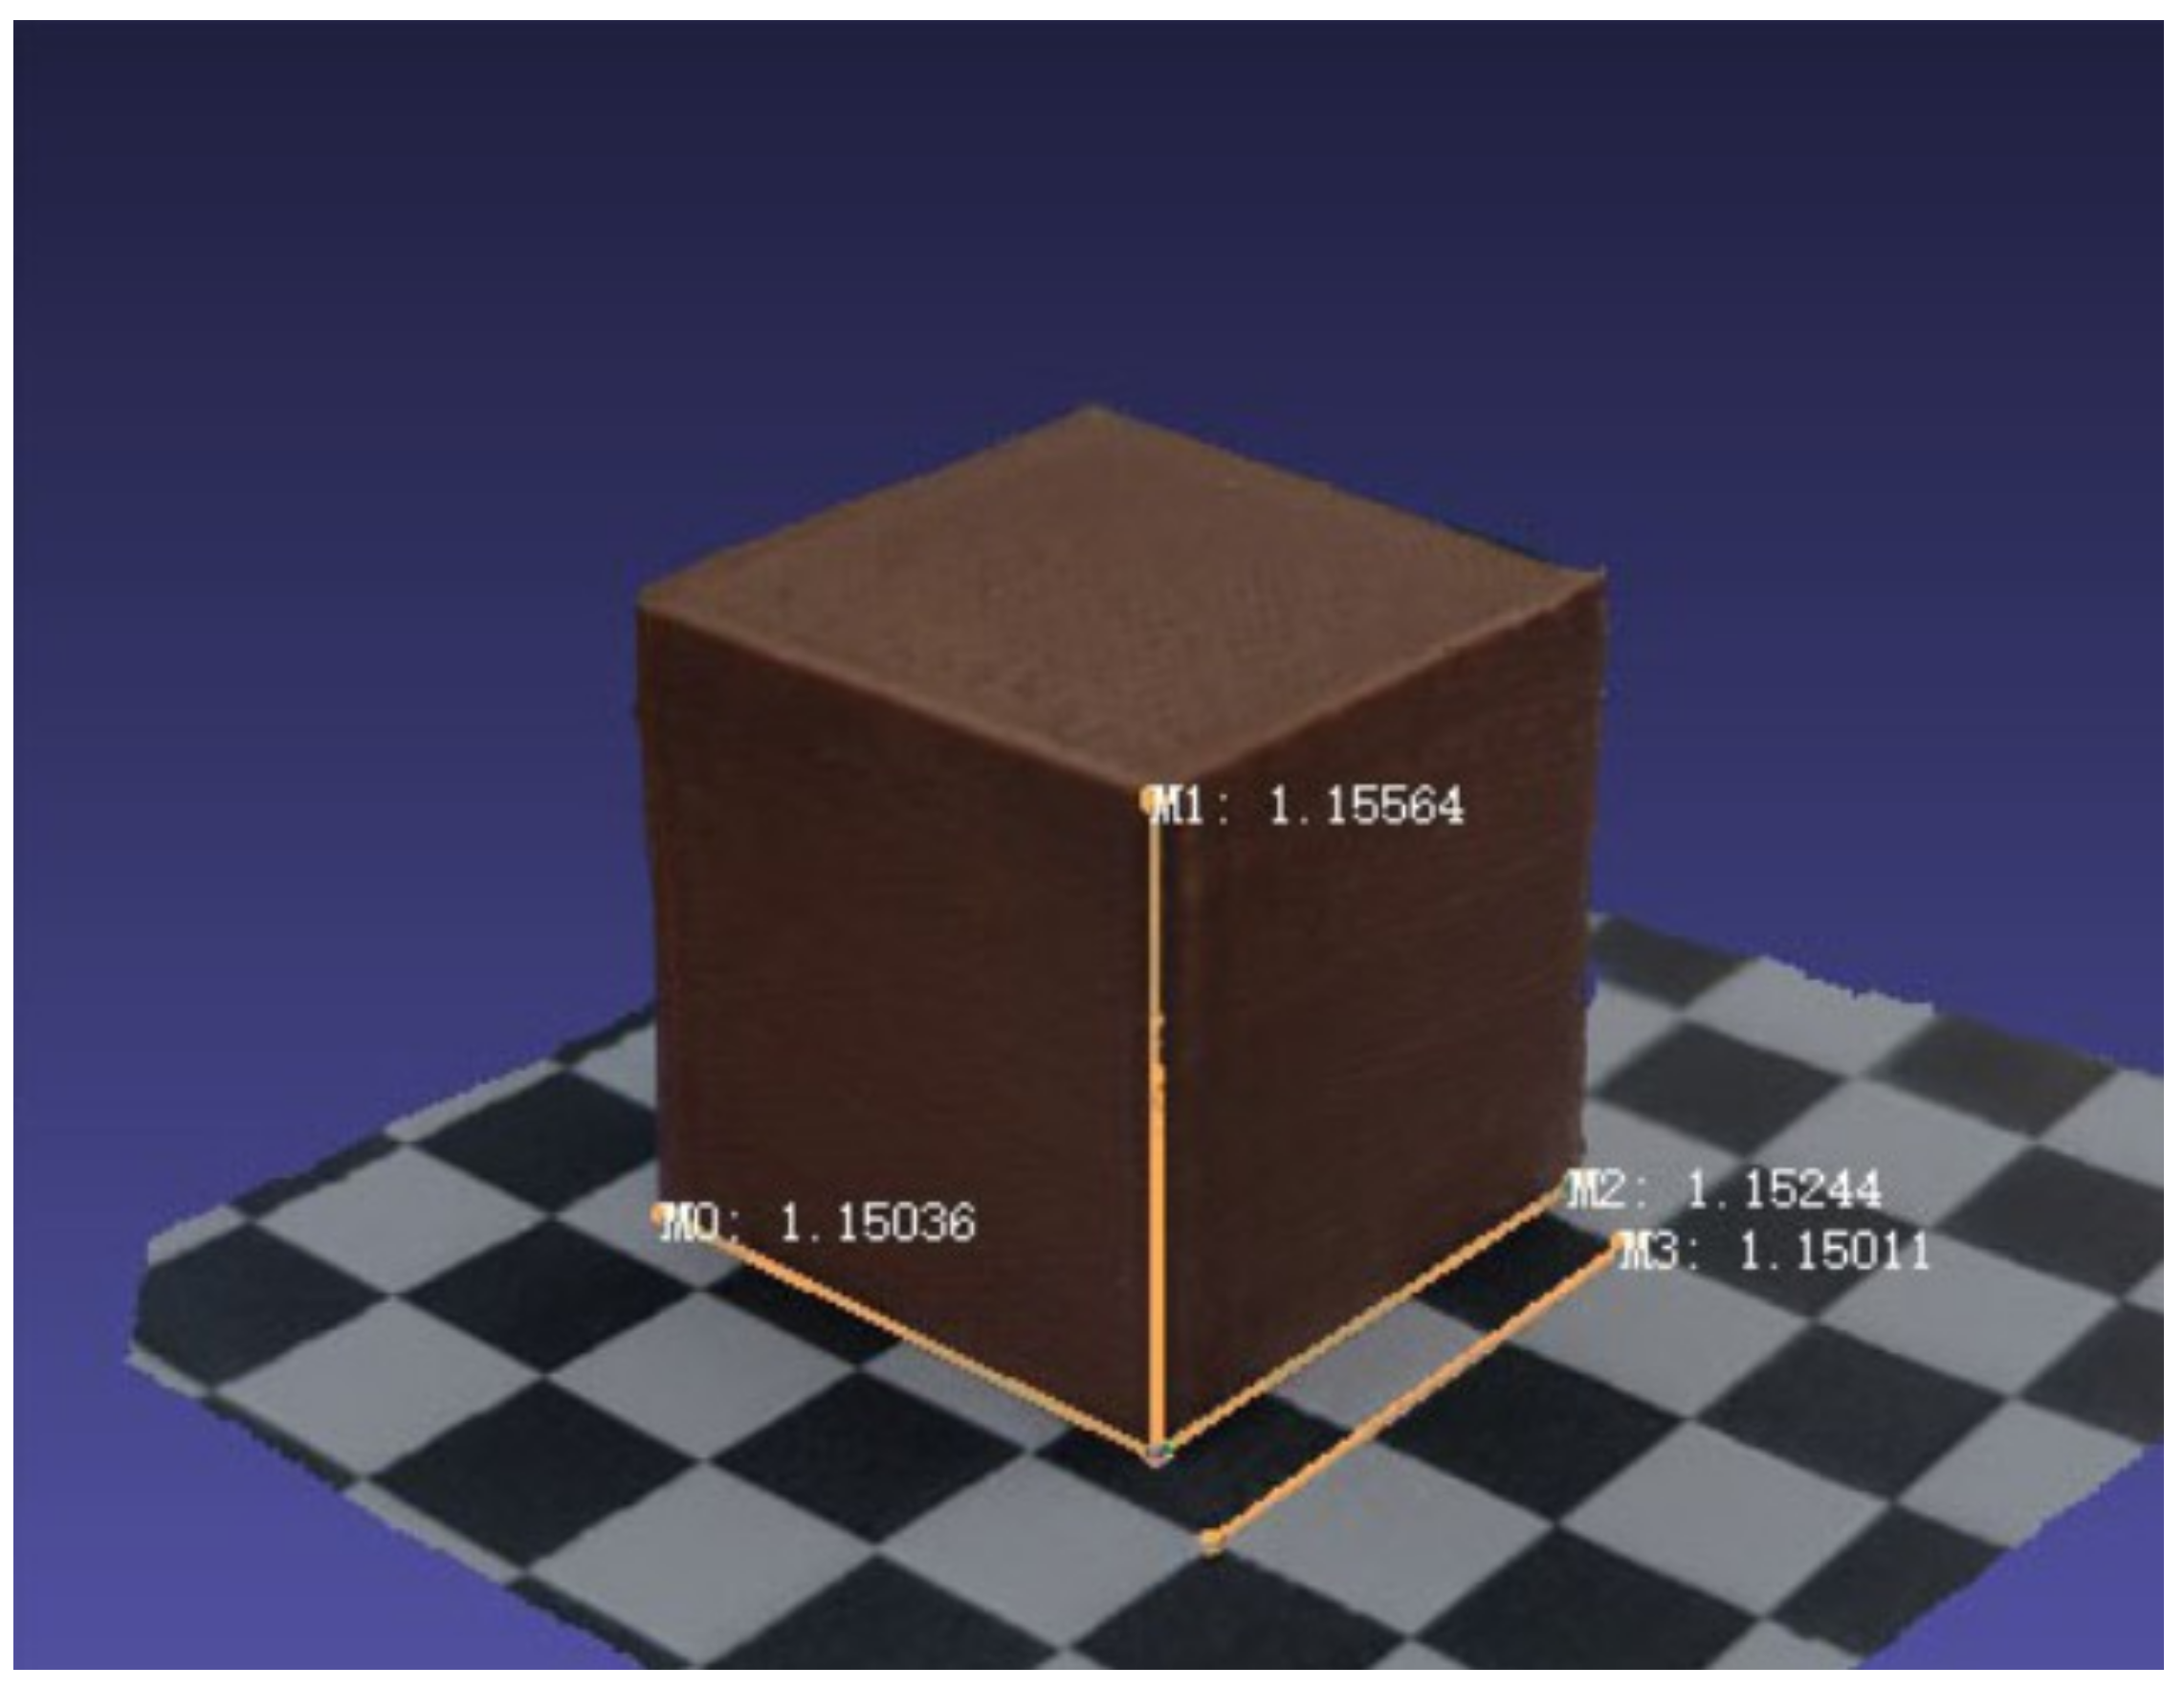
5.4. Accuracy Analysis of 3D Reconstruction Results
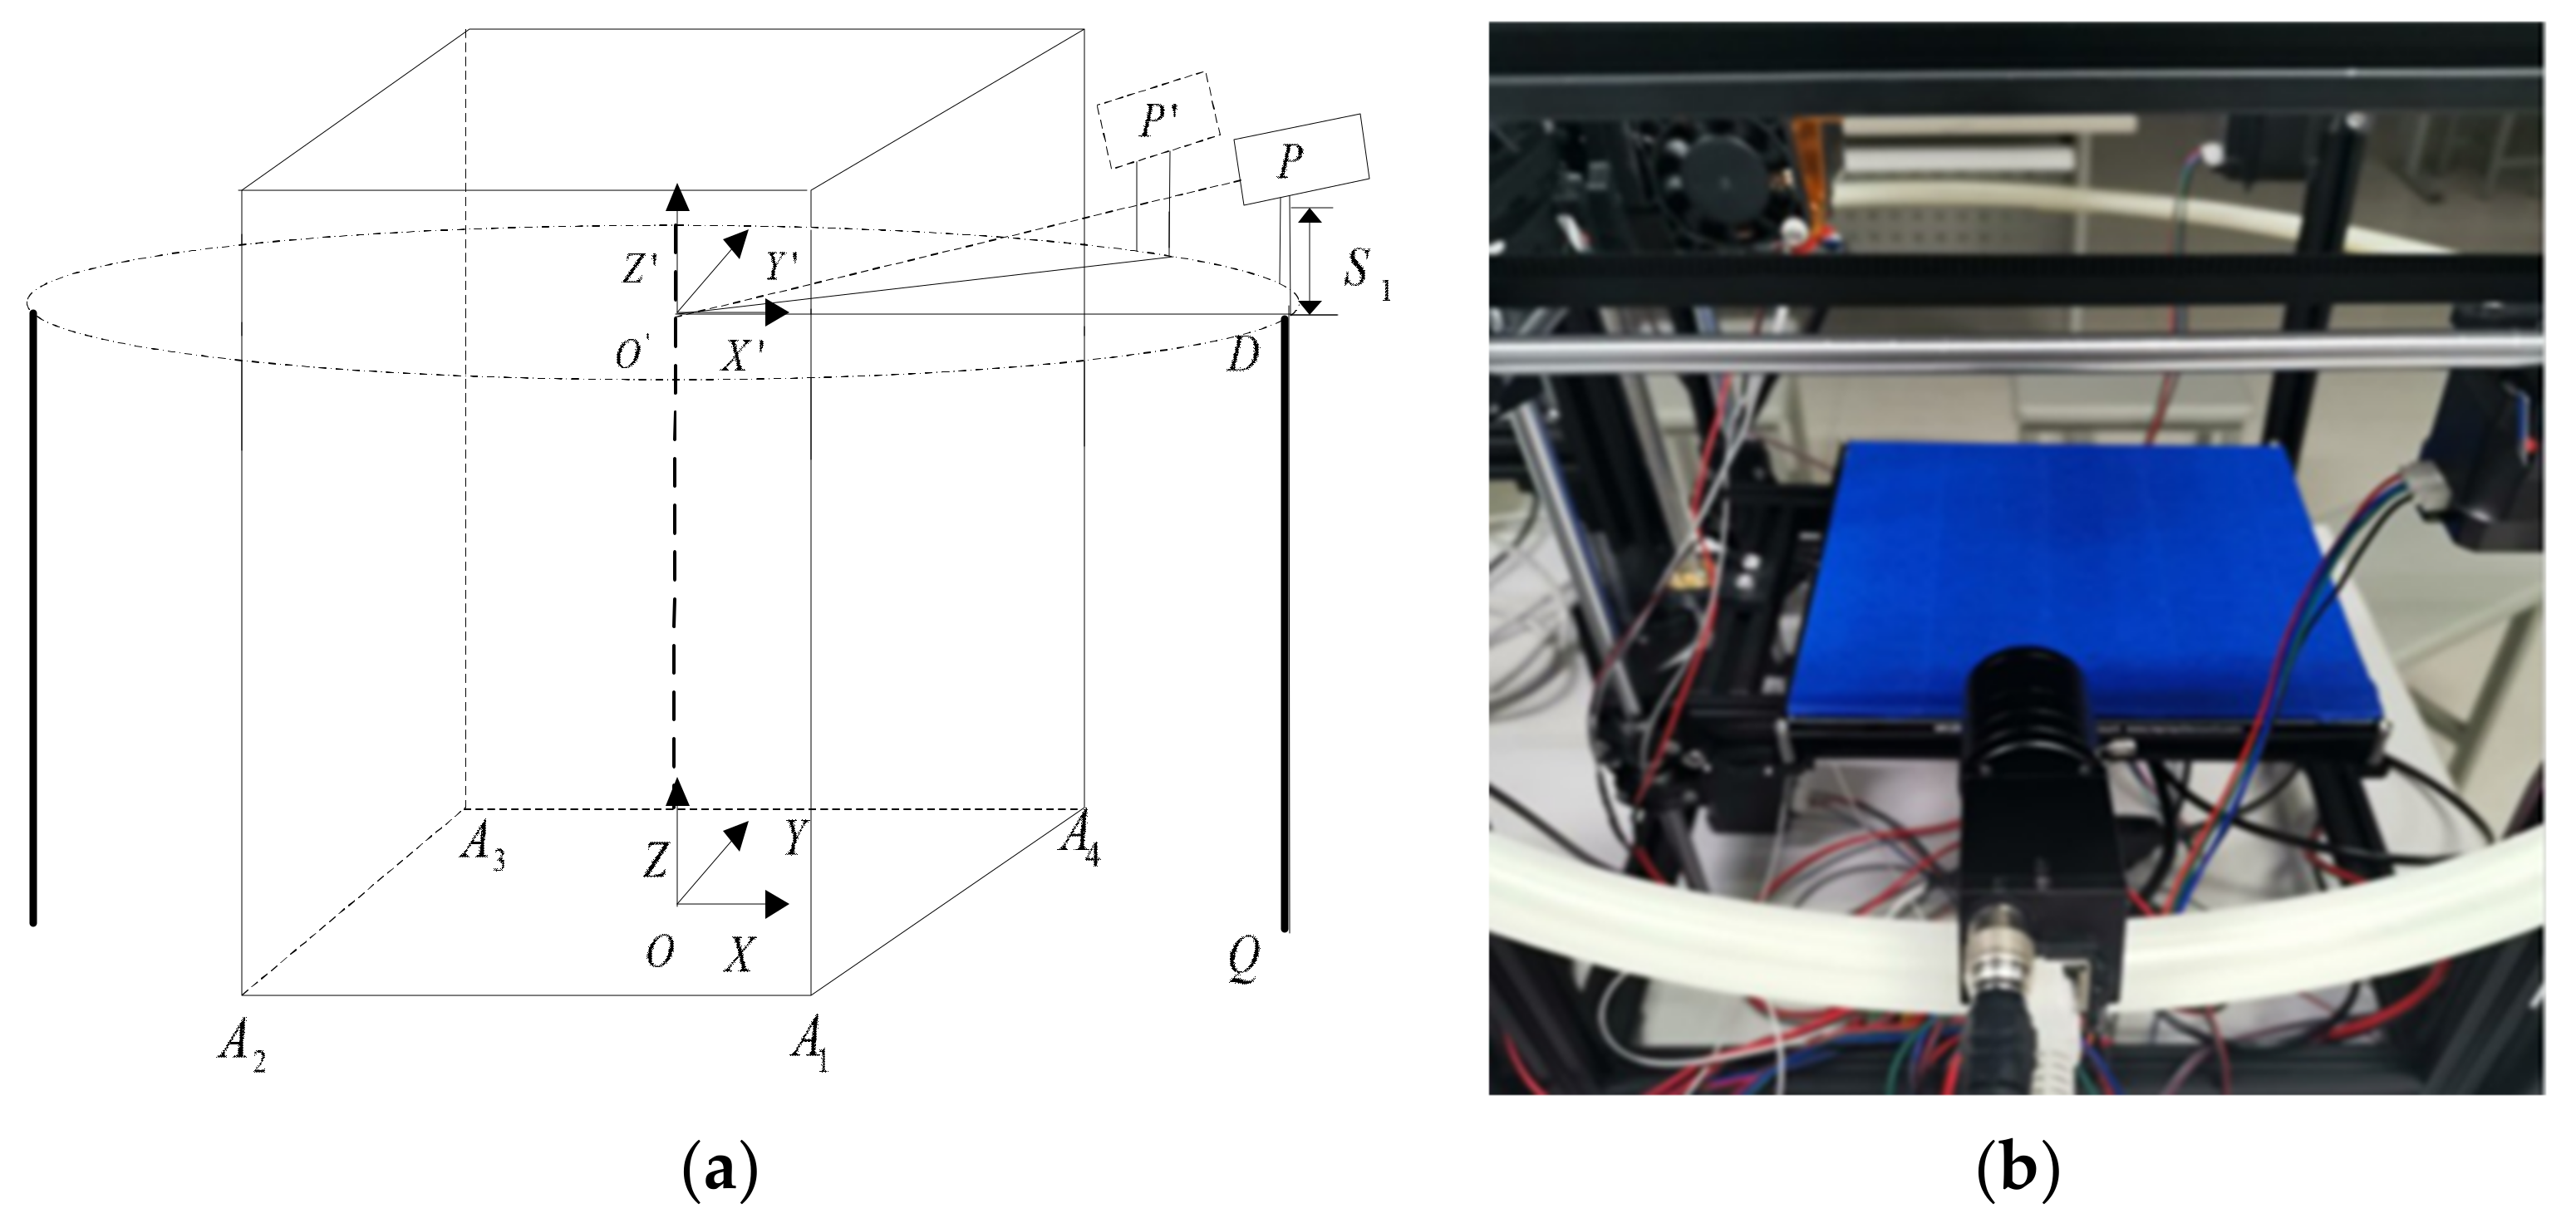
In order to ensure that the entire reconstruction system has a certain application value, this paper designed the following experiment to estimate the accuracy. In this reconstruction system, the accuracy of reconstruction can be estimated by the known parameters in the system. In order to facilitate calculation, the code of the reconstruction system is adjusted when the accuracy is measured, and the following operations are carried out.
(1)
When photographing the target object from the front, the distance between the measuring camera and the target object is d.
(2)
Set the front-shot image as the standard view angle, set the translation vector of the perspective as 0, and set its rotation matrix as the unit matrix. After the above processing, the origin of the perspective will be aligned with the origin of the world coordinate system.
(3)
In the subsequent reconstruction process, V1 was always taken as the basic view angle and the dual-view reconstruction is carried out. In the subsequent optimization of the beam adjustment method, the external parameters of the camera are not changed.
Finally, after the reconstruction is completed, check in the open source point cloud computing project MashLab, 3D points of patch of 50 ∗ 50 size reconstructed from the marked V1 perspective are selected, and the depth of these points is averaged, denoted as z. In theory, a scale mapping relationship between the reconstructed point cloud and the actual object is r = d/z. However, due to the existence of reprojection error, this equation is not valid. When the reprojection error is e, it will lead to the reconstruction point cloud error is σ. When the distance d between the camera and the object to be measured is known, the relationship c between the pixel and the actual distance can be calculated. According to the similarity principle of triangles, the following formula can be obtained:
e c σ = f d
The theoretical error can be obtained from the above equation:
σ = e d c f
The accuracy calculation formula is applied to the reconstruction system. In the formula, d is 156 mm after repeatedly measurements, and its error is ±5 mm. By photographing the grid reference platform, c is 53.55 pixels/mm, the average reprojection error e is 0.61, and f is 4.5013 mm. Finally, the theoretical error of this system can be obtained as [0.4074, 0.3821] mm.
In order to verify the accuracy of the above calculation, the ordinary printing platform is replaced with a customized checkerboard printing platform, and the checkerboard grid spacing is fixed. The standard cube is placed on the chessboard. When the first picture is taken, the camera is pointed directly at the cube. The measured shooting distance is 156 mm, and the rest are taken normally. The cube objects are reconstructed together with the checkerboard printing platform, and finally the reconstructed model is input to MashLab for measurement. The fragments of the collected image set are shown in Figure 13.
Figure 14 shows the results of model reconstruction and measurement. The corresponding scale relationship is found through the grid chessboard and the reconstructed grid chessboard. Since the distance of the grid of the chessboard printing platform is known, and the side length of each chessboard is 10 mm, it could be obtained that M3 = 1.15011 and the reconstructed size is 30.00 mm, and the scale coefficient r = 26.084 containing reprojection error could be obtained. Therefore, the actual physical size of the model can be obtained as follows: M0 = 1.15036 corresponding to reconstruction size of 30.00 mm; M1 = 1.15564 corresponding to reconstruction size of 30.14 mm; M2 = 1.15244 corresponding to reconstruction size of 30.06 mm.
Finally, we use vernier caliper to measure the length, width, and height of the cube 10 times, and take the average value to get the real length corresponding to M0, M1 and M2 are 30.184 mm, 29.846 mm, and 30.620 mm, respectively. The final comprehensive calculation shows that the actual error of the reconstructed system is 0.453 mm, and the relative error is about 0.014%, which is close to the theoretical error. This precision has good application value in 3D measurement of 3D printing process.

6. Conclusions

The real-time detection of parts in the printing process is one of the keys to form the closed-loop control. Based on the vision 3D measurement theory, this paper proposes a high-precision and rapid 3D reconstruction method of 3D printing process based on vision, and designs the corresponding detection structure. In order to improve the speed of 3D reconstruction, the FFT-SIFT algorithm, which can realize the rapid construction of scale space, is integrated with the AKAZE algorithm to improve the speed of feature extraction and obtain more feature matching information at the same time. Combining the incremental SFM algorithm with the global SFM algorithm, an integrated SFM sparse point cloud reconstruction method is developed to improve the reconstruction efficiency and robustness. On this basis, point cloud densification, point cloud model meshwork and texture mapping are utilized to achieve accurate 3D reconstruction of 3D printing process model. The comparative experimental analysis shows that compared with the classical SIFT algorithm, the proposed 3D reconstruction method can improve the extraction speed of feature points by 25.0%, improved the number of feature matches by 72%, and the reconstruction relative error is about 0.014%, which is close to the theoretical error. The proposed 3D printing process detection method has good application value and industrial significance.
In conclusion, the main advantages of the optimization method in this paper are: in the process of 3D reconstruction of 3D printed structures with single color and texture, the process of feature extraction and matching not only maintains the robustness of scale but also retains more edge details on the basis of improving the matching speed. At the same time, the proposed integrated SFM method not only maintains the reconstruction speed and accuracy, but also has good robustness in the process of multi views reconstruction. The three-dimensional reconstruction method in this paper can be widely used in the three-dimensional detection of small and medium-sized structural parts.
In order to improve the practicability of the detection system, the following two technical and theoretical problems need to be discussed and improved in the follow-up work:
(1)
The impact on the print results for lowering and rising the printing platform (print bed) during the printing process.
In the process of 3D printing, image acquisition is a static process, so it is necessary to pause printing and take photos on the lifting platform. This process may bring some slight deviations along the z-axis. In order to improve the accuracy of the printing process, we can use better motors to drive the z-axis movement and optimize the mechanical structure of the printer to ensure the effect of 3D reconstruction. At the same time, in order to prevent the problem of complete cooling of the material caused by the long pause of printing, better cameras can be used to shorten the exposure time and improve the stability, so as to accelerate the process of taking photos. Besides, continuous experiments can be carried out to shorten the photographic interval, so as to reduce the negative impact of material temperature drop in the printing gap on the printing quality. Secondly, consider improving the structure of the detection system, so as to avoid the movement of the printing platform in the z-axis direction in the process of image acquisition. In order to realize dynamic online detection, multi vision synchronous image acquisition can be considered.
(2)
Accuracy of reconstruction system
In the 3D reconstruction of the actual 3D printing process, the reconstruction accuracy is greatly affected by the hardware platform. According to Equation (19), the main factors affecting the reconstruction accuracy are: the distance between the camera and the printing structure, the pixel of the camera, and the focal length of the camera. The limited hardware conditions of the camera and 3D vision system currently used in this paper lead to a large reconstruction error. All these factors can be improved by optimizing the hardware structure of 3D vision system and using better camera equipment in the future, so as to improve the accuracy of the reconstruction system, and then improve the practical value of the integrated SFM algorithm.
In short, based on the existing results, the subsequent work should first further analyze the influence mechanism of the three-dimensional reconstruction error, propose the error separation, and compensation methods to improve the measurement accuracy. Secondly, the hardware equipment of the detection system should be further improved to improve the practicability of the method. On this basis, the parameters of the printing process are controlled to achieve closed-loop printing feedback.

Author Contributions

Conceptualization, N.L., Y.Q., and Y.Z.; methodology, N.L., C.W., and Y.Q.; software, Y.Q. and C.W.; formal analysis, N.L., C.W., Y.Q., and Y.Z.; investigation, N.L., C.W., Y.Q., and Y.Z.; resources, N.L. and Y.Z.; data curation, N.L., C.W., and Y.Q.; writing—original draft preparation, C.W. and Y.Q.; writing—review and editing, N.L., C.W., Y.Q., and Y.Z.; project administration, N.L. and Y.Q.; funding acquisition, N.L. and Y.Z. All authors have read and agreed to the published version of the manuscript.

Funding

This research was supported by National Natural Science Foundation of China. (Grant No. 51675142).

Conflicts of Interest

The authors declare no conflict of interest.

References

  1. Alvarez, A.G.; Evans, P.L.; Dovgalski, L.; Goldsmith, I. Design, additive manufacture and clinical application of a patient-specific titanium implant to anatomically reconstruct a large chest wall defect. Rapid Prototyp. J. 2021, 27, 304–310. [Google Scholar] [CrossRef]
  2. Hussin, R.B.; Sharif, S.B.; Rahim, S.Z.B.A.; Bin Mohd Khushairi, M.T.; Abdellah EL-Hadj, A.; Shuaib, N.A.B. The potential of metal epoxy composite (MEC) as hybrid mold inserts in rapid tooling application: A review. Rapid Prototy. J. 2021, in press. [Google Scholar] [CrossRef]
  3. Kumar, M.; Sharma, V. Additive manufacturing techniques for the fabrication of tissue engineering scaffolds: A review. Rapid Prototyp. J. 2021, in press. [Google Scholar] [CrossRef]
  4. Palmer, C. 3D Printing Advances on Multiple Fronts. Engineering 2020, 6, 15–20. [Google Scholar] [CrossRef]
  5. Taborda LL, L.; Maury, H.; Pacheco, J. Design for additive manufacturing: A comprehensive review of the tendencies and limitations of methodologies. Rapid Prototyp. J. 2021, 27, 918–966. [Google Scholar] [CrossRef]
  6. Ghomi, E.R.; Eshkalak, S.K.; Singh, S.; Chinnappan, A.; Ramakrishna, S.; Narayan, R. Fused filament printing of specialized biomedical devices: A state-of-the art review of technological feasibilities with PEEK. Rapid Prototyp. J. 2021, 27, 592–616. [Google Scholar] [CrossRef]
  7. Li, S.; Wei, Z.; Du, J.; Pei, W.; Lu, B. A numerical analysis on the metal droplets impacting and spreading out on the substrate. Rare Met. Mater. Eng. 2017, 46, 893–898. [Google Scholar]
  8. Lis, L.; Yangl, X.; Lub, H. Analysis of different occlusal modes and bite force of mandible. Trans. China Weld. Inst. 2020, 41, 54–61, 82, 100. [Google Scholar]
  9. Wang, L.; Du, W.; Zhang, F.; Zhang, H.; Gao, B.; Dong, S. Research on topology optimization and 3d printing manufacturing of four-branches cast-steel joint. J. Build. Struct. 2021, 42, 37–49. [Google Scholar]
  10. Bud, E.S.; Bocanet, V.I.; Muntean, M.H.; Vlasa, A.; Bucur, S.M.; Pacurar, M.; Dragomir, B.R.; Olteanu, C.D.; Bud, A. Accuracy of Three-Dimensional (3D) Printed Dental Digital Models Generated with Three Types of Resin Polymers by Extra-Oral Optical Scanning. J. Clin. Med. 2021, 10, 1908. [Google Scholar] [CrossRef] [PubMed]
  11. Wang, Y.; Ge, J.Y.; Xue, X.W.; Wang, S.F.; Li, F.Q. Path planning for complex thin-walled structures in 3D printing: An improved Q-learning method. Comput. Eng. Appl. 2021, 1–8. [Google Scholar]
  12. Lai, X.W.; Zheng, Y. 3D printing slice algorithm and partition scanning strategy for numerical control machining system. Trans. Chin. Soc. Agric. Eng. 2019, 35, 58–64. [Google Scholar]
  13. Chi, D.; Ma, Z.; Cheng, Y.; Zhao, Z.; Tang, Z. Defect testing for 3D printed hollow structure using X ray CT technique. Trans. China Weld. Inst. 2018, 39, 22–26. [Google Scholar]
  14. Wen, Y.; Gao, T.; Zhang, Y. 3D Visualization Method for Complex Lattice Structure Defects in 3D Printing. Acta Metrol. Sin. 2020, 41, 1077–1081. [Google Scholar]
  15. Straub, J. Initial work on the characterization of additive manufacturing (3D printing) using software image analysis. Machines 2015, 3, 55–71. [Google Scholar] [CrossRef] [Green Version]
  16. Sitthi-Amorn, P.; Ramos, J.E.; Wangy, Y.; Lan, J.; Wang, W. MultiFab: A machine vision assisted platform for multi-material 3D printing. Acm Trans. Graph. 2015, 34, 1–11. [Google Scholar] [CrossRef] [Green Version]
  17. Lowe, D.G. Distinctive image features from scale-invariant keypoints. Int. J. Comput. Vis. 2004, 60, 91–110. [Google Scholar] [CrossRef]
  18. Bay, H.; Tuytelaars, T.; Van Gool, L. Surf: Speeded up robust features. In Proceedings of the 9th European Conference on Computer Vision, Graz, Austria, 7–13 May 2006; pp. 404–417. [Google Scholar]
  19. Alcantarilla, P.F.; Bartoli, A.; Davison, A.J. Kaze features. In Proceedings of the European Conference on Computer Vision, Florence, Italy, 7–13 October 2012; pp. 214–227. [Google Scholar]
  20. Yao, Y.; Luo, Z.X.; Li, S.W.; Shen, T.; Long, Q. Recurrent MVSNet for high-resolution multi-view stereo depth inference. In Proceedings of the IEEE Conference on Computer Vision and Pattern Recognition, Long Beach, CA, USA, 15–20 June 2019; pp. 5525–5534. [Google Scholar]
  21. Song, R.; Liu, Y.H.; Zhao, Y.T.; Martin, R.; Rosin, P. An evaluation method for multi-view surface reconstruction algorithms. In Proceedings of the Second International Conference on 3D Imaging, Modeling, Processing, Visualization & Transmission, Zurich, Switzerland, 13–15 October 2012; pp. 387–394. [Google Scholar]
  22. He, Y.; Deng, G.; Wang, Y.; Wei, L.; Yang, J.; Li, X.; Zhang, Y. Optimization of SIFT algorithm for fast-image feature extraction in line-scanning ophthalmoscope—Science Direct. Optik 2018, 152, 21–28. [Google Scholar] [CrossRef]
  23. Fast Explicit Diffusion for Accelerated Features in Nonlinear Scale Spaces. In Proceedings of the British Machine Vision Conference (BMVC), Bristol, UK, 9–13 September 2013.
  24. Ramakrishnan, S. Probabilistic cost model for nearest neighbor search in image retrieval. Comput. Rev. 2013, 54, 113. [Google Scholar]
  25. Chatterjee, A.; Govindu, V.M. Efficient and robust large-scale rotation averaging. In Proceedings of the IEEE International Conference on Computer Vision, Sydney, Australia, 1–8 December 2013; pp. 521–528. [Google Scholar]
  26. Ozyesil, O.; Singer, A. Robust camera location estimation by convex programming. In Proceedings of the IEEE Conference on Computer Vision and Pattern Recognition, Boston, MA, USA, 7–12 June 2015; pp. 2674–2683. [Google Scholar]
  27. Hata, J.; Ito, K.; Aoki, T. A 3D reconstruction method using PMVS for a limited number of view points. Int. Workshop Adv. Image Technol. (IWAIT) 2019, 11049, 1104942. [Google Scholar]
  28. Feng, L.; Alliez, P.; Busé, L.; Delingette, H.; Desbrun, M. Curved optimal delaunay triangulation. ACM Trans. Graph. 2018, 37, 16. [Google Scholar] [CrossRef] [Green Version]
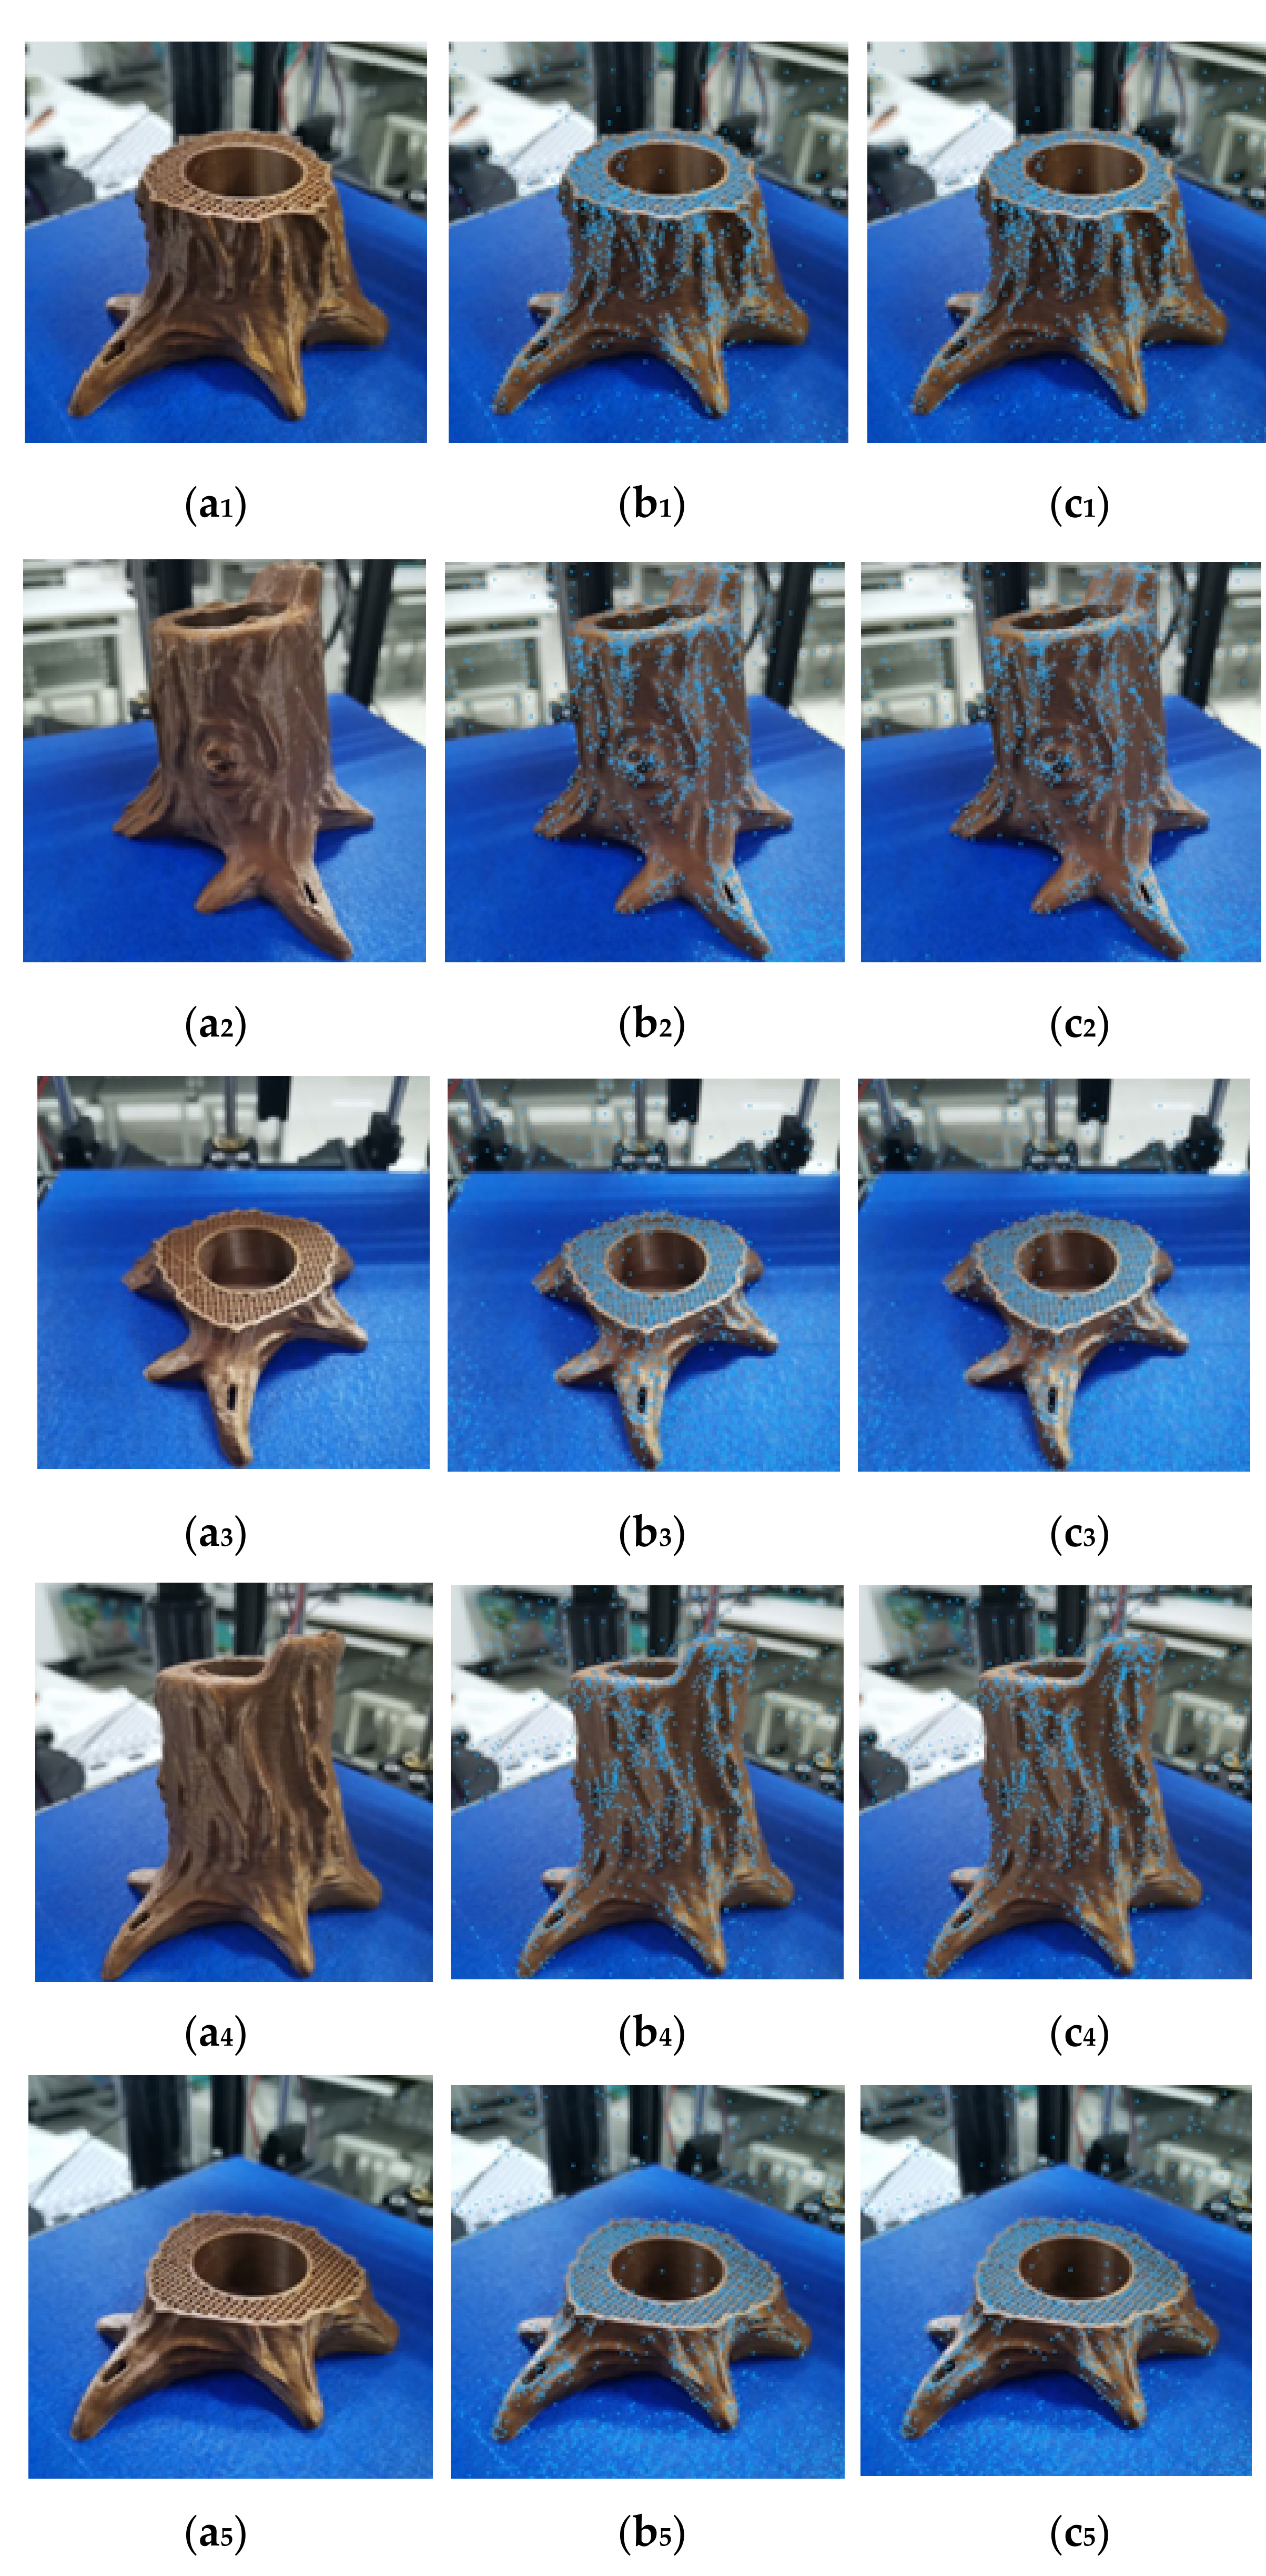
Figure 1. Structure and device of visual inspection system for 3D printing process: (a) structure of detection system; and (b) visual detection equipment.
Applsci 11 07961 g001
Figure 2. The construction process of the improved Gauss pyramid.
Applsci 11 07961 g002
Figure 3. AKAZE calculates feature direction.
Applsci 11 07961 g003
Figure 4. Fusing process of multiple feature matching points.
Applsci 11 07961 g004
Figure 5. Flow chart of Integrated SFM reconstruction.
Applsci 11 07961 g005
Figure 6. Image grouping principle of graph based AP clustering algorithm.
Applsci 11 07961 g006
Figure 7. Comparison of the feature point extraction results in the printing process. (a1a5) The original image of the printing process; (b1b5) The feature point extraction of the traditional SIFT algorithm; (c1c5) The feature point extraction of the FFT-SIFT algorithm.
Applsci 11 07961 g007
Figure 8. Three algorithms are used to extract the renderings of the feature points (a) Feature point extraction effect based on FFT-SIFT; (b) Feature point extraction effect based on the AKAZE; (c) Feature point extraction effect based on the FFT-SIFT-AKAZE algorithm.
Applsci 11 07961 g008
Figure 9. Feature point matching results based on three algorithms. (a) Feature points matching result based on the FFT-SIFT algorithm; (b) feature points matching result based on the AKAZE algorithm; and (c) feature points matching result based on the FFT-SIFT-AKAZE algorithm.
Applsci 11 07961 g009
Figure 10. The 3D reconstruction point cloud of traditional SIFT matching algorithm and the 3D reconstruction point cloud of FFT-SIFT-AKAZE. (a) The 3D reconstruction point cloud of traditional SIFT matching algorithm; and (b) the 3D reconstruction point cloud of FFT-SIFT-AKAZE.
Applsci 11 07961 g010
Figure 11. Captured images of 3D printing process. (a) Photo Gallery 1; (b) Photo Gallery 2.
Applsci 11 07961 g011aApplsci 11 07961 g011b
Figure 12. Sparse reconstruction results based on comprehensive SFM: (a) sparse reconstruction results of image set 1; and (b) sparse reconstruction results of image set 2.
Applsci 11 07961 g012
Figure 13. Part of the images collected during 3D reconstruction.
Applsci 11 07961 g013
Figure 14. Accuracy analysis of reconstruction results.
Applsci 11 07961 g014
Table 1. Comparison of the feature points extraction by the different algorithms.
The Sequence Number of the PictureThe Number of Feature Points ExtractedTime Consumption of SIFT Algorithm to Extract Feature PointsTime Consumption of Feature Points Extraction by FFT-SIFT Algorithm
a126344.31 s3.21 s
a219273.62 s2.87 s
a328794.43 s3.34 s
a420153.98 s3.12 s
a529604.51 s3.57 s
Table 2. Comparison of feature extraction time of different algorithms in the printing process.
The Image Set Corresponds to the Print ProgressTime Consumption of SIFT Algorithm to Extract Feature PointsTime Consumption of Feature Points Extraction by FFT-SIFT Algorithm
23%98.18 s74.91 s
36%99.54 s75.61 s
63%97.23 s73.37 s
85%102.35 s74.17 s
100%93.36 s70.25 s
Table 3. Comparison of different algorithms in the printing process.
Feature Extraction AlgorithmAverage Number of Feature Points ExtractedTime Consuming of Feature Point Extraction (s)Time Consuming of Feature Point Matching (s)Average Matching Number of Feature Points
FFT-SIFT2578.273.6724.89263.5
AKAZE1396.770.3916.67215.1
The algorithm in this paper3974.975.3525.58453.3
Table 4. Comparison of efficiency and accuracy of three SFM algorithms.
The Print Progress of the Photo CollectionTI (s)eITG (s)EGTH (s)eH
23%97.380.5857××73.280.6384
36%108.810.552755.310.918366.540.5946
63%113.530.567954.320.884171.850.5594
85%119.730.5879××67.230.6487
100%138.200.593159.730.935472.160.6197
Publisher’s Note: MDPI stays neutral with regard to jurisdictional claims in published maps and institutional affiliations.

