Article

Dosimetric Evaluation in Micro-CT Studies Used in Preclinical Molecular Imaging

by
Alexis N. Rueda
1,2,
César Ruiz-Trejo
3,
Eduardo López-Pineda
3,
Mario E. Romero-Piña
2 and
Luis A. Medina
2,3,*
1
Facultad de Ciencias, Universidad Nacional Autónoma de México, Coyoacán, Ciudad de México 04510, Mexico
2
Unidad de Investigación Biomédica en Cáncer, INCan/UNAM, Instituto Nacional de Cancerología, Tlalpan, Ciudad de México 14080, Mexico
3
Instituto de Física, Universidad Nacional Autónoma de México, Coyoacán, Ciudad de México 04510, Mexico
*
Author to whom correspondence should be addressed.
Appl. Sci. 2021, 11(17), 7930; https://doi.org/10.3390/app11177930
Submission received: 20 July 2021 / Revised: 23 August 2021 / Accepted: 25 August 2021 / Published: 27 August 2021
(This article belongs to the Special Issue Applications to Biophysics and Medical Physics)

Abstract

:

Featured Application

Dosimetry in preclinical microCT studies.

Abstract

In microCT imaging, there is a close relationship between the dose of radiation absorbed by animals and the image quality, or spatial resolution. Although the radiation levels used in these systems are generally non-lethal, they can induce cellular or molecular alterations that affect the experimental results. Here, we describe a dosimetric characterization of the different image acquisition modalities used by the microCT unit of the Albira microPET/SPECT/CT scanner, which is a widely used multimodal imaging system in preclinical research. The imparted dose at the animal surface (IDS) was estimated based on Boone’s polynomial interpolation method and experimental measurements using an ionization chamber and thermoluminescent dosimeters. The results indicated that the imparted dose at surface level delivered to the mice was in the 30 to 300 mGy range. For any combination of current (0.2 or 0.4 mA) and voltage (35 or 45 kV), in the Standard, Good, and Best image acquisition modalities, the dose imparted at surface level in rodents was below its threshold of deterministic effects (250 mGy); however, the High Res modality was above that threshold.

1. Introduction

MicroCT systems used in preclinical research as non-invasive systems allow the three-dimensional imaging of small animals (typically mice and rats) in order to evaluate human disease models [1]. These systems operate under the same principle as a CT system for clinical use, i.e., the three-dimensional reconstruction of a set of two-dimensional images (the projections) of the body’s cross-section, around which the system rotates [2]. In microCT imaging, there is a close relationship between the dose of radiation absorbed by animals and the image quality, or spatial resolution (typically 50–100 µm), and contrast [3,4,5] with different acquisition protocols.
During the last decade, molecular imaging techniques in the preclinical environment have been widely recognized as tools that can be used to visualize, characterize, and quantify non-invasively the biological processes and phenomena that occur at molecular and cellular levels inside living small animal models [5,6]. Many preclinical multimodal systems, mainly based on SPECT, PET, and CT imaging techniques, have been developed and made commercially available for the performance of research and also have the potential to be applied in a clinical setting. In these systems, microCT has been chiefly used to provide morphological information for the obtainment of the spatial localization of the radiotracer distribution within the body. Depending on its spatial resolution, some microCTs also monitor local changes in bone structure and composition. A critical concern in these multimodal imaging systems is the ionizing radiation dose received by the animals. Although radiation levels used in these systems are generally non-lethal, they could affect protein expression or cause significant DNA damage [6] and other alterations that may interfere with experimental results in small animals [6,7]. For this reason, it is essential to know the radiation dose imparted during microCT studies.
The Albira microPET/SPECT/CT scanner (Bruker, Madrid, Spain) is a widely used multi-modal imaging system in preclinical research. In this system, microCT provides the anatomical information that is used to obtain the spatial localization of the radiopharmaceutical tracers that are used in functional positron emission tomography (PET) and single-photon emission computed tomography (SPECT) studies. The Albira’s manufacturer reports that the radiation dose imparted by microCT is at low risk of inducing deterministic effects (<250 mGy). However, when image acquisition involves a series of images of the same animals over time, or if multiple high-resolution images are required, then a dosimetric characterization of the microCT scanner is needed. This characterization is important mainly when Albira’s users or users of similar equipment types follow the preset parameters recommended by the manufacturer, which are based only on image quality, without considering the radiation dose received by the animals.
This study reports the procedures that were implemented for a dosimetric characterization of the different image acquisition modalities used in Albira’s microCT unit. This characterization included the calculation of the imparted dose at the animal surface based on Boone’s polynomial interpolation method [8,9,10] and experimental measurements using an ionization chamber and thermoluminescent dosimeters (TLD-100). Results were compared with the dosimetry values provided by the manufacturer [11].

2. Materials and Methods

2.1. The microCT Unit

The unit consists of a 50 kV microfocus X-ray tube with a focal spot size of 35 μm (Oxford Instruments XTF5011, X-ray Technologies Inc., Scotts Valley, CA, USA), a fixed tungsten (W) anode, and a 125 μm beryllium exit window. The added filtration is a 0.5 mm aluminum (Al) plate. The source’s maximum operation current is 1 mA, and it delivers a 22° cone radiation beam. The electron gun assembly is packaged inside a stainless-steel lead-lined tube that provides X-ray shielding to 0.25 mR/h at 5 cm [12]. A CsI(Tl) pixelated flat panel detector (Hamamatsu C7942) is used as the X-ray image sensor and is placed at a fixed distance from the source (425 mm). Both tube and detector rotate in synchrony around the subject; the X-ray source’s distance to the isocenter is 290 mm. The described geometry allows two FOVs: transaxial (80 mm) and axial (65 mm). The equipment is fully shielded against X-rays by achieving an integrated and fully enclosed shield of 1 mm lead and lead-shielding glass. At a distance of 10 cm from the surface of the housing, the maximum exposure arising from the X-ray is below 1 μSv/h. Furthermore, the X-ray tube can only be activated when all the equipment’s doors and covers are closed.
The manufacturer presets the CT acquisition configuration by combining the following parameters: tube voltage, filament current, and X-ray emission time (i.e., number of projections) during the study. Consequently, the system allows combinations between two voltage values, 35 kV (named Low Voltage) and 45 kV (High Voltage), with currents of 0.2 mA (named Low Dose) or 0.4 mA (High Dose). The combination of voltage and current with the modality (number of projections) determines the “quality” of the image; the nominal number of projections (views) of the μCT unit are 270 (named Standard), 420 (Good), 600 (Best), and 1000 (High Res). The microCT unit can also obtain conventional radiographic (2D) images with the same combination of these parameters.

2.2. Theoretical Calculations

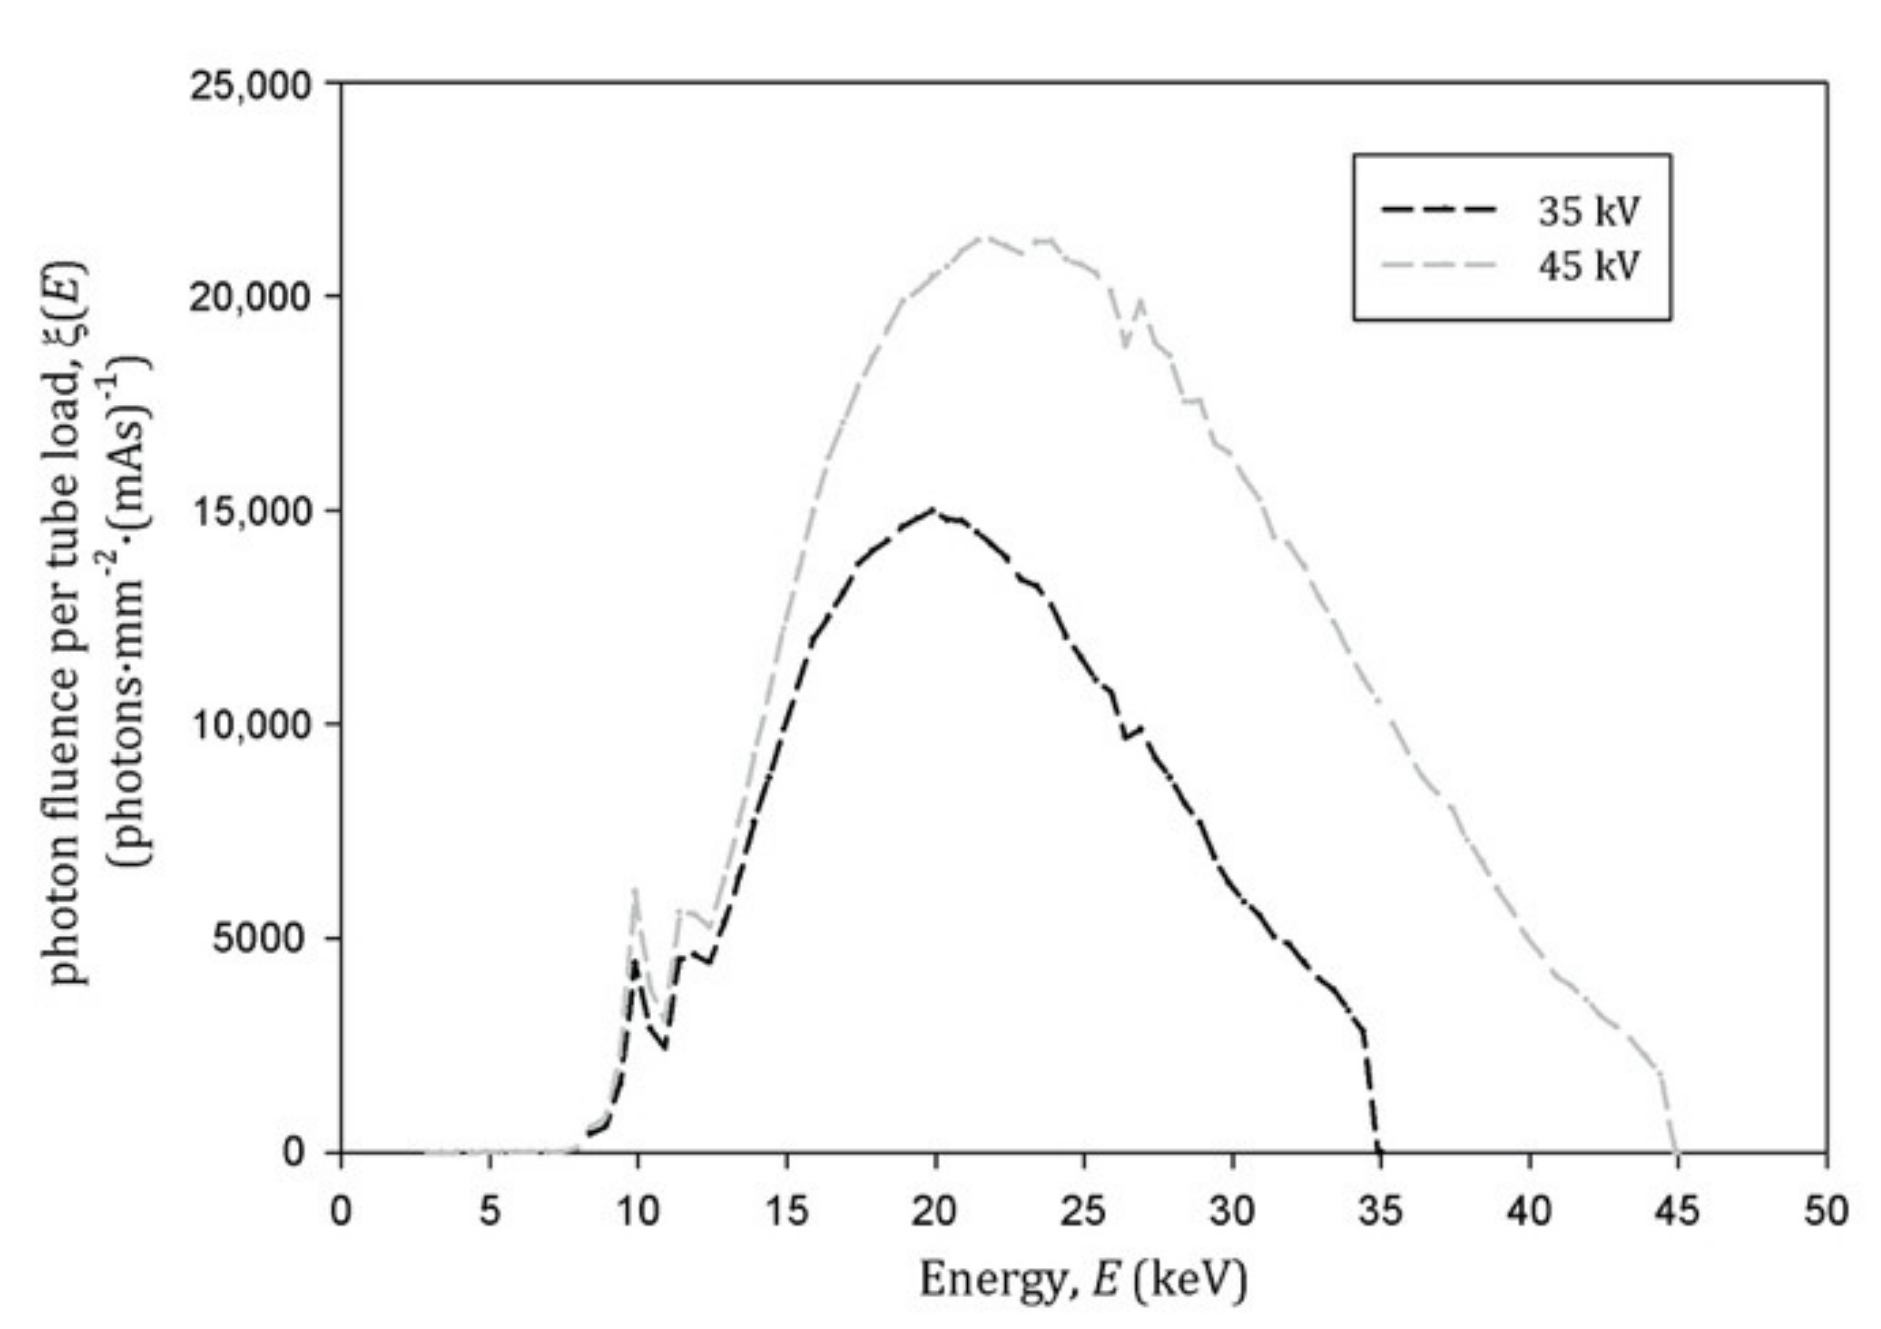
2.2.1. X-ray Spectra

The non-filtered X-ray spectra from the Apogee Series 5000 tube with W anode have been calculated previously [13]. Here, the spectrum was parameterized using Boone’s third-order polynomial expressions [8,9,10]. The interpolation coefficients reported by Moya et al. [1,13] were conveniently used to calculate the Albira’s X-ray spectra, generated at 35 and 45 kV. The output (ξ(E)) of each calculation represented a discrete distribution of the photon fluence (Φ(E)) (for each energy) that made up the spectrum, normalized by 1 mAs (i.e., ξ(E) = Φ(E) (mAs)−1) at 1 m from the tube window. Every ξ(E) of the spectrum was analytically filtered by 0.5 mm of aluminum, using its linear coefficients of attenuation, μAl(E), reported by the NIST [14].
Total air kerma and absorbed dose in air
By using the calculated X-ray spectral distributions at 35 and 45 kV, the total air kerma (Kair) at 1 m was calculated, and the total air kerma per mAs (Γ(E)) was estimated using:
Γ E = K a i r E m A s = κ E m i n E m a x ξ E μ t r E ρ a i r E d E   ,
where (μtr(E)/ρ)air is the mass energy-transfer coefficient for air; Emin and Emax integration limits correspond to the X-ray spectrum’s minimum and maximum energy values, respectively, and κ = 1.602 × 10⁻¹¹ Gy kg/eV is a unit-conversion factor. For a known X-ray spectrum, the Γ(E) expression means that the total air kerma can be calculated by integrating its spectral distribution. Since the simulated spectra are discrete distributions, an integration method based on the composite Simpson’s rule [15] was used. For typical diagnostic X-ray energies and material media of low atomic number Z, (μen(E)/ρ) = (μtr(E)/ρ) [8,16,17]; then (μen(E)/ρ)air in the 2–50 keV range, reported by NIST [14], were plotted in 5 to 6 subintervals to obtain the curve of best fit for the distribution. The criterion used to determine the best fit was to consider those values with the correlation coefficient R2 closest to 1.0.
Assuming charged particle equilibrium (CPE) conditions: Kair = the total dose in the air (Dair), then Equation (1) was rewritten to calculate total air dose per mAs (ΓD(E)):
Γ D E = D a i r E m A s = κ E m i n E m a x ξ E μ e n E ρ a i r E d E  
where (μen(E)/ρ)air is the mass energy-absorption coefficient. To estimate the Dair(E) (mAs)−1, the (μen(E)/ρ)air was obtained from the NIST, combined with those reported by Buhr et al. [16], and then plotted and adjusted in the same way as mentioned above. The results were used to interpolate the (μtr(E)/ρ)air and (μen(E)/ρ)air values for those energy values that make up the X-ray spectra.
Total absorbed dose in the air at isocenter
The following expression was used to calculate Dair at the isocenter of the microCT unit:
D a i r S I D , mAs = F S I D F mAs D a i r mAs ,
This expression considers the source-isocenter distance (SID = 290 mm), as well as the effects of the current on the cathode and the time during which it irradiates the object of study (mAs), where FSID = (1/SID)2 indicates the correction factor by the beam decreasing intensity with the square of the distance and FmAs = I t, with I, the current filament (in units of mA) and t, the irradiation time (in seconds) during the tomographic study.

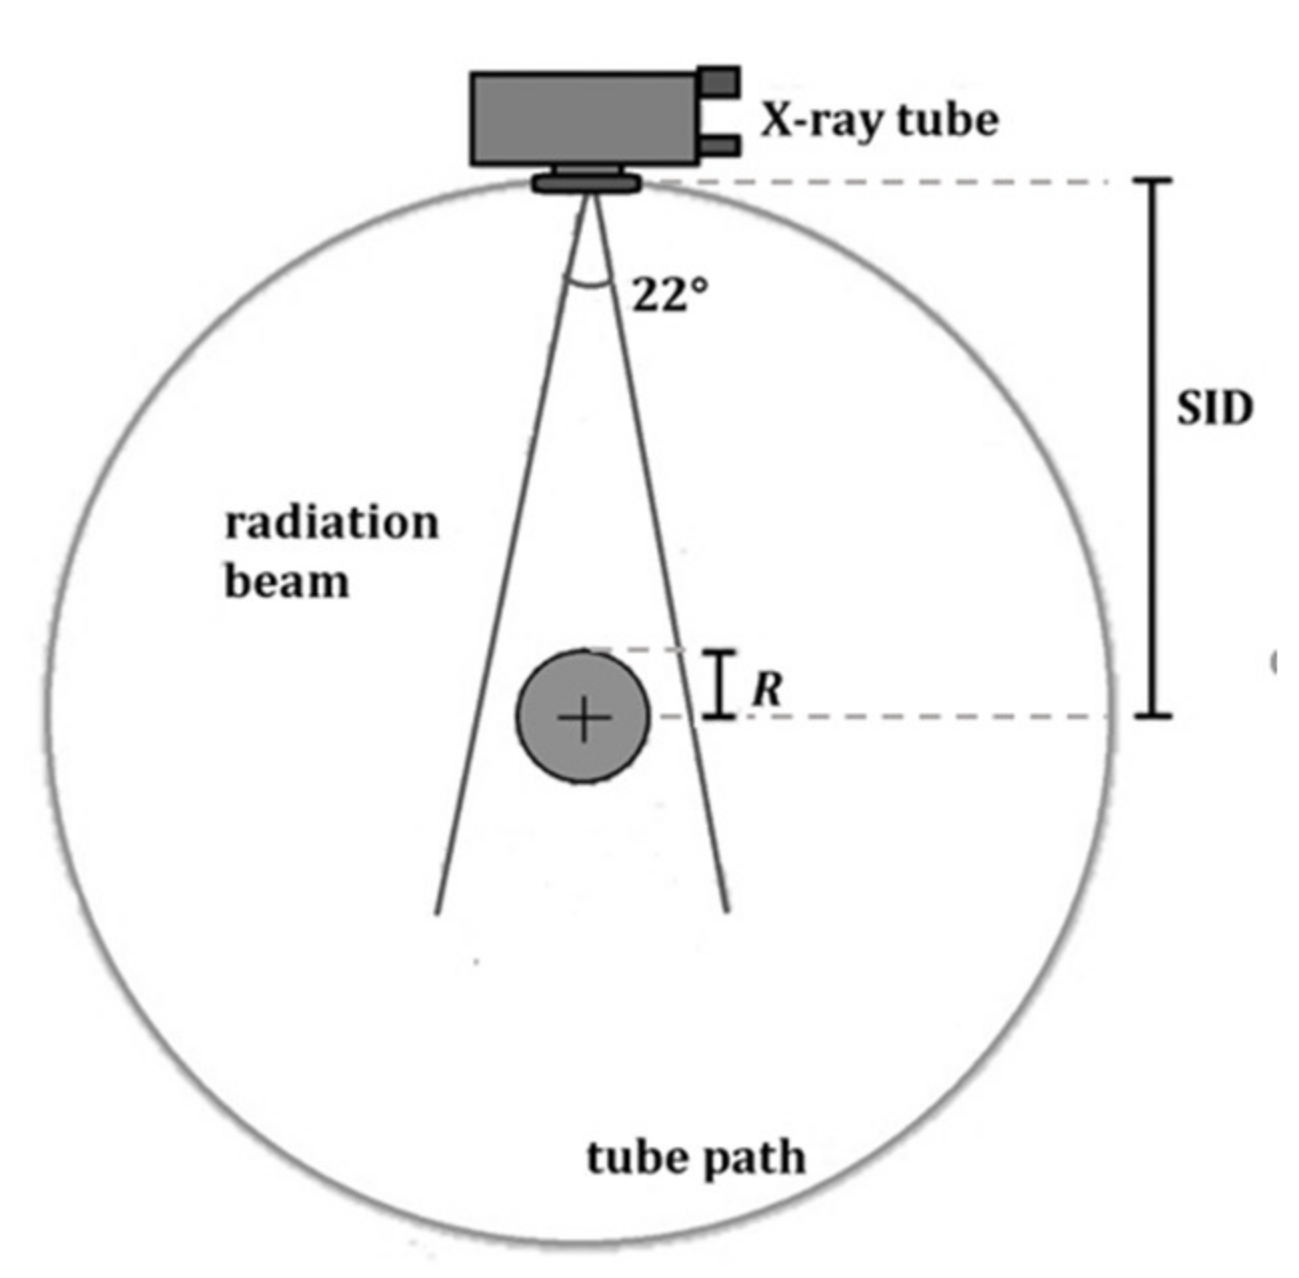
2.2.2. Imparted Dose at Surface

A theoretical phantom was included in the calculation to estimate the radiation’s Imparted Dose at the Surface (IDS) of the animals during the tomographic study. This phantom consisted of a water cylinder with a diameter similar to a typical experimental mouse; thus, the IDS was defined as the absorbed dose in water (Dw) by the theoretical phantom. For the calculations, the phantom’s geometrical center in the transversal plane coincided with the axis of rotation of the CT unit (the isocenter), as illustrated in Figure 1. In this geometry, FSID = (1/(SID-R))2 with R = 15 mm (the cylinder radius).
For a poly-energetic X-ray beam, Dw = τ Dair [17], where τ is in turn given by the following expression:
τ = E m i n E m a x ξ E μ e n E ρ w d E   E m i n E m a x ξ E μ e n E ρ a i r d E   .
The (μen(E)/ρ)w, for each energy at the X-ray spectra, generated at 35 or 45 kV, were calculated by interpolation from the fitting functions obtained via a similar procedure to that performed to obtain the (μen(E)/ρ)air as was described previously. The integrals in Equation (4) were calculated by numerical integration and the composite Simpson’s rule.
In this way, IDS (without considering backscattering) was calculated on the phantom’s surface as:
I D S = D w = τ · D a i r
Uncertainties were calculated by the propagation of the numerical calculations [18,19,20].

2.3. Dosimetric Measurements

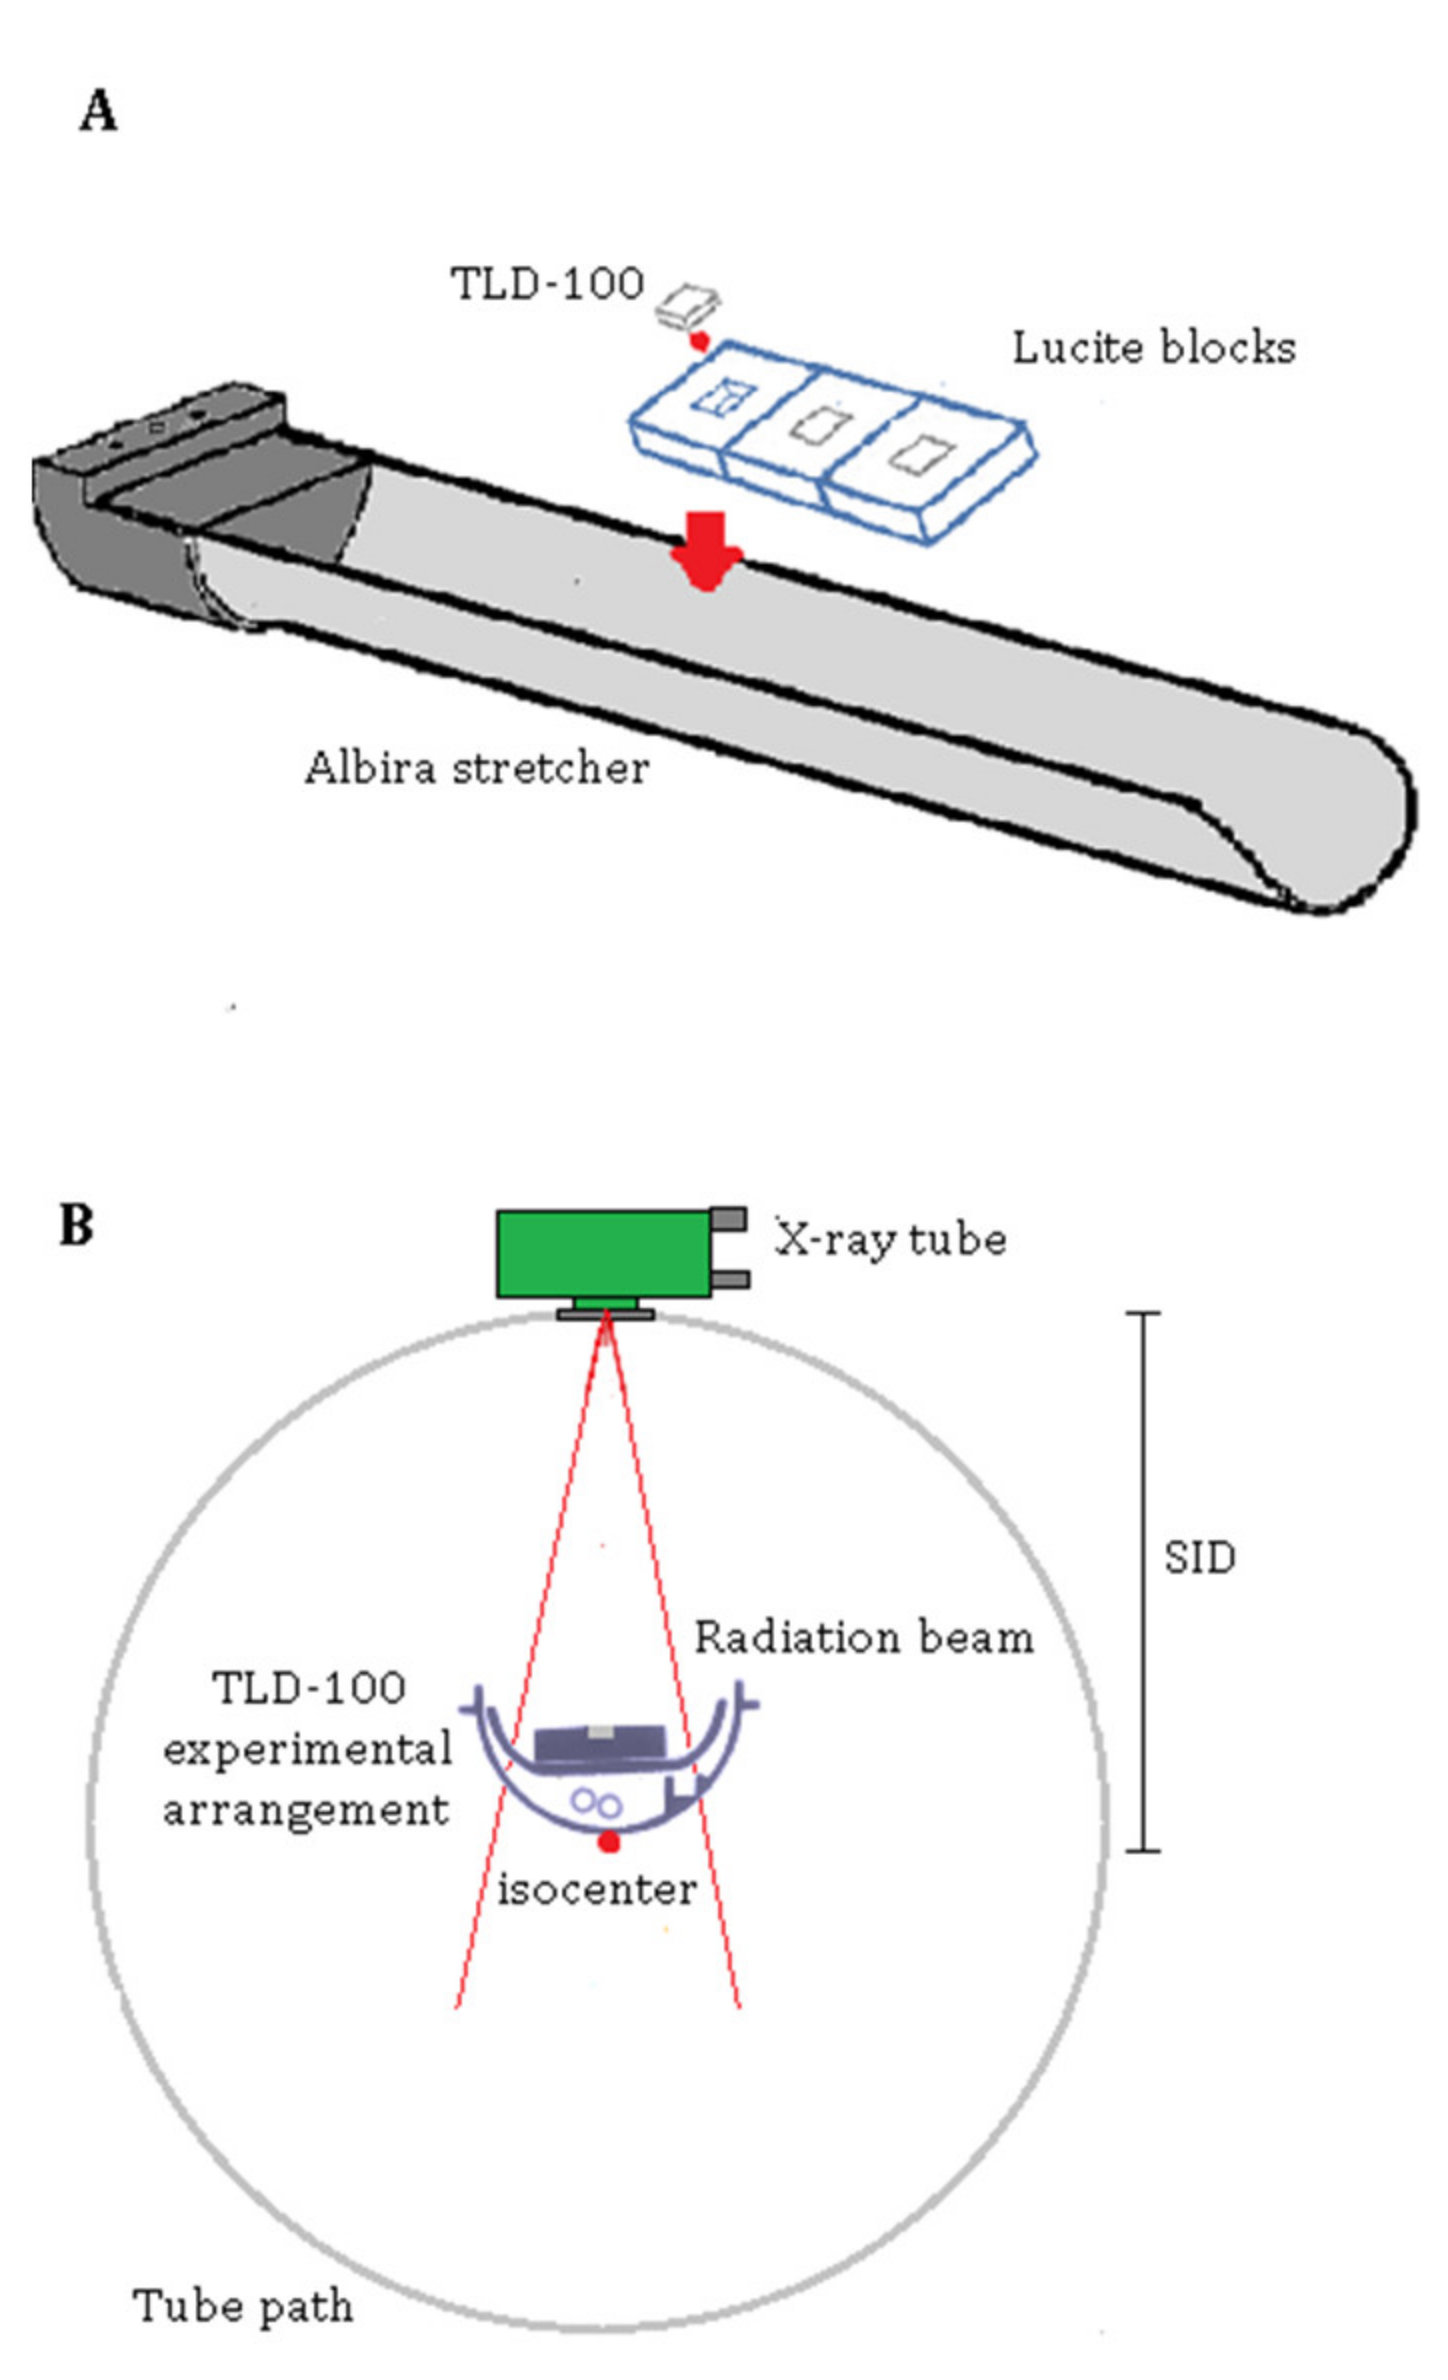
2.3.1. Thermoluminescent Dosimetry Procedures

Thermoluminescent chips (TLD-100) (Harshaw/Bicron, Newbury, OH, USA) (3.2 × 3.2 × 0.89 mm3) were used. Dosimeters were annealed in air at 400 °C for 1 h followed by 2 h annealing at 100 °C. After each annealing, they were rapidly cooled (≈75 °C min−1) to room temperature. A TL reading was performed no more than 72 h after irradiation, in a nitrogen atmosphere using a Harshaw model 3500 reader, at a heating rate of 10 °C s−1, ranging from 10 to 300 °C. The glow curve data (TL-signal) area was used to determine the absorbed dose through a calibration curve.
The TLDs were calibrated in terms of absorbed dose to water using a 60Co external beam therapy system (Theratron Phoenix, Best Theratronics), with a dose rate (in water) of 538.2 mGy/min. Dosimeters were irradiated in a 100–500 mGy range under CPE conditions, using the cavities (with the exact dimensions of the TLD chips) of a lucite container covered with a 0.5 cm cap of the same material. Three dosimeters were used for each dose-point. A 10 × 10 cm2 field at an SSD of 80 cm was used during the irradiations, and a TMR (Tissue-Maximum Ratio) factor was used to correct dose depth distribution in TLDs. An energy dependence correction was performed, due to the TLD-100’s low-energy dependence, with 35–45 keV X-rays compared with the 1.25 MeV average energy of 60Co photons. The effective energy obtained from half-value layer (HVL) measurements for each X-ray beam quality was used to determine the energy dependence correction factors [21].

2.3.2. Half-Value Layer and Effective Energy

The X-ray tube’s HVL and effective energy (Eeff) were measured using a 6 cc ionization chamber (model 20X6-6M, Radcal) connected to an electrometer (2026C, Radcal), which automatically corrects readings of the effects of pressure and temperature. This chamber was calibrated in air kerma, with traceability to LCIE, in France [22]. The chamber’s sensitive area was centered at the FOV of the X-ray radiation field at 29 cm below the tube window (at the isocenter). Measurements were performed using the 2D-acquisition modality of the microCT unit for 35 and 45 kV voltages at either 0.2 mA or 0.4 mA.
Exposure measurements were taken as a function of aluminum thickness, using high purity (3N) aluminum sheets (10 × 10 cm2, 0.1 mm thickness) (Lot Q15684, ESPI Metals). These sheets were placed on the window of the X-ray tube. Air kerma was calculated as: Kair(mGy) = 0.00876 mR [17]. For the 35 kV beam, the air kerma measurements were acquired by adding 0.1 mm aluminum sheets in a range of 0–0.5 mm, while for the 45 kV beam, the measurements were taken in a range of 0–0.6 mm; all measurements were in quadruplicate. Given the polychromatic nature of an X-ray beam, the distribution of the exposure values (X) as a function of the filter thickness (s) does not fit a first-order decreasing exponential function, as in the case of a monoenergetic beam, but rather an exponential function of order n > 1, i.e., a sum of n decreasing exponentials [23,24]. Consequently, HVL estimation, measured in mm of aluminum, was calculated using the following equation [25,26]:
HVL = s b ln 2 K a K 0 s a ln 2 K b K 0 ln K a K b ,
where K0 corresponds to the average air kerma measured without added filtration, Ka is the average kerma, which is slightly greater than half of K0 and is obtained at a filtration thickness of sa, and Kb is the average kerma, slightly less than half of the K0 obtained at an sb thickness. The uncertainty associated with the HVL was calculated as:
δ HVL = s b HVL K a δ K a 2 + s a HVL K b δ K b 2 + s b s a K 0 δ K 0 2 + L ( δ s ) 2 ln K a K b
with δKa, δKb, and δK0 as the standard deviations for the respective average kerma, δs as the standard deviation associated with the aluminum thickness (reported by the manufacturer as 5% of the nominal thickness value), and L expressed as:
L = ln 2 K a K 0 2 + ln 2 K b K 0 2
The aluminum’s effective linear attenuation coefficients (µAl) were first estimated from the HVL measurements used to calculate the X-ray beam’s effective energy (Eeff). In this way, the relationship between both quantities was µAl = ln(2)/HVL [2]. These values were interpolated into a standard curve of effective energy as a function of the linear attenuation coefficient of aluminum in the energy range 13.5–18.8 keV, obtained from the values reported by the NIST [14].

2.3.3. Imparted Dose at Surface Measured by TLD

The IDS was determined for the different combinations of the tomographic acquisition described previously. The TLDs were arranged in a lucite block (20 × 20 × 5 mm3), in a side-by-side formation along the stretcher centered within the FOV (Figure 2A). Since the maximum range (RCSDA) of the charged particles (electrons) released by the X-ray interacting with the lucite is not greater than 4.43 μm [27,28], the upper surface of the block was not cover with lucite; it was assumed that the thickness of the lucite block around the TLDs was sufficient to achieve CPE conditions. The radiation effects/corrections due to the angle of incidence in the dosimeters were not considered because of the ideal simulating conditions of tomographic irradiation: a point source, a homogeneous radiation beam, isotropic irradiation, and a circular and equidistant trajectory source (Figure 2B).
The bodies of dead adult mice (n = 5) (BALB/c strain) were used to evaluate the imparted dose at the experimental animals’ surface. Four TLDs were inserted subdermally into each animal, two in the posterior thoracic region and two in the lumbar region, on the hind legs’ flanks (Figure 3). The dosimeters were wrapped in Mylar plastic to avoid contamination by the animals’ bodily fluids. MicroCT images of each animal were acquired at different modalities, using the high-energy X-ray spectrum from 45 kV at 2 or 4 mA (see Table 1). After imaging, TLDs were withdrawn from the animals, and their reading was performed to obtain the TL signal. The calibration curve (Dw vs. TL-signal) was used to calculate the average IDS in each animal.

2.3.4. Statistical Analysis

The results were expressed as the mean ± SD (standard deviation). One-way analysis of variance (ANOVA) was used to evaluate inter-group differences. Significance was assumed at p < 0.05.

3. Results

3.1. Analytical Results

Figure 4 shows the analytically attenuated X-ray fluence spectra (at 35 and 45 kV) obtained with Boone’s parameterization method. Both spectra show the attenuation peaks of the Boone’s L-lines (at 8.4, 9.4, and 11.4 keV) by 0.5 mm Al.
Table 2 shows the values for the total air kerma per mAs (Γ(E)) and the total air dose per mAs (ΓD(E)) performances of the Apogee tube at isocenter (290 mm away from the source) at 35 and 45 kV.
The air-to-water dose conversion factor (τ) for X-rays at 35 and 45 kV is presented in Table 3. This value allows the analytical estimation of the radiation-imparted dose at the surface (IDS) of experimental animals during a computed tomographic study with specific parameters of acquisition (kV, mAs, and modality).
For this analytical model, a mouse was theoretically simulated as a water cylinder, with a diameter of 24 mm (R = 12), which results in FSID = (1/(SIDR))2 = 12.9. The resultant IDS is presented in Table 4 (dose contributions due to backscattered radiation were not considered in these calculations).

3.2. Dosimetric Results

Figure 5 shows the calibration curve (Dw vs. TLS) used to evaluate the absorbed dose measured with the TLD-100. This curve was obtained from the average TL signal of the TLD-100 dosimeters after the surfaces’ irradiation with 60Co at different doses (0 to 500 mGy); the result indicated that the absorbed dose was linear with TL-signal (TLS) (R2 = 0.9999). The energy dependence correction factors used with this curve were Fc(35 kV) = 0.91 ± 0.10 and Fc(45 kV) = 0.86 ± 0.06.
Half-value layers (HVL), effective linear attenuation coefficients (µAl), and effective energies (Eff) values for the different combinations of voltage and filament current in the X-ray tube are presented in Table 5; no statistical differences between values with the same kV were observed. The average value of the effective energy of the X-ray beam was calculated from these data as 14.5 ± 0.9 keV for 35 kV and 16.6 ± 0.6 keV for 45 kV.
Table 6 shows the IDS measured in the lucite block for X-rays generated at 35 and 45 kV, each combined with currents of 0.2 and 0.4 mA in the Standard, Good, and Best acquisition modalities. Results were corrected using the inverse-square effect on the distance (from 290 mm to 278 mm) to make them compatible with the measurements from the surface of the mice. As was expected, IDS was proportional to the mAs value.
The IDS of mice at the highest tube potential of the X-ray beam (i.e., at 45 kV) is presented in Table 7, and the IDS reference values provided by the equipment manufacturer are in Table 8.
The manufacturer does not report dose values for 35 kV or describe any experimental arrangement or methodology for its dosimetric evaluation, but it asserts that measurements (for which there are no associated uncertainties) were also performed using TLD-100 dosimeters. Figure 6A compares the IDS measured and estimated (theoretically) for the 45 kV and 0.2 mA at the different microCT acquisition modalities. Notice similitude values obtained by the theoretical estimation and measurements at the mice surface and the values reported by the manufacturer, and measurements with the TLD in the lucite block. Finally, Figure 6B shows the IDS measured and estimated for 45 kV and 0.4 mA in the Standard acquisition modality.

4. Discussion

Several investigators have reported different experimental procedures using ionization chambers, Gafchromic films, implanted thermoluminescence dosimeters (TLDs), and Monte-Carlo-based simulations and analytical calculations to determine the received dose in rodents during preclinical studies that use microCT imaging [29,30,31,32]. However, there are no accepted methods, guidelines, or regulations defining a unified parameter for microCT dose. Some researchers have adapted the computed tomography dose index (CTDI) used in the clinic as a metric to quantify the radiation output from a microCT examination [29,31]. We chose the imparted dose at the surface (IDS) as the dosimetric parameter to estimate the dose received by the animals used in microCT studies. This decision considers the limitations in the availability of the pencil ionization chambers and phantoms needed to measure the CTDI in microCT acquisitions, but mainly because of the belief that that CTDI estimates the absorbed dose in patients, as opposed to quantifying the radiation output of CT systems [33].
The analytical model presented here was implemented specifically for the Albira system. However, if the spectra of other X-ray tubes are known (or can be estimated) together with the characteristics of the tomographic acquisition geometry, a similar model can be easily implemented for the imparted dose assessment of other microCT systems. The IDS results estimated by the analytical model and measured with the TLDs implanted in the animals were in good agreement, indicating the validity and utility of the analytical calculations. By contrast, results from TLDs at the lucite block were not representative of the dose delivered at the surface of the animals submitted for tomographic study. It was assumed that this experimental arrangement did not satisfy the animal irradiation conditions, particularly the shape and dimensions of the animals and, likely, the measurements reported by the manufacturer do not satisfy this condition either. Previous works have reported that the Apogee’s X-ray tube output per mAs has a linear behavior in terms of voltage, so for a fixed voltage, its effective energy (Eff) is independent of the filament current and exposure time. We also observed no differences in Eff at 0.2 and 0.4 mA at either 35 or 45 kV. Differences between our measurements and the Eff calculated or measured by other researchers [1,7,9] are around 10%, depending on the analytical calculation or the experimental setting parameters. In any case, our Eff average values of 14.5 keV for 35 kV and 16.6 keV for 45 kV are representative of Albira’s microCT.
Knowing the radiation dose received by the animals that might result in biological effects is critical to designing longitudinal studies (of the same animal over time). Albira’s manufacturer has reported a total dose of 13.7 cGy in mice after a representative microPET/SPECT/CT study [12]. The total dose corresponds to the injection of 37 MBq (1 mCi) of 99mTc-MDP (resulting in 1.7 cGy dose), a CT scan operating at 45 kV, 400 μA, and 600 views in 7 min (10 cGy dose), and 3.7 MBq of Na18F (2 cGy dose). However, the present study’s results showed an IDS of 22.3 cGy for the same acquisition modality (Best, i.e., 600 views), two times higher. The highest dose comes from the CT scan, which makes it necessary to characterize the performance of this equipment in terms of the radiation dose resulting from the CT scan acquisitions (Standard, Good, Best, and High Res) to evaluate the possible biological effects of radiation associated with the CT scan while maintaining the best resolution achievable.
The imparted dose at surface delivered to mice during a tomographic study using the Albira’s microCT, at different image-quality settings and at the highest potential (i.e., 45 kV) of the X-ray tube, is in the 30 to 300 mGy range. This dose is below the lethal range, which is between 5.0 and 7.0 Gy [5]. However, the upper limit, which corresponds to High Res quality, is just above the threshold for deterministic effects in rodents (250 mGy), which can affect both DNA repair and the cell cycle [5,6,7,34]. Therefore, particular caution should be exercised when considering the use of this acquisition modality, since the imparted dose may interfere with the experimental outcome. The results of this study also show that for any combination of current and voltage, in Standard, Good, and Best modalities, the dose imparted to the surface level in rodents is below the threshold of deterministic effects. Besides the strain on the mice, other factors, such as age at exposure and health must be considered, since they also define the extent of the biological effects of exposure to X-ray radiation [5,6,7,34,35]. Therefore, cautious criteria should be used to optimize microtomography studies on the use of the Albira system to deliver sufficiently low doses of radiation to rodents without compromising image quality.

5. Conclusions

This study demonstrated a precise and reproducible analytical method for the estimatation of the imparted dose at the surface of rodents during a microCT study using the Albira system. For any combination of current (0.2 or 0.4 mA) and voltage (35 or 45 kV), in the Standard, Good, and Best image acquisition modalities, the dose imparted to the surface level in rodents was below the threshold of its deterministic effects (250 mGy); however, the High Res modality was just above the threshold. Estimating the IDS using our analytical model can help to plan tomographic studies involving different image modalities (SPECT and PET) and qualities with the Albira system.

Author Contributions

Conceptualization, L.A.M. and A.N.R.; methodology, A.N.R., C.R.-T., E.L.-P. and M.E.R.-P.; formal analysis, L.A.M. and A.N.R.; investigation, A.N.R., C.R.-T. and E.L.-P.; resources, L.A.M.; data curation, A.N.R. and M.E.R.-P.; writing—original draft preparation, A.N.R. and L.A.M.; writing—review and editing, L.A.M.; funding acquisition, L.A.M. All authors have read and agreed to the published version of the manuscript.

Funding

This research was partially funded by PAPIIT-UNAM IN-104919 and IN-106221 grants, and institutional resources were provided by the Instituto Nacional de Cancerología, México.

Institutional Review Board Statement

The procedures for the care and use of the animals were approved by a local institutional Scientific and Ethics Committee at INCan (017/027/IBI). All applicable institutional and governmental regulations were followed in accordance with the Federal Regulations for Animal Production, Care and Experimentation (NOM-062-ZOO-1999, Ministry of Agriculture, Mexico). The guidelines from the Guide for the Care and Use of Laboratory Animals of the National Institute of Health (NIH, USA) were also followed. All efforts were made to minimize animal suffering and to reduce the number of animals used in the experiments.

Informed Consent Statement

Not applicable.

Data Availability Statement

Not applicable.

Conflicts of Interest

The authors declare no conflict of interest. The funders had no role in the design of the study; in the collection, analysis, or interpretation of data; in the writing of the manuscript; or in the decision to publish the results.

References

  1. Moya, U.E.; Brandan, M.E.; Martínez-Dávalos, A.; Ruiz-Trejo, C.; Rodríguez-Villafuerte, M. Parametrization of X-ray spectra appropiate for microCT scanners. Nucl. Instrum. Methods Phys. Res. A 2010, 613, 152–155. [Google Scholar] [CrossRef]
  2. Bushberg, J.T.; Seibert, J.A.; Leidholdt, E.M.; Boone, J.M. The Essential Physics of Medical Imaging, 3rd ed.; Lippincott Williams & Wilkins: Philadelphia, PA, USA, 2012; pp. 315–317. [Google Scholar]
  3. Seguin, F.H.; Burstein, P.; Bjorkholm, P.J.; Homburger, F.; Adams, R.A. X-ray computed tomography with 50-µm resolution. Appl. Opt. 1985, 24, 4117–4123. [Google Scholar] [CrossRef] [PubMed]
  4. Stock, S.R. MicroComputed Tomography: Methodology and Applications, 2nd ed.; CRC Press: Boca Raton, FL, USA, 2019; pp. 45–56. [Google Scholar]
  5. Ford, N.L.; Thornton, M.M.; Holdsworth, D.W. Fundamental image quality limits for microcomputed tomography in small animals. Med. Phys. 2003, 30, 2869–2877. [Google Scholar] [CrossRef] [PubMed]
  6. Kersemans, V.; Thompson, J.; Cornelissen, B.; Woodcock, M.; Allen, P.D.; Buls, N.; Muschel, R.J.; Hill, M.A.; Smart, S.C. Micro-CT for anatomic referencing in PET and SPECT: Radiation dose, biologic damage, and image quality. J. Nucl. Med. 2011, 52, 1827–1833. [Google Scholar] [CrossRef] [PubMed] [Green Version]
  7. Boone, J.M.; Velazquez, O.; Cherry, S.R. Small-animal X-ray dose from micro-CT. Mol. Imaging 2004, 3, 149–158. [Google Scholar] [CrossRef] [PubMed]
  8. Boone, J.M. X-ray Production, Interaction, and Detection in Diagnostic Imaging. In Handbook of Medical Imaging, 1st ed.; Beutel, J., Kundel, H.L., Van Metter, R.L., Eds.; SPIE: Washington, WA, USA, 2000; Volume 1, pp. 1–78. [Google Scholar]
  9. Boone, J.M.; Seibert, A. An accurate method for computer-generating tungsten anode X-ray spectra from 30 to 140 kV. Med. Phys. 1997, 24, 1661–1670. [Google Scholar] [CrossRef] [PubMed]
  10. Boone, J.M.; Fewell, T.R.; Jennings, R.J. Molybdenum, rhodium, and tungsten anode spectral models using interpolating polynomials with application to mammography. Med. Phys. 1997, 24, 1863–1874. [Google Scholar] [CrossRef] [PubMed]
  11. Carrilero-López, V.; (Senior Nuclear Imaging Scientist/Radiological protection supervisor, Bruker BioSpin, Billerica MA, USA). Personal communication, 2018.
  12. Sánchez, F.; Orero, A.; Soriano, A.; Correcher, C.; Conde, P.; González, A.; Hernández, L.; Moliner, L.; Rodríguez-Alvarez, M.J.; Vidal, L.F.; et al. ALBIRA: A small animal PET/SPECT/CT imaging system. Med. Phys. 2013, 40, 051906-1–051906-11. [Google Scholar] [CrossRef] [PubMed]
  13. Apogee Tube, W Anode. Available online: http://www.fisica.unam.mx/~brandan/spectra/AW.pdf (accessed on 13 June 2021).
  14. Hubbell, J.H.; Seltzer, S.M. Tables of X-Ray Mass Attenuation Coefficients and Mass Energy-Absorption Coefficients, NIST Standard Reference Database 126; National Institute of Standards and Technology (NIST): Gaithersburg, MD, USA, 1995.
  15. Burden, R.L.; Faires, J.D.; Burden, A.M. Numerical Analysis, 9th ed.; Cengage Learning: Boston, MA, USA, 2010; pp. 202–211. [Google Scholar]
  16. Buhr, H.; Büermann, L.; Gerlach, M.; Krumrey, M.; Rabus, H. Measurement of the mass energy-absorption coefficient of air for X-rays in the range from 3 to 60 keV. Phy. Med. Biol. 2012, 57, 8231. [Google Scholar] [CrossRef] [PubMed]
  17. Johns, H.E.; Cunningham, J.R. The Physics of Radiology, 4th ed.; Charles, C., Ed.; Thomas: Springfield, IL, USA, 1983; pp. 270–290. [Google Scholar]
  18. Gardner, J.L. Uncertainties in Photometric Integrals; NMI Technical Report 9; NMI: Lindfield, NSW, Australia, 2005. [Google Scholar]
  19. Woolliams, E.R. Determining the Uncertainty Associated with Integrals of Spectral Quantities; European Association of National Metrology Institutes: Berlin, Germany, 2013. [Google Scholar]
  20. Bergman, R.; Paget, M.L.; Richman, E.E. CALiPER Exploratory Study: Accounting for Uncertainty in Lumen Measurements; No. PNNL-20320; Pacific Northwest National Lab (PNNL): Richland, WA, USA, 2011.
  21. Nunn, A.A.; Davis, S.D.; Micka, J.A.; DeWerd, L.A. LiF: Mg, Ti TLD response as a function of photon energy for moderately filtered x-ray spectra in the range of 20–250 kVp relative to Co60. Med. Phys. 2008, 35, 1859–1869. [Google Scholar] [CrossRef] [PubMed]
  22. López-Pineda, E.; (Laboratorio de Dosimetría, Instituto de Física, Universidad Nacional Autónoma de México, Mexico City, Mexico). Personal communication, 2019.
  23. Sosa, M.; Bernal-Alvarado, J.; Azorín, J.C.; Cuevas, A.C.; Córdova, T.; Mesa, F. Experimental and mathematical modeling of half-value layer measurements for x-ray equipment. Biomed. Eng. Appl. Basis Commun. 2016, 28, 1650019. [Google Scholar] [CrossRef]
  24. Bandalo, V.; Greiter, M.B.; Brönner, J.; Hoedlmoser, H. ISO 4037: 2019 validation of radiation qualities by means of half-value layer and Hp (10) dosimetry. Radiat. Prot. Dosim. 2019, 187, 438–450. [Google Scholar] [CrossRef] [PubMed]
  25. Wagner, L.K.; Archer, B.R.; Cerra, F. On the measurement of half-value layer in film–screen mammography. Med. Phys. 1990, 17, 989–997. [Google Scholar] [CrossRef] [PubMed]
  26. International Atomic Energy Agency. Quality Assurance Programme for Digital Mammography: International Atomic Energy Agency Human Health Series No. 17; International Atomic Energy Agency (IAEA): Vienna, Austria, 2011; p. 109. [Google Scholar]
  27. Attix, F.H. Introduction to Radiological Physics and Radiation Dosimetry, 1st ed.; John Wiley & Sons: New York, NY, USA, 1986; p. 185. [Google Scholar]
  28. McGregor, D.S.; Shultis, J.K. Radiation Detection: Concepts, Methods, and Devices, 1st ed.; CRC Press: Boca Raton, FL, USA, 2020; p. 746. [Google Scholar]
  29. Hupfer, M.; Kolditz, D.; Nowak, T.; Eisa, F.; Brauweiler, R.; Kalender, W.A. Dosimetry concepts for scanner quality assurance and tissue dose assessment in micro-CT. Med. Phys. 2012, 39, 658–670. [Google Scholar] [CrossRef] [PubMed]
  30. Carlson, S.K.; Classic, K.L.; Bender, C.E.; Russell, S.J. Small Animal Absorbed Radiation Dose from Serial Micro-Computed Tomography Imaging. Mol. Imaging Biol. 2007, 9, 78–82. [Google Scholar] [CrossRef] [PubMed]
  31. Meganck, J.A.; Liu, B. Dosimetry in Micro-computed Tomography: A Review of the Measurement Methods, Impacts, and Characterization of the Quantum GX Imaging System. Mol. Imaging Biol. 2017, 19, 499–511. [Google Scholar] [CrossRef] [Green Version]
  32. Taschereau, R.; Chow, P.L.; Chatziioannou, A.F. Monte Carlo simulations of dose from microCT imaging procedures in a realistic mouse phantom. Med. Phys. 2006, 33, 216–224. [Google Scholar] [CrossRef] [PubMed] [Green Version]
  33. McCollough, C.H.; Leng, S.; Yu, L.; Cody, D.D.; Boone, J.M.; McNitt-Gray, M.F. CT Dose Index and Patient Dose: They Are Not the Same Thing. Radiology 2011, 259, 311–316. [Google Scholar] [CrossRef] [PubMed] [Green Version]
  34. Mole, R.H. Quantitative observations on recovery from whole body irradiation in mice. I. Recovery after single large doses of radiation. Br. J. Radiol. 1956, 29, 563–569. [Google Scholar] [CrossRef] [PubMed]
  35. Stearner, S.P.; Tyler, S.A. Radiation Mortality in the Mouse: Model of the Kinetics of Injury Accumulation: I. Protracted Doses in the 30-Day Lethal Range. Radiat. Res. 1963, 20, 619–630. [Google Scholar] [CrossRef] [PubMed]
Figure 1. Diagram of the simulated geometry for the analytical model of the imparted dose at the surface (IDS). The theoretical phantom represents a water cylinder, the center of whose cross-section coincides with the microCT unit isocenter, and it was assumed that the radiation beam came from a point source.
Applsci 11 07930 g001
Figure 2. (A) The image shows a diagram of the experimental arrangement for surface dose evaluation. A set of three acrylic blocks, each with a niche to contain a TLD–100 crystal, was placed on the mouse stretcher of the Albira system. (B) The figure shows the circular path of the X-ray tube around the isocenter.
Applsci 11 07930 g002
Figure 3. The TLD-100 dosimeters’ locations under the rodent’s skin. The image corresponds to the three-dimensional reconstruction of one of the mice imaged in the microCT unit at 45 kV, 0.2 mA, in the Best modality.
Applsci 11 07930 g003
Figure 4. X-ray fluence spectra calculated with the polynomial interpolation coefficients reported by Moya et al. for tungsten anode. Both spectra were analytically attenuated by an added filtration of 0.5 mm Al. The L-lines at 8.4 and 9.4 keV appear as a single line because of the limited energy resolution.
Applsci 11 07930 g004
Figure 5. Calibration curve used to convert TLD-output into absorbed dose in water for 60Co photons.
Applsci 11 07930 g005
Figure 6. (A) Comparison of the imparted dose at surface (IDS) within the different microCT acquisition modalities. No statistical differences were observed between IDS0 vs. IDSTL or IDSms vs. IDST. (B) Comparison of the imparted dose at surface (IDS) within the Standard modality.
Applsci 11 07930 g006
Table 1. MicroCT image settings used for the experimental IDS measurements in mice.
45 kV X-ray Beam
Mouse IDModalityCurrent (mA)
1Standard0.2
2Good0.2
3Best0.2
4Standard0.4
5HR0.4
Table 2. Total air kerma per mAs (Γ) and total air dose per mAs (ΓD) performances of the Apogee X-ray tube at isocenter.
kV Γ   ±   δ Γ
(mGy/mAs)
Γ D   ±   δ D
(mGy/mAs)
350.76 ± 0.03 0.52 ± 0.01
451.27 ± 0.05 0.79 ± 0.01
Table 3. The air-to-water dose conversion factor (τ).
kV τ   ±   δ τ
351.07 ± 0.04
451.06 ± 0.04
Table 4. Imparted Dose at Surface theoretically calculated (IDST) for a cylindrical water phantom (24 mm diameter) for the different microCT parameters of imaging acquisition.
35 kV45 kV
0.2 mA0.4 mA0.2 mA0.4 mA
Modality I D S T   ±   δ I D S T   ( mGy ) I D S T   ±   δ I D S T   ( mGy )
Standard33 ± 166 ± 350 ± 2101 ± 4
Good52 ± 2103 ± 578 ± 3156 ± 6
Best74 ± 3148 ± 6112 ± 4223 ± 9
Table 5. HVL, μAl, and Eeff determined for different settings of voltage and current parameters in the X-ray tube.
SettingHVL (mm Al)µAl (mm−1)Eeff (keV)
35 kV, 0.2 mA0.27 ± 0.062.8 ± 0.513.9 ± 0.9
35 kV, 0.4 mA0.35 ± 0.072.0 ± 0.415.2 ± 1.2
45 kV, 0.2 mA0.42 ± 0.051.7 ± 0.216.2 ± 0.8
45 kV, 0.4 mA0.48 ± 0.071.4 ± 0.217 ± 1
Table 6. Imparted Dose at Surface measured in the lucite block (IDSTL) under CPE for the different kV and mAs settings and modalities of image acquisition.
35 kV45 kV
0.2 mA0.4 mA0.2 mA0.4 mA
ModalityIDSTL ± δIDSTL (mGy)IDSTL ± δIDSTL (mGy)
Standard42 ± 186 ± 767 ± 4125 ± 3
Good74 ± 4141 ± 2106 ± 3223 ± 7
Best111 ± 5219 ± 12167 ±1332 ± 8
Values are corrected by the corresponding energy dependence correction factor.
Table 7. Imparted Dose at the Surface of the mice (IDSms) at the 45 kV potential of the X-ray tube.
mAModalityIDSms ± δIDSms (mGy)
0.2Standard55 ± 8
0.2Good74 ± 4
0.2Best109 ± 17
0.4Standard89 ± 5
0.4HR298 ± 9
Values are corrected by the corresponding energy dependence correction factor.
Table 8. IDS0 reference values provided by the Albira’s manufacturer.
45   kV 0.2   mA 0.4   mA
ModalityIDS0 (mGy)
Standard80161
Good125250
Best179357
Publisher’s Note: MDPI stays neutral with regard to jurisdictional claims in published maps and institutional affiliations.

