
Optimal Configuration with Capacity Analysis of PV-Plus-BESS for Behind-the-Meter Application


Abstract
:1. Introduction
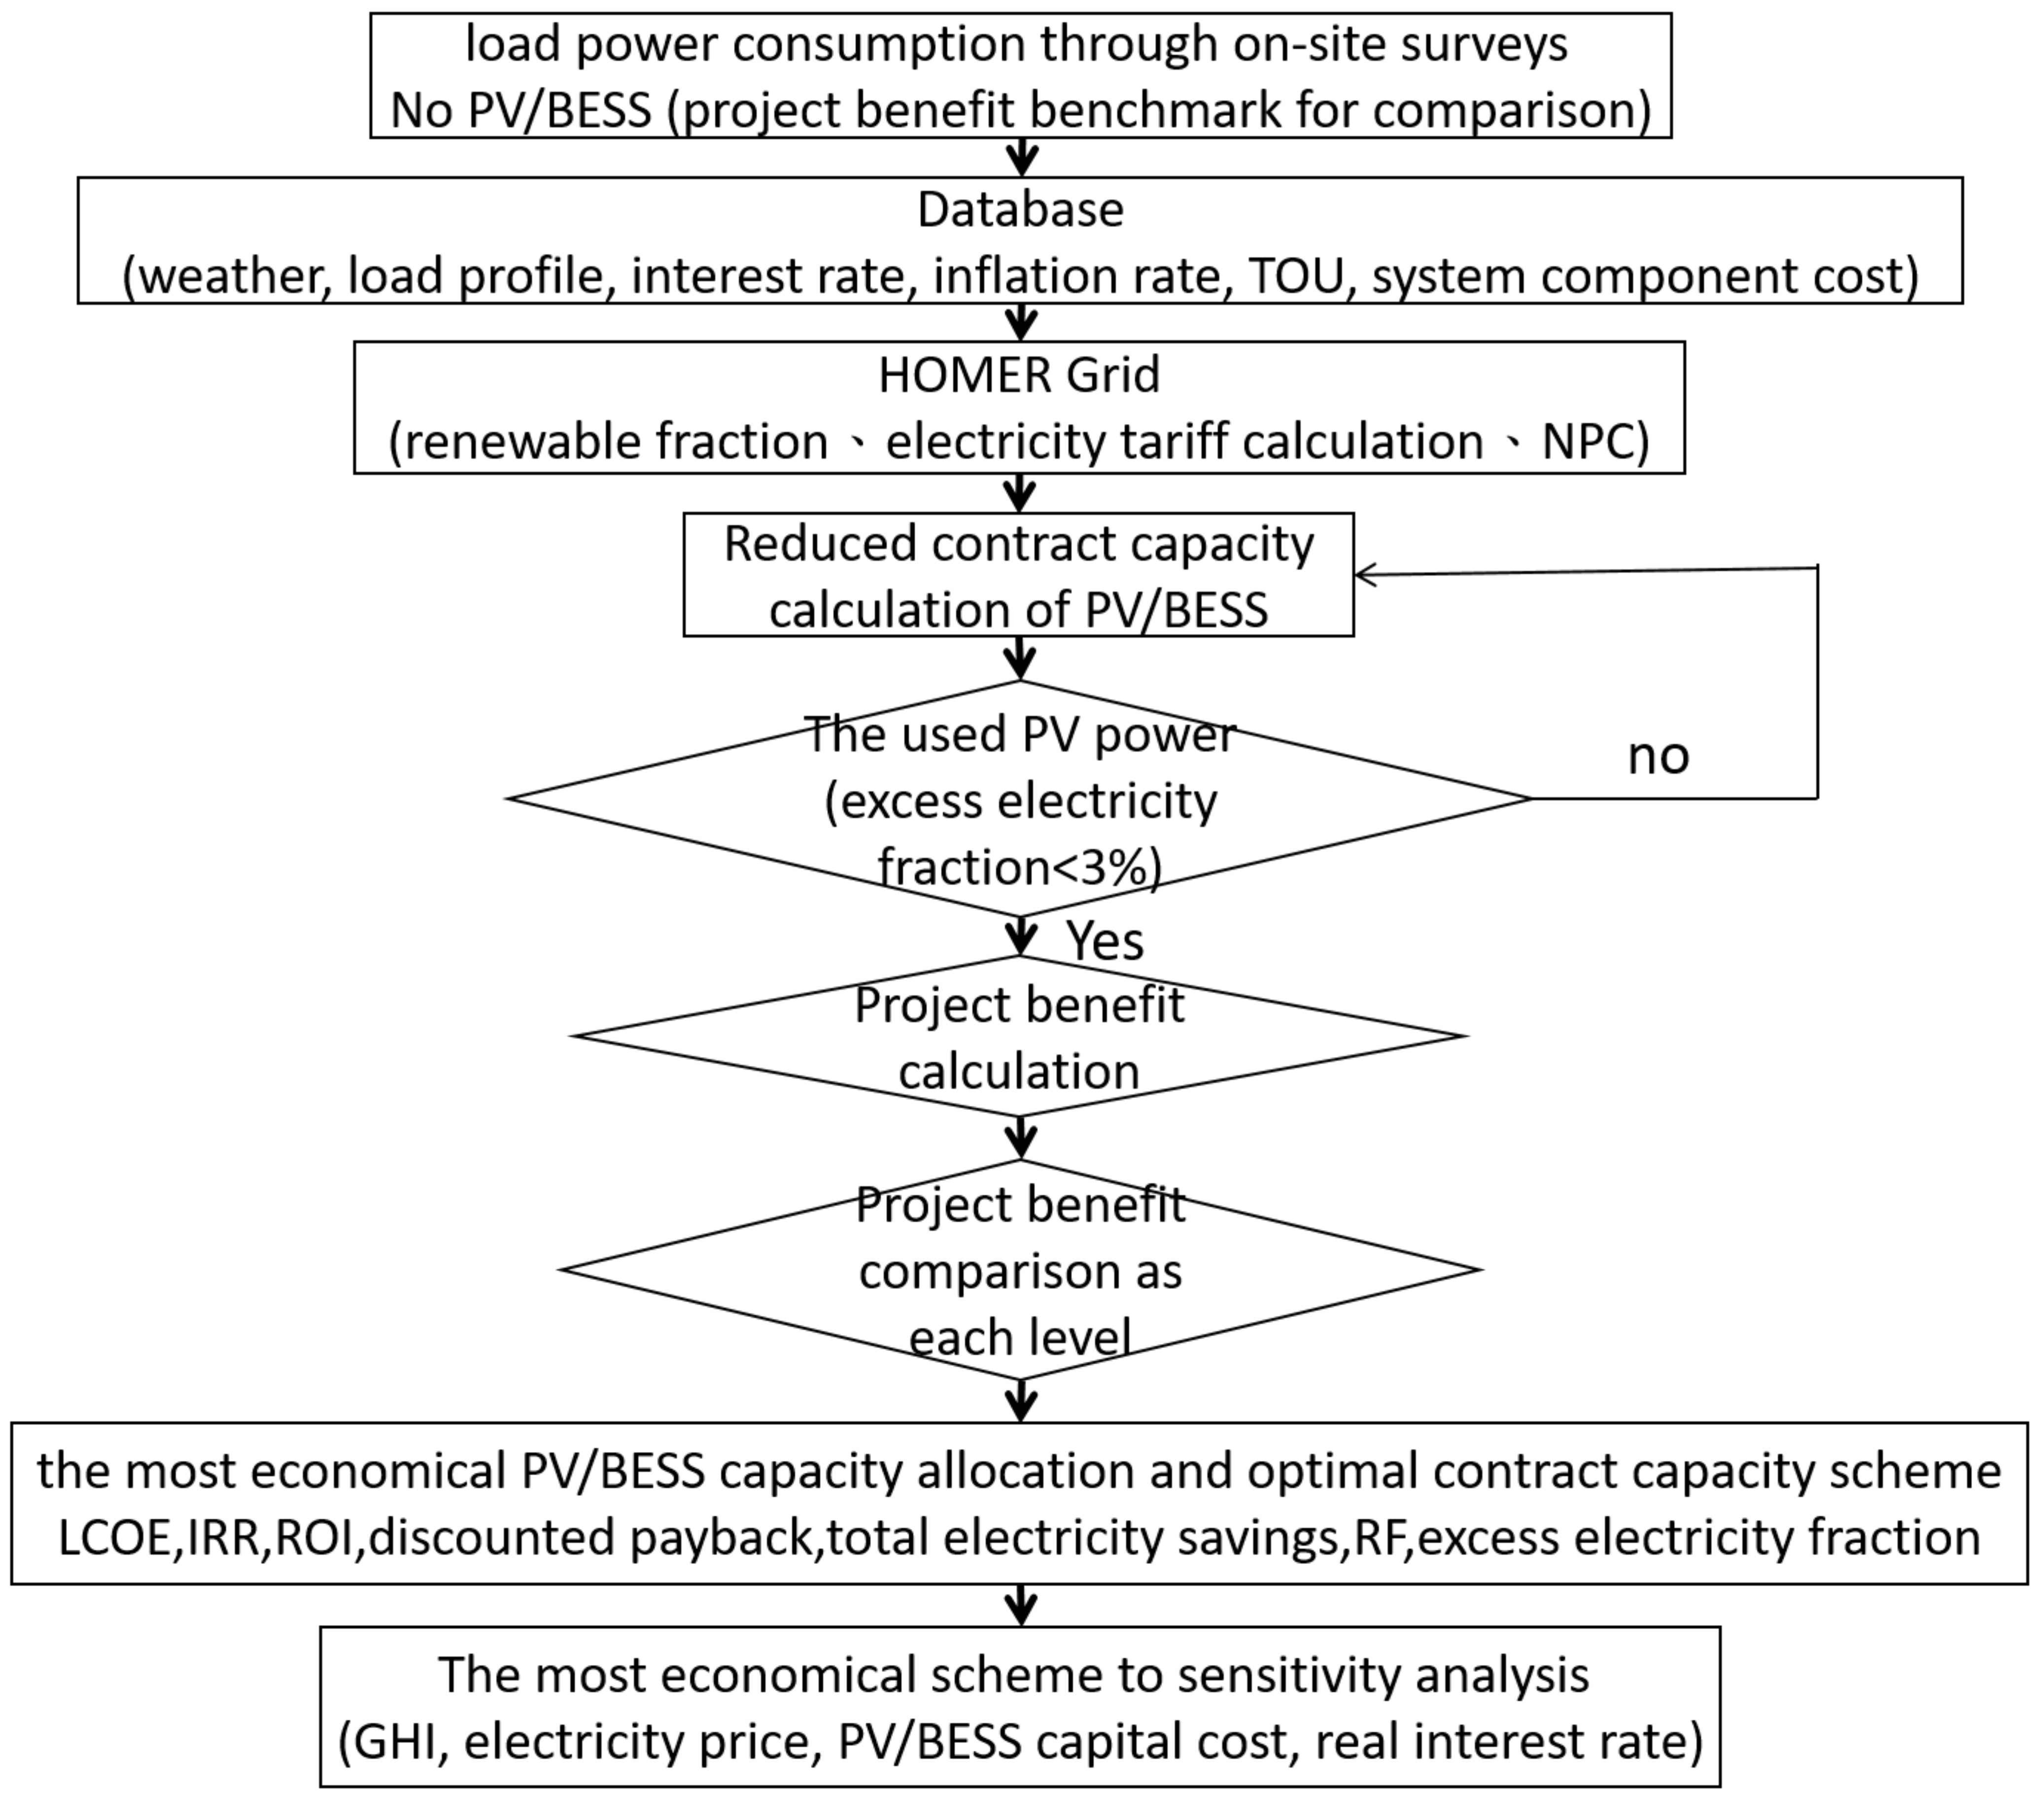
2. Methodology
2.1. Simulation Software Description
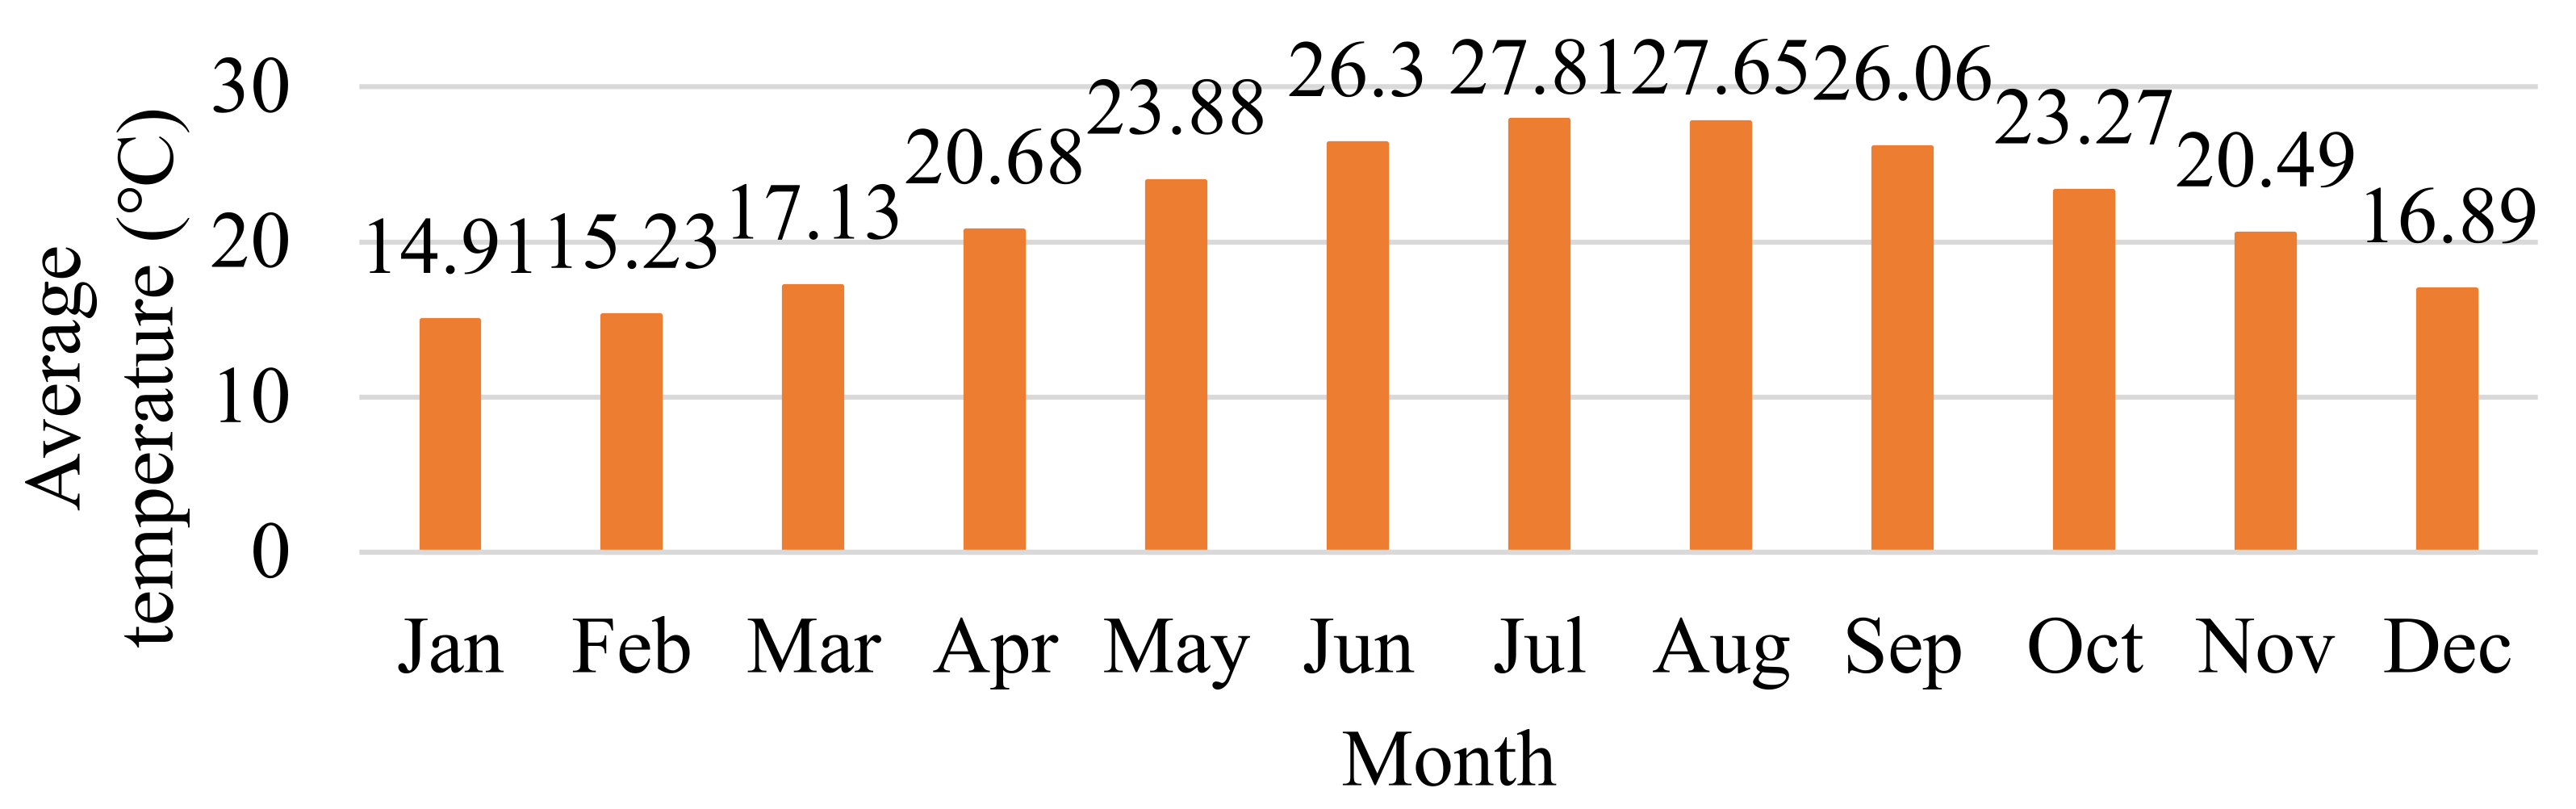
2.2. Weather Conditions
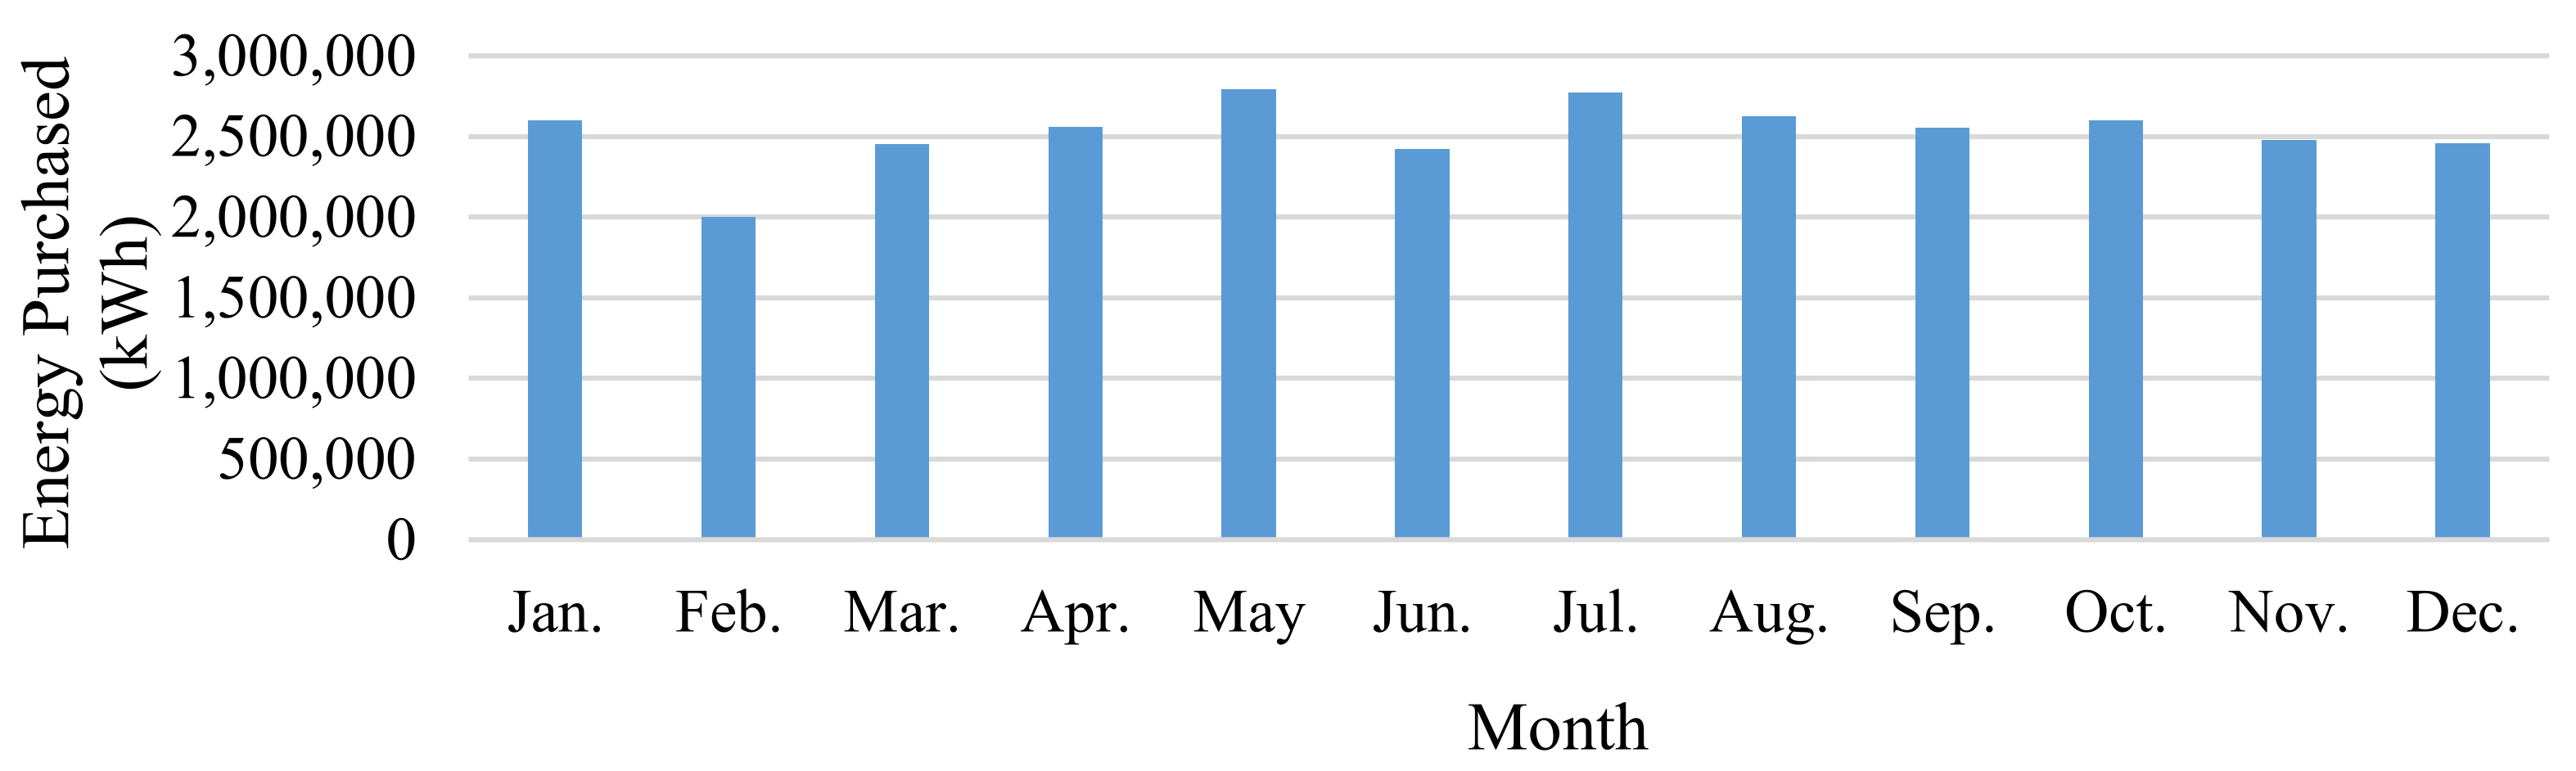
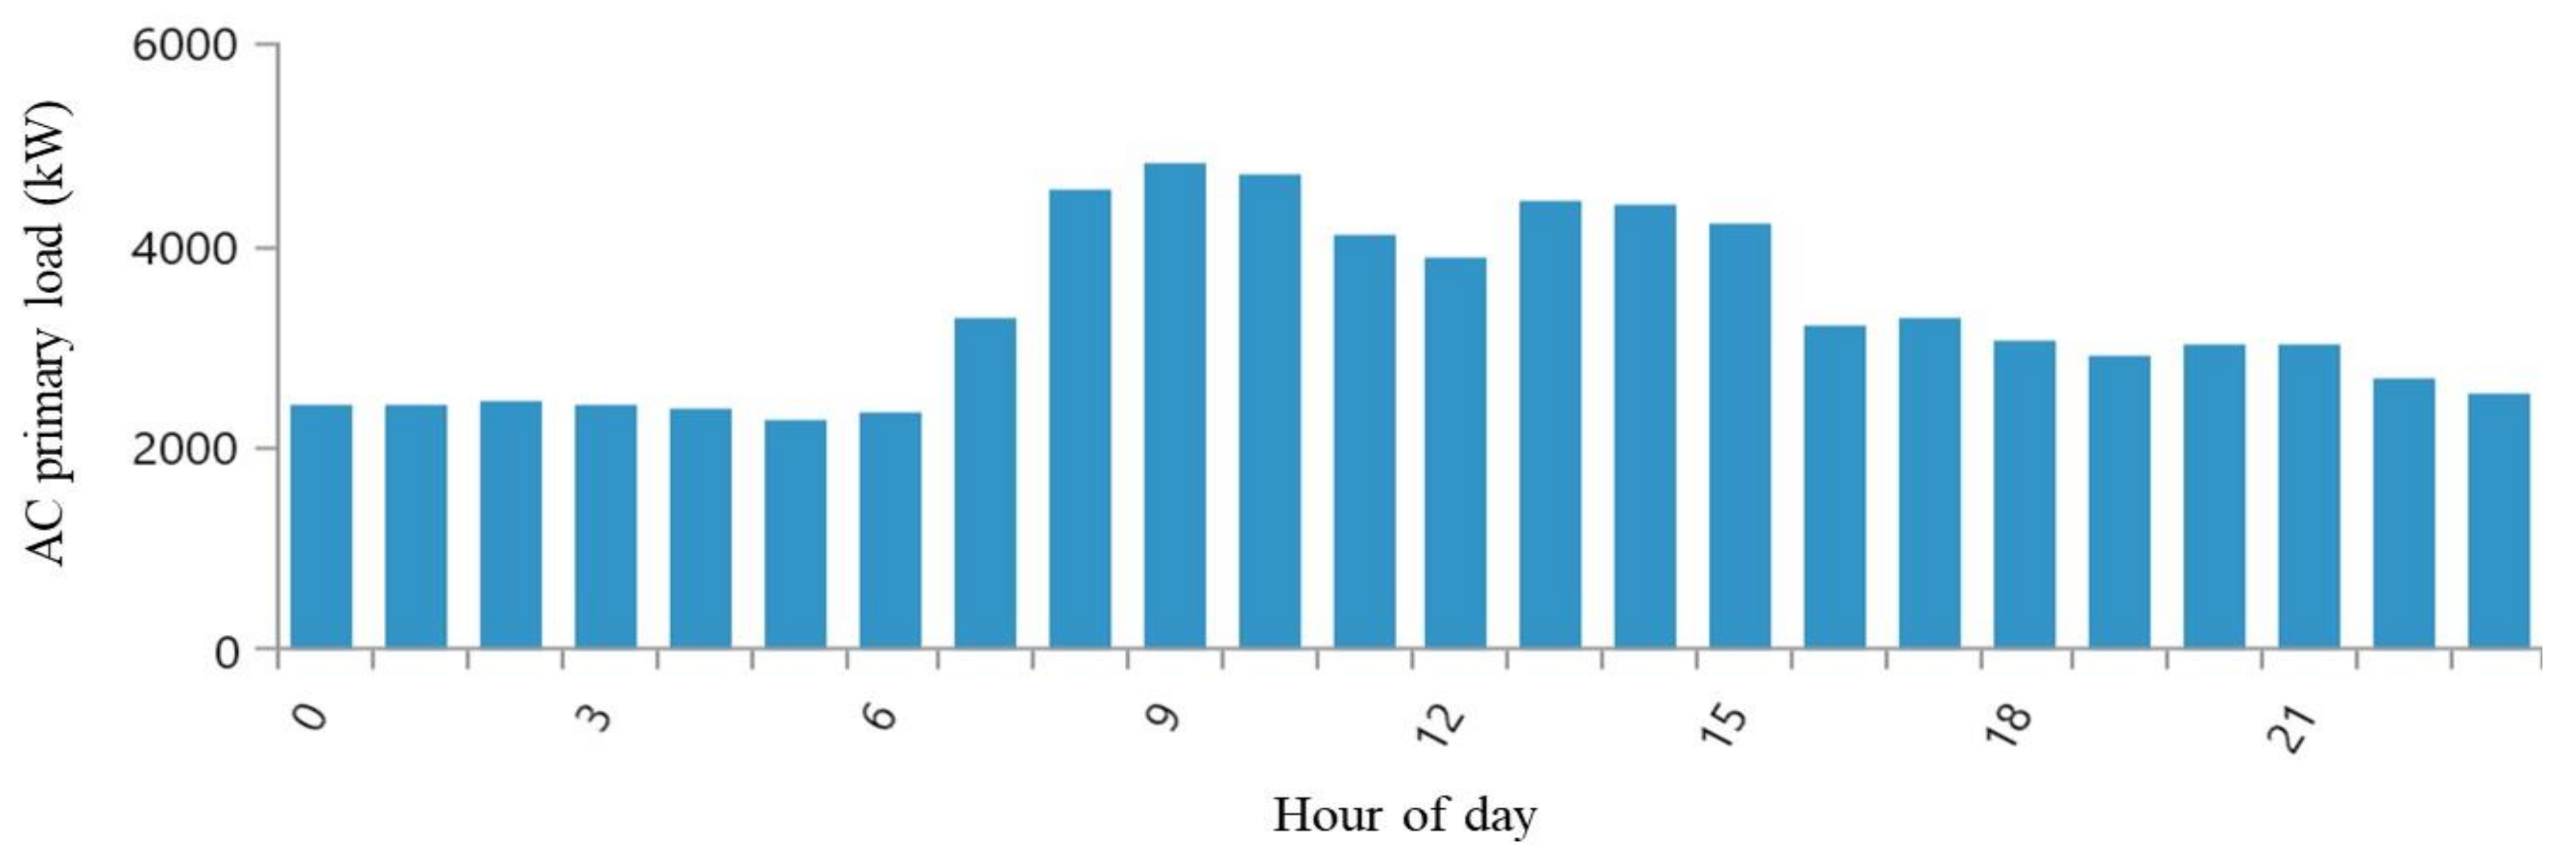
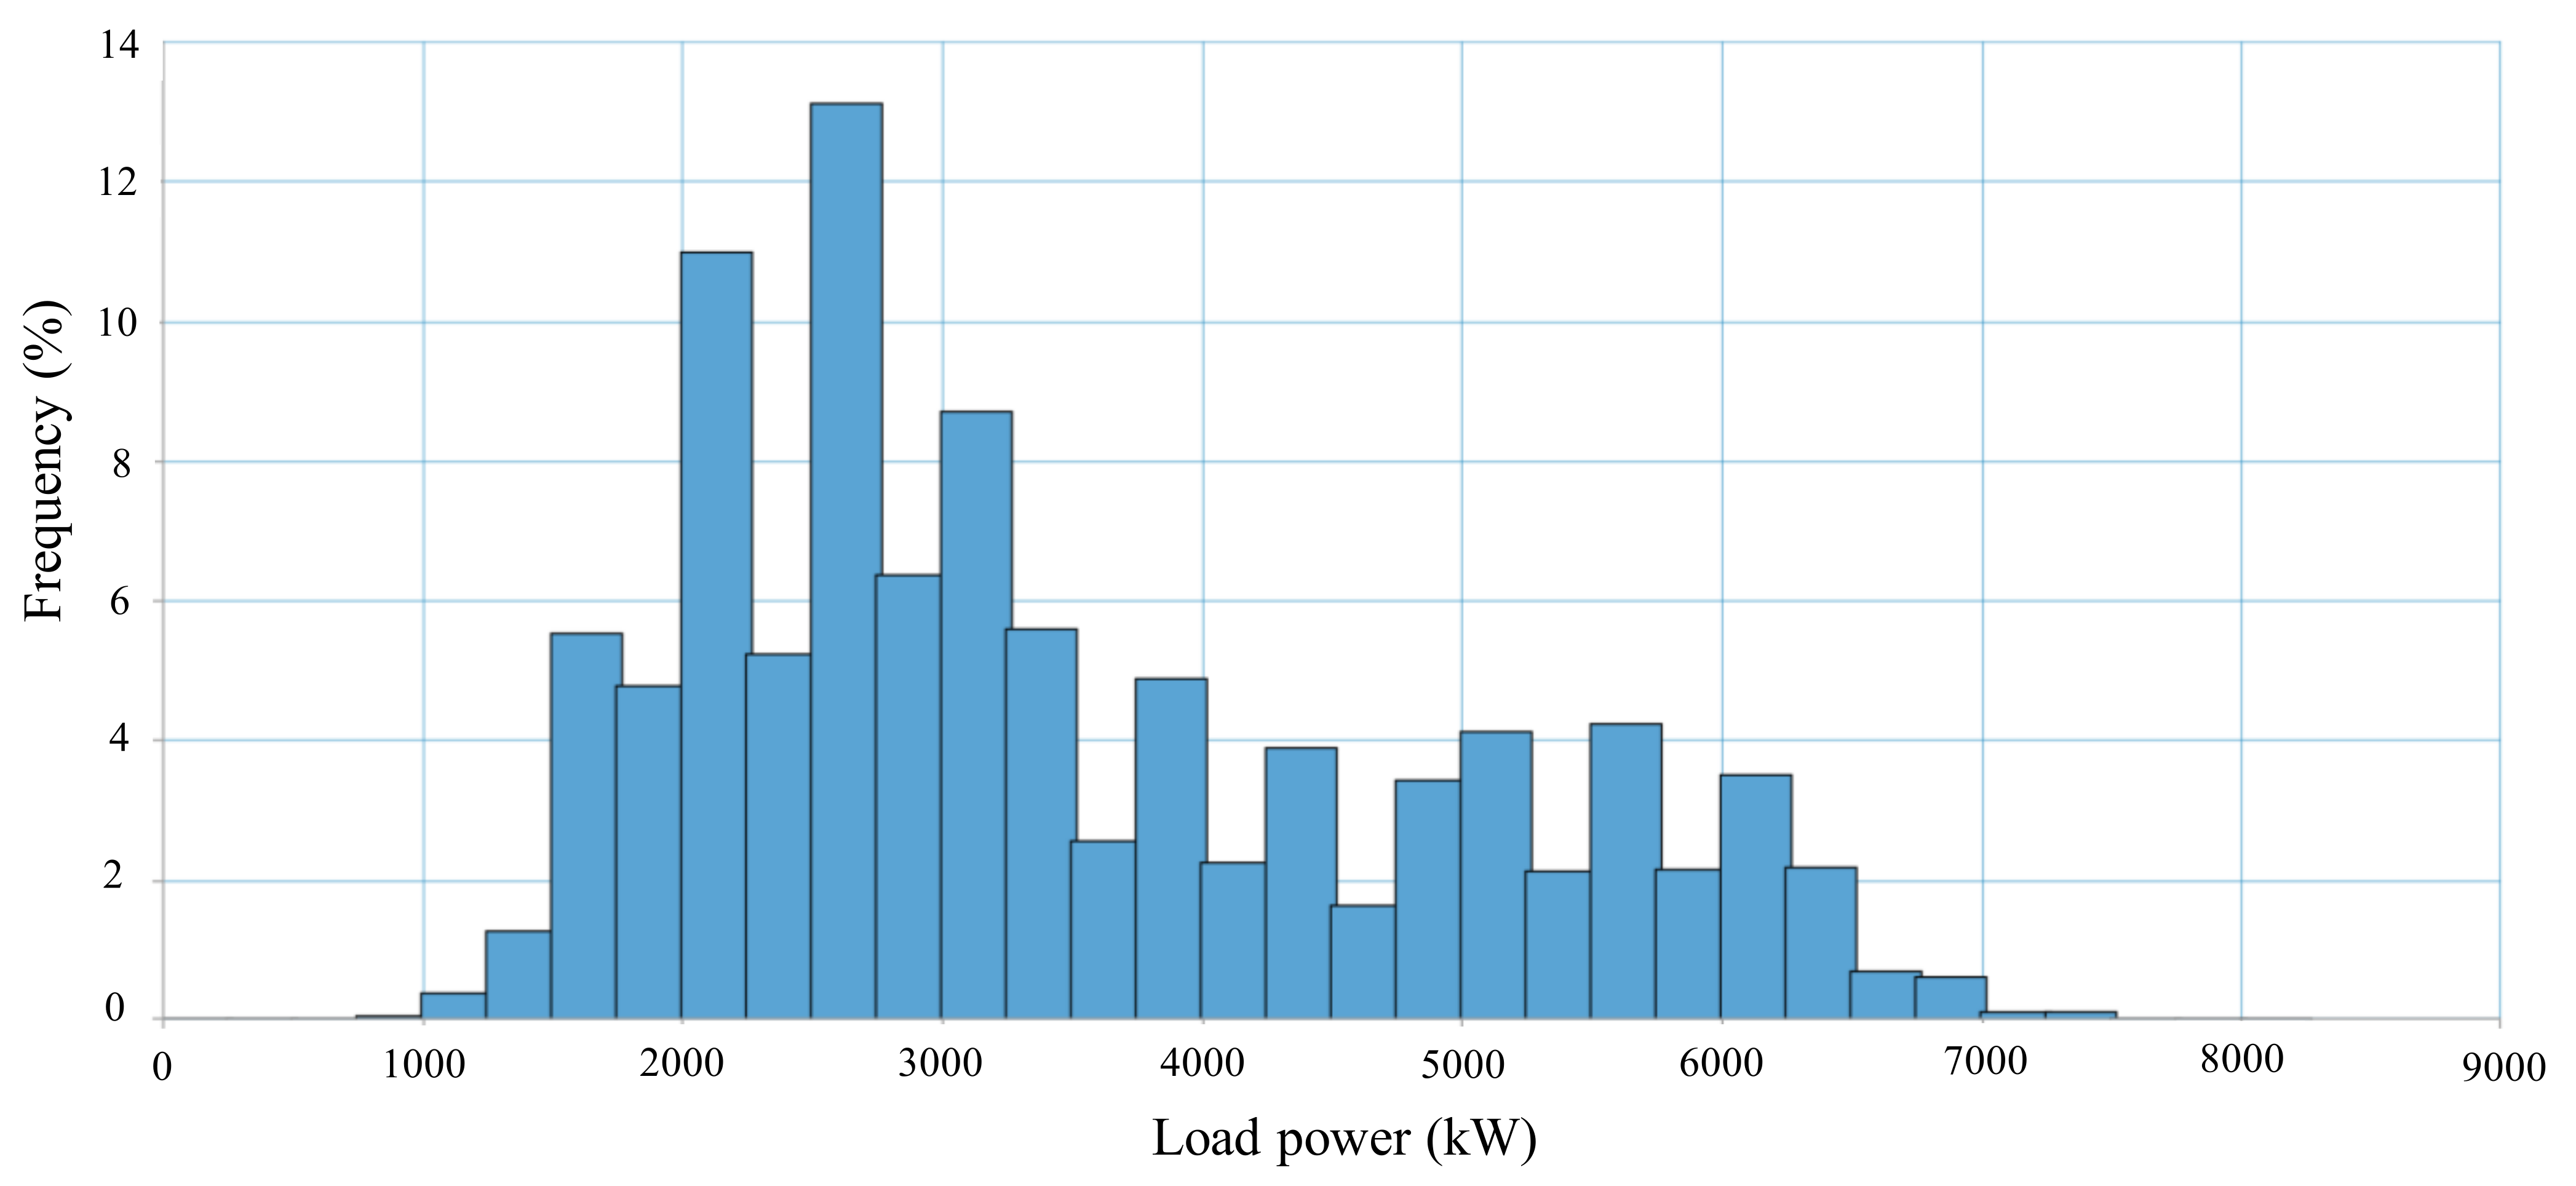
2.3. Load Consumption Profile
2.4. Electricity Tariff Calculation
2.5. Economic Assignment Criteria
2.5.1. Annual Real Interest Rate
- i = annual real interest rate (%);
- i′ = nominal interest rate (bank board rate) (%);
- f = expected inflation rate (%).
2.5.2. Net Present Cost (NPC)
- CFt = the cash flow of the t-year ($);
- i = the annual real interest rate (%);
- N = the project lifetime (year);
- t = the number of year (year);
- CF0 = the initial capital cost ($).
2.5.3. Capital Recovery Factor (CRF)
- t = the number of year (year)
- i = the annual real interest rate (%)
2.5.4. Levelized Cost of Energy (LCOE)
- TAC = the annualized value of NPC ($/year);
- Eprim = the total annualized load consumption (kWh/year);
- N = the project lifetime (year).
2.5.5. Project Benefit (PB)
- NPCc = the NPC of the current case system ($);
- NPCref = the NPC of the reference case system ($).
2.5.6. Return on Investment (ROI)
- Ccap,c = the capital cost of the current case system ($);
- Ccap,ref = the capital cost of the reference case system ($).
2.5.7. Discounted Payback Period (DPP)
- tfull = the time before the accumulated cash flow (year);
- Ccap,last = the remaining unrecovered capital cost after accumulated cash flow ($).
2.5.8. Internal Rate of Return (IRR)
2.6. Electrical Assignment Criteria
2.6.1. Renewable Fraction (RF)
- Enon-ren = the nonrenewable electrical production (kWh/year);
- Hnon-ren = the nonrenewable thermal production (kWh/year);
- Eserved = the total electrical load served (kWh/year);
- Hserved = the total thermal load served (kWh/year).
2.6.2. Excess Electricity Fraction
- Eexcess = the total excess electricity (kWh/year);
- Eprod = the total electrical production (kWh/year).
3. Grid-Connected PV/BESS System Description
3.1. Grid-Connected PV/BESS System Schematic
3.2. PV System
- Ppv,STC = PV system rated power (kWp);
- fpv = PV derating factor (%);
- GT = the solar irradiance on the surface of the PV module (kW/m2);
- GT,STC = the solar irradiance under the standard test conditions (1 kW/m2);
- KP = the temperature coefficient of PV module (%/°C);
- TC = the operation temperature of the PV module (°C);
- TSTC = the temperature of the PV module under the standard test conditions (25 °C).
3.3. Storage System
- Cbw = the battery wear cost ($);
- Crep,batt = the replacement cost of the storage ($);
- Nbatt = the number of batteries in the storage;
- Qlifetime = the operating lifetime throughput of a single storage (kWh);
- ηrt = storage roundtrip efficiency (fractional).
3.4. Power Conversion System (PCS)
3.5. System Dispatch Strategy
4. Component Cost and Financial Assumption
4.1. System Component Cost
4.2. Interest Rate and Inflation Rate
4.3. Conditions without PV/BESS Installation
4.4. Conditions with PV/BESS Installation
5. Sensitivity Analysis
5.1. Global Horizontal Irradiation
5.2. Conditions without PV/BESS Installation
5.3. Electricity Price
5.4. PV/BESS Capital Cost
5.5. Real Interest Rate
6. Conclusions
Author Contributions
Funding
Institutional Review Board Statement
Informed Consent Statement
Data Availability Statement
Conflicts of Interest
References
- Comello, S.; Reichelstein, S.; Sahoo, A. The road ahead for solar PV power. Renew. Sust. Energ. Rev. 2018, 92, 744–756. [Google Scholar] [CrossRef]
- Comello, S.; Reichelstein, S. The emergence of cost effective battery storage. Nat. Comm. 2019, 10, 1–9. [Google Scholar] [CrossRef] [Green Version]
- Hanser, P.; Lueken, R.; Gorman, W.; Mashal, J.; The Brattle Group. The practicality of distributed PV-battery systems to reduce household grid reliance. Util. Policy 2017, 46, 22–32. [Google Scholar] [CrossRef]
- Franklin, E.; Lowe, D.; Stocks, M. Assessment of market participation opportunities for behind-the-meter PV/ battery systems in the Australian electricity market. Energy Procedia 2017, 110, 420–427. [Google Scholar] [CrossRef]
- Lee, J.; Bérard, J.-P.; Razeghi, G.; Samuelsen, S. Maximizing PV hosting capacity of distribution feeder microgrid. Appl. Energy 2020, 261, 114400. [Google Scholar] [CrossRef]
- Novoa, L.; Flores, R.; Brouwer, J. Optimal renewable generation and battery storage sizing and siting considering local transformer limits. Appl. Energy 2019, 256, 113926. [Google Scholar] [CrossRef]
- Johnson, R.C.; Mayfield, M.; Beck, S.B.M. Battery energy storage for management of LV network operational violations: A multi-feeder analysis. Energy Procedia 2018, 151, 31–36. [Google Scholar] [CrossRef]
- Soini, M.C.; Parra, D.; Patel, M.K. Impact of prosumer battery operation on the cost of power supply. J. Energy Storage 2020, 29, 101323. [Google Scholar] [CrossRef]
- Wu, D.; Ma, X.; Balducci, P.; Bhatnagar, D. An economic assessment of behind-the-meter photovoltaics paired with batteries on the Hawaiian Islands. Appl. Energy 2021, 286, 116550. [Google Scholar] [CrossRef]
- Simpkins, T.; Anderson, K.; Cutler, D.; Olis, D. Optimal sizing of a solar-plus-storage system for utility bill savings and resiliency benefits. In Proceedings of the 2016 IEEE Power & Energy Society Innovative Smart Grid Technologies Conference (ISGT), Minneapolis, MN, USA, 6–9 September 2016; pp. 1–6. [Google Scholar]
- Tsai, C.-T.; Muna, Y.B.; Lin, H.-Y.; Kuo, C.-C.; Hsiung, R. Optimal design and performance analysis of solar power microsystem for mini-grid application. Microsyst. Technol. 2021, 27, 1267–1281. [Google Scholar] [CrossRef]
- Barbour, E.; González, M.C. Projecting battery adoption in the prosumer era. Applied Energy 2018, 215, 356–370. [Google Scholar] [CrossRef] [Green Version]
- Say, K.; John, M.; Dargaville, R. Power to the people: Evolutionary market pressures from residential PV battery investments in Australia. Energy Policy 2019, 134, 110977. [Google Scholar] [CrossRef]
- Nørgaard, J.B.; Kerekes, T.; Séra, D. Case study of residential PV power and battery storage with the Danish flexible pricing scheme. Energies 2019, 12, 799. [Google Scholar] [CrossRef] [Green Version]
- Say, K.; John, M.; Dargaville, R.; Wills, R.T. The coming disruption: The movement towards the customer renewable energy transition. Energy Policy 2018, 123, 737–748. [Google Scholar] [CrossRef]
- Wright, D.; Liu, L.; Parvan, L.; Majumdar, Z.; Giebink, N.C. Economic analysis of a novel design of microtracked concentrating photovoltaic modules. Prog. Photovolt. 2020, 29, 485–498. [Google Scholar] [CrossRef]
- Wright, D.J.; Badruddin, S.; Robertson-Gillis, C. Micro-tracked CPV can be cost competitive with PV in behind-the-meter applications with demand charges. Front. Energy Res. 2018, 6, 00097. [Google Scholar] [CrossRef]
- Situ, J.; Wright, D. Economic analysis of commercial PV microgrids. In Proceedings of the 2017 IEEE International Conference on Smart Energy Grid Engineering (SEGE), Oshawa, ON, Canada, 14–17 August 2017; pp. 110–116. [Google Scholar]
- Trevizan, R.D.; Nguyen, T.A.; Byrne, R.H. Sizing behind-the-meter energy storage and solar for electric vehicle fast-charging stations. In Proceedings of the 2020 International Symposium on Power Electronics, Electrical Drives, Automation and Motion (SPEEDAM), Sorrento, Italy, 24–26 June 2020; pp. 583–588. [Google Scholar]
- Balducci, P.; Mongird, K.; Wu, D.; Wang, D.; Fotedar, V.; Dahowski, R. An evaluation of the economic and resilience benefits of a microgrid in Northampton, Massachusetts. Energies 2020, 13, 4802. [Google Scholar] [CrossRef]
- Tsai, C.-T.; Molla, E.M.; Muna, Y.B.; Kuo, C.-C. Techno-economic analysis of microsystem based hybrid energy combination for island application. Microsyst. Technol. 2021, 27, 1507–1523. [Google Scholar] [CrossRef]
- Sepúlveda-Mora, S.B.; Hegedus, S. Making the case for time-of-use electric rates to boost the value of battery storage in commercial buildings with grid connected PV systems. Energy 2021, 218, 119447. [Google Scholar] [CrossRef]
- Kabir, A.; Sunny, M.R.; Siddique, N.I. Assessment of grid-connected residential PV-battery systems in Sweden-A Techno-economic Perspective. In Proceedings of the 2021 IEEE International Conference in Power Engineering Application (ICPEA), Shah Alam, Malaysia, 8–9 March 2021; pp. 73–78. [Google Scholar]
- Tsai, C.-T.; Beza, T.M.; Molla, E.M.; Kuo, C.-C. Analysis and sizing of mini-grid hybrid renewable energy system for islands. IEEE Access 2020, 8, 70013–70029. [Google Scholar] [CrossRef]
- Raj, A.; Reddy, T.A. Techno-economic analysis of a PV-battery system for a commercial building under different utility rate structures. In Proceedings of the Proceedings of the ASME 2018 Power Conference collocated with the ASME, V001T06A011, Lake Buena Vista, FL, USA, 24–28 June 2018. [Google Scholar]
- Boampong, R.; Brown, D.P. On the benefits of behind-the-meter rooftop solar and energy storage: The importance of retail rate design. Energy Econ. 2020, 86, 104682. [Google Scholar] [CrossRef]
- Behind-the-meter batteries: Innovation landscape briefn—News—International Renewable Energy Agency (IRENA). Available online: https://www.irena.org/-/media/Files/IRENA/Agency/Publication/2019/Sep/IRENA_BTM_Batteries_2019.pdf (accessed on 13 June 2021).
- Energy Storage Monitor: Latest trends in energy storage 2019—News—World Energy Council. Available online: https://www.worldenergy.org/assets/downloads/ESM_Final_Report_05-Nov-2019.pdf (accessed on 13 June 2021).
- Lemence, A.L.G.; Tamayao, M.-A.M. Energy Consumption profile estimation and benefits of hybrid solar energy system adoption for rural health units in the Philippines. Renew. Energy 2021, 178, 651–668. [Google Scholar] [CrossRef]
- Bhakta, S.; Mukherjee, V. Performance indices evaluation and techno economic analysis of photovoltaic power plant for the application of isolated India’s island. Sustain. Energy Technol. Assess. 2017, 20, 9–24. [Google Scholar] [CrossRef]
- Kebede, A.A.; Coosemans, T.; Messagie, M.; Jemal, T.; Behabtu, H.A.; Mierlo, J.V.; Berecibar, M. Techno-economic analysis of lithium-ion and lead-acid batteries in stationary energy storage application. J. Energy Storage 2021, 40, 102748. [Google Scholar] [CrossRef]
- Mehrpooya, M.; Mohammadi, M.; Ahmadi, E. Techno-economic-environmental study of hybrid power supply system: A case study in Iran. Sustain. Energy Technol. Assess 2018, 25, 1–10. [Google Scholar] [CrossRef]
- Tomar, V.; Tiwari, G.N. Techno-economic evaluation of grid connected PV system for households with feed in tariff and time of day tariff regulation in New Delhi–A sustainable approach. Renew. Sustain. Energy Rev. 2017, 70, 822–835. [Google Scholar] [CrossRef]
- Liu, G.; Rasul, M.G.; Amanullah, M.T.O.; Khan, M.M.K. Techno-economic simulation and optimization of residential grid-connected PV system for the Queensland climate. Renew. Energy 2012, 45, 146–155. [Google Scholar] [CrossRef]
- Tsai, W.-T. Trend Analysis of Taiwan’s greenhouse gas emissions from the energy sector and its mitigation strategies and promotion actions. Atmosphere 2021, 12, 859. [Google Scholar] [CrossRef]
- Kung, C.-C.; McCarl, B.A. The potential role of renewable electricity generation in Taiwan. Energy Policy 2020, 138, 111227. [Google Scholar] [CrossRef]
- Wang, C.-N.; Nguyen, N.-A.-T.; Dang, T.-T.; Bayer, J. Two-stage multiple criteria decision making for site selection of solar photovoltaic (PV) power plant: A case study in Taiwan. IEEE Access 2021, 9, 75509–75525. [Google Scholar]
- Tsai, C.-T.; Ocampo, E.M.; Beza, T.M.; Kuo, C.-C. Techno-economic and sizing analysis of battery energy storage system for behind-the-meter application. IEEE Access. 2020, 8, 203734–203746. [Google Scholar] [CrossRef]
- HOMER software–the trusted global standard in hybrid power system modeling—News—HOMER Energy Website. Available online: https://www.homerenergy.com/ (accessed on 13 June 2021).
- Li, C.; Ge, X.; Zheng, Y.; Xu, C.; Rend, Y.; Song, C.; Yang, C. Techno-economic feasibility study of autonomous hybrid wind/PV/battery power system for a household in Urumqi, China. Energy 2013, 55, 263–272. [Google Scholar] [CrossRef]
- Rohani, G.; Nour, M. Techno-economical analysis of stand-alone hybrid renewable power system for Ras Musherib in United Arab Emirates. IEEE Access 2014, 64, 828–841. [Google Scholar] [CrossRef]


| Hybrid Energy System | Application Scenarios | Method-ology | Performance | Restriction Conditon | Performance Evaluation | Case Study in the Site |
|---|---|---|---|---|---|---|
| The sustainable energy source to support the healthcare facilities | HOMER | The healthcare facilities to deliver services under a grid-connected or an off-grid | Different load profiles of equipment | NPC, COE, RF | Philippine rural health units (RHU) [29] |
| To mitigate the dependency on diesel generator | HOMER | Optimal the size of stand-alone configuration for the seasonal load profiles of three distinct island seasons for a single household | The island climatic conditions, and the typical seasonal load profiles | NPC, COE | Indian isolated island Andaman and Nicobar island [30] |
| To alleviate the intermittent nature of renewable energy sources | HOMER + Matlab | Considering the different stationary application profiles by the analysis of lead-acid and Li-ion batteries | The specifications and application profiles of battery systems | NPC, COE, RF | Euro dollars evaluation [31] |
| Evaluate the competitiveness of such renewable systems | HOMER | The suggestion of an off-grid power supply system for PV-diesel-battery based on the government’s support and incentive schemes | The low price of diesel fuel in Iran | NPC, COE, COP, carbon emission | Iran [32] |
| The electrification of consumption for the dissemination | HOMER | The better performance of PV system stimulates the investment opportunity | Diesel fuel price fluctuation | NPC, COE, RF | New Delhi, India [33] |
| Residential PV system to optimize the size and slope of PV array | HOMER | Maximize the Queensland residents’ benefits for 4 typical climate zones | The local policies’ limits on maximum PV size | NPC, COE, ROI, carbon emission | Queensland, Australia [34] |
| Item | Type | Application |
|---|---|---|
| 1 | Package price 1 | Public street lighting, alarms |
| 2 | Meter rate lighting service | Houses, small shops, offices, institutions, schools, and other institutions |
| 3 | Low voltage (LV) | Power supply below 600 volts for public offices, schools, supermarkets, small shopping malls, small and medium-sized factories |
| 4 | High voltage (HV) | Power supply from 600 volts to 22,800 volts with contract capacity more than 0.1 MW for factories, department stores, public institutions, schools |
| 5 | Extra high voltage (EHV) | Power supply more than 22,800 volts with contracted capacity of 1 MW or more for factories, MRTs, railways, and airports |
| Basic Charge | Contract Capacity Charge | Summer Months (1 June~30 September) | Non-Summer Months (1 June~30 September) | |||
|---|---|---|---|---|---|---|
| 7.1246 | 5.2656 | |||||
| Energy Charge | Monday to Friday | On-peak | Summer months | 10:00~12:00 13:00~17:00 | 0.1511 | - |
| Mid-peak | Summer months | 07:30~10:00 12:00~13:00 17:00~22:30 | 0.0941 | - | ||
| Non-summer months | 07:30~22:30 | - | 0.0911 | |||
| Off-peak | 00:00~07:30 22:30~24:00 | 0.0423 | 0.0400 | |||
| Saturday | Mid-peak | 07:30~22:30 | 0.0567 | 0.0541 | ||
| Off-peak | 00:00~07:30 22:30~24:00 | 0.0423 | 0.0400 | |||
| Sun. and off-peak day | Off-peak | All day | 0.0423 | 0.0400 | ||
| Description | Data Description |
|---|---|
| PV System | |
| Capital cost ($/kW) | 1310 |
| Operation and maintenance cost ($/kW/year) | 13.1 |
| Storage System | |
| Capital cost ($/kWh) | 290 |
| Replacement cost ($/kWh) | 174 |
| Operation and maintenance cost ($/kWh/year) | 4.35 |
| Power Conversion System | |
| Capital cost ($/kW) | 123 |
| Replacement cost (US$/kW) | 74 |
| Operation and maintenance cost (US$/kW/year) | 0 |
| Contract Capacity (kW) | 7500 | 7250 | 7000 | 6750 | 6500 | 6250 | 6000 | 5750 | 5500 | 5250 | 5000 |
|---|---|---|---|---|---|---|---|---|---|---|---|
| PV system capacity alternative | Without PV | 7250 kWp | 7500 kWp | 7750 kWp | 7750 kWp | 7750 kWp | 8250 kWp | 8250 kWp | 8250 kWp | 8500 kWp | 9000 kWp |
| BESS capacity alternative | Without BESS | 0 | 250 kW/ 639 kWh | 500 kW/ 1278 kWh | 750 kW/ 1917 kWh | 1000 kW/ 2556 kWh | 1250 kW/ 3195 kWh | 1500 kW/ 4473 kWh | 1500 kW/ 5751 kWh | 2000 kW/ 7029 kWh | 2250 kW/ 8307 kWh |
| PV system Installation Cost ($) | N/A | −10,152,500 | −9,825,000 | −10,152,500 | −10,152,500 | −10,480,000 | −10,807,500 | −10,807,500 | −10,807,500 | −11,135,000 | −11,790,000 |
| PV system maintenance cost ($) | N/A | −1,952,246 | −1,889,273 | −1,952,246 | −1,952,246 | −2,015,224 | −2,078,198 | −2,078,198 | −2,078,198 | −2,141,176 | −2,267,127 |
| BESS Installation Cost ($) | N/A | 0 | −216,110 | −432,220 | −648,330 | −864,440 | −1,080,550 | −1,481,970 | −1,883,390 | −2,284,810 | −2,686,230 |
| BESS maintenance cost ($) | N/A | 0 | −160,527 | −321,056 | −481,584 | −642,110 | −802,638 | −1,123,694 | −1,444,751 | −1,765,804 | −2,086,860 |
| Electricity expenses ($) | −54,813,205 | −39,914,431 | −39,752,863 | −38,812,925 | −38,283,773 | −37,362,064 | −36,453,117 | −35,765,228 | −35,096,604 | −34,048,495 | −32,662,915 |
| NPC ($) | −54,813,205 | −52,019,181 | −51,843,772 | −51,670,949 | −51,518,438 | −51,363,840 | −51,222,008 | −51,256,593 | −51,310,443 | −51,375,287 | −51,493,136 |
| Discounted electricity cost saving ($) | N/A | 14,898,774 | 15,078,139 | 16,035,874 | 16,582,823 | 17,522,329 | 18,449,073 | 19,154,760 | 19,841,181 | 20,907,087 | 22,310,464 |
| Project benefit ($) | N/A | 2,794,024 | 2,969,433 | 3,142,256 | 3,294,767 | 3,449,365 | 3,591,197 | 3,556,612 | 3,502,762 | 3,437,918 | 3,320,069 |
| Return on investment (%) | N/A | 1.63 | 1.74 | 1.74 | 1.79 | 1.78 | 1.77 | 1.71 | 1.64 | 1.53 | 1.39 |
| Internal rate of return (%) | N/A | 2.85 | 3.03 | 3.04 | 3.11 | 3.10 | 3.08 | 2.97 | 2.86 | 2.69 | 2.46 |
| Discounted payback (year) | N/A | 15.55 | 15.35 | 15.37 | 15.31 | 15.36 | 15.41 | 15.61 | 15.82 | 16.10 | 16.46 |
| LOCE ($/kWh) | 0.09401 | 0.08921 | 0.08891 | 0.08862 | 0.08835 | 0.08809 | 0.08785 | 0.08791 | 0.08800 | 0.08811 | 0.08831 |
| Electricity cost saving (%) | 0 | 27.18 | 27.51 | 29.26 | 30.25 | 31.97 | 33.66 | 34.95 | 36.20 | 38.14 | 40.70 |
| Excess electricity fraction (%) | N/A | 2.86 | 2.90 | 2.96 | 2.77 | 2.85 | 2.93 | 2.64 | 2.39 | 2.37 | 2.57 |
| Renewable fraction (%) | N/A | 26.10 | 27.00 | 27.90 | 28.00 | 28.80 | 29.60 | 29.80 | 29.90 | 30.80 | 32.40 |
| Types of Electricity Price Rates for Different Years | 10 Years of Electricity Price Rate Unchanged | Increased by 3% Every Three Years | Increased by 3% Every Two Years | Increase by 3% Every Year |
|---|---|---|---|---|
| NPC-Without PV/BESS ($) | −$54,813,205 | −$59,431,490 | −$62,110,835 | −$70,229,116 |
| NPC-With PV/BESS ($) | −$51,222,008 | −$54,285,866 | −$56,063,396 | −$61,449,217 |
| Project benefit ($) | $3591,197 | $5,145,624 | $6,047,439 | $8,779,899 |
| ROI (%) | 1.77% | 2.46% | 2.86% | 4.07% |
| IRR (%) | 3.08% | 4.00% | 4.50% | 5.87% |
| Discounted payback (year) | 15.41 | 14.44 | 13.95 | 13.95 |
| LOCE-Without PV/BESS ($/kWh) | 0.09401 | 0.10193 | 0.10652 | 0.12044 |
| LOCE-With PV/BESS ($/kWh) | 0.08785 | 0.09310 | 0.09615 | 0.10539 |
| PV/BESS Cost Reduction Ratio | 1 | 0.9 | 0.8 | 0.7 | 0.6 | 0.5 |
|---|---|---|---|---|---|---|
| NPC-Without PV/BESS ($) | −$54,813,205 | −$54,813,205 | −$54,813,205 | −$54,813,205 | −$54,813,205 | −$54,813,205 |
| NPC-With PV/BESS ($) | −$51,222,008 | −$49,970,765 | −$48,719,523 | −$47,468,281 | −$46,217,039 | −$44,965,797 |
| Project benefit ($) | $3,591,197 | $4,842,440 | $6,093,682 | $7,344,924 | $8,596,166 | $9,847,408 |
| ROI (%) | 1.77% | 2.55% | 3.53% | 4.79% | 6.47% | 8.82% |
| IRR(%) | 3.08% | 4.30% | 5.75% | 7.49% | 9.68% | 12.56% |
| Discounted payback (year) | 15.41 | 13.83 | 12.25 | 10.69 | 8.67 | 7.21 |
| LOCE-Without PV/BESS ($/kWh) | 0.09401 | 0.09401 | 0.09401 | 0.09401 | 0.09401 | 0.09401 |
| LOCE-With PV/BESS ($/kWh) | 0.08785 | 0.08570 | 0.08355 | 0.08141 | 0.07926 | 0.07712 |
| PV cost reduction ratio | 1 | 0.9 | 0.8 | 0.7 | 0.6 | 0.5 |
| NPC-Without PV/BESS ($) | −$54,813,205 | −$54,813,205 | −$54,813,205 | −$54,813,205 | −$54,813,205 | −$54,813,205 |
| NPC-With PV/BESS ($) | −$51,222,008 | −$50,141,258 | −$49,060,508 | −$47,979,758 | −$46,899,008 | −$45,818,258 |
| Project benefit ($) | $3,591,197 | $4,671,947 | $5,752,697 | $6,833,447 | $7,914,197 | $8,994,947 |
| ROI (%) | 1.77% | 2.45% | 3.28% | 4.31% | 5.64% | 7.42% |
| IRR (%) | 3.08% | 4.14% | 5.38% | 6.84% | 8.63% | 10.90% |
| Discounted payback (year) | 15.41 | 14.04 | 12.68 | 11.33 | 9.92 | 7.87 |
| LOCE-Without PV/BESS ($/kWh) | 0.09401 | 0.09401 | 0.09401 | 0.09401 | 0.09401 | 0.09401 |
| LOCE-With PV/BESS ($/kWh) | 0.08785 | 0.08599 | 0.08414 | 0.08229 | 0.08043 | 0.07858 |
| Storage system cost reduction ratio | 1 | 0.9 | 0.8 | 0.7 | 0.6 | 0.5 |
| NPC-Without PV/BESS ($) | −$54,813,205 | −$54,813,205 | −$54,813,205 | −$54,813,205 | −$54,813,205 | −$54,813,205 |
| NPC-With PV/BESS($) | −$51,222,008 | −$51,075,814 | −$50,929,620 | −$50,783,427 | −$50,637,233 | −$50,491,039 |
| Project benefit ($) | $3,591,197 | $3,737,391 | $3,883,585 | $4,029,778 | $4,175,972 | $4,322,166 |
| ROI (%) | 1.77% | 1.85% | 1.93% | 2.01% | 2.09% | 2.17% |
| IRR (%) | 3.08% | 3.20% | 3.33% | 3.45% | 3.58% | 3.71% |
| Discounted payback (year) | 15.41 | 15.22 | 15.04 | 14.85 | 14.67 | 14.48 |
| LOCE-Without PV/BESS ($/kWh) | 0.09401 | 0.09401 | 0.09401 | 0.09401 | 0.09401 | 0.09401 |
| LOCE-With PV/BESS ($/kWh) | 0.08785 | 0.08760 | 0.08735 | 0.08709 | 0.08684 | 0.08659 |
| PCS cost reduction ratio | 1 | 0.9 | 0.8 | 0.7 | 0.6 | 0.5 |
| NPC-Without PV/BESS ($) | −$54,813,205 | −$54,813,205 | −$54,813,205 | −$54,813,205 | −$54,813,205 | −$54,813,205 |
| NPC-With PV/BESS ($) | −$51,222,008 | −$51,197,709 | −$51,173,410 | −$51,149,112 | −$51,124,813 | −$51,100,515 |
| Project benefit ($) | $3,591,197 | $3,615,496 | $3,639,795 | $3,664,093 | $3,688,392 | $3,712,690 |
| ROI (%) | 1.77% | 1.78% | 1.80% | 1.81% | 1.82% | 1.84% |
| IRR (%) | 3.08% | 3.10% | 3.12% | 3.14% | 3.16% | 3.18% |
| Discounted payback (year) | 15.41 | 15.38 | 15.35 | 15.32 | 15.28 | 15.25 |
| LOCE-Without PV/BESS ($/kWh) | 0.09401 | 0.09401 | 0.09401 | 0.09401 | 0.09401 | 0.09401 |
| LOCE-With PV/BESS ($/kWh) | 0.08785 | 0.08780 | 0.08776 | 0.08772 | 0.08768 | 0.08764 |
Publisher’s Note: MDPI stays neutral with regard to jurisdictional claims in published maps and institutional affiliations. |
© 2021 by the authors. Licensee MDPI, Basel, Switzerland. This article is an open access article distributed under the terms and conditions of the Creative Commons Attribution (CC BY) license (https://creativecommons.org/licenses/by/4.0/).
Share and Cite
Peng, C.-Y.; Kuo, C.-C.; Tsai, C.-T. Optimal Configuration with Capacity Analysis of PV-Plus-BESS for Behind-the-Meter Application. Appl. Sci. 2021, 11, 7851. https://doi.org/10.3390/app11177851
Peng C-Y, Kuo C-C, Tsai C-T. Optimal Configuration with Capacity Analysis of PV-Plus-BESS for Behind-the-Meter Application. Applied Sciences. 2021; 11(17):7851. https://doi.org/10.3390/app11177851
Chicago/Turabian StylePeng, Cheng-Yu, Cheng-Chien Kuo, and Chih-Ta Tsai. 2021. "Optimal Configuration with Capacity Analysis of PV-Plus-BESS for Behind-the-Meter Application" Applied Sciences 11, no. 17: 7851. https://doi.org/10.3390/app11177851