1. Introduction
In recent years, with the rapid development of the social economy, the desire for, and expectation of, a high quality of life is becoming more common. Solid wood furniture is increasingly valued and favored by people because of its unique aesthetic feeling and superior material characteristics; the market demand for solid wood furniture is showing an upward trend year on year [
1,
2,
3]. However, some countries have low forestation; in China, the forest coverage rate is only three-fifths of the world average, and the per capita forest area is less than one-quarter of the world average [
4]. Solid wood board resources are scarce; this, together with the implementation of a forest cutting quota policy, has led to the supply of solid wood board in China being highly dependent on imports [
5,
6,
7,
8]. In addition, the production technology of most furniture enterprises remains outdated, which results in solid wood boards being only partially used. This waste results in increased production costs and the need to manage waste [
9]. Therefore, measures must be taken to alleviate the divergence between supply and demand of solid wood boards by saving raw materials [
10]. In 2020, 322 million pieces of wooden furniture were produced in China, with the average board consumption per piece of furniture being 0.6 m
3. If the existing board utilization rate is increased by 1%, 193 million m
3 boards can be saved; this shows that a slight increase in the utilization rate of raw materials can cause a significant decrease in the total consumption of raw materials. As the first step of the furniture manufacturing process, layout directly determines the utilization rate of raw materials [
11,
12,
13]. Therefore, a reasonable layout is an important measure to reduce material costs and improve economic benefits and is thus of great significance in promoting the sustainable development of the furniture manufacturing industry.
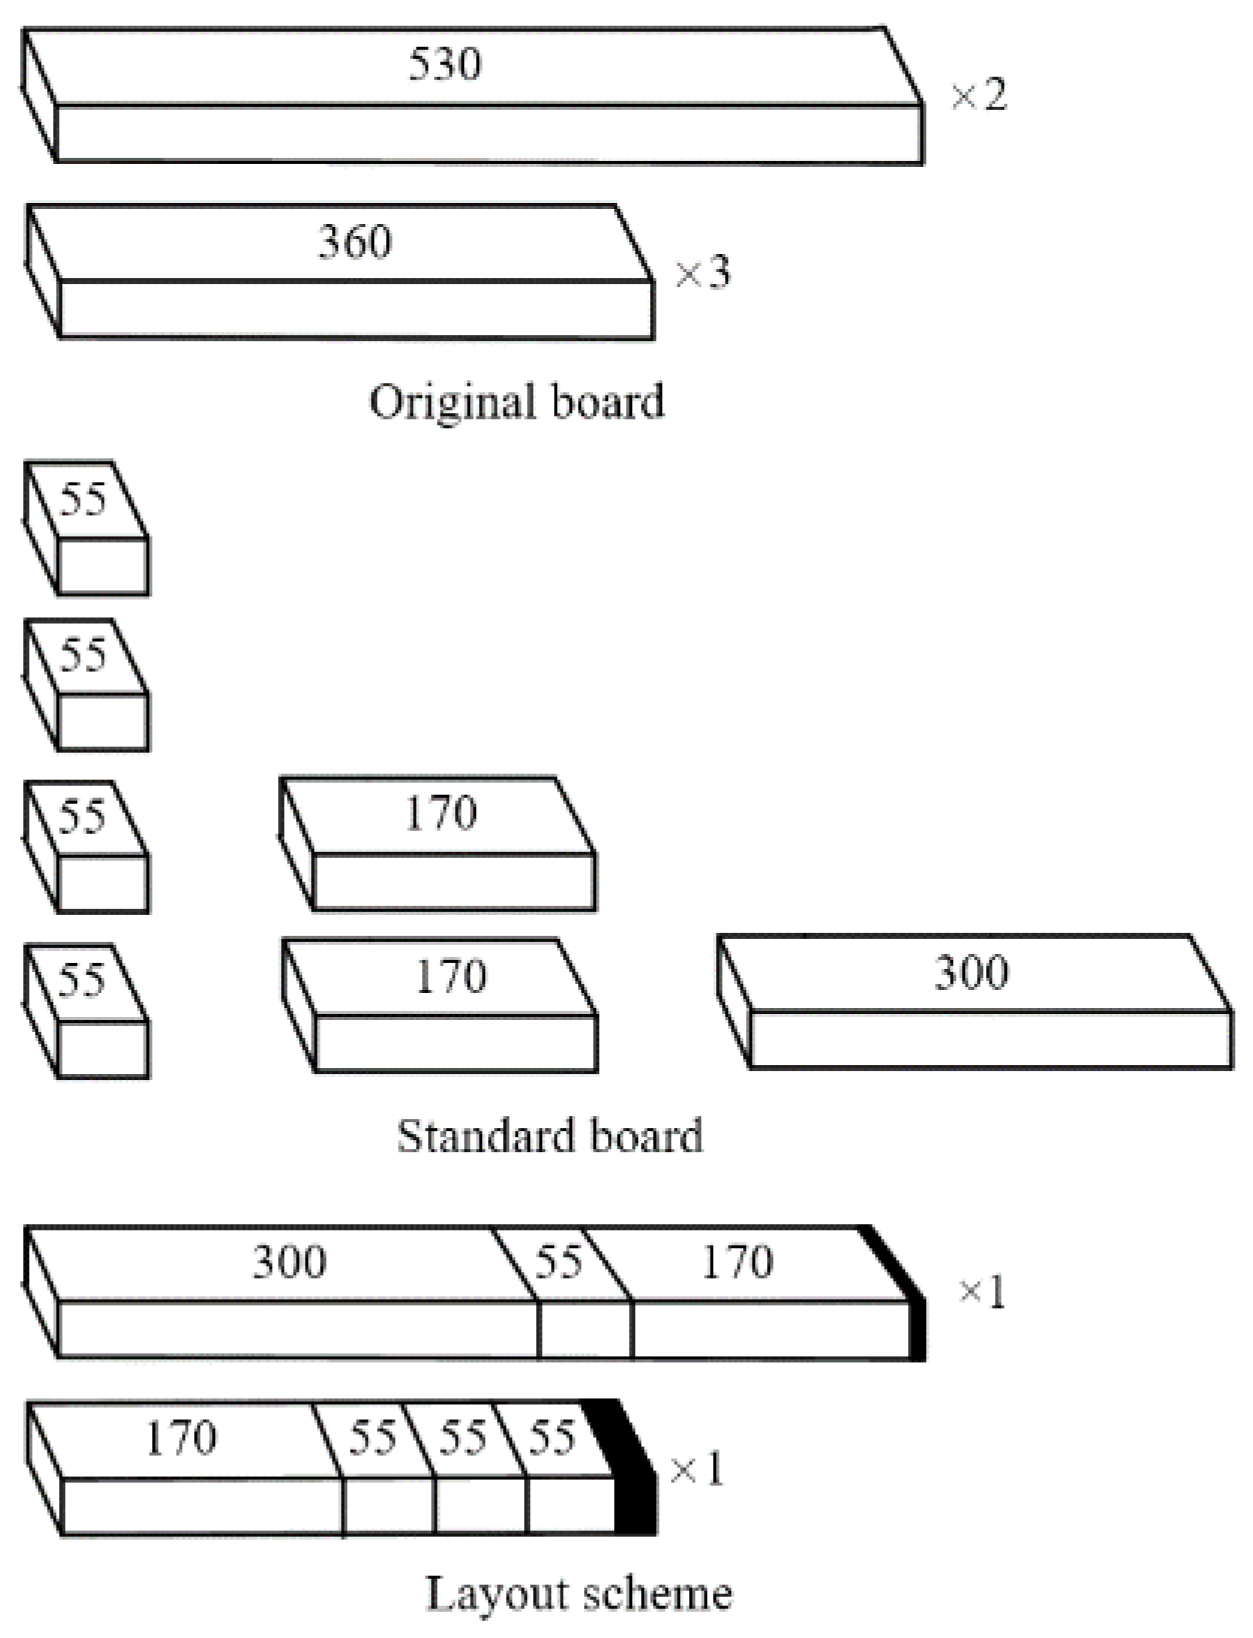
As shown in
Figure 1, the solid wood board cutting stock problem (CSP) refers to placing the required standard boards of different lengths on the original boards of different lengths. Under the condition of meeting the requirements for the demand and size of standard boards, the used original boards are fully utilized to maximize the board utilization rate. In this paper, we only consider length, which thus belongs to the one-dimensional cutting stock problem. The one-dimensional cutting stock problem is a typical optimization problem. In terms of computational complexity, it is an NP-hard problem with the highest complexity; the solution time increases exponentially with the problem scale, and there is no accurate optimal solution in the polynomial time [
14,
15,
16]. At present, most studies use heuristic methods to solve optimization problems, such as polar bear optimization [
17,
18,
19,
20], grey wolf optimizer [
21,
22,
23], and genetic algorithm [
24,
25,
26], which can find good approximate solutions in a limited time.
The one-dimensional cutting stock problem has been studied by scholars for years. Common layout methods include column generation, greedy algorithms, and intelligent optimization algorithms. Sarper [
27] proposed a priority-based goal programming approach to solve the one-dimensional cutting stock problem with a random demand mix. This methodology can evaluate the effects of various raw material order levels to account for demand randomness at the time of order. Cui [
28] presented an integer programming model for the 1DCSPUL (one-dimensional cutting stock problem with usable leftovers) with limited leftover types, and described a heuristic algorithm based on a column-generation procedure for its solution. Cerqueira [
29] proposed a modified greedy heuristic (MGH), which first orders the pair items, or the odd ones in the case that there are more items in the problem. The experimental results showed that the MGH is more effective than the greedy heuristic. Campello [
30] introduced the residual recombination heuristic (RRH) to solve the one-dimensional cutting stock problem and obtained high-quality solutions within a reasonable computational time. Ben [
31] developed a solution method based on a particle swarm optimization (PSO) approach that takes into account the characteristics of the specific problem; this method was efficient for more than 78% of the total of the American Captain benchmark. In consideration of the characteristics of online detection, Lu [
32] proposed a GPU parallel ant colony algorithm to solve the dynamic one-dimensional cutting stock problem; this algorithm had an obvious time efficiency advantage compared with the CPU traditional ant colony (CPUTAC) and branch and bound (BB).
Although the above algorithms are effective in helping to solve the one-dimensional cutting stock problem, it is difficult for a single algorithm to balance global search ability and local exploitation ability. A more advantageous improvement strategy is to combine two or more algorithms to make use of the advantages of a hybrid algorithm, making up for the defects of a single algorithm. Hua [
33] proposed a global heuristic two-tier algorithm to solve the cable optimized cutting problem, which saved more than 3% of cable raw materials compared with traditional methods. Benjaoran [
34] proposed a hybrid algorithm based on the intensive search algorithm (ISA), genetic algorithm (GA), and the best fit decreasing (BFD) algorithm. Test results showed that the hybrid-generated solutions were superior to the solutions received from the BFD algorithm alone. Anselmo [
35] proposed a novel matheuristic algorithm based on a fix-and-optimize strategy hybridized with a random local search; this performed better than the CPLEX solver in larger instances, with an average relative percentage deviation (RPD) for objective values as high as 72%.
This paper takes the highest possible board utilization rate as the optimization goal and proposes an ant colony-immune genetic algorithm (AC-IGA) to solve the solid wood board cutting stock problem. In order to verify the feasibility and effectiveness of AC-IGA, it is compared with ant colony algorithm (ACA), genetic algorithm (GA), grey wolf optimizer (GWO), and polar bear optimization (PBO) through experiments.
2. Mathematical Model
In practical production, there are often different types of defects on the surface of solid wood boards; these have an impact on the structural strength and aesthetic degree. After obtaining the characteristic information of surface defects using machine vision technology, the defects are removed by the cutting saw, and multiple boards with different lengths are obtained [
36,
37,
38]. These boards must be segmented according to the standard length for subsequent processing.
Assume that the total number of original boards after cutting defects is n. The length of the i-th original board is (). m types of standard boards need to be placed on these original boards without overlapping. The length and demand of the j-th type of standard board are and , respectively ().
On the premise of meeting the constraints, the optimization goal is to minimize the total length of the used original boards, namely, to maximize the board utilization rate. The objective function is expressed as
where
is the total length of all the original boards selected in a layout scheme,
is the board utilization rate, and
m is the number of types of standard boards.
The solid wood board CSP must meet the following three constraints:
(1) The total quantity of the
j-th type of standard board placed on the
i-th original board should be a nonnegative integer:
where
is the total quantity of the
j-th type of standard board placed on the
i-th original board, and
N is a nonnegative integer.
(2) The total quantity of the
j-th type of standard board placed in a layout scheme is equal to its demand:
where
is the demand of the
j-th type of standard board, and
n is the total number of original boards.
(3) The total length of all the standard boards placed on the
i-th original board cannot exceed the length of the
i-th original board:
where
is the length of the
j-th type of standard board, and
is the length of the
i-th original board.
Figure 2 shows the mathematical model of the solid wood board cutting stock problem. 5, 6, 8, and 11 are the selected original board numbers in a layout scheme.
3. Algorithm Design
The solid wood board cutting stock problem is an NP-hard combinatorial optimization problem, and the quantity and length of boards are constrained, making this problem more complex. In the process of layout, not only should the original boards be selected, but the standard boards that can be placed on the selected original boards should also be selected. In addition, the selection quantity and length of the original boards are unknown, so the feasible solutions cannot be generated randomly.
The ant colony algorithm (ACA) is a typical algorithm for solving the combinatorial optimization problems. In the ACA, ants construct the feasible initial solutions through the design of pseudorandom state transition rule and taboo list when searching for paths, and continuously optimize paths through pheromone feedback mechanism. However, the ACA needs a long search time and is prone to premature stagnation when solving the large-scale problems.
The GA is a commonly used method in solving optimization problems, which has the global, fast search ability, but it does not use the feedback information in the system, which often leads to redundant iterations and low solving efficiency.
The AC-IGA is proposed to overcome the defects of the ACA and GA. In this paper, in order to maintain good population diversity and nonredundancy of information, the GA was improved according to the immune system, and the improved genetic algorithm was introduced into each iteration of the improved ant colony algorithm, so that the improved genetic algorithm can iterate in a good solution space and improve the search efficiency.
3.1. Important Concepts of the AC-IGA
3.1.1. Similarity
In this paper, the hamming distance refers to the number of different alleles between the chromosomes of two individuals and is used to measure similarity. The greater the number of different alleles, the greater the hamming distance and the smaller the similarity. Assuming that two individuals are numbered
s and
v, and each individual has
B gene loci, the similarity between individual
s and individual
v is defined as follows:
where
is the
k-th gene of individual
s and
is the
k-th gene of individual
v.
Figure 3 shows the similarity between individual
s and individual
v, assuming that each individual has eight gene loci.
3.1.2. Concentration
In this paper, concentration refers to the proportion of similar individuals in the population and represents the quality of population diversity [
39]. In order to simplify the calculation, the definition of concentration based on information entropy is used for reference. The concentration of individual
v is defined as
where
is the similarity threshold,
is the similarity between individual
s and individual
v,
is the population size.
3.1.3. Pseudorandom State Transition Rule
The ant’s selection of paths is mainly determined by pheromone and heuristic function [
40]. In this paper, the probability of ant
k transferring from the original board node
i to the standard board node
j at time
t is calculated according to the pseudorandom state transition rule (shown in Equations (9) and (10)). When
, the standard board node is selected according to prior knowledge; otherwise, the standard board node is selected using the probability formula
, as follows:
where
is a random number uniformly distributed between [0, 1],
is the selection randomness parameter,
is the pheromone importance factor,
is the heuristic function factor,
is the set of optional standard board nodes,
is the heuristic function, and
is the pheromone transferred from the original board node
i to the standard board node
j.
3.2. Algorithm Procedure
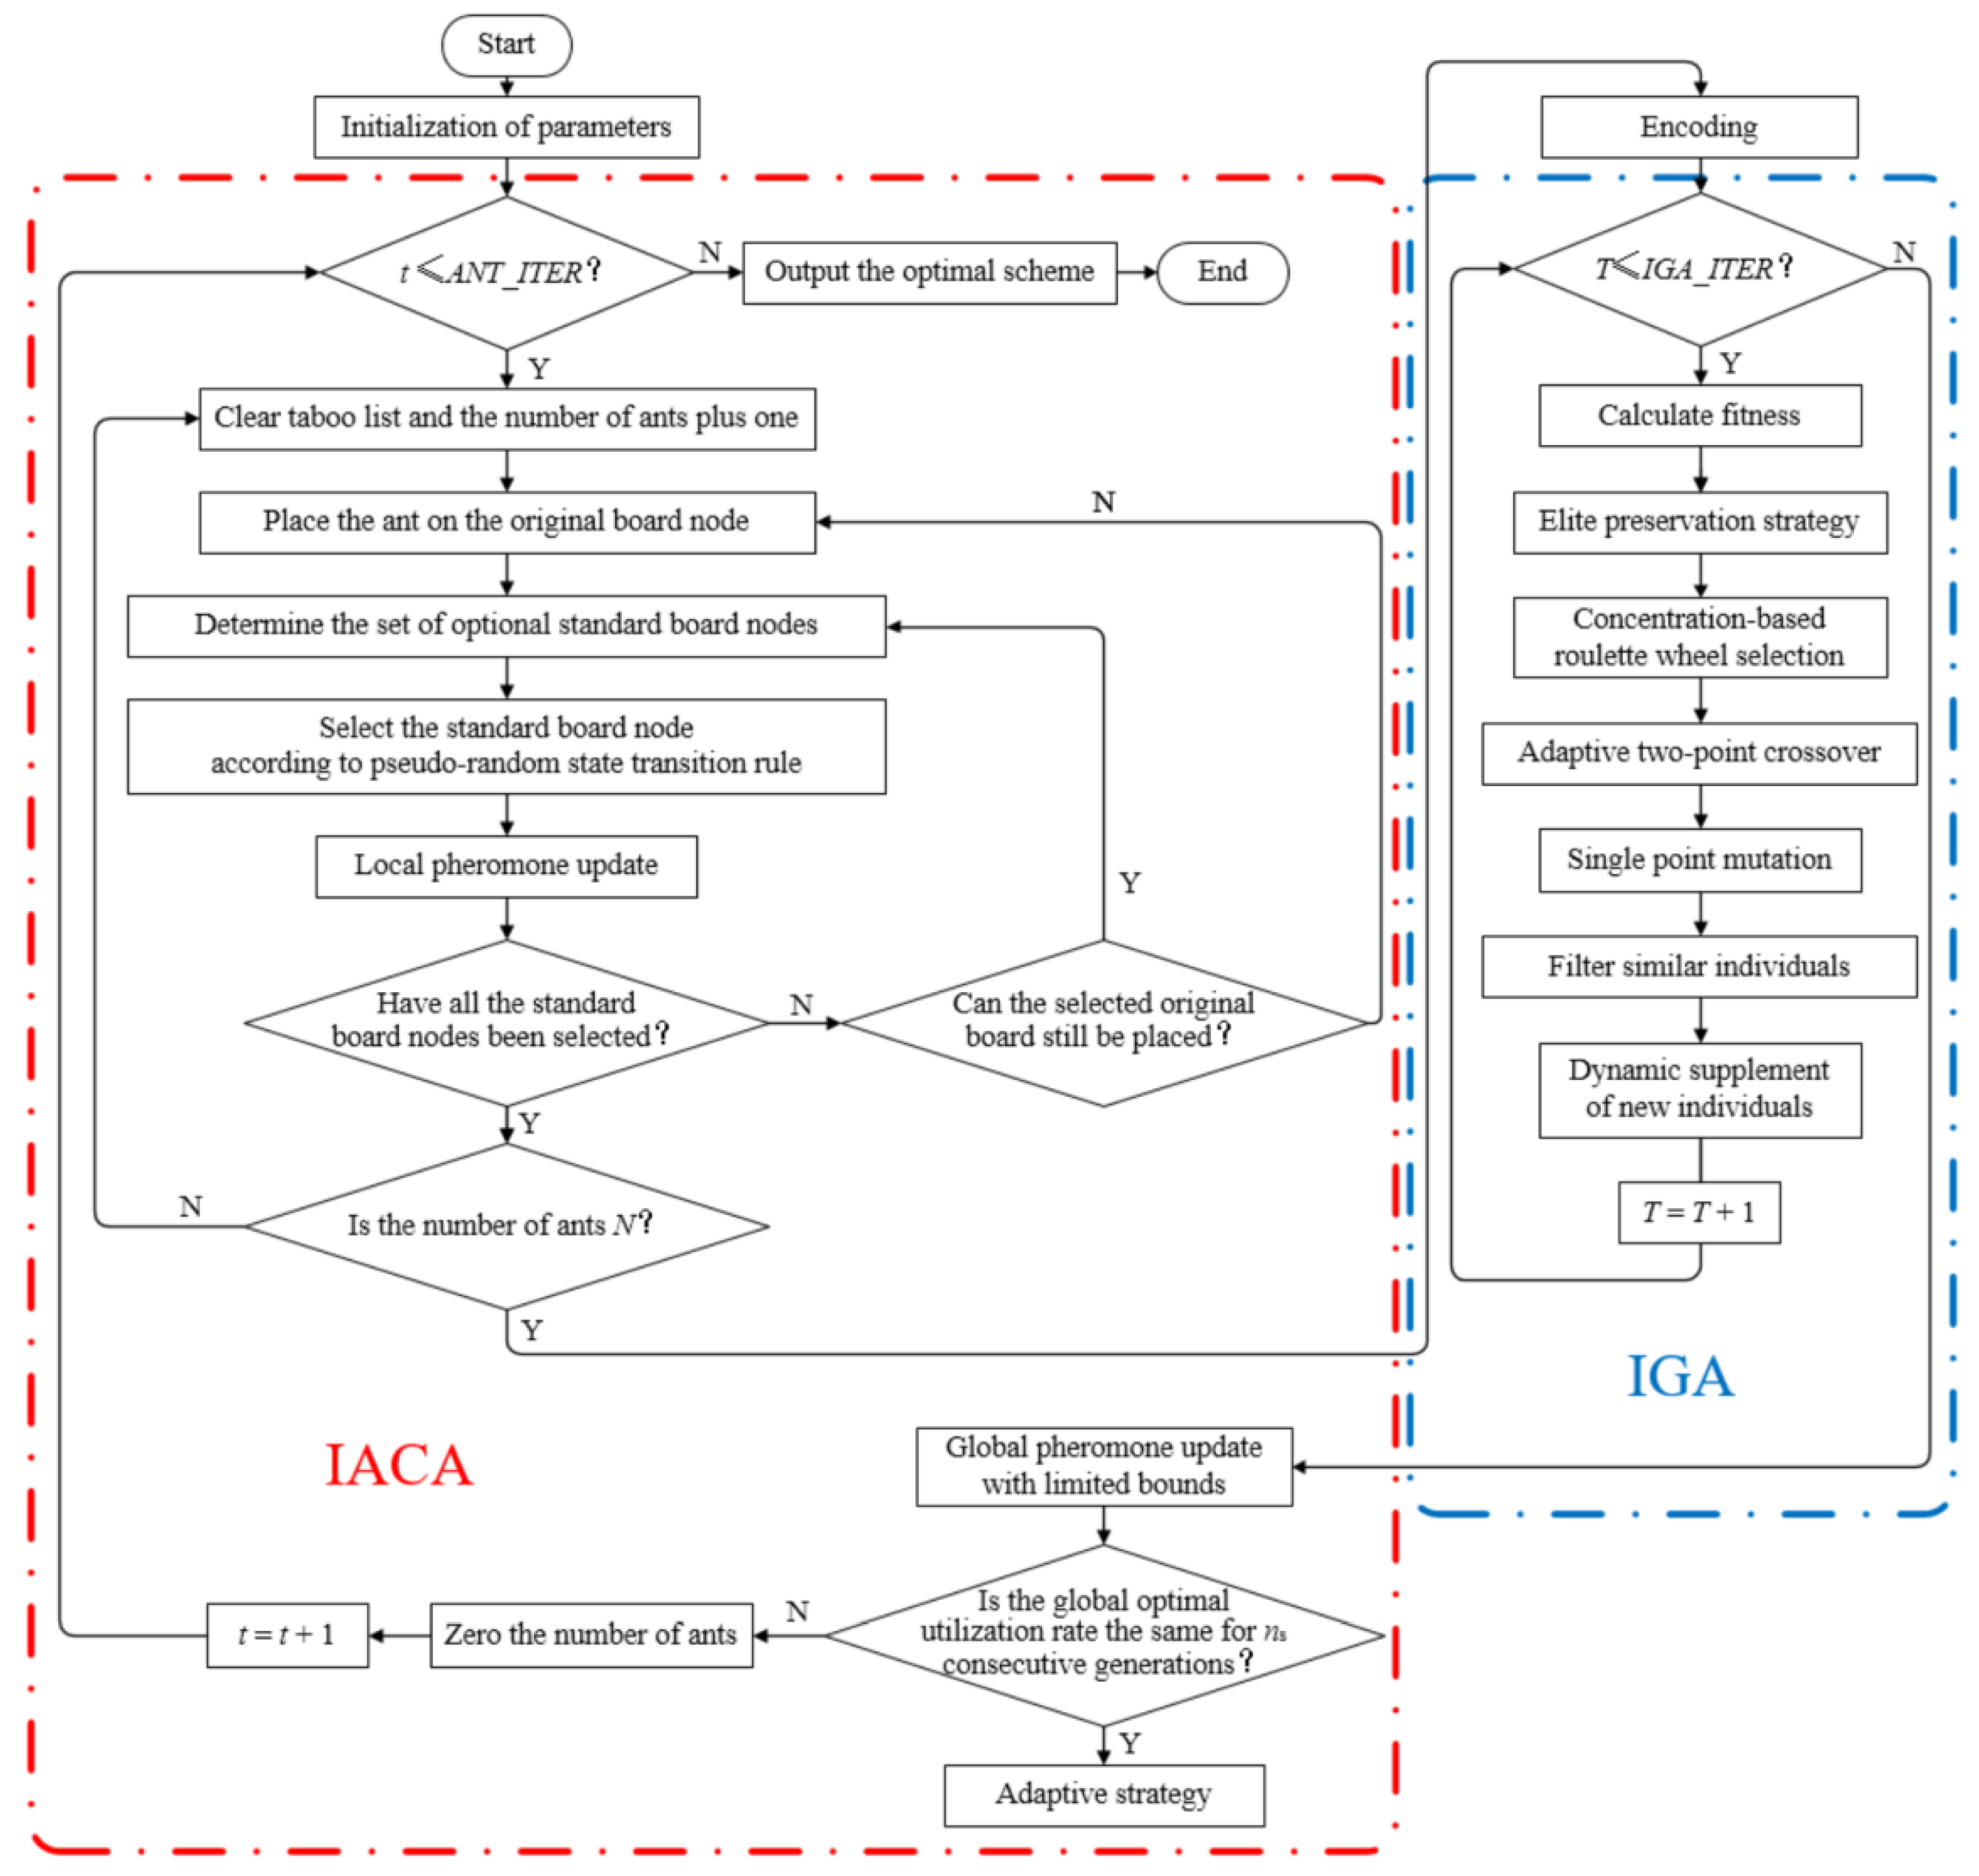
Figure 4 shows the flow chart of the AC-IGA. The IACA is framed by the red dash-dot line, IGA is framed by the blue dash-dot line,
ANT_ITER is the maximum number of iterations of IACA, and
IGA_ITER is the maximum number of iterations of IGA.
3.3. Improved Ant Colony Algorithm (IACA)
3.3.1. Solution Construction
It is assumed that the total quantity of original boards is A, and the total quantity of standard boards is B. The original boards and standard boards are numbered sequentially from 0 to A−1 and B−1, respectively, and these numbers are used as nodes of the IACA. These nodes can be divided into original board nodes and standard board nodes; the original board node i represents the original board numbered i () and the standard board node j represents the standard board numbered j ().
The layout process of solid wood boards can be described as follows. First, select an original board, and then select several standard boards for the layout to make the residual length of the selected original board as close to zero as possible. Then, replace the original board and repeat the above process until each standard board has been placed once. The concrete steps for ants to construct feasible solutions are as follows:
(1) is the set of optional original board nodes (the difference set between all original board nodes and ) and is the set of optional standard board nodes (the difference set between all standard board nodes and ).
(2) Taking the length of the original board corresponding to the original board node i as () and the length of the standard board corresponding to the standard board node j as (), record the maximum lengths as and , respectively.
(3) Assuming that the original board node
c is selected, the method of selecting the original board node is as follows:
where
r is a random number uniformly distributed between [0,
Lmax −
lmax].
(4) Select the standard board corresponding to the standard board node in
, one by one, to establish a tentative layout, and take the residual length of the selected original board after the tentative layout as a parameter of the heuristic function
:
where
is the residual length of the original board corresponding to the selected original board node
c, and
is the length of the standard board corresponding to the standard board node
d in the tentative layout (
).
In combination with the corresponding pheromone (the pheromone matrix is a two-dimensional array: the first dimension is the original board number, and the second dimension is the standard board number), select the standard board node according to the pseudorandom state transition rule.
(5) Record the selected original board node and the selected standard board node in the taboo list and , respectively.
(6) Update and .
(7) If there exists at least one unselected standard board whose length does not exceed the residual length of the selected original board, return to step (4); otherwise, return to step (2) until each standard board node has been selected once.
Figure 5 shows the model of the solution constructed according to the above steps, and
Figure 6 shows the corresponding layout scheme, assuming that there are twenty original boards and eight standard boards.
Figure 7 shows the encoding method; (4,0,4,4,16,4,16,0) is a encoded chromosome, with each individual in the population having only one chromosome. The length of the chromosome is the same as the total quantity of standard boards; a chromosome corresponds to a layout scheme, with each gene of the chromosome representing an original board number.
3.3.2. Pheromone Update
In the process of constructing the solution, after the ant transfers from the original board node
i to the standard board node
j, the corresponding pheromone
should volatilize in a certain proportion, so as to reduce the selection probability of the nodes that have been selected before and enhance the ability to explore new layout schemes. The local pheromone is updated as follows:
where
is the local pheromone volatilization coefficient.
In order to better maintain the dynamic balance between exploration and orientation, a hybrid strategy is adopted to update the global pheromone; that is, the global optimal solution is used once every
r iterations, and the iterative optimal solution is used in other iterations. The global pheromone is updated as follows:
where
is the global pheromone volatilization coefficient,
is the pheromone increment for the
t-th iteration,
is the pheromone enhancement factor,
is the fitness of the global optimal solution, and
is the fitness of the iterative optimal solution.
In order to avoid stagnation, the pheromone is limited between
, and the upper and lower bounds of the pheromone are determined by the calculation method in the literature [
41]. In addition, the initial pheromone is set at
to improve the global search ability of ants in the initial period.
3.3.3. Adaptive Strategy
When the global optimal solutions of consecutive generations are the same, the algorithm is considered to fall into local convergence, and the following adaptive strategies need to be adopted:
- (1)
Referring to the pheromone smoothing mechanism [
42], establish the weighted average between each node’s pheromone and the upper bound of the pheromone to prevent premature convergence.
- (2)
In order to expand the exploration range of ants, adjust the global pheromone volatilization coefficient by .
- (3)
The value of determines the relative importance between using prior knowledge and exploring new solutions; in order to increase the probability that ants accept random solutions, adjust by , where is the lower bound of the global pheromone volatilization coefficient, is a negative number, is the number of stagnations, and ANT_ITER is the maximum number of iterations of the IACA.
3.4. Immune Genetic Algorithm (IGA)
3.4.1. Fitness Function
Fitness function is a performance index to evaluate the individual quality, and the individual performance increases with fitness. Since the optimization goal of the solid wood board CSP is to maximize the board utilization rate, the objective function is taken as the fitness function:
where
is the total length of all standard boards,
is the total length of all the original boards selected in a layout scheme, and
is the fitness, namely the board utilization rate.
3.4.2. Genetic Operations
(1) Selection Operation
Roulette wheel selection is a frequently used method in GAs [
43]. The selection probability of the individual is directly proportional to its fitness; this may lead to excessive concentration of similar individuals with high fitness in the population after the selection operation, to reduce the search space and increase the probability of falling into the local optimum. In order to maintain population diversity and preserve excellent individuals, the concentration regulation mechanism of the immune system is introduced. The individual selection probability is jointly determined by fitness and concentration, which can promote individuals with high fitness and inhibit individuals with high concentration. The selection probability of individual
i is calculated as follows:
where
is the fitness of individual
i,
is the concentration of individual
i,
is the population size, and
is a negative number.
Some individuals with high fitness may be inhibited because of their high concentration, resulting in the loss of these individuals. Therefore, the elite preservation strategy is adopted: ensure the individual with the highest fitness in the current population is preserved in the next generation population, and delete the individual with the lowest fitness in the next generation population.
(2) Crossover Operation
As the core operation of the GA, crossover determines the global search ability of the algorithm. In this paper, two-point crossover operation is adopted, as shown in
Figure 8, and its design includes two main aspects: the crossover probability and the position of the crossover point.
The crossover probability directly affects the convergence of the algorithm. In this paper, adaptive crossover probability is proposed: in order to preserve excellent genes, the crossover probability decreases gradually with an increase in fitness for the individual whose fitness is higher than the average fitness of the population, and the maximum crossover probability is adopted for the individual whose fitness is lower than the average fitness of the population to generate new individuals. The crossover probability is calculated as follows:
where
is the upper bound of the crossover probability,
is the lower bound of the crossover probability,
is the larger fitness of the two individuals performing the crossover operation,
is the average fitness of the population,
is the maximum fitness of the population, and
is a constant.
The position of the crossover point determines the effectiveness of the crossover operation. If the position of the crossover point is not selected properly, the offspring after the crossover operation may be the same as the parent, which means the crossover operation is invalid. To avoid ineffective crossover, it is necessary to ensure that at least one of the two different crossover points selected randomly exists in the effective region.
Assuming that two individuals performing the crossover operation are
v and
s,
the effective region is
.
(3) Mutation Operation
Mutation operation can provide new genes for individual evolution and is an important means to maintain population diversity. In this paper, single-point mutation operation is adopted; it is necessary to ensure that the replaced original board number is different from the former one.
After genetic operations, all individuals in the population are checked, and the individuals that do not meet the constraints are deleted.
3.4.3. Filter Similar Individuals
When the algorithm finds a region with an extreme value, individuals are constantly concentrated in this region, which will lead to the emergence of many new similar individuals. Thus, the population diversity decreases rapidly, compromising the ability to explore other new regions with extreme values and worsening the convergence efficiency. To avoid this, similar individuals need to be filtered. By referring to the self-generated diversity and maintenance mechanism of the immune system [
44,
45], the filter operation is performed according to the similarity threshold
Th, which is beneficial to expand each individual’s independent search space and reduce the singleness of population genes. The specific steps of filtering similar individuals are as follows:
(1) For any two identical individuals in the population, delete one randomly.
(2) Select two individuals in the population and calculate their similarity. If the similarity is not less than the similarity threshold Th, add these two individuals into region D until any two individuals in the population have been selected.
(3) Select two individuals in region D and compare their respective concentrations. If the concentrations of these two individuals are not equal, delete the individual with higher concentration; otherwise, move to step (4).
(4) Compare the respective fitness of the individuals mentioned in step (3). If the fitness of these two individuals is not equal, delete the individual with lower fitness; otherwise, delete one randomly.
(5) Repeat step (3) and step (4) until any two individuals in region D have been compared.
3.4.4. Dynamic Supplementation of New Individuals
After deleting the individuals that do not meet the constraints and filtering similar individuals, in order to achieve the preset population size
N, it is necessary to supplement new individuals. The method specified in
Section 3.3.1 is used to generate new individuals. At the same time, if the similarity between the newly generated individual and any one individual in the population is less than the similarity threshold
Th, the newly generated individual is added into the population; otherwise, it will not be preserved, which can better suppress the repetition in the search process and strengthen the global optimization ability.
4. Experiments and Discussion
In order to verify the effectiveness and superiority of the AC-IGA, experiments on the ACA [
46], GA [
47], GWO [
48], PBO [
49] and AC-IGA were carried out by PyCharm, and their experimental results are compared. The computer operating system is Windows10, the processor is Inter (R) Xeon (R) W-2155 CPU@3.30 GHz, and the RAM is 64 GB.
Table 1 shows the parameter values of the AC-IGA. To ensure the effectiveness of the comparison, the values of the same parameters in the five algorithms are the same.
At present, there are no standard instances to test the one-dimensional cutting stock problem. Therefore, according to the real data provided by a furniture enterprise, we generated 12 instances for each of the nine classes with the random number generator [
50], resulting in a total of 108 instances. The length range of original boards is [3000, 12000], and the length range of standard boards is [300, 4500]. Each generated instance is solved by ACA, GA, GWO, PBO and AC-IGA five consecutive times. The parameters for generating instances and the experimental results are presented in
Table 2, where
n is the number of types of original boards,
m is the number of types of standard boards,
d is the total number of standard boards (its value represents the range of the data generated randomly 12 times),
u is the average of the experimental results under the corresponding class (average utilization rate), and
Arg is the cumulative average of each column of data (the average of the experimental results of 108 instances).
Figure 9 shows the comparison diagram of the statistical experimental results.
As can be seen from
Table 2 and
Figure 9, the average utilization rate of each class obtained by the AC-IGA is better than the other four algorithms. In addition, the cumulative average utilization rate of 108 instances obtained by the AC-IGA is 2.308% higher than that of the ACA, 2.482% higher than that of the GA, 2.347% higher than that of the GWO, and 3.669% higher than that of the PBO. It can be seen that when the solutions of the four comparison algorithms have high precision, the average utilization rate obtained by the AC-IGA still shows further improvement, which verifies the effectiveness of the AC-IGA in improving the solution quality and its superiority in solving the one-dimensional cutting stock problem.
In order to further verify the application value of the AC-IGA in solving the solid wood board cutting stock problem, a production instance of a furniture enterprise was selected for layout calculation. The production instance was solved by the ACA, GA, GWO, PBO and AC-IGA ten consecutive times, and each algorithm obtained ten results.
Table 3 shows the data for the production instance.
Table 4 shows the analysis of the experimental results, where Min, Max, and Mean are the minimum, maximum, and average of the experimental results obtained by the corresponding algorithm, and SD is the standard deviation. Compared with the ACA, GA, GWO, and PBO, the Min obtained by the AC-IGA increased by 3.157%, 3.290%, 3.090%, and 4.801%, respectively, the Max obtained by the AC-IGA increased by 2.974%, 2.771%, 2.839%, and 3.846%, respectively, the Mean obtained by the AC-IGA increased by 2.974%, 3.034%, 2.949%, and 4.063%, respectively, and the SD of the AC-IGA is the smallest, which indicates that the AC-IGA has better optimization ability and robustness.
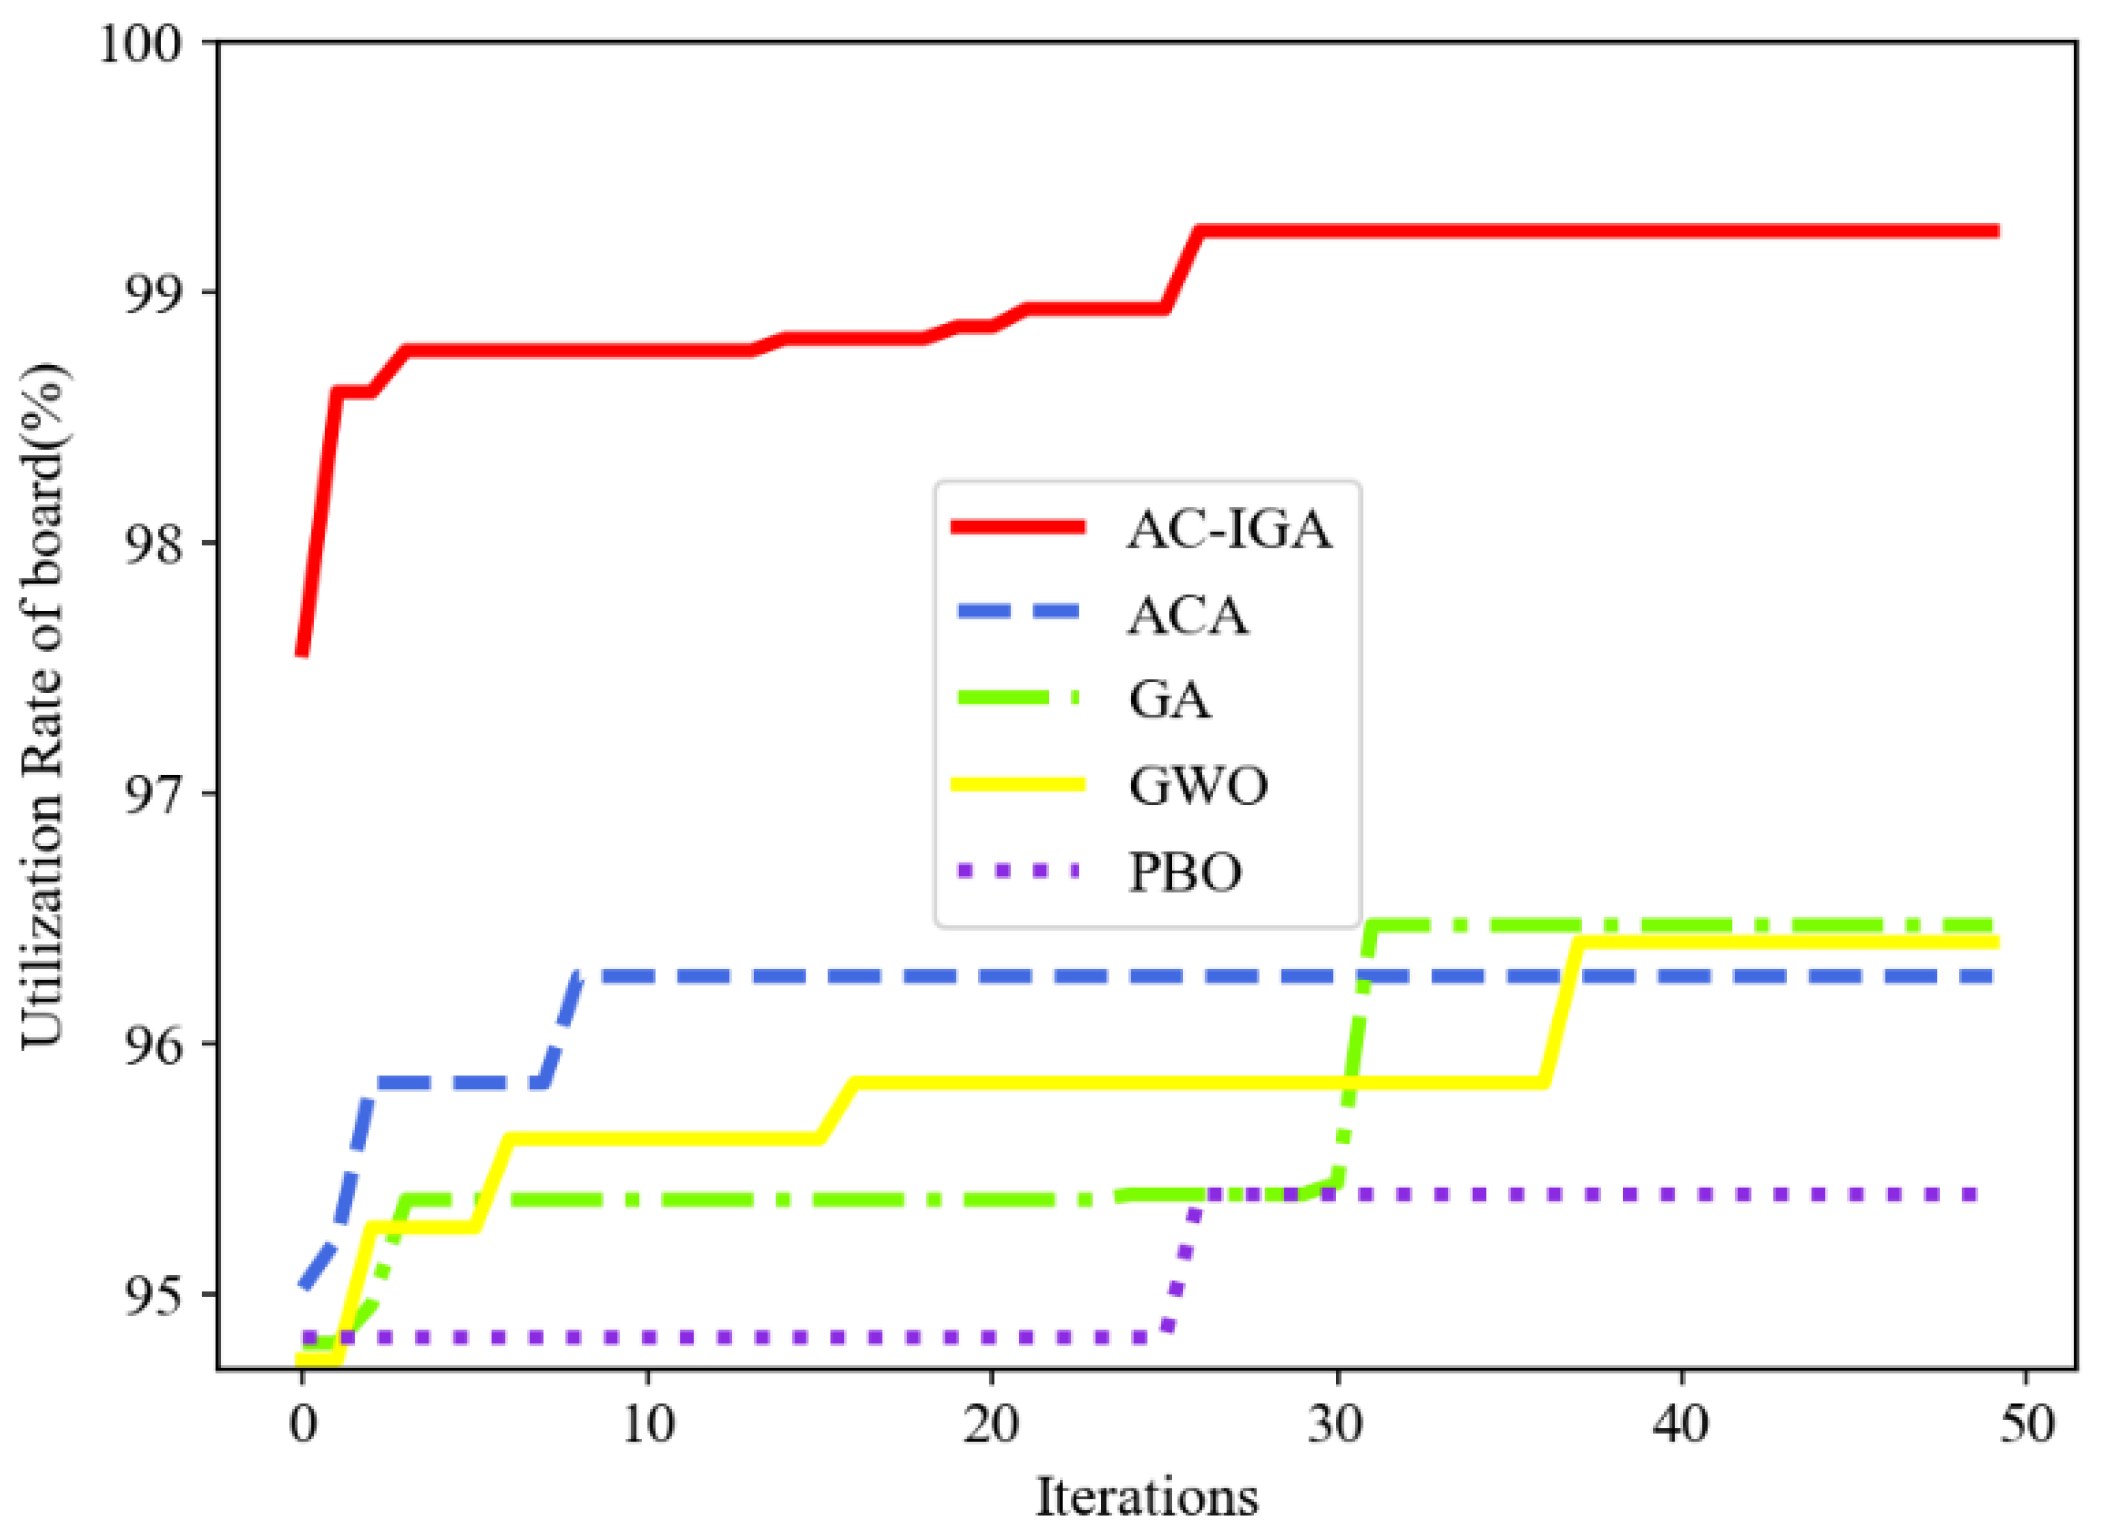
Figure 10 shows the relationship between the highest board utilization rate searched by the five algorithms and the number of iterations; the red solid line is AC-IGA, the blue dashed line is ACA, the green dash–dot line is GA, the yellow solid line is GWO, and the purple dotted line is PBO.
The board utilization rate of the AC-IGA converges to 99.240% after twenty-seven iterations and the board utilization rate of the GA converges to 96.469% after thirty-two iterations, which shows that the AC-IGA can find the optimal solution faster, and the solution quality is better, than the GA. This is mainly because the performance of the GA is excessively dependent on the initial population’s quality; the quality of the initial solutions generated randomly is low, which results in low solving efficiency. In this paper, the solutions generated by each generation of IACA are used as the initial population of AC-IGA, which can improve the solution quality and increase the convergence speed.
The board utilization rate of the ACA converges to 96.266% after nine iterations, which shows that although the AC-IGA is slower than the ACA in finding the optimal solution, the solution quality of the AC-IGA is better. This is mainly because ants are concentrated on some local solutions earlier under the action of the positive feedback mechanism of the ACA, which reduces the population diversity and makes it difficult for ants to further explore new solutions. In this paper, the IGA is introduced into each iteration of the IACA, and the solutions with higher board utilization rate can be obtained through multiple iterations of the IGA. Improved methods (including pheromone update, adaptive strategy, and filter similar individuals) are adopted, which can effectively maintain the population diversity in the evolutionary process, allows for the constant exploration of new layout schemes with higher board utilization rates, and improves the ability to jump out of the local optimum.
In addition, the board utilization rate of the GWO converges to 96.401% after thirty-eight iterations and the board utilization rate of the PBO converges to 95.394% after twenty-seven iterations, which shows that the quality of the solutions found by the AC-IGA is better than that found by the GWO and PBO. This is mainly because the GWO and PBO generated initial populations by random method, which cannot ensure good population diversity. In the GWO, individuals update their location information only based on three optimal individuals (α, β, and δ). Individuals are independent of each other and lack of effective information exchange, resulting in slow convergence speed. If α is the local optimal solution, the GWO will converge prematurely. Besides, the convergence factor used in the GWO decreases linearly with the number of iterations, which does not conform to the actual search process of the GWO and cannot balance the global exploration ability and local development ability.
In summary, the AC-IGA achieved great improvement in solution precision and convergence, and thus is an effective method to solve the solid wood board CSP.
Table 5 shows the optimal layout scheme obtained by the AC-IGA, where I is the layout mode number, II is the length of the original board, III is the length (quantity) of standard boards, IV is the residual length of the original board, and V is the quantity of the layout mode. A total of thirty-one original boards are selected in this layout scheme, and the board utilization rate is 99.240%.
5. Conclusions
This paper investigated the solid wood board cutting stock problem and established a mathematical model, with the optimization goal of the highest possible board utilization rate. An ant colony-immune genetic algorithm (AC-IGA) was proposed to solve this model. The advantages of the AC-IGA are as follows:
(1) To avoid the problem of premature convergence in the ant colony algorithm, we improved the pheromone update method. The adaptive strategy was adopted to jump out of the local optimum when the AC-IGA stagnates for an extended time. In addition, the concentration mechanism and genetic mechanism of individual diversity of the immune system was introduced into the GA, which effectively maintained the population diversity and enhanced the global search ability.
(2) By introducing the IGA into each iteration of the IACA, the global search ability and local exploitation ability could achieve better balance, and the solution quality and search efficiency was greatly improved.
Compared with the ACA, GA, GWO, and PBO, the experimental results showed that the AC-IGA can obtain a higher board utilization rate on the premise of ensuring robustness. This proves that the AC-IGA is a good approach to solve the solid wood board cutting stock problem and is more conducive to maximizing profits for furniture enterprises.


