Article

Fatigue Characteristics of Double Damage Reinforced Prestressed Hollow Slab Beams under Freeze-Thaw Cycle Erosion

1
School of Water Conservancy Science and Engineering, Zhengzhou University, Zhengzhou 450001, China
2
School of Civil Engineering, Zhengzhou University, Zhengzhou 450001, China
3
Yellow River Conservancy Commission of the Ministry of Water Resources, Zhengzhou 450004, China
*
Author to whom correspondence should be addressed.
Appl. Sci. 2021, 11(16), 7692; https://doi.org/10.3390/app11167692
Submission received: 15 July 2021 / Revised: 18 August 2021 / Accepted: 19 August 2021 / Published: 21 August 2021
(This article belongs to the Topic Advances in Dynamics of Building Structures)

Abstract

:
A bridge structure is subjected to different external loads and environmental effects during its operation, which results in different types and degrees of damage to the structure during its service life. Reinforcement is often required to maintain regular operation and extend its service life. However, a reinforced bridge structure continues to be subjected to vehicle loads and environmental erosion. Therefore, research on the durability deterioration mechanisms and fatigue life decay of reinforced structures is key to ensuring the long service lives of bridge structures. To study the influence of freeze–thaw cycle erosion on the basic mechanical properties and fatigue characteristics of a bridge structure and a strengthened structure, 2 m long prestressed hollow slab beams were designed and fabricated based on the principle of a similarity ratio and subsequently pre-cracked by fatigue failure. The prestressed hollow slab beams were strengthened after fatigue damage by two methods: pasting steel plates and pasting carbon fiber cloths. After this, a freeze–thaw cycle test was conducted to study the dynamic and static mechanical index changes and the attenuation of the fatigue characteristics of the prestressed strengthened hollow slab beams under freeze–thaw cycle erosion. Meanwhile, a numerical model for reinforced structures was established based on the ABAQUS software to study the mechanisms governing the attenuation of the fatigue life of the prestressed hollow slab beams with different freeze–thaw cycles. The results showed that the deflections and strains observed for the two methods were less than those prior to reinforcement. For instance, the deflection in the span decreased by 14–15%, and the compressive strain decreased by 5.2% to 6%. Under the fatigue load, the prestressed hollow slab beams strengthened by the two methods could withstand a fatigue load cycle of 2 million, and the reinforced components exhibited good fatigue resistance. Under cyclic erosion and fatigue loading, the deflections and strains in the reinforced prestressed hollow slab beams were increased by varying degrees, such as a 30–40% increase in the tensile strain and a 65–70% increase in the span. The fatigue life of the reinforced hollow slab beams decreased with the increasing number of freeze–thaw cycles, and the decay rate of the fatigue life was accelerated.

1. Introduction

Under the action of adverse environmental erosion and vehicle reciprocating loads, bridges undergo different types and degrees of structural damage. Reinforcement is unavoidable for retaining normal operation. The bridge reinforcement structure also experiences durability degradation; however, the current evaluation of bridge reinforcement structures does not include the durability and fatigue characteristics of the reinforced components when considering the specifications for mandatory restrictions. This durability degradation causes several bridge components to lose the reinforcement effect after a short period of time, resulting in significant economic losses and even major threats to safety, which, in turn, lead to poor social impacts.
Since the 1940s, concrete freeze–thaw damage has been extensively studied in related fields. Fagerlund et al. [1] performed experimental research and demonstrations from different angles, which supported the “hydrostatic pressure hypothesis” of concrete freeze–thaw failure mechanism. Hu et al. [2] proposed a complete reaction mechanism for concrete freeze–thaw failure and considered that the complex stress in concrete due to the freeze–thaw cycle triggered its failure. Ban et al. [3] performed 50 freeze–thaw cyclic corrosion tests by controlling fly ash concrete with different fly ash contents using a rapid freeze–thaw method. The results showed that when the air content was lower than 5%, the frost resistance of the fly ash concrete was greatly improved with increasing air content and was similar to that of ordinary silicate concrete. When the air content was approximately 5–15%, the frost resistance of the fly ash concrete was higher than that of ordinary silicate concrete. Mu et al. [4] conducted single-factor damage tests on three types of concrete with different strength grades. The results showed that the freeze–thaw failure of concrete was a physical change in the internal structure, changing it from compact to loose. Additionally, reducing the water–cement ratio could improve the frost resistance of concrete. In research on freeze–thaw damage of concrete components, Wu [5] established a finite element model of a concrete test block based on test data from a rapid freeze–thaw cycle test conducted on a concrete test block. The effects of different loading rates on the concrete material after the freeze–thaw damage were analyzed, and it was found that for a constant number of freeze–thaw cycles, the growth value of the flexural tensile strength of the concrete material increased with the speed of the loading rate. Wang [6] used finite element analysis software to simulate and analyze the fatigue behavior of prestressed concrete components under alternating freeze–thaw and fatigue, based on the attenuation model of concrete strength under freeze–thaw erosion. The freeze–thaw influence factor was first introduced to characterize the effect of freeze–thaw cyclic erosion on the fatigue reliability of prestressed concrete components. Hasan [7] found that the tensile strain increased irreversibly during freezing, and the static strength and fatigue life of the concrete decreased. Li et al. [8] experimentally investigated an evolution model for concrete damage under the condition of freeze–thaw erosion and four-point bending fatigue load. The micromirror observation showed that crack generation was related to two types of damage, primarily affecting the concrete pores and interface area. Wei et al. [9] analyzed concrete fatigue under freeze–thaw erosion from the perspective of durability, considering that the failure caused by non-mechanical factors was similar to that caused by load. The specific failure process was analyzed, and a damage model was proposed. Xu [10] established a theoretical model for the stress analysis of a prestressed concrete specimen section and a fatigue life prediction model based on the concrete elastic modulus attenuation model. This was achieved by conducting freeze–thaw and fatigue alternate action experiments on 12 prestressed concrete specimens, and the fatigue lives of prestressed concrete members under freeze–thaw cycles and fatigue loads were subsequently predicted.
The main reinforcement methods used during the research on bridge reinforcement were as follows: increasing section reinforcement, replacing the concrete reinforcement, using externally bonded steel reinforcements, pasting fiber composite reinforcements, external prestressing, adding support systems, shear wall method, etc. Among them, research on the application of FRP materials, such as carbon fiber, aramid fiber, and high-strength glass fiber [11,12,13,14,15,16,17,18,19,20,21], in bridge reinforcement and maintenance has gained popularity in recent years. At present, both local and international scholars have conducted relevant research on the mechanical and fatigue properties of reinforced concrete structures strengthened by pasting steel plates and carbon fiber sheets. With regards to strengthening concrete members using prestressed CFRP sheets, Naaman [22] studied the shear and flexural properties of reinforced concrete beams strengthened using CFRP sheets at low temperatures. It was found that such temperatures did not affect the section strengths of the concrete and the CFRP sheets. Bizindavyi et al. [23] studied the influence of the bond width and length on the fatigue life by conducting a fatigue property test on GRRP-reinforced concrete. It was found that longer bonds could prolong the fatigue life, whereas shorter bond lengths were prone to stress concentration in the bond area. Ning [24] performed a freeze–thaw experiment on concrete beams strengthened using prestressed carbon fiber sheets. The results showed that the cracking load and stiffness of the test concrete beams were reduced with the increase in the freeze–thaw cycles, and the freeze–thaw cycles adversely affected the concrete beams strengthened using prestressed carbon fiber sheets. Cui [25] conducted bearing capacity tests on 15 prestressed CFRP strengthened beams with different freeze–thaw cycles under different prestress levels. The changes in the bearing capacities of the beams strengthened using prestressed CFRP under different freeze–thaw cycles were analyzed, and the results showed that the shear capacities of the beams decreased with the increasing number of freeze–thaw cycles. Moreover, the freeze–thaw cycles degraded the strength of the beams strengthened using prestressed CFRP and also the bond strength between the reinforcement and the interface. Jiang [26] studied the influence of freeze–thaw cycles on the durability of the reinforcement components by conducting a four-point bending test on pre-stressed CFRP reinforcement structures under a freeze–thaw cycle. The results showed that the mechanical properties of the reinforced concrete specimens were reduced by the freeze–thaw cycle, and the bending–shearing inclined cracks on the surfaces of the concrete specimens developed rapidly with increasing freeze–thaw cycles. Zhang [27] conducted a finite element simulation analysis on the fatigue characteristics of concrete beams with different basalt fiber cloth reinforcement layers under freeze–thaw and fatigue coupling. It was found that the fatigue life of basalt fiber cloth reinforced concrete under fatigue loading increased with the increasing number of basalt cloth adhesive layers. Yu [28] analyzed the effects of different stress levels on the fatigue properties of the reinforced concrete beams strengthened using carbon fiber cloth under freeze–thaw cyclic erosion. With regards to research conducted on the mechanical and fatigue properties of the concrete members strengthened using steel plates, Yasin N. et al. [29] presented a set of formulas for calculating the reinforcement of concrete structures using bonded steel plates based on the ductility design method. The effects of using bonded steel reinforcements on cracked concrete beams were concluded to be primarily related to the size of the steel plates. Swamy et al. [30] analyzed the connection between the steel plates and the concrete in a steel plate reinforcement. It was concluded that the bearing capacity of the concrete beam strengthened using bonded steel plates was not only related to the section area of the steel plate but also its anchorage mode. Xie et al. [31,32] analyzed a mechanism for improving the flexural resistance and shear resistance of RC beams using riveted steel plates. A recommended formula for calculating the flexural and shear capacities of the RC beams strengthened using anchored steel plates was subsequently proposed along with construction measures for riveted steel plate reinforcement. Wang [33] used a fatigue test to analyze the changes in the mechanical properties of the concrete beams strengthened using bonded steel plates under a fatigue load. The results showed that the fatigue failure law of bonded steel reinforced beams conformed to the three-stage law of internal damage in concrete. The deflection gradually increased with the increase of the number of fatigue load cycles. The deflection after two cycles was approximately 1.46 times the initial deflection. With regards to comparison studies conducted on the reinforcement of concrete members using steel plates and carbon fiber cloths, Inoue and Shoichi [34,35] studied the mechanical strengths and fatigue properties of concrete beams with reinforced carbon fiber and steel plates and compared them to unreinforced specimens in terms of the related mechanical properties. It was found that the deflections and crack widths of the reinforced components were relatively small, and their ultimate bearing capacities were significantly greater. Moreover, it was found that the fatigue performance of the concrete specimens strengthened using carbon fiberboards and steel plates could be improved. Zhang [36] and others conducted fatigue tests and a fatigue load finite element simulation analysis on concrete beams strengthened using steel plates and CFRP, respectively. The mechanical properties of concrete strengthened using bonding reinforcement technologies were studied. The results showed that under a constant fatigue load, the stress of the CFRP cloth of concrete beams strengthened using CFRP increased with increasing fatigue cycles; however, the steel plates in the concrete beams strengthened using steel plates experienced bond failure after a certain number of fatigue load cycles.
At present, research on the durability of bridge structure reinforcement is mostly conducted for healthy structures, while the mechanical performance of damaged and healthy reinforced structures is different and depends on the type and degree of damage. Moreover, research on the relationship between durability deterioration and structural fatigue characteristics is limited. The deterioration of the durability of reinforced bridge structures affects the fatigue lives of the reinforced structures and leads to a loss of the reinforcement effect. The prestressed hollow slab is a bridge structure widely used in highway and municipal engineering. However, owing to overloading, adverse environmental erosion, and low design standards for early bridges, the durability of a prestressed slab in service significantly deteriorates; therefore, it must be reinforced. However, the lack of research on the durability of prestressed concrete hollow slab reinforcement and its impact on the fatigue life of the structures has resulted in several bridges prematurely losing their reinforcement effect because of a significant deterioration of reinforcement durability and the rapid decay of fatigue life after being strengthened. This poses a hidden danger to the safety of projects.
Therefore, a 2 m long structural model of a prestressed hollow slab beam was designed and constructed in this study, and freeze–thaw cycles and fatigue tests were conducted on the prestressed hollow slab strengthened after fatigue damage. Moreover, based on experimental data, a numerical model for strengthened components was established, and the mechanisms of durability deterioration along with the law for the fatigue life decay of fatigue damaged prestressed concrete hollow slabs under the action of freeze–thaw cycle erosion were studied. The results of this study are of great significance for revealing the fatigue characteristics of prestressed hollow slab beams that have undergone corrosion by freeze–thaw cycles, as well as for understanding the durability degradation mechanism of actual bridge structure reinforcements, optimizing the reinforcement scheme, detecting and evaluating a reinforced bridge, and predicting the remaining life of a reinforced bridge structure.

2. Experimental Design

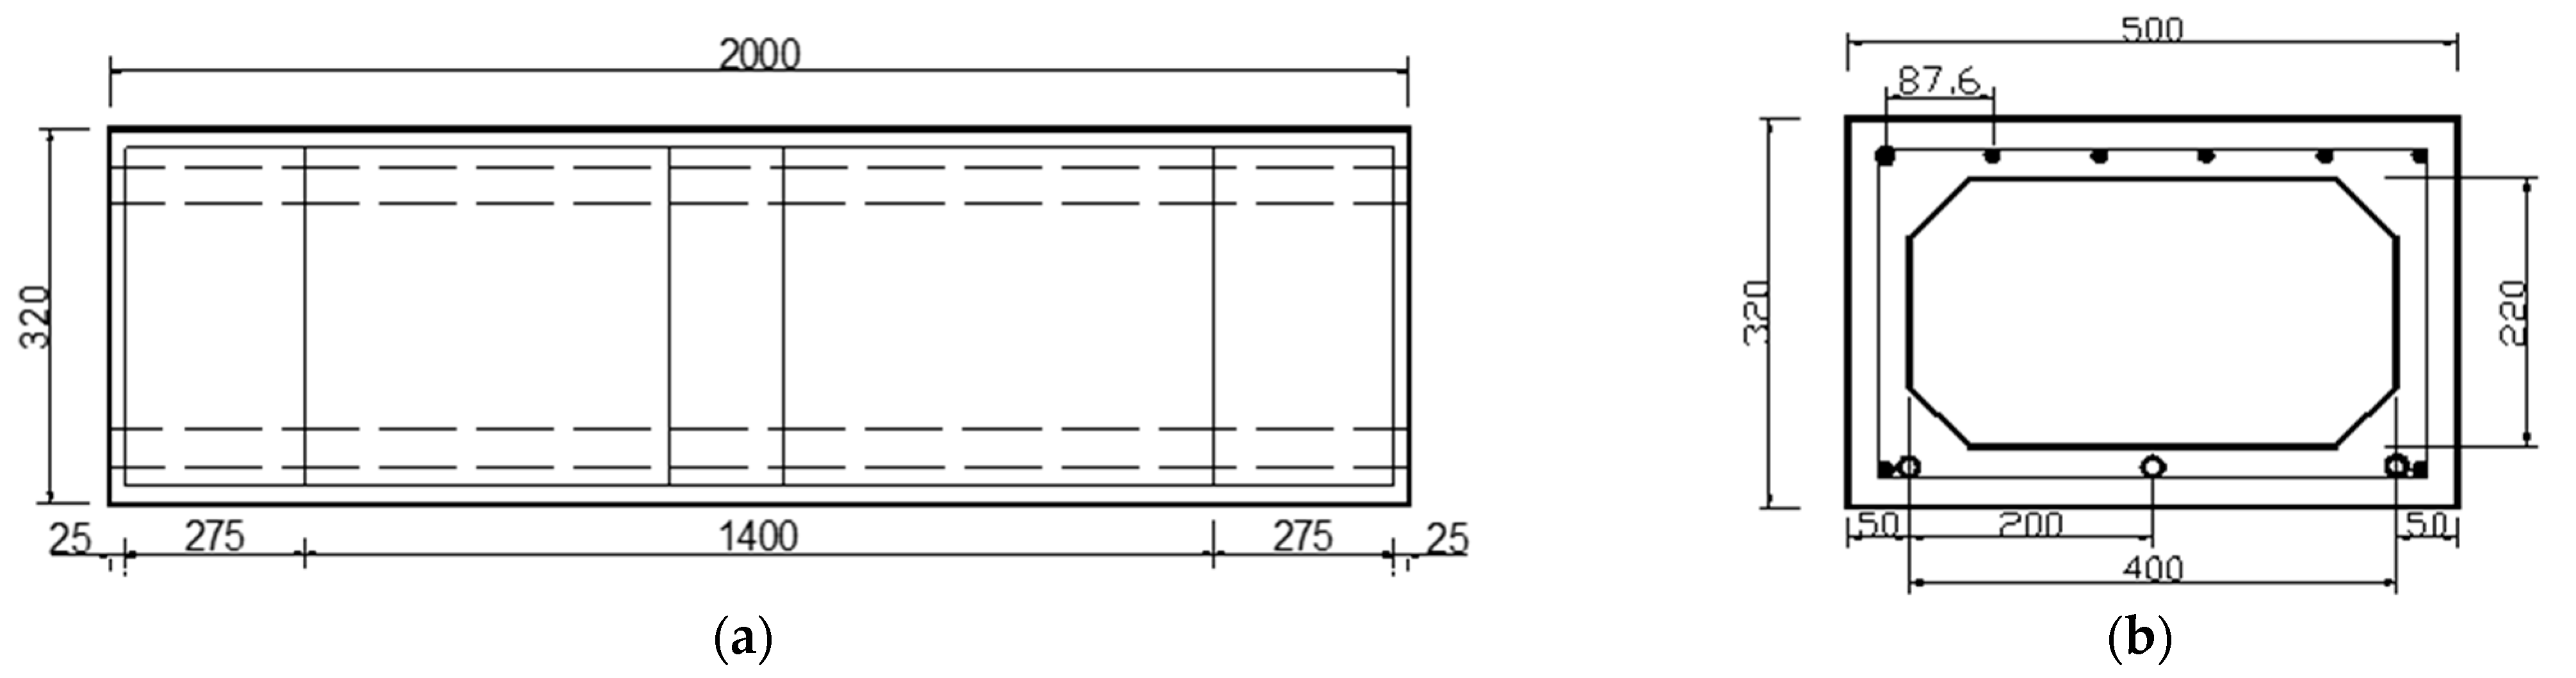
2.1. Component Design

During the tests, considering the freeze–thaw test site and the actual test hoisting and placement in the fatigue laboratory, a 20 m reinforced concrete hollow beam was selected as the prototype. The concrete’s designed strength was C50, and 5 bundles of prestressed steel strands with a nominal diameter of 15.2 mm were configured, according to the similarity principle. As shown in Table 1, the prestressed design length of the concrete beam was 2 m, the height was set at 320 mm, and the section width was set at 500 mm. The hollow cavity inside the test beam was 220 mm high and 400 mm wide, and the chamfer of the hollow region was 50 × 50 mm. The lower flange of the prestressed concrete hollow beam was equipped with three prestressed steel strands, in the form of a straight line. The stirrups were densified within a 300 mm range from the front and rear ends of the prestressed concrete hollow beam to the support, and the distance between the stirrups was 50 mm. The remainder of the middle region was arranged according to the rule of equal spacing of 100 mm, as shown in Figure 1.
In this test, two reinforcement methods of glued steel plate and glued carbon fiber cloth were used to reinforce the test plate with fatigue damage (the maximum crack width was about 0.2 mm), and then durability and deterioration tests were carried out on the reinforced test plate, and finally fatigue characteristics tests were carried out on the test plate after durability deterioration. A total of 5 test plates were made, and the specific test protocol design is shown in Table 2.

2.2. Material Parameters

The test beam was a prestressed hollow slab concrete beam with a concrete strength design grade of C50. Hot-rolled HRB400 steel bars were used for ordinary stirrups and the longitudinal steel in the prestressed hollow slab concrete beams. The calculated cross-sectional area was 28.26 mm2, the tensile pressure limit was 330 MPa, and the elastic modulus was 2.0 × 10⁵ MPa. The prestressed steel bars in the prestressed hollow slab beams were 1860 grade 1 × 7 common steel strands. The elastic modulus was 1.95 × 10⁵ MPa and the Poisson ratio’s was 0.3.

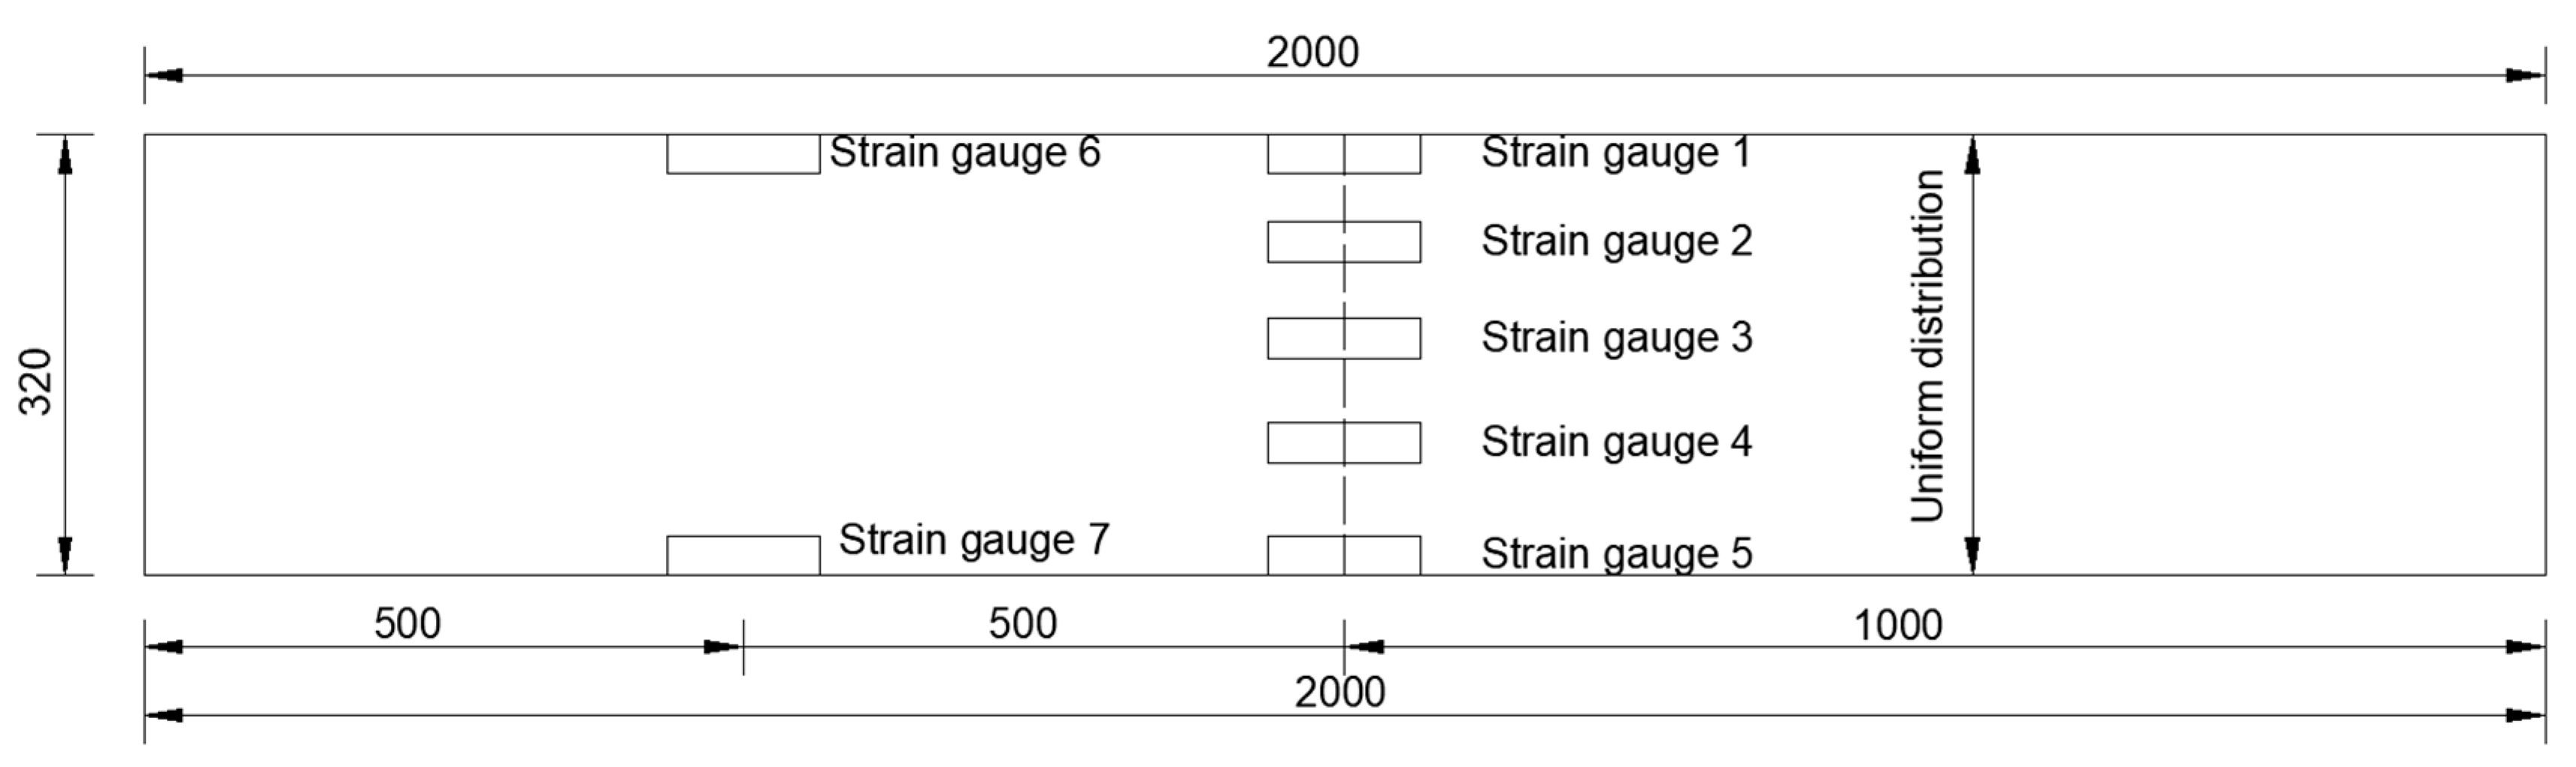
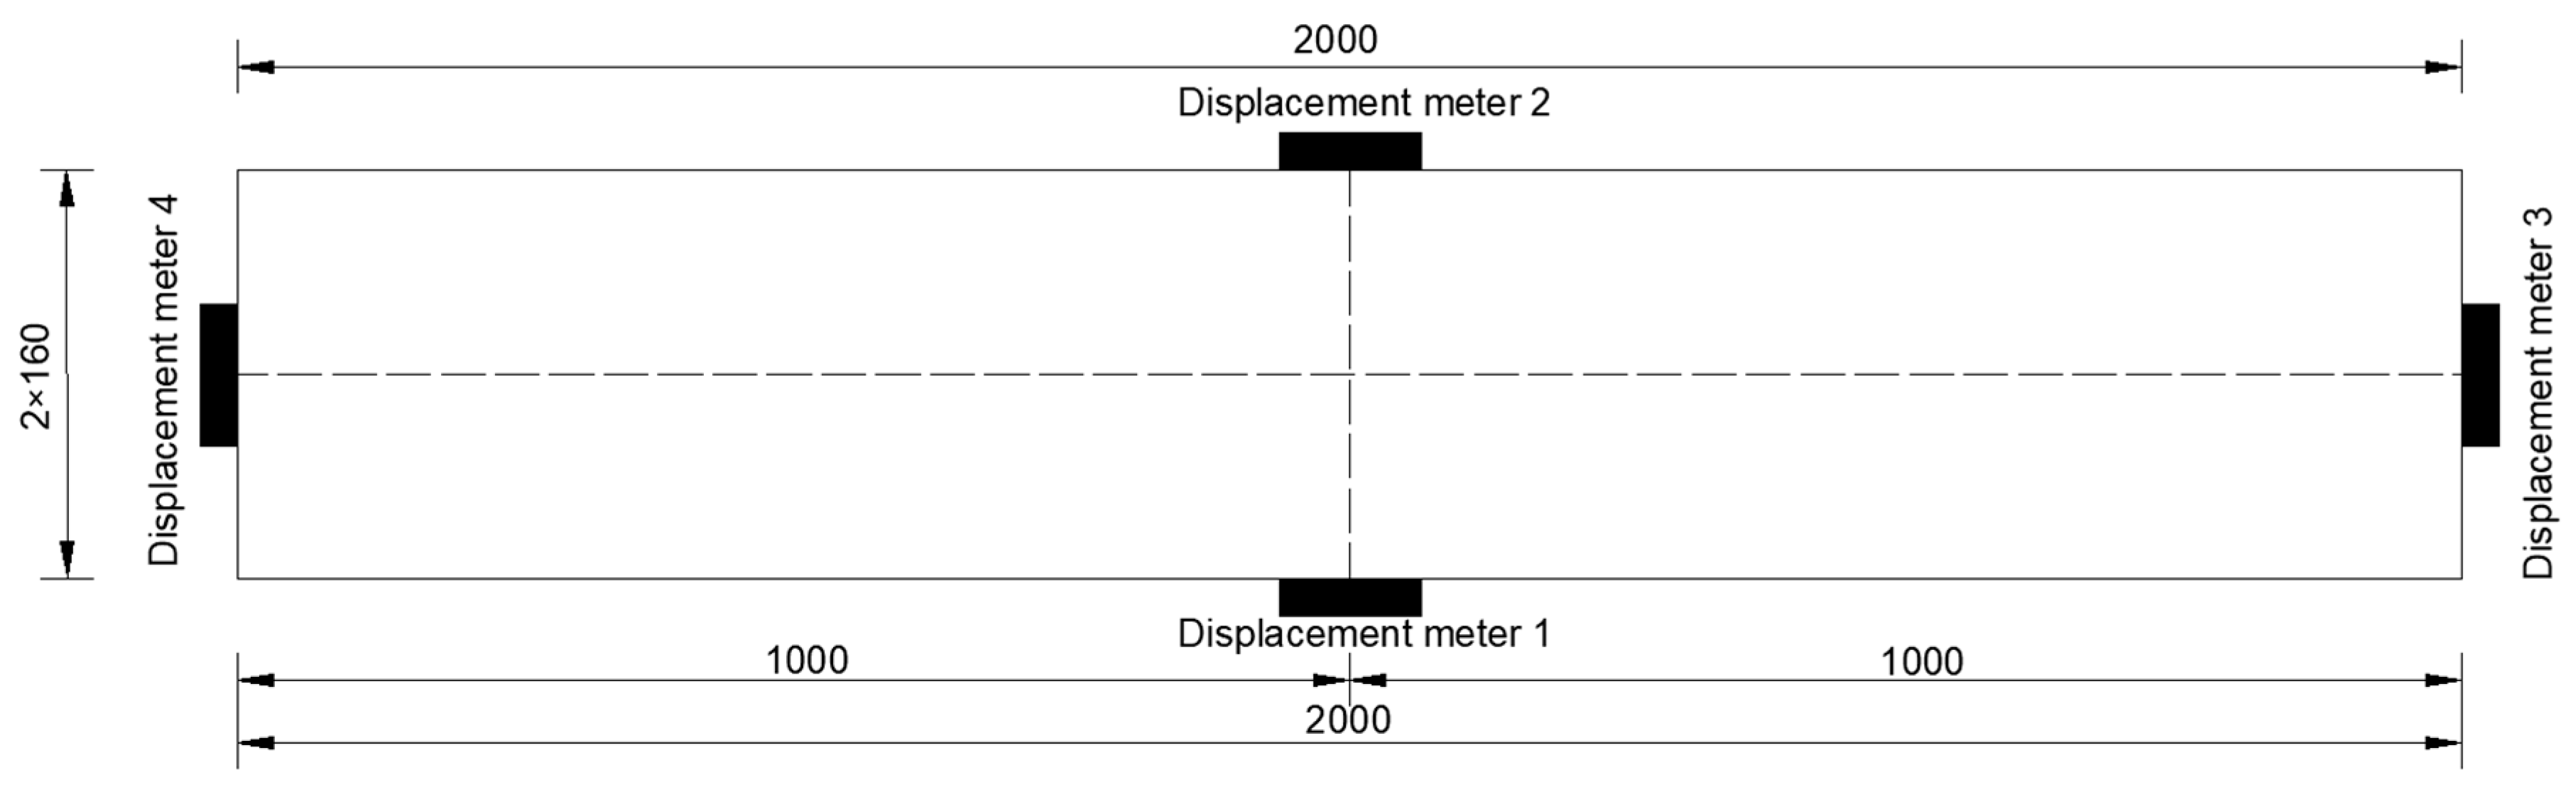
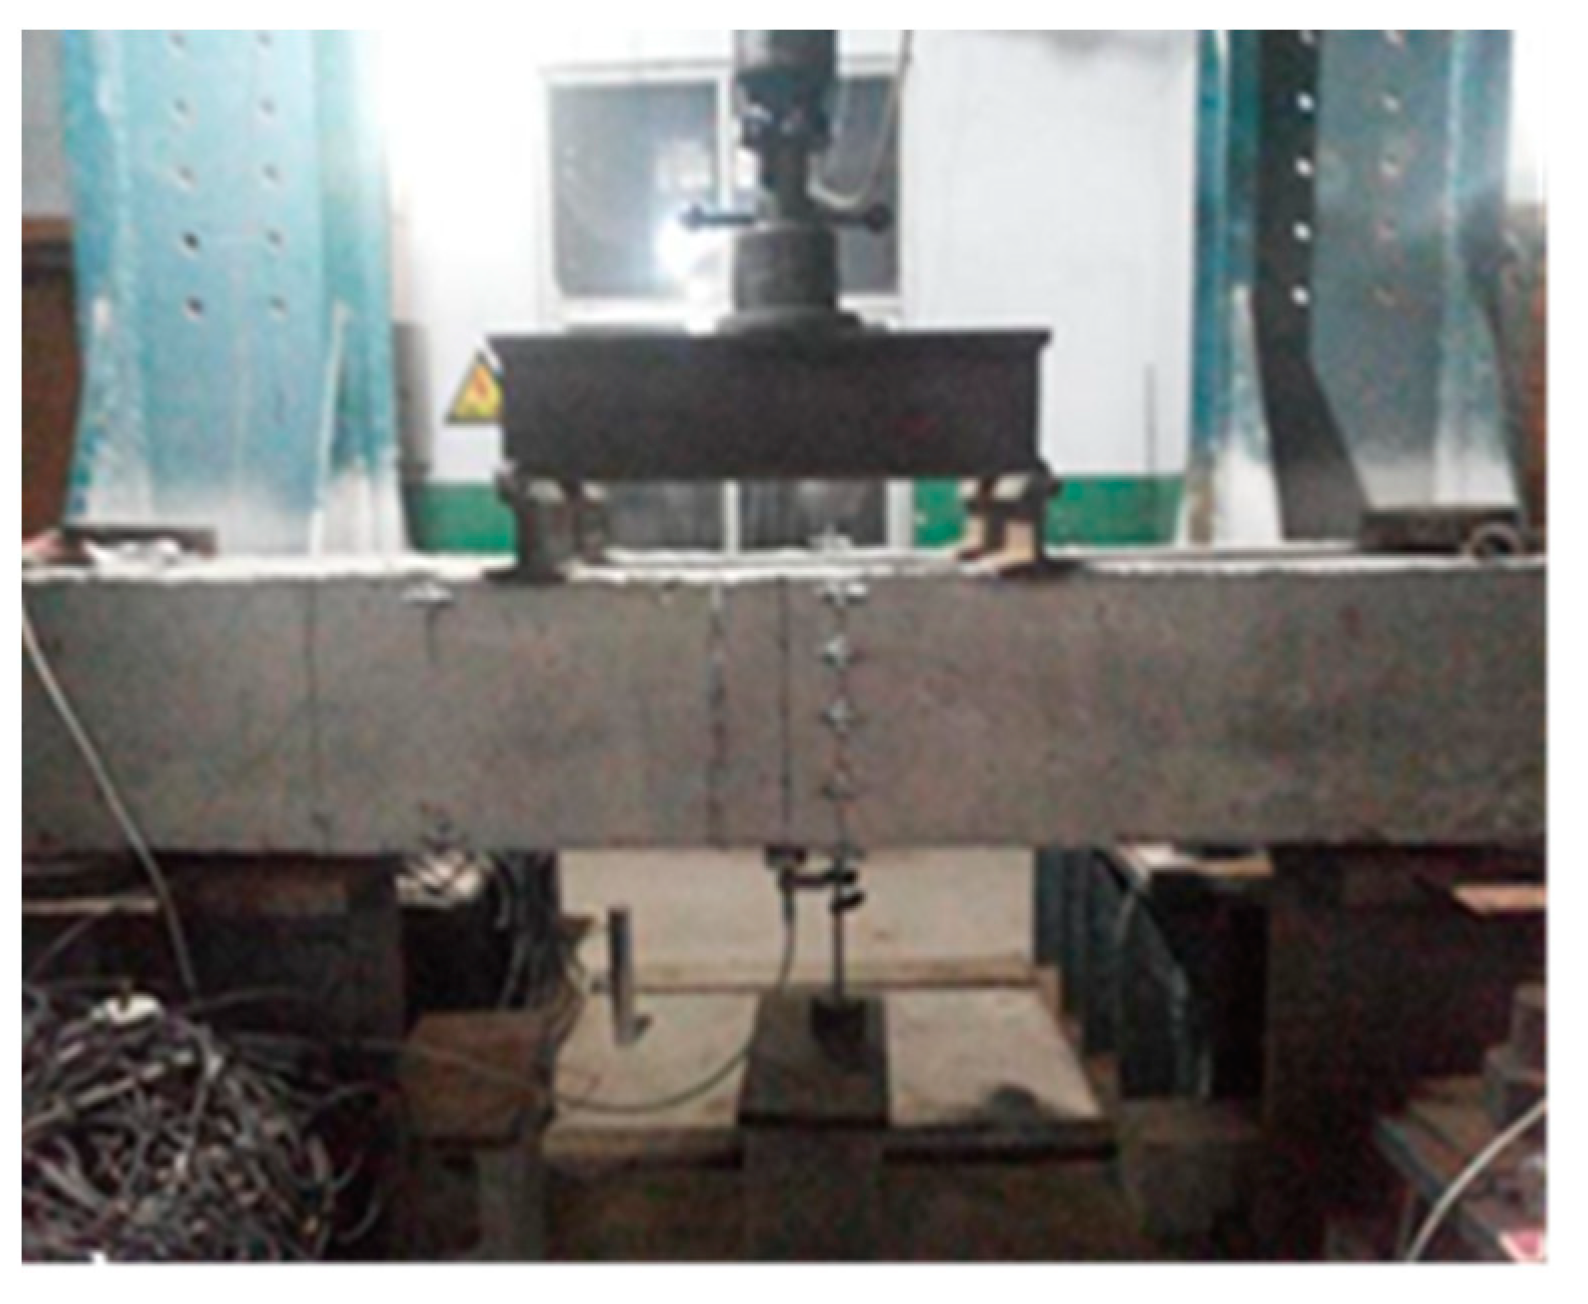
2.3. Main Measurement and Methods

The measurements mainly included those of the concrete strain and vertical deflection of the prestressed hollow slab beam under a fatigue load. While obtaining the ultimate bearing capacity of the test plate, the measurements were used as an auxiliary method to observe the failure of the test beam.
Strain test: The strains at 1/4 length and at the midspan of the test beam were measured. As shown in Figure 2, two electronic strain gauges were placed on the test plate at a quarter of the length of the test beam. Five electronic strain gauges were placed on either side of the midspan, totaling 14 instruments. The measurement range of resistance strain sensor is ±2000 με, and the accuracy is 0.01 με.
Displacement test (dynamic and static displacement): The dynamic and static displacements at both ends and at the midspan of the test beam under static and fatigue loads were measured. One displacement meter was placed at each end of the test beam, and one was placed at each side of the transverse bridge in the midspan, totaling 4 displacement meters. Figure 3 shows the specific layout. The measurement range of the resistance displacement sensor is 0–50 mm, and the accuracy is ±0.1% F.S.

3. Fatigue Pre-Cracking Experiment of the Prestressed Hollow Slab Beam

3.1. Static Load Failure Test

The primary objective of static loading of the prestressed hollow slab beam was to obtain the ultimate capacity of the test plate, for determining the fatigue test stress ratio and the fatigue amplitude of the prestressed concrete test beam. As shown in Figure 4, a trisection loading method was used to align the longitudinal and transverse axes of the test beam, and subsequently, two I-beams of the same length were arranged at the third point of the test beam in a direction perpendicular to the axial direction of the beam. After the trisection loading had been achieved, a larger I-beam was placed at the upper center of the two I-beams along the same direction, and several rubber pads were placed on the upper region.
The loading process adopted for the test beam was step-by-step static loading. A static load test was performed at 5 kN at each stage, and the load was maintained for 3 min each time. After the strain gradually stabilized, the strain, displacement, and test load were determined. This process continued until the test beam completely lost its bearing capacity and failed, and the ultimate bearing capacity was recorded. When the prestressed hollow slab beam was loaded to 255 kN, it was damaged. The static load failure state of a prestressed hollow slab beam, extensively described in the literature [37], is not described in this paper. From the experimental data obtained during the static load experiment, the ultimate capacity of the test plate was Pmax = 250 kN.

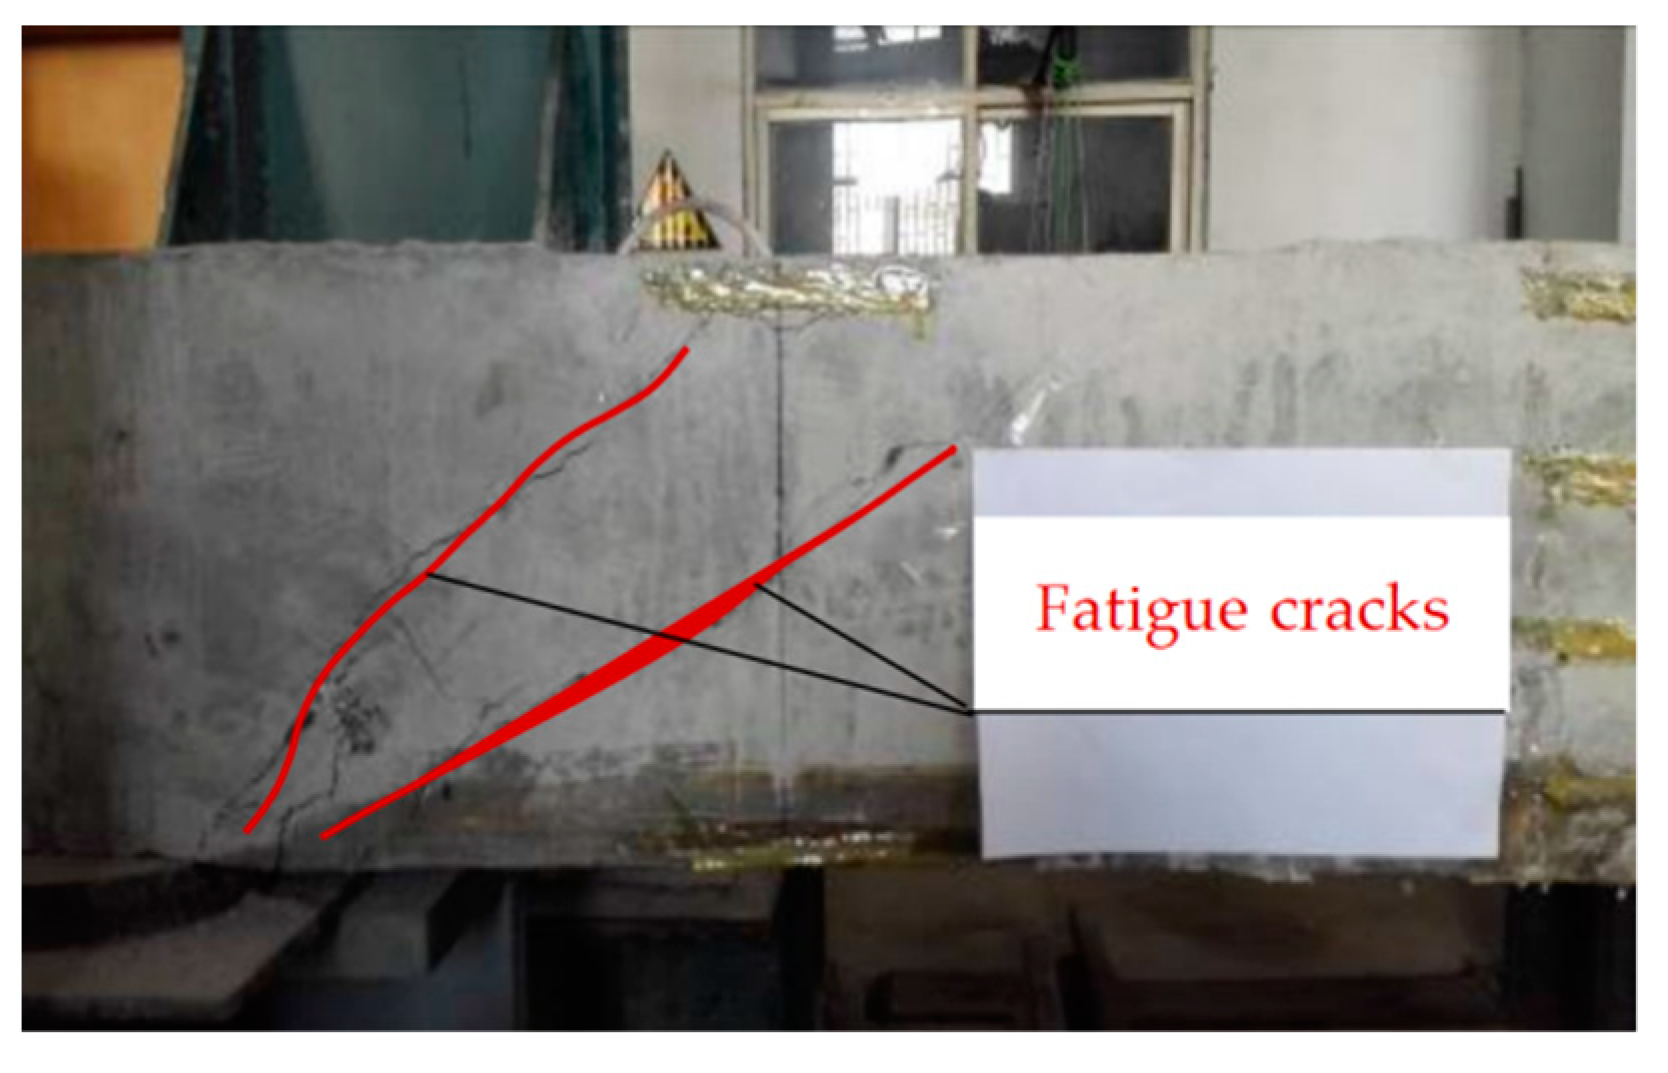
3.2. Pre-Cracking Test of the Test Beam

The pre-cracking test conducted on the prestressed hollow slab beam mainly consisted of performing fatigue cyclic loading tests on the prestressed concrete beam until fatigue cracking occurred in the test beam. The crack width was controlled to not exceed 0.2 mm, which provided components for later reinforcement related tests. The fatigue loading instrument also utilized a hydraulic pressure testing machine, which changed the loading mode from a static load to fatigue dynamic load. This, in turn, caused the machine to apply a sinusoidal alternating load to the prestressed concrete test beam.
The maximum and minimum fatigue loads were Fmax = 160 kN, and Fmin = 60 kN, respectively, and the frequency was 5 Hz. After every 5.0 × 10⁵ cycles of fatigue loading, static loading was performed on the test beam, and the loading level was 5 kN for each level, which was accumulated in turn. For every 5.0 × 10⁵ cycles of fatigue loading, the fundamental frequency, dynamic displacement loading, crack, width, and development law were recorded. The fatigue test was stopped immediately when the width of the fatigue crack on the test plate was observed to reach 0.2 mm (Shown in Figure 5).

4. Fabrication of the Damaged Prestressed Hollow Slab

Commonly used structural reinforcement methods in engineering include using externally bonded steel, using bonded fiber composites, external prestressing reinforcements, increasing the section reinforcement, the shear wall method, and replacement concrete reinforcements. Among them, pasting steel plates and carbon fiber sheet reinforcements are widely applied in the field of engineering reinforcement owing to their convenient construction technology and wide range of uses. Therefore, the fatigue damaged prestressed hollow slab beam was reinforced by pasting steel plates and carbon fiber sheets.
The reinforcement design scheme of the prestressed hollow slab beam was determined according to the relevant provisions of the ‘Specifications for Strengthening Design of Highway Bridges’ [38]. A Q235 steel plate, having an elastic modulus of 206 GPa, a hoop plate width of 10 cm, and a thickness of 4 mm, was used as the steel plate material for reinforcements with pasted steel plates. The reinforcement steel plate was pasted obliquely at 45°. A first-class carbon fiber cloth with an elastic modulus of 2.4 × 10⁵ MPa, with length × width × thick of 2000 mm × 100 mm × 0.167 mm was used for reinforcements with pasted carbon fiber cloths. The width and spacing of the carbon fiber cloth were 10 cm, and 150 mm, respectively.
The carbon fiber and steel plates were both bonded with epoxy resin binder. The shear strength, tensile strength, bending strength, and bond strength of the epoxy resin binder were ≥10 MPa, ≥30 MPa, ≥40 MPa, and ≥2.5 MPa, respectively, while the elongation was 1.5%. The operating ambient temperature was 30–45 °C. The available time was 30 min. This binder had no sagging property.

4.1. Reinforcement Treatment of the Damaged Prestressed Hollow Slab

The prestressed hollow slab reinforced with carbon fiber cloths was constructed as follows: ① Surface treatment: the surface reinforcement area of the test slab was ground, the laitance on the surface was cleaned, the structural layer of the test slab was exposed, the surface of the test slab was cleaned, and the test slab was kept dry after grinding. ② Brushing primer: the base adhesive was deployed according to the designed mix proportion of the adhesive; the base adhesive was uniformly spread onto the surface of the concrete, and the next step was initiated after drying the surface of the base adhesive. ③ Carbon fiber sheets of calculated sizes were cut and pasted onto the reinforcing region, they were rolled along the direction of the carbon fiber cloth several times with a roller, bubbles between the carbon fiber cloth and the concrete sticking interface were extruded, and the structural adhesive was made to fully saturate the carbon fiber cloth, which was subsequently pasted. The construction drawing of the test beam reinforced with carbon fiber sheets is shown in Figure 6.
The construction process of the prestressed hollow slab beam strengthened by pasting steel plates was as follows: ① Surface grinding: the surface of the test plate was ground with a grinding wheel, the dust on the surface of the test plate was washed with clean water, and the surface was wiped with absorbent cotton dipped in acetone after the surface of the test plate was dry. ② Configuration of the structural adhesive: the structural adhesive was configured on-site, and the raw materials of the structural adhesive were poured into clean iron barrels in proportion and subsequently mechanically stirred in one direction until the color was uniform. ③ Pasting the steel plate: the prepared adhesive was smeared onto the bonding surface of the steel plate with a spatula, the steel plate was pasted at a fixed position, and a steel nail was subsequently driven into the concrete from the surface of the steel plate with an air nail gun to ensure a better paste quality. ④ Solidification of the reinforced components: the reinforced test plate was solidified at 20 °C, and the test specimen could be stressed within a three-day curing period. The construction drawing of the test beam strengthened by pasting steel plates is shown in Figure 7.

4.2. Static Load Test of the Reinforced Prestressed Hollow Slab

To test the effects of the two reinforcement methods on the test plate, a static load test was performed on the test plate reinforced by different reinforcement methods. The test method and procedure of the static load test were the same as those prior to reinforcement. The carrying capacity of the prestressed hollow slab beam after reinforcement had changed; therefore, the load applied to the prestressed hollow slab beam after reinforcement was appropriately reduced, and the maximum load applied was 150 kN based on previous static load test results. As shown in Table 3 and Table 4, D-1/2 is the mid-span deflection value of the test plate after reinforcement, D-1/4 is the 1/4 span deflection value of the prestressed hollow slab beam after reinforcement, S-1 is the compressive strain of the concrete at the top of the mid-span web of the test slab, and S-2 is the tensile strain of the concrete at the bottom of the mid-span web of the test slab.
Table 3 and Table 4 show that the deflections before and after reinforcement increased with increasing load level, and the trend of the change was stable. Under a static load, the deflections at the quarter span and half span of the prestressed hollow slabs strengthened using steel plates and carbon fiber sheets were significantly lower than those of the damaged specimens prior to strengthening. Under a load of 150 kN, the deflection at the 1/2 span of the carbon fiber sheet strengthened specimen was 0.79 mm, which was 0.94 mm relative to the deflection of the half span prior to reinforcement, and the deflection value decreased by 14.2%. The deflection at the one-half span of the prestressed hollow slab components strengthened using steel plates under a load was 0.82 mm, which was 15.4% lower than the value of 0.97 mm obtained prior to reinforcement; when subjected to a constant load, the tensile and compressive strains generated by the mid-span concrete of the test plate before and after reinforcement were compared. The compressive strain in the mid-span top concrete of the prestressed hollow slab and the tensile strain generated by the bottom concrete were both lower than those of the prestressed hollow slab prior to strengthening. When the applied load was 150 kN, the compressive and tensile strains of the carbon fiber cloth strengthened specimens were reduced by 6% and 4.9%, respectively, and the compressive and tensile strains of the bonded steel plate strengthened specimens were reduced by 5.2% and 10%, respectively. In addition, the fundamental frequencies and damping ratio of the test plate before and after strengthening were analyzed. The damping ratio of the prestressed hollow slab prior to strengthening was 5.88 and 5.52, respectively, and the damping ratio values of the prestressed hollow slab strengthened with steel plates and carbon fiber cloth were 5.49 and 5.33, respectively. The test showed that the damping ratio before reinforcement was greater than that after reinforcement, which could be attributed to the friction between the original cracks of the test plate being restrained after reinforcement by sticky steel plates and sticky carbon fiber cloths; another possibility is a change in the overall stiffness of the plate resulting from their strengthening. The input capacity of the dissipating external energy of the test plate was lower, the vibration attenuation was slower, and the damping ratio was smaller. Through a comprehensive analysis of the static load data of the two reinforcement methods, it was found that both methods improved the failure load and structural stiffness of the damaged prestressed hollow slab beams to varying degrees. Neglecting other factors, the reinforcement effect achieved by using bonded steel plates was better that than using pasted carbon fiber cloths.

4.3. Fatigue Test of the Reinforced Prestressed Hollow Slab

To study the mechanical properties of the reinforcement components under fatigue loading, fatigue tests were performed on the reinforced specimens bonded with carbon fiber cloths and steel plates. A hydraulic fatigue testing machine was used for the fatigue test, and trisection loading was used. Two million cycles of fatigue loading were performed on the prestressed hollow slabs with two different strengthening methods.
Fatigue test analysis of components reinforced with bonded steel plates: During 2 million cycles of fatigue loading on the steel plate-bonded reinforced components, the existing damaged cracks did not extend further and no new cracks appeared because of the restraint of the inclined steel plate. The results showed that the mid-span deflection was 1.43 mm, the compressive strain of the concrete was −325.6 με, and the tensile strain of the concrete was 258.3 με after a fatigue load of 200 kN was applied 2 million times.
Fatigue test analysis of the components strengthened using carbon fiber cloths: During 2 million cycles of fatigue loading, the original fatigue damage cracks developed slowly. Moreover, for approximately 1.2 million cycles of fatigue loading, a new crack appeared at the shear section of the reinforced member, which also developed slowly during continuous loading. The mid-span deflection was 1.44 mm, the compressive strain of the concrete was −362.6 με, and the tensile strain of concrete was 260.4 με after 2 million cycles of a 200 kN fatigue load.

5. Freeze–Thaw Erosion Test of the Fatigue Damaged Reinforced Components

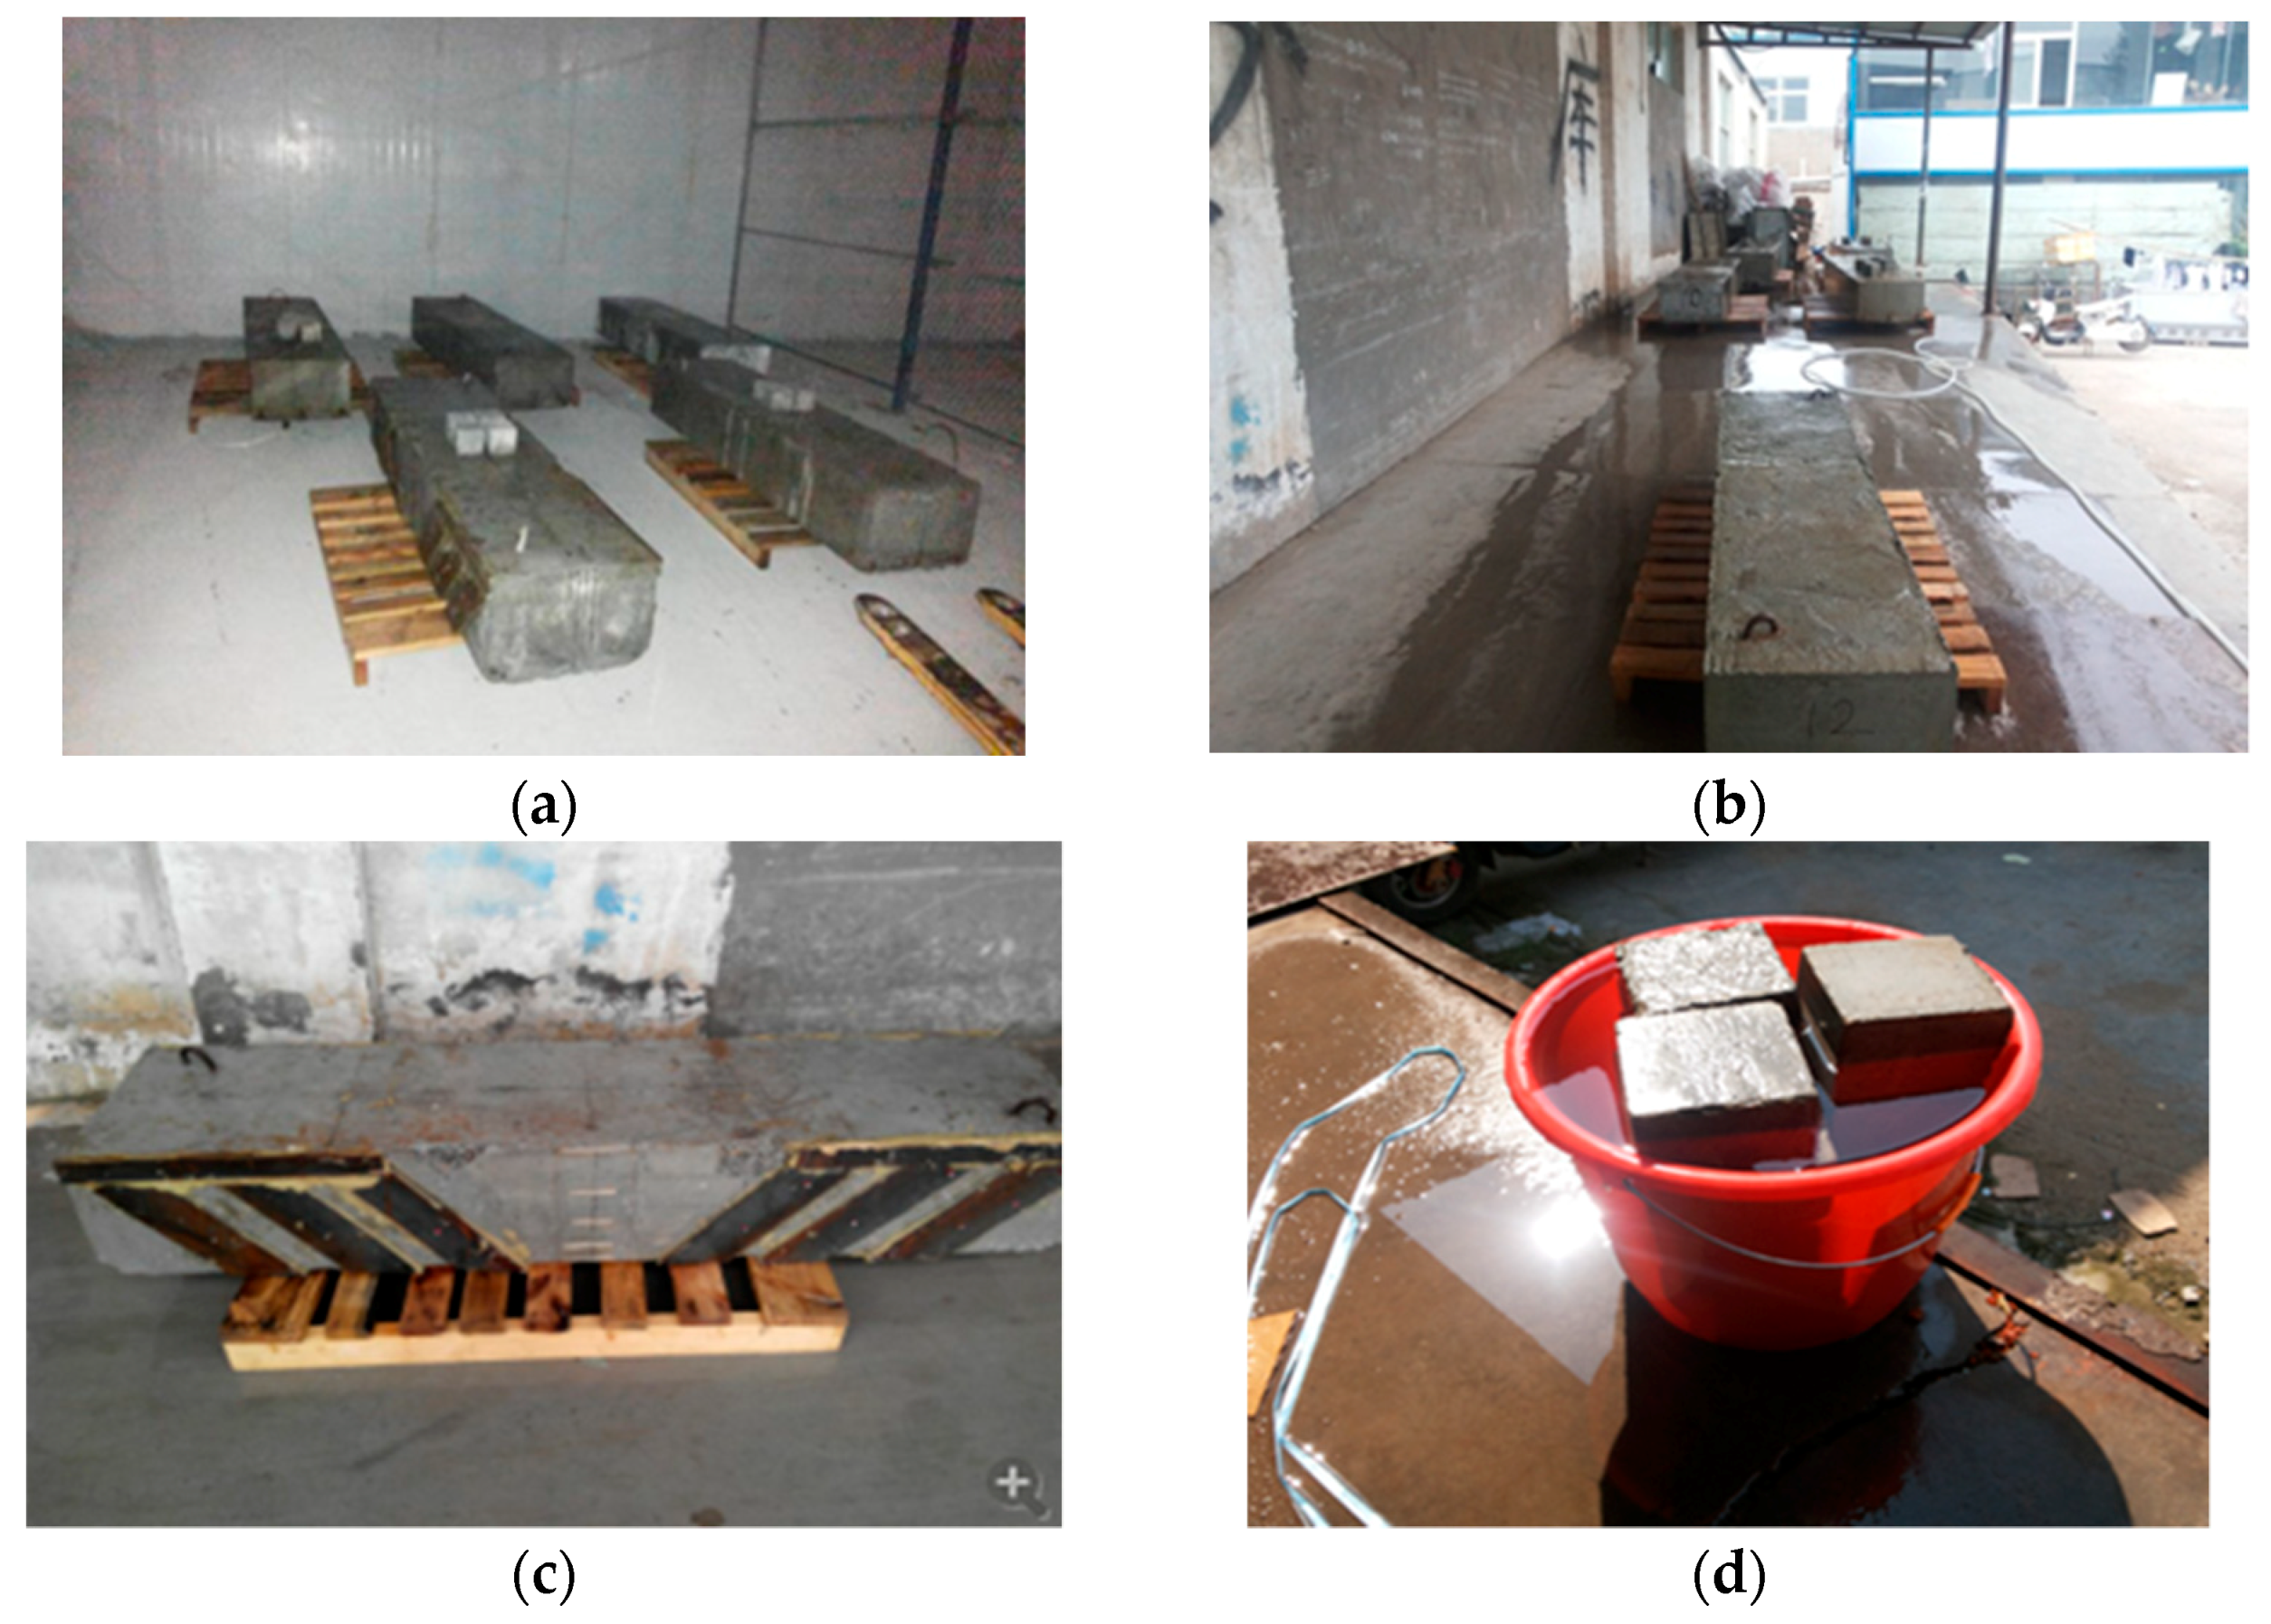
5.1. Freeze–Thaw Erosion

Along with durability specifications [39], 50 freeze–thaw cycle erosion tests were conducted on test plates and corresponding test blocks reinforced by bonded steel plates and carbon fiber cloths by the air-freeze water-thaw method. The temperature in the freezing stage was maintained at −18 °C. A set of prestressed hollow slabs strengthened using steel and carbon fiber sheets and the corresponding test blocks were soaked in a pool for four days and subsequently removed. The moisture on the surface was wiped and 50 freeze–thaw cycles were initiated. Once the test plate and the test block were simultaneously frozen and thawed, this was regarded as a single freezing and thawing cycle, and the process was repeated until 50 freeze–thaw cycles were completed. The freeze–thaw test process for the reinforced test plate and corresponding test blocks are shown in Figure 8.

5.2. Analysis of the Test Results for Concrete Blocks in the Same Period of the Freeze–Thaw Cycle

During the freeze–thaw cycle, the surface of the test block continuously produced laitance. After washing with water, various aggregates appeared on the surface of the test block, and a few samples were damaged. With the increase in the cycles of freezing and thawing, a few fine cracks began to appear on the surface, resulting in rough and severe erosion.
After the freeze–thaw cycles, damage to the concrete surface could be observed; however, the internal damage to the concrete could not be observed directly. It was possible to understand the influence of the freezing and thawing on the properties of the concrete material by examining the elastic moduli and compressive strengths of the concrete blocks after the freeze–thaw cycles (Table 5). The relative dynamic modulus of elasticity showed that after the freezing and thawing cycles, the propagation velocity of ultrasonic waves in the concrete, the relative dynamic modulus, and the compressive rate of the concrete decreased.
The compression strength of the concrete cube is shown in Table 6. The compression strength of the concrete cube decreased from 52.59 MPa to 45.79 MPa, and the concrete strength was lowered by 12.95%.

5.3. Fatigue Characteristics of Strengthened Components under Freeze–Thaw Cycles

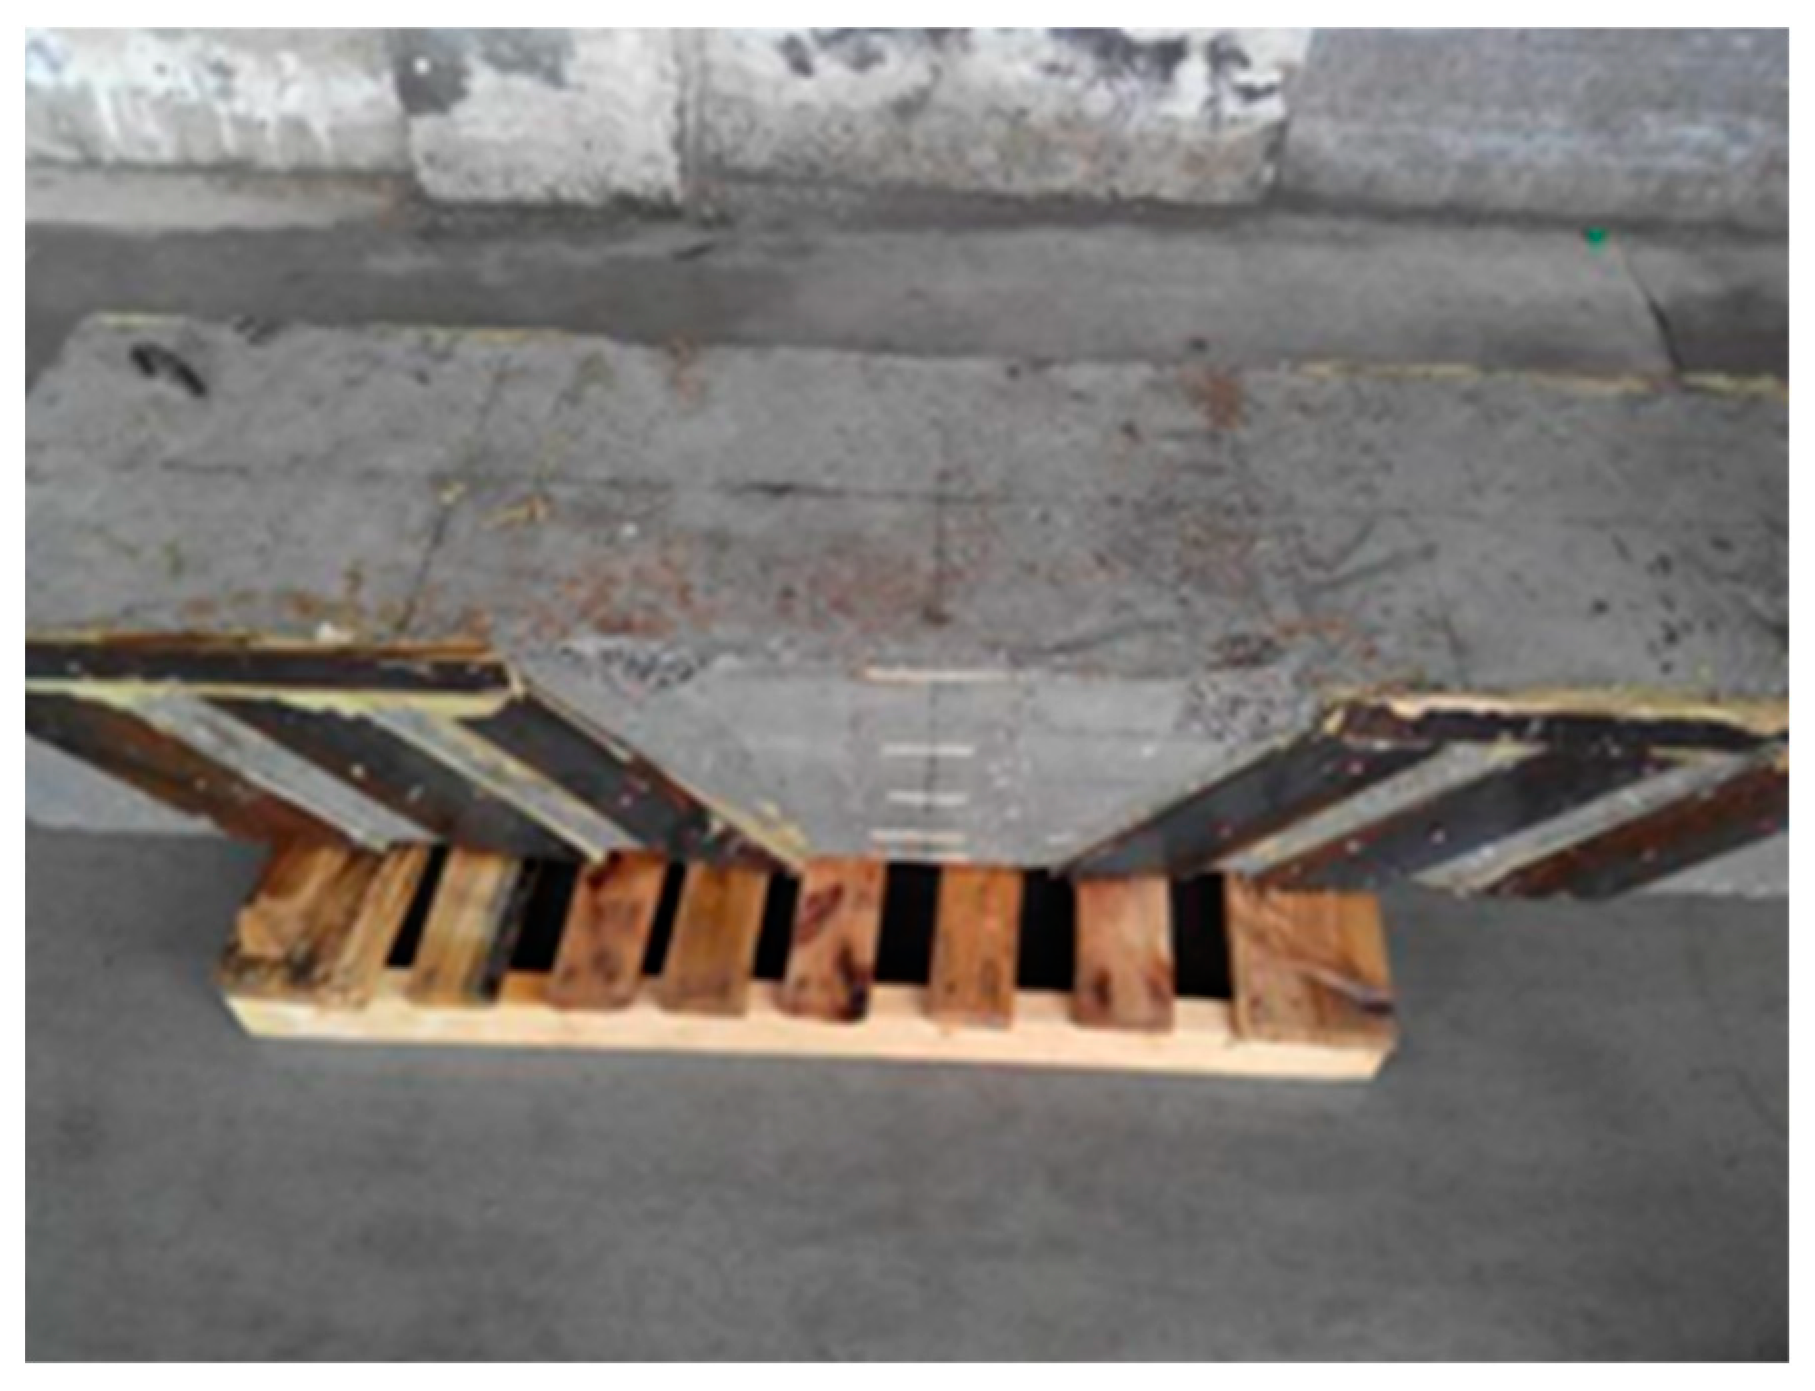
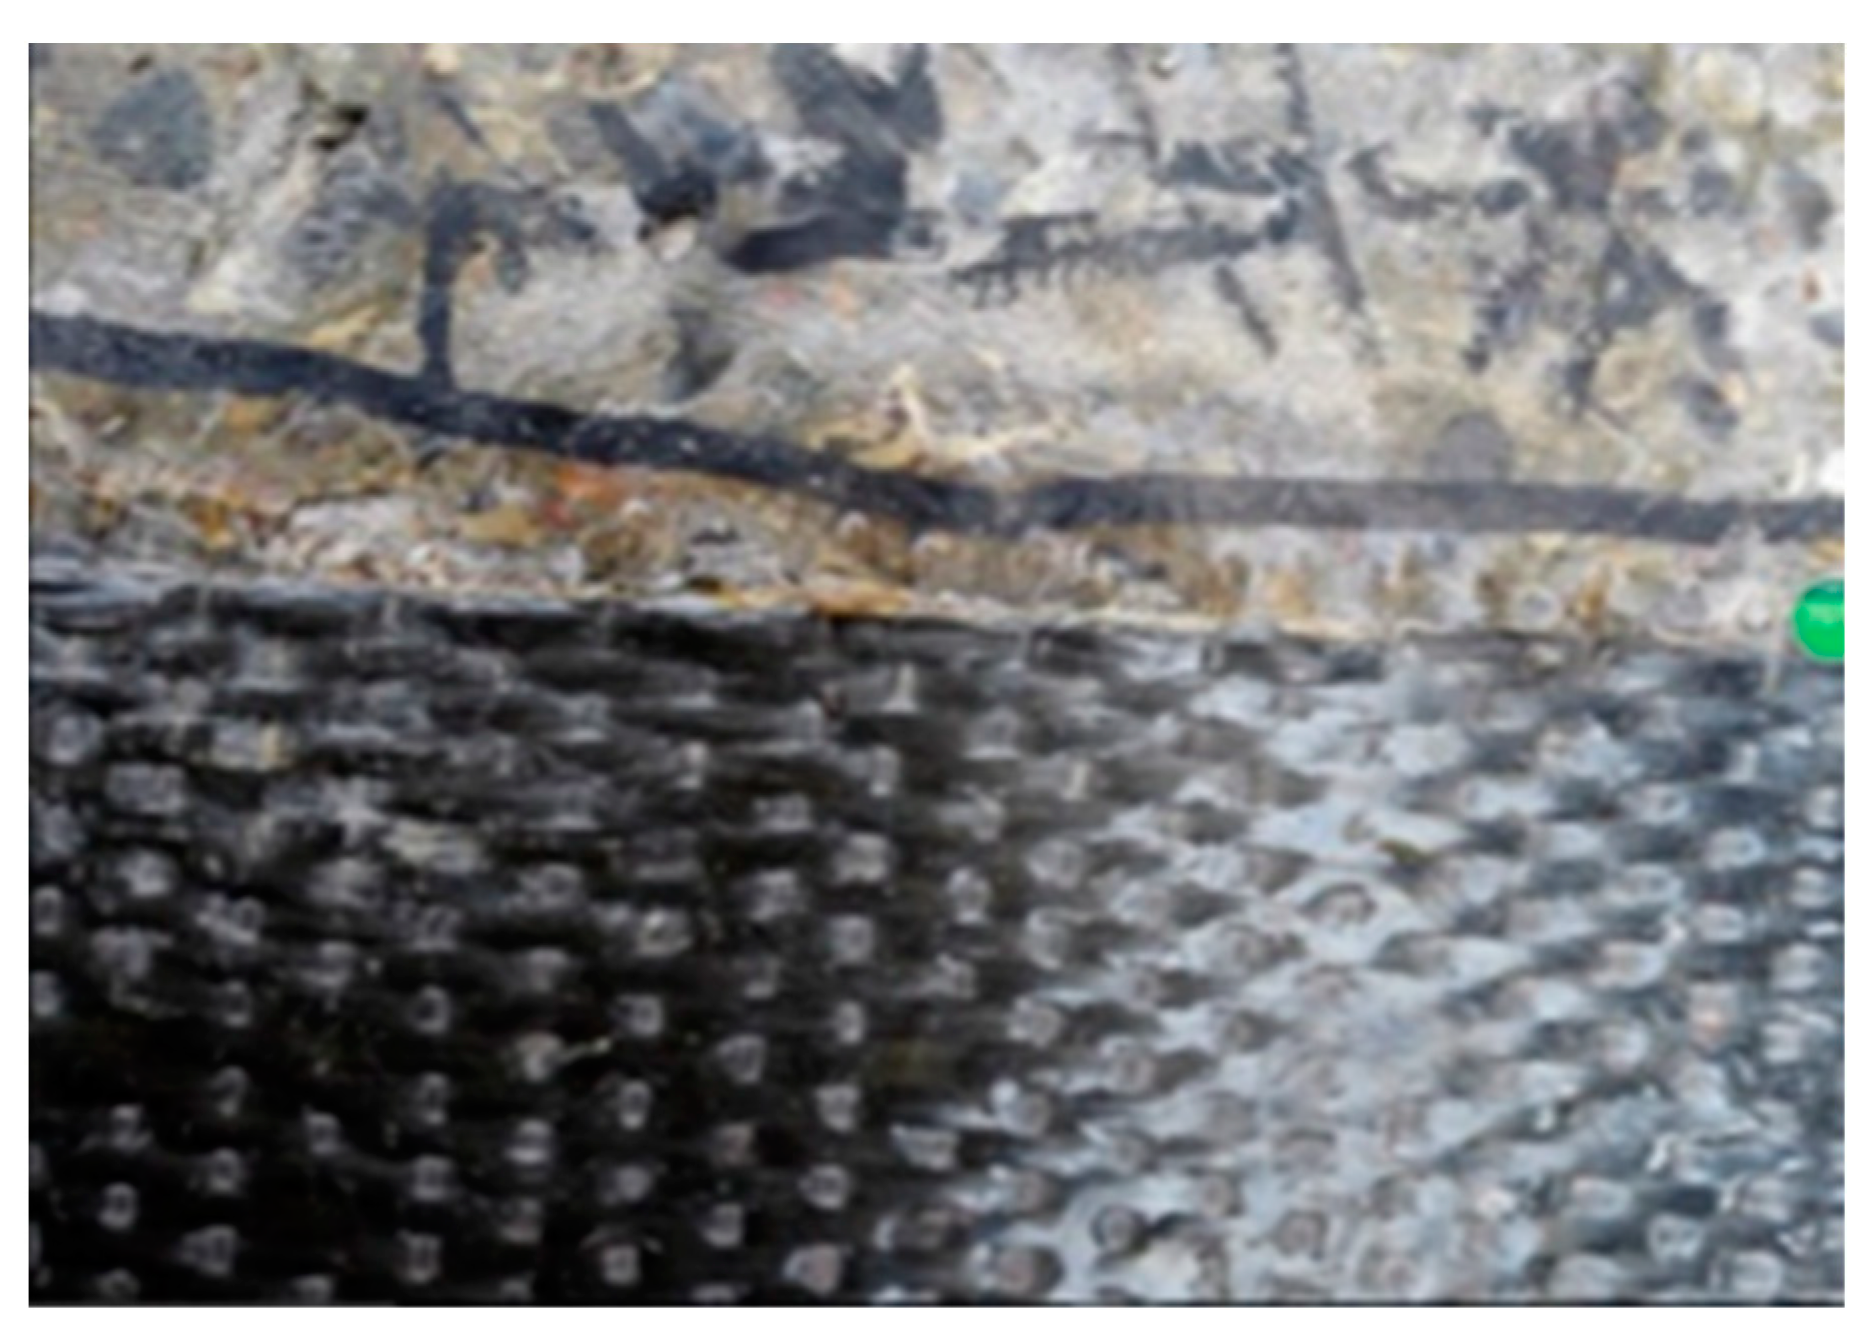
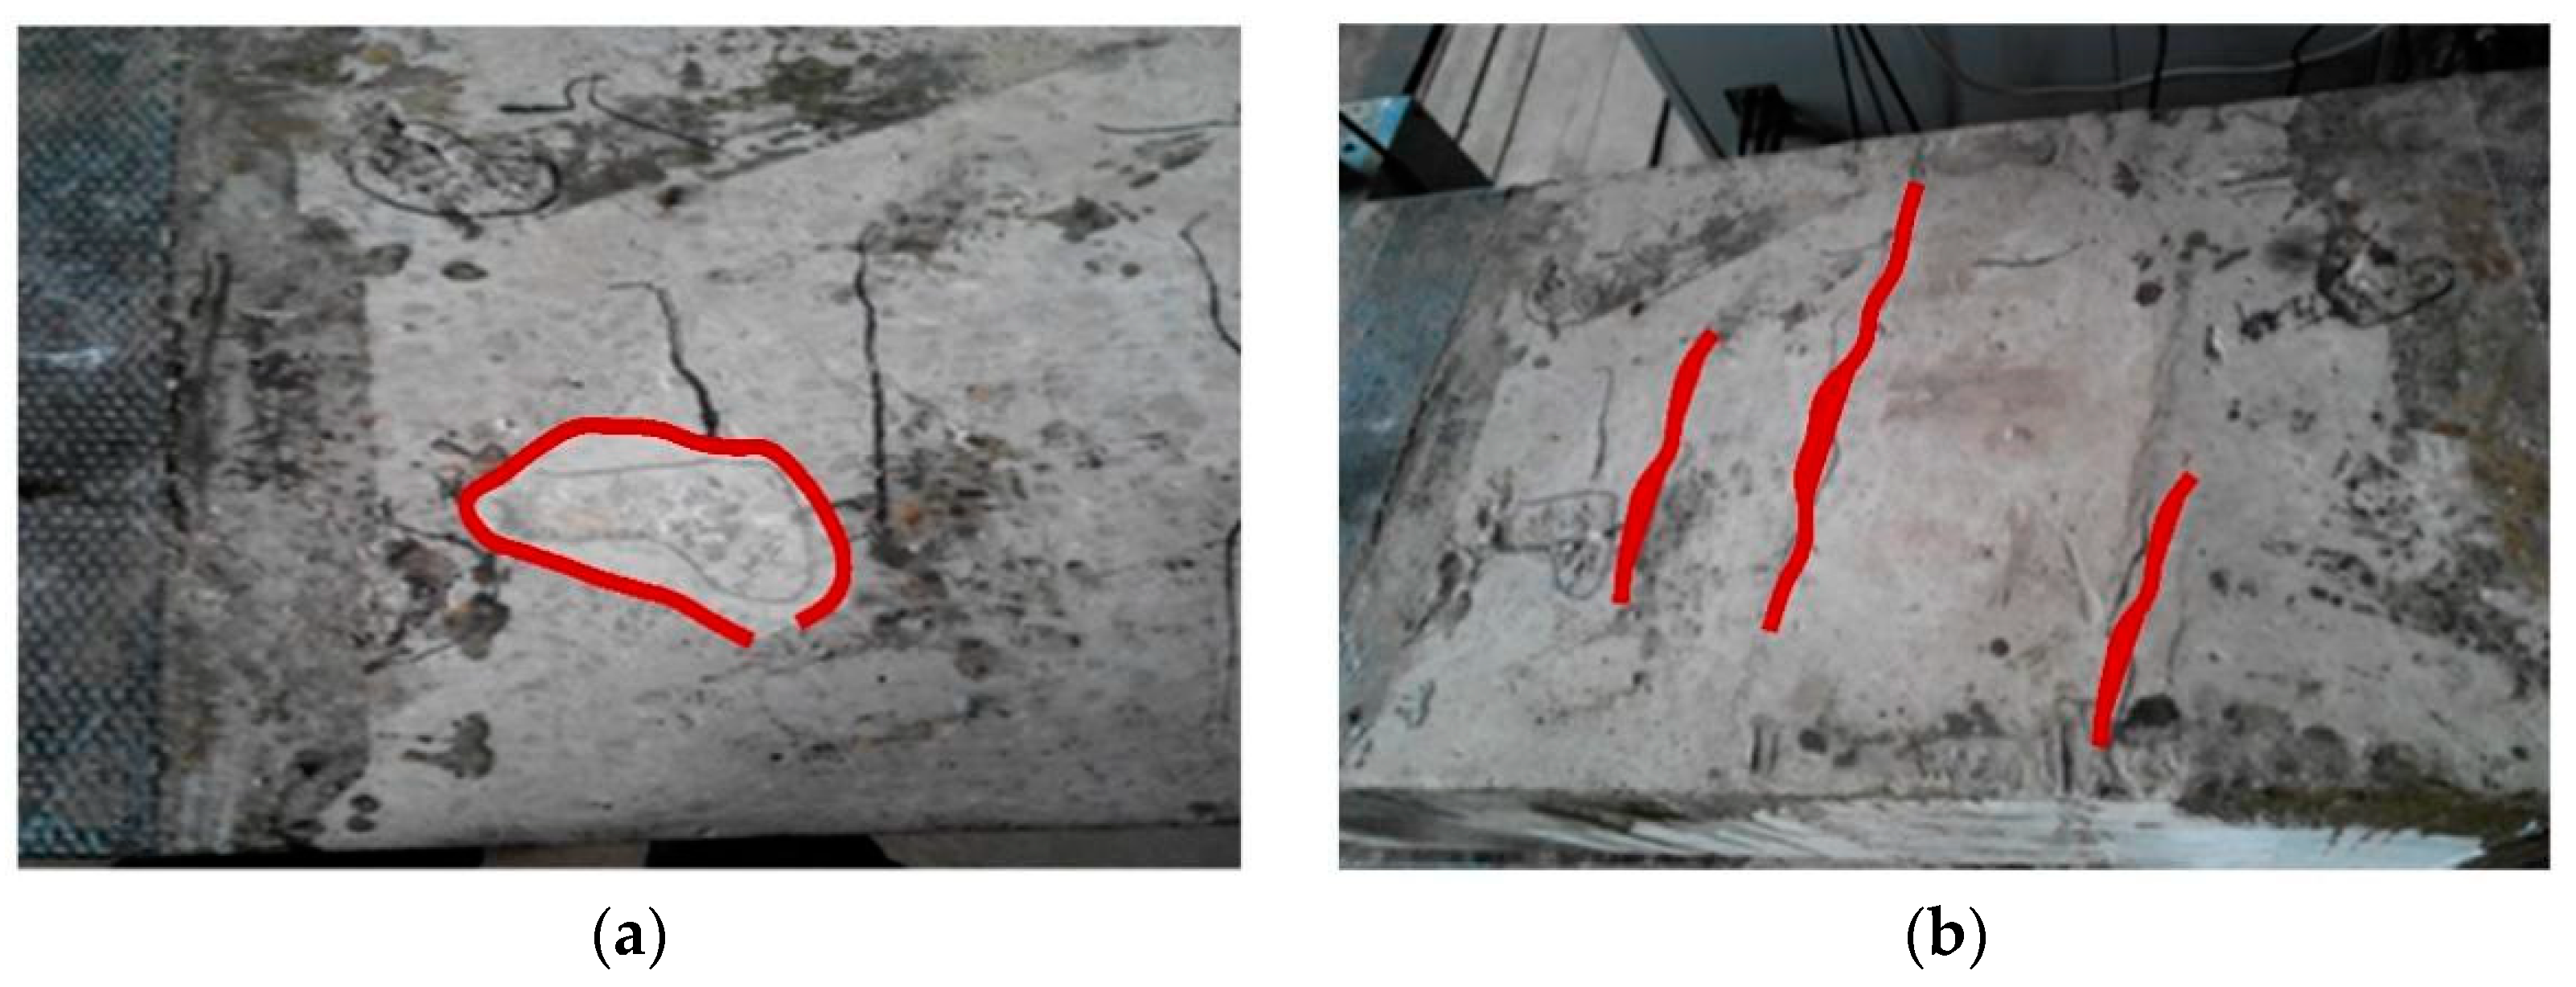
5.3.1. Analysis of the Apparent Performance of the Strengthened Test Plate after Freeze–Thaw Erosion

A set of test panels was subjected to freeze–thaw cycles, and minor cracks developed on the surface of the test panels. In the latter half of the freeze–thaw cycles, it was evident that water was immersed in the test plate in the microcracks and that the microcracks on the test plate might have been expanded by the freeze–thaw cycles. After observing the corrosion of the reinforced specimens by the freeze–thaw cycles, it was found that the strengthened specimens bonded with the carbon fiber sheets. The local cracking on the reinforced interface and the local peeling of the carbon fiber sheet and the concrete are shown in Figure 9. The rust on the steel plate surface is shown in Figure 10.

5.3.2. Fatigue Test Procedure for Freeze–Thaw Reinforcement of the Test Plate

Fatigue tests were conducted using a test plate corroded by freeze–thaw cycles to investigate the effect of freezing and thawing cycles on the fatigue properties of the reinforced components. The fatigue test comprised a hydraulic fatigue testing machine with trisection loading. Each test plate was fatigued for 2 million cycles, and a static load test was performed after every 5.0 × 10⁵ fatigue cycles to test the deflection and strain.
(1) Fatigue test process after the freezing and thawing of the carbon fiber cloth reinforced test plates.
As shown in Figure 11, the damage cracks that appeared in the early stage of the fatigue test plate were covered after grinding and strengthening with carbon fiber cloths, and the occurrence of the original crack was unclear in the fatigue process. However, in the fatigue test, after the freeze–thaw cycle of the plate reinforced with carbon fiber cloths, several cracks appeared on its top plate. A transverse through the crack was gradually generated. After 2 million cycles of fatigue loading, several pits appeared on the concrete roof, and local peeling between the carbon fiber cloths and the concrete occurred.
(2) Fatigue test process for the prestressed hollow slab strengthened using bonded steel plates after the freeze–thaw cycle
After 50 freeze–thaw cycles, fatigue tests on the bonded steel plate reinforced specimens were performed. It was found that during the fatigue test, the development of the original cracks was nearly unobservable, and there existed no phenomenon whereby a crack was opened and then closed. The oblique sticking steel method exhibited a good inhibition effect on the development of cracks. The data for the fatigue test process are shown in Table 7, Table 8 and Table 9.
After 50 freeze–thaw cycles, the components strengthened using carbon fiber cloths and steel plates could withstand 2 million cycles of fatigue loading. During the 2 million cycles of fatigue loading, the original cracks in the carbon fiber cloth strengthened specimens after freeze–thaw damage were not evident, the roof was significantly damaged, and local debonding between the carbon fiber cloth and the concrete occurred. However, cracks hardly developed in the strengthened members with bonded steel plates during the 2 million cycles of fatigue loading, and the specimens exhibited good crack resistance.

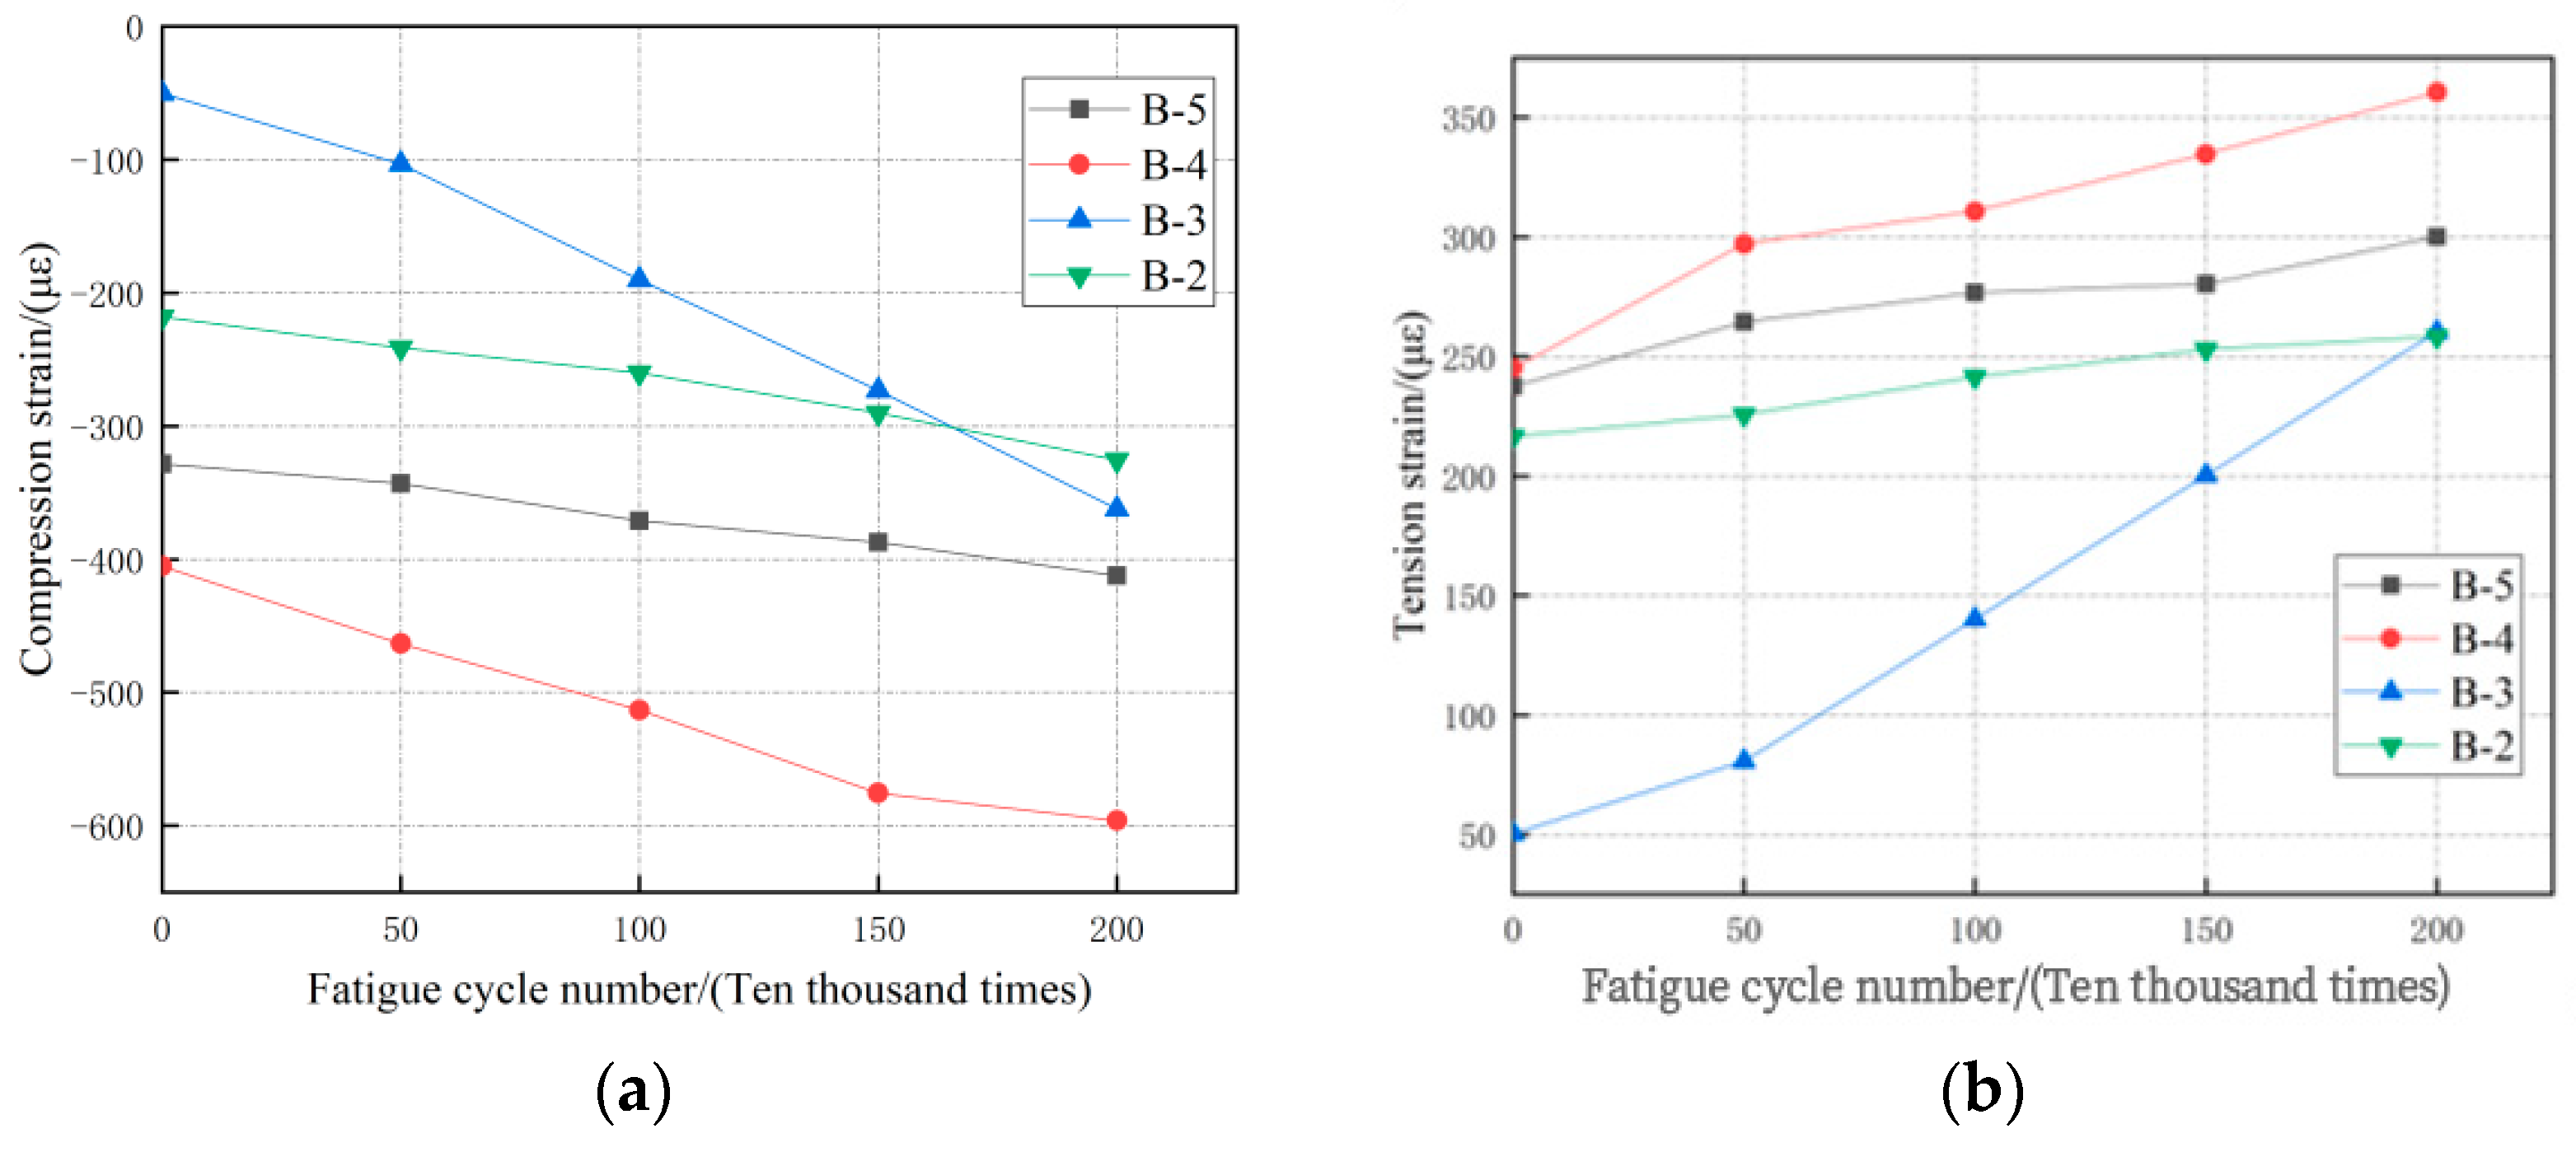
5.3.3. Force Characteristics during the Fatigue Process of the Freeze–Thaw Erosion of the Reinforced Test Plate

With an increase in the number cycles of fatigue loading, the strains of the reinforced test slabs after freeze–thaw erosion under a constant load were significantly higher than those prior to freeze–thaw erosion. For example, the tensile strain of the bonded carbon fiber reinforced reinforcements, which were passed through 20.0 × 10⁵ cycles of fatigue, under a loading of 200 kN, was 260.3 με at the bottom of the span prior to freezing and thawing. The tensile strain of the reinforced specimen with freeze–thaw cycle erosion was 360.6 με. Freeze–thaw erosion increased the strain level of the prestressed hollow slab. Under the two reinforcement methods, the deflection obtained for a constant fatigue cycle was greater than that obtained in the prestressed hollow slab prior to freeze–thaw erosion. For example, when a weight of 200 kN was applied after 20.0 × 10⁵ fatigue cycles, the deflection in the reinforced component with steel plates was 1.43 mm prior to freezing and thawing, and that of the steel plate reinforced component after undergoing freeze–thaw cycles was 1.76 mm. Freeze–thaw erosion increased the deformation of the reinforced components.
Figure 12 and Figure 13 show the deflection and strain of the freeze–thaw reinforced specimens with the increasing number of fatigue cycles. The analysis showed that the deflection in the carbon fiber cloth strengthened specimens after freeze–thaw damage increased gradually in the first 5.0 × 10⁵ fatigue cycles and also relatively quickly in the first 5.0 × 10⁵ to 20.0 × 10⁵ fatigue cycles. After the freezing and thawing damage, the deflection in the steel plate reinforced specimen gradually increased in the initial 5.0 × 10⁵ fatigue cycles and rapidly increased during the 15.0 × 10⁵–20.0 × 10⁵ fatigue cycles. The flexure of the pasted steel reinforced components gradually increased in the first 15.0 × 10⁵ fatigue cycles and increased rapidly during the 15.0 × 10⁵–20.0 × 10⁵ fatigue cycles. At a constant fatigue time, the flexure of the bonded carbon-fiber reinforced specimen was greater than the deflection in the bonded steel reinforced specimen. The compressive strain in the carbon-fiber reinforced specimen and steel reinforced specimen increased linearly during fatigue, and the compressive strain in the carbon-fiber reinforced component was larger than that of the steel reinforced component. The tensile strain of the carbon-fiber reinforced component, which increased smoothly during the initial 15.0 × 10⁵ cycles of fatigue loading, was lower than that of the steel reinforced component. This tensile strength rapidly increased in the last 5.0 × 10⁵ cycles of fatigue loading and became larger than that of the steel reinforced component. The strains in the bonded steel plate strengthened specimens increased linearly during fatigue.
The stress and deformation of the reinforced components increased with the fatigue time. After 20.0 × 10⁵ fatigue loading, the deflection and the tensile and compressive strains in the intermediate portion of the steel-reinforced specimen were lower than those of the carbon fiber cloth reinforced specimen. The midspan deflection and the tensile and compressive strains in the steel plate reinforced components were 1.88 mm, 308.2 με and −352.2 με, respectively, with increases of 72.4%, 21.1%, and 31.1%, respectively. The midspan deflection and the tensile and compressive strains in the carbon-fiber-reinforced components were 1.72 mm, 360.6 με, and −596.2 με, respectively, with increases of 68.8%, 48.3%, and 44.2%, respectively. Consequently, it was found that the increase in the flexure of the carbon fiber reinforced component was slightly lower than that of the steel reinforced component, and the increases in the tensile and compressive strains in the carbon fiber cloth reinforced specimens were larger than those of the steel-reinforced specimens. Compared to carbon fiber reinforcement, steel plate reinforcement exhibited better anti-fatigue attenuation characteristics.

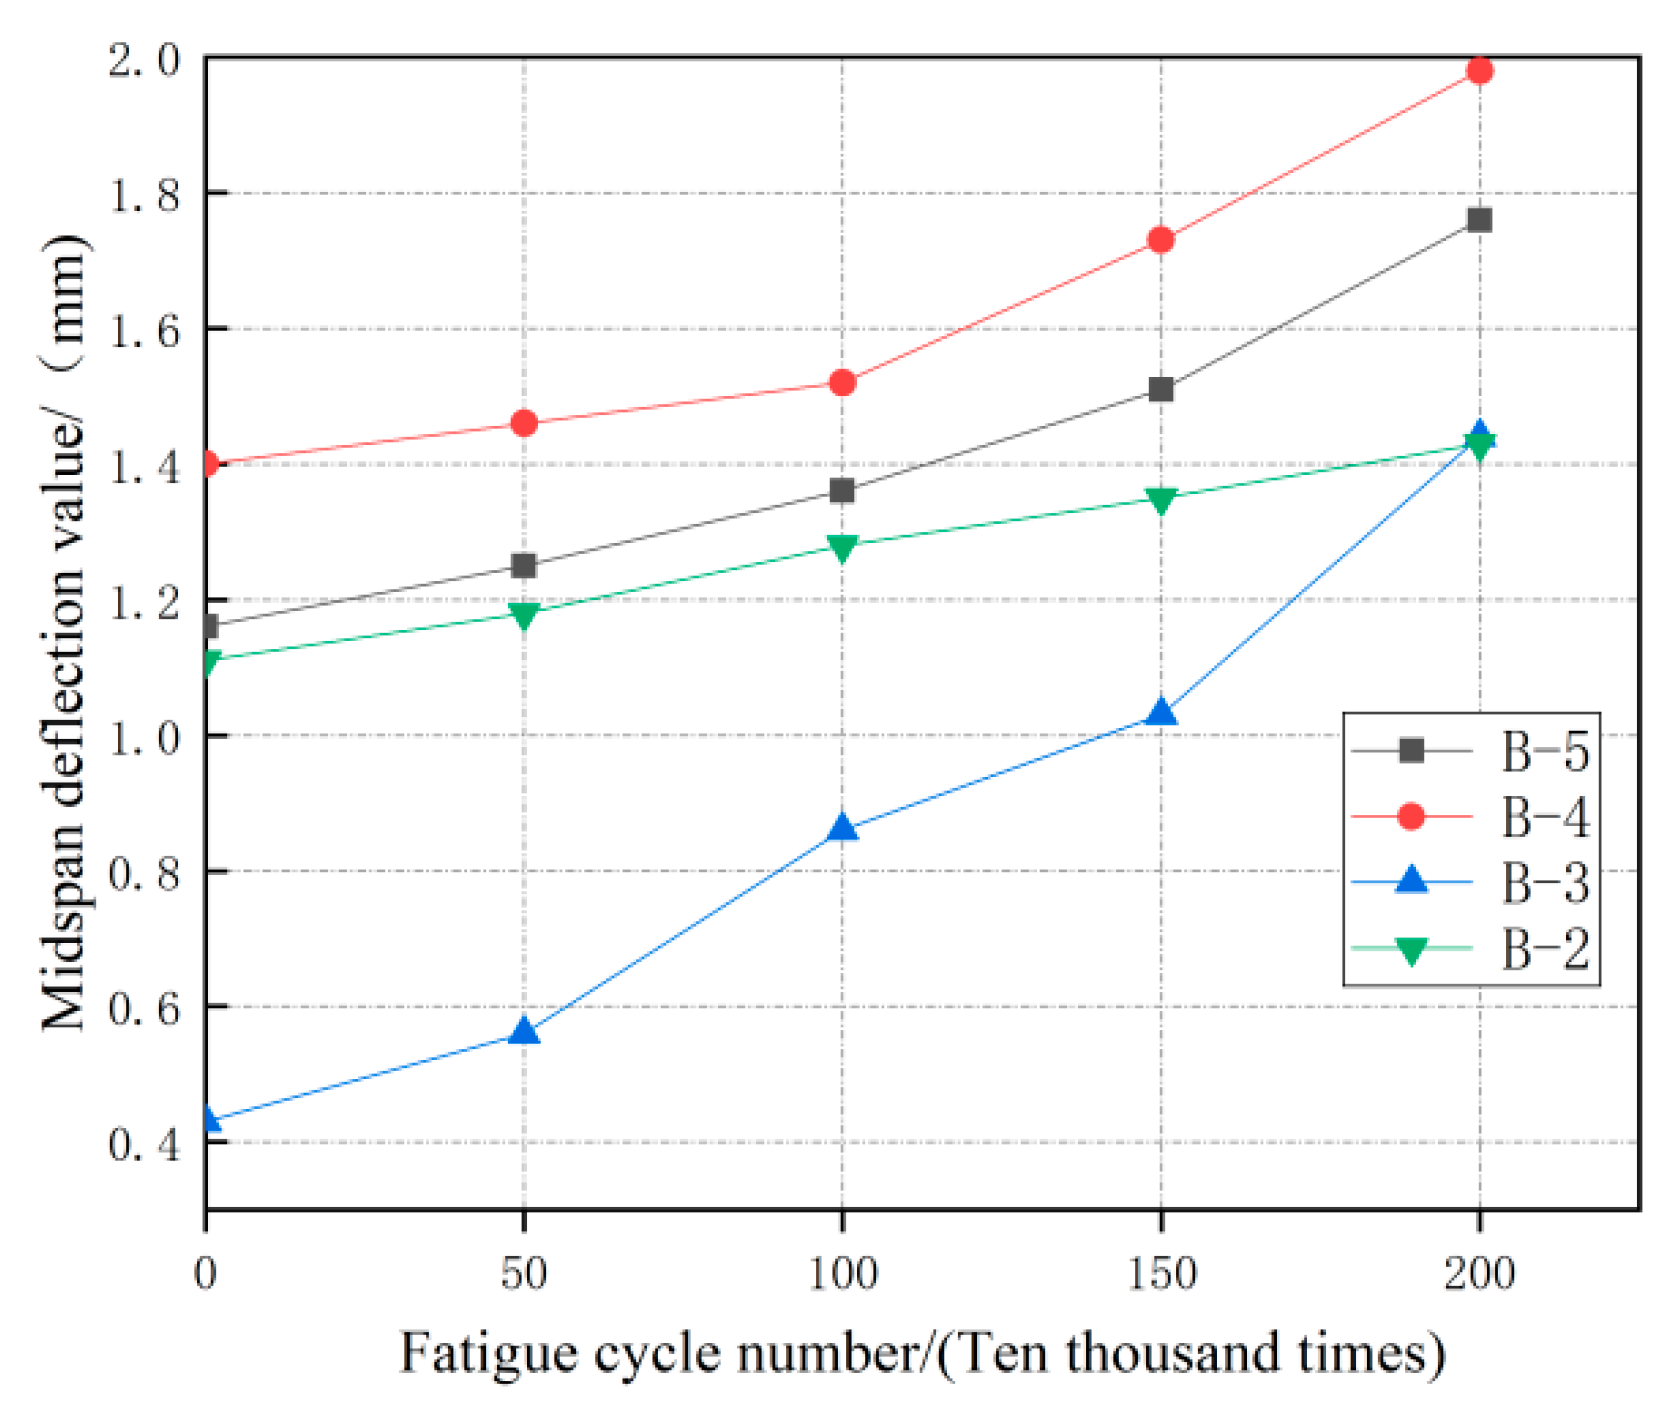
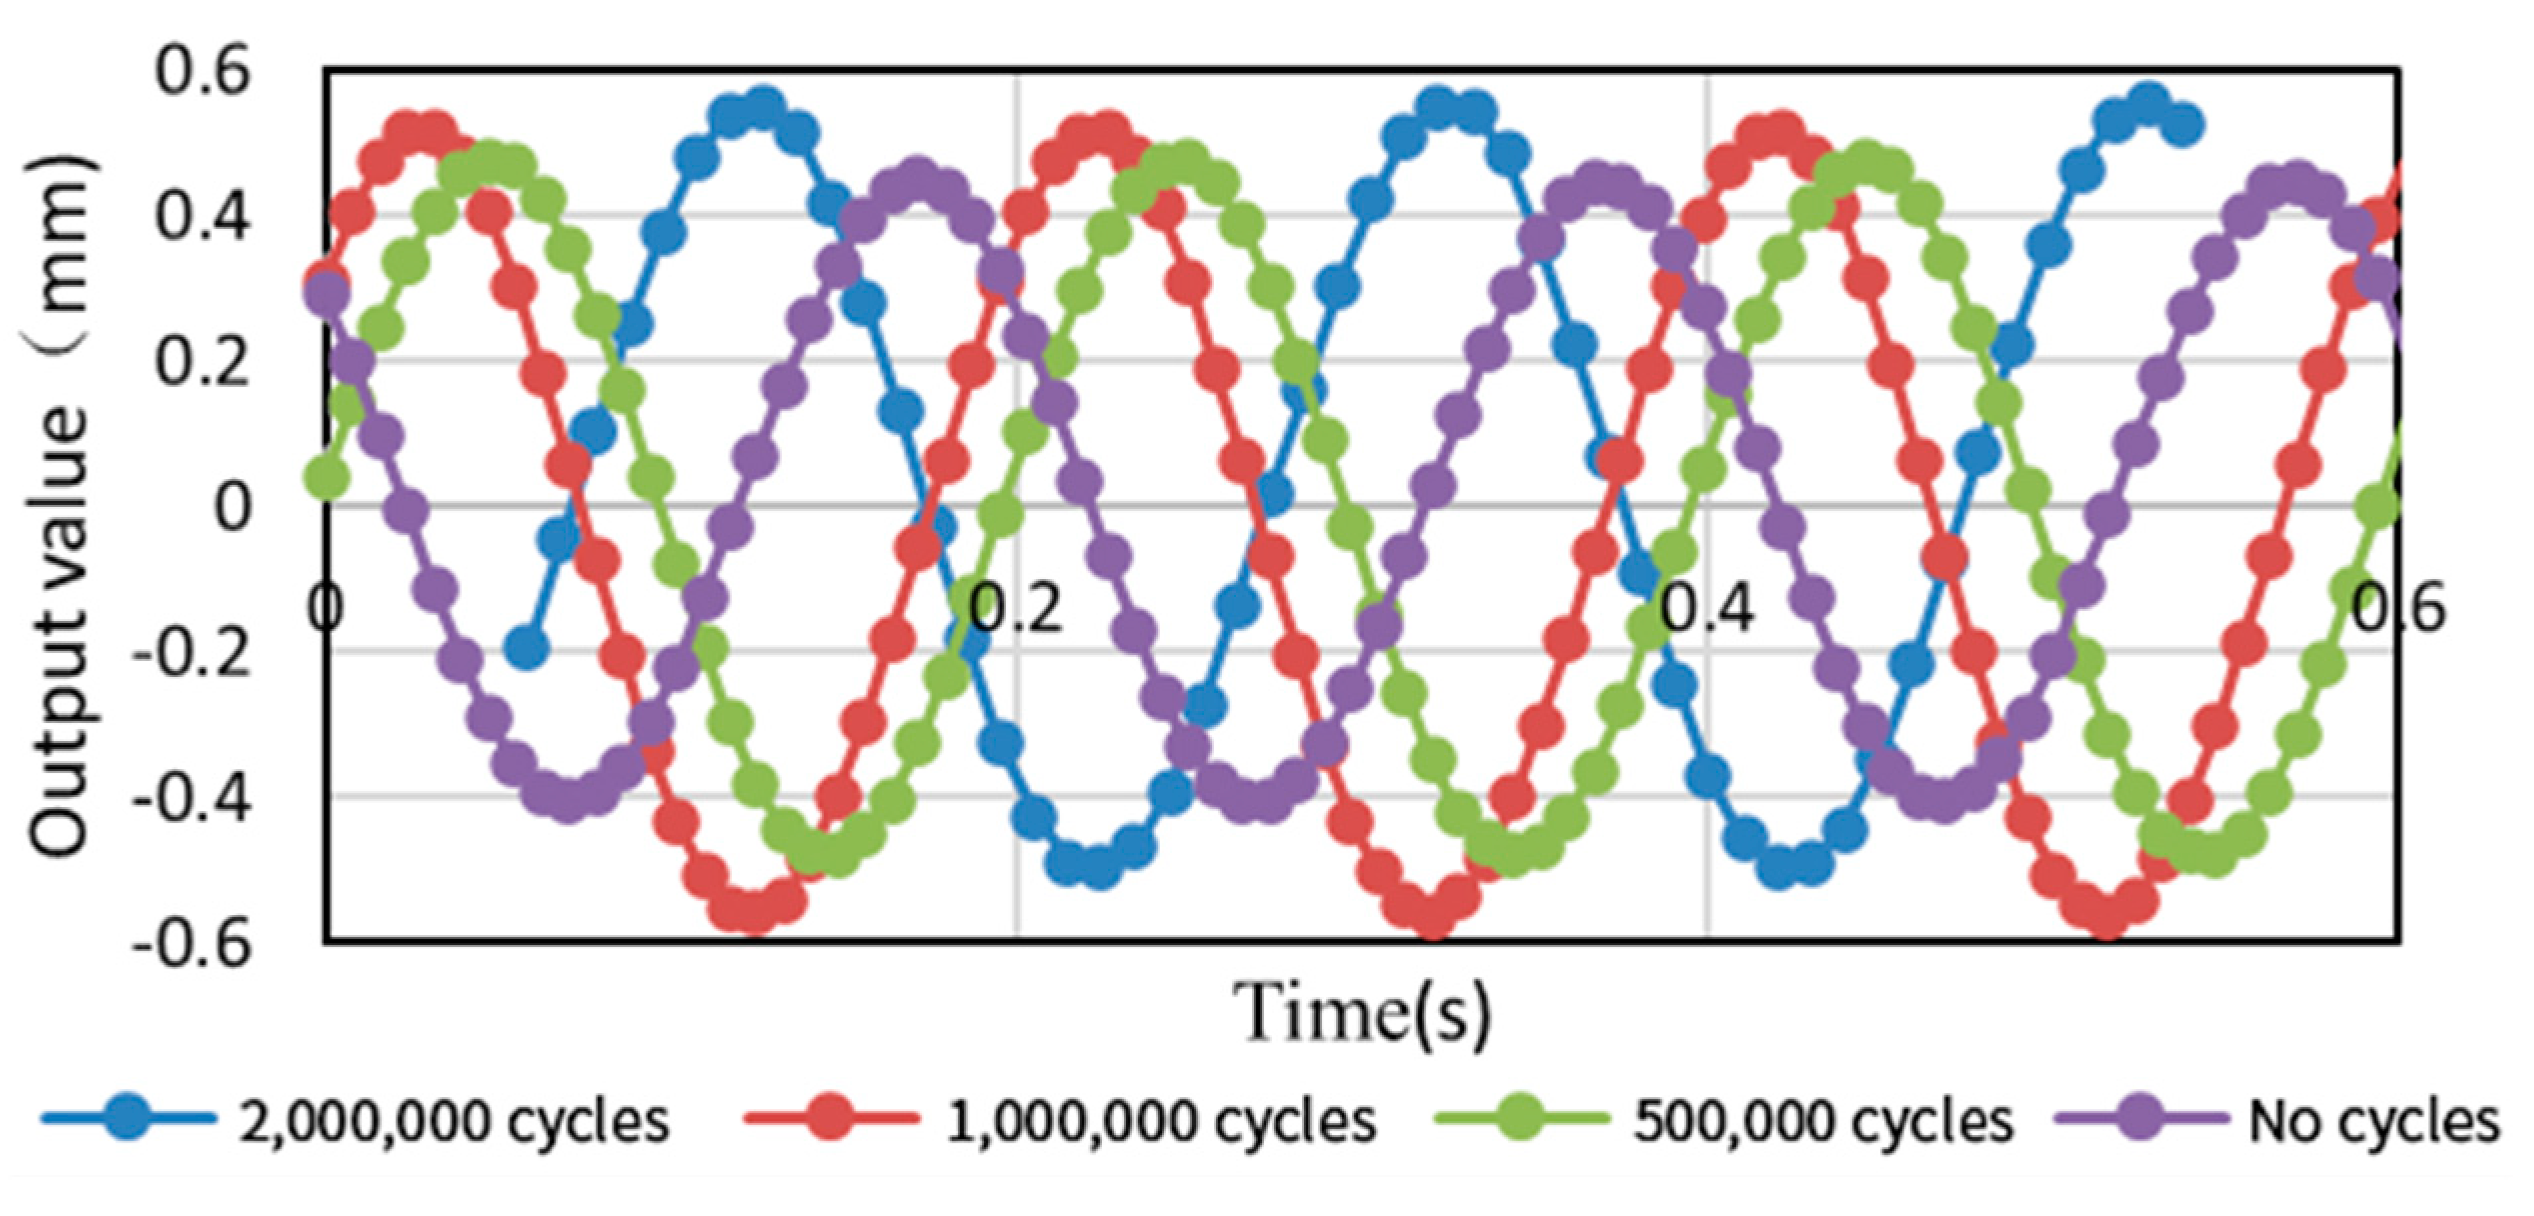
5.4. Dynamic Data Analysis of Fatigue Process in the Reinforced Test Plate under Freeze–Thaw Erosion

The dynamic displacement of a test plate subjected to sinusoidal fatigue loading by freeze–thaw erosion reflected the impact resistance of the test plate after freeze–thaw cycling. After the reinforced prestressed concrete hollow test plate was subjected to freeze–thaw erosion, its dynamic data during fatigue loading changed owing to the changes in its fatigue characteristics. The dynamic displacement diagram of the reinforced component bonded with steel plates under freeze–thaw erosion is shown in Figure 14 and Table 10.
The diagram shows that the dynamic displacement of the test plate exhibited a sinusoidal variation during the fatigue process, which also confirmed the usage of sinusoidal loading in the fatigue loading process. In addition, analysis of the test plate dynamic data showed that the peak, trough, and amplitude of the bonded steel plate reinforced component under freeze–thaw erosion increased by 43.24%, 45.45%, and 42.25%, respectively, over the reinforced component that had not undergone erosion. The peak, trough, and amplitude of the carbon fiber cloth reinforced component under freeze–thaw erosion increased by 38.46%, 62.5%, and 49.30%, respectively. The test results showed that the impact resistance of the test plate after freezing and thawing erosion was significantly weaker that of the reinforced component that had not undergone erosion during the fatigue loading. Moreover, the impact resistance of the prestressed hollow slab reinforced with steel plates was superior to that of the prestressed hollow slab reinforced with carbon fiber cloths.

6. Finite Element Analysis of Prestressed Hollow Slab

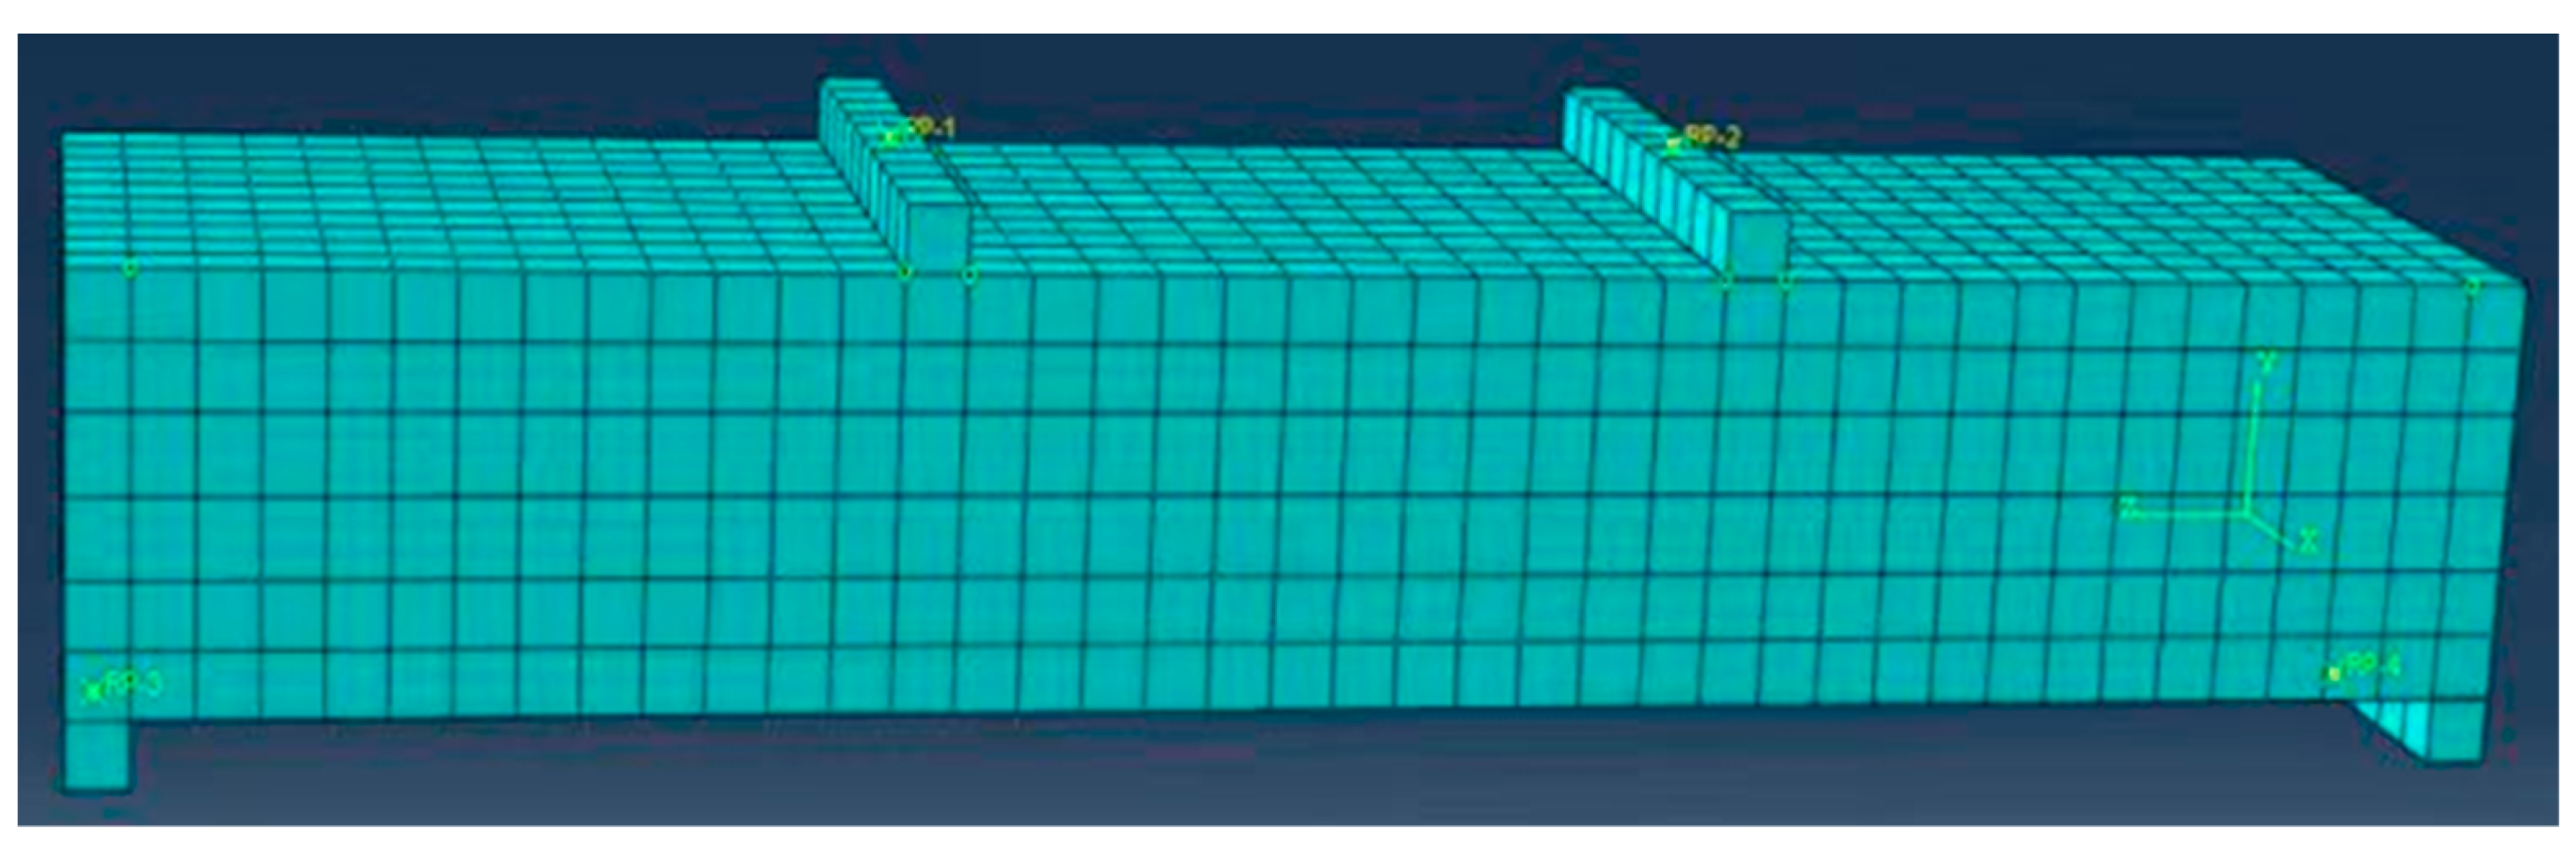
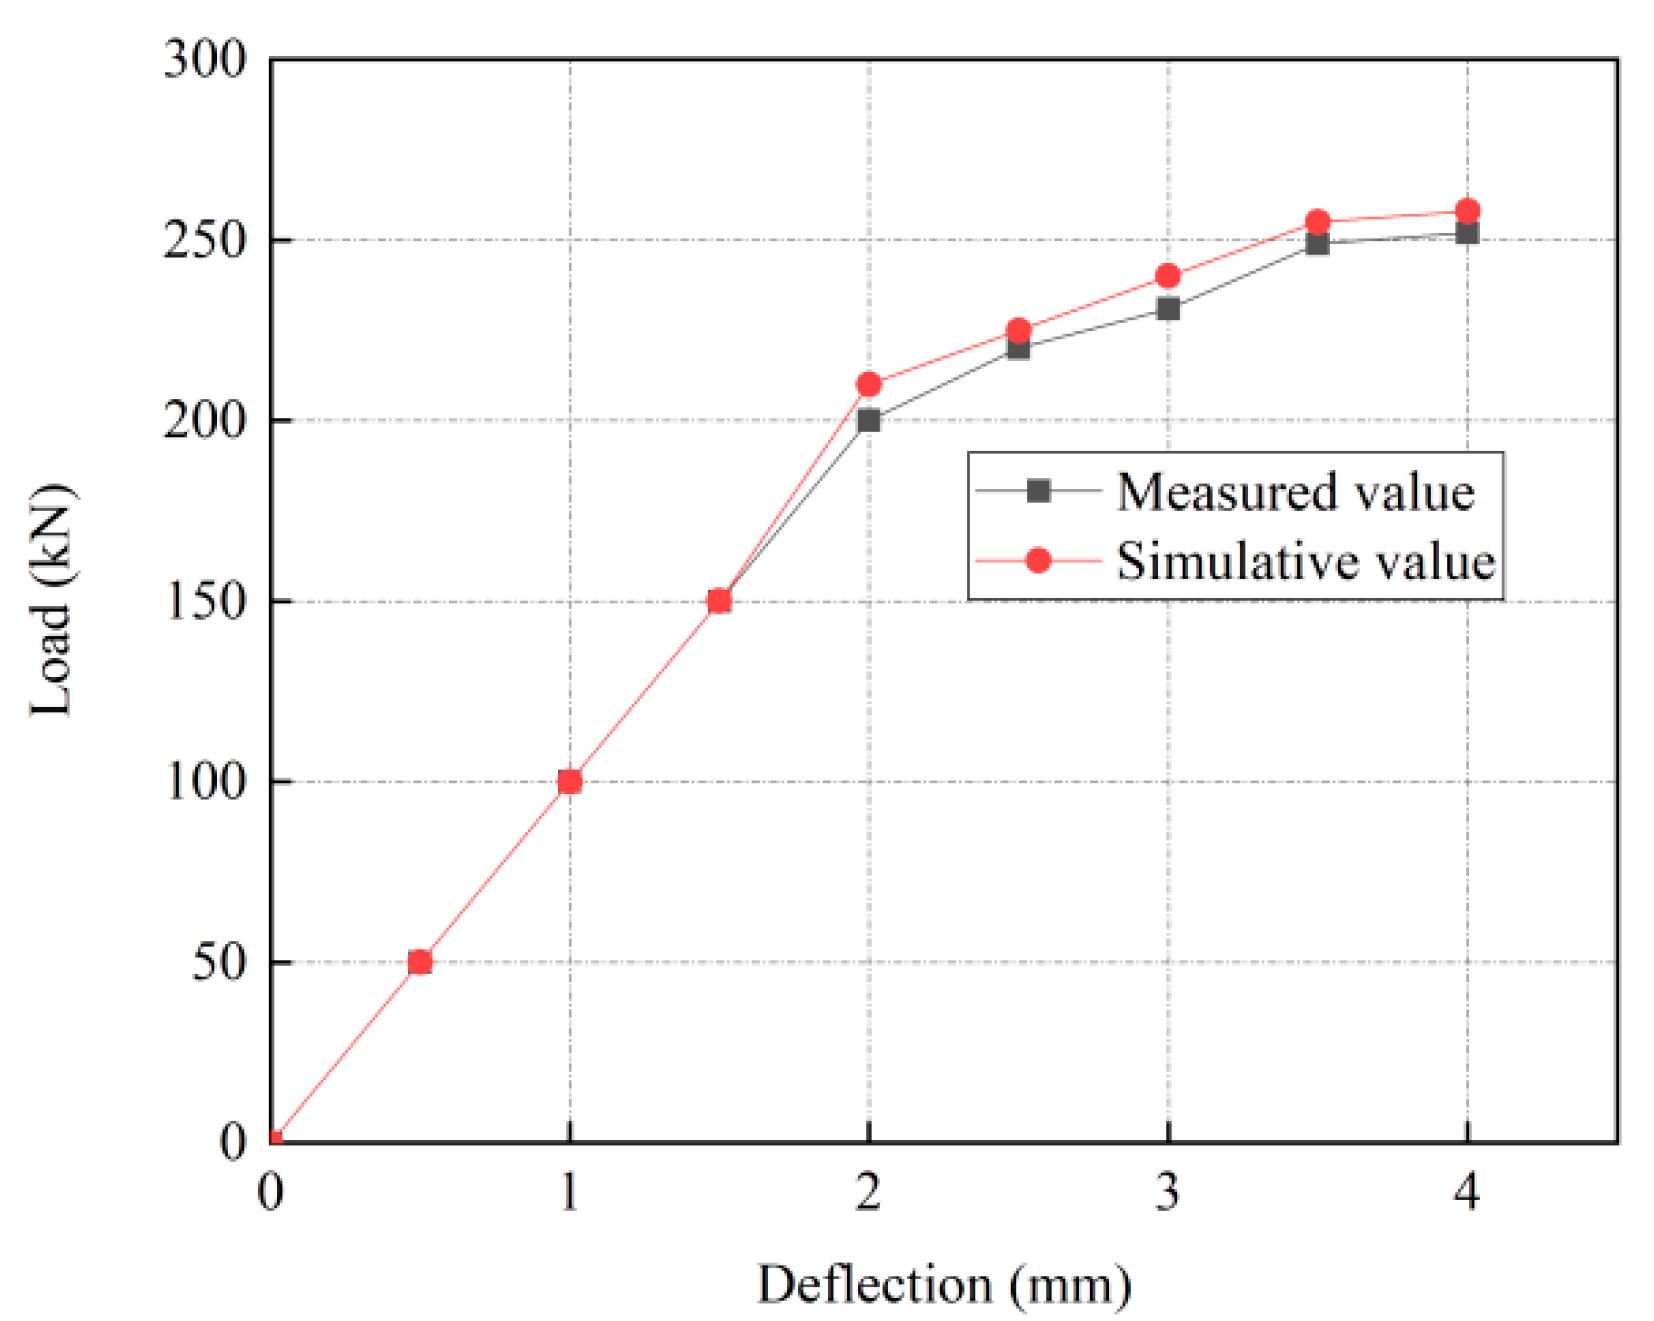
6.1. Establishment and Verification of the Finite Element Model for the Prestressed Hollow Slab

Based on the actual structural size of the prestressed hollow slab, the ABAQUS finite element analysis software was used to establish a finite element model for a prestressed hollow slab beam (Figure 15).
The finite element model has a total of 1971 units. The concrete unit adopted a 3D solid unit, the elastic modulus was 3.0 × 10⁴ MPa, and the Poisson’s ratio was 0.2. Other material parameters were set according to the material parameter properties described in the experimental section of the text. ABAQUS provides three models to simulate the nonlinearity of concrete: a concrete dispersion cracking model, concrete plastic damage model, and concrete brittle cracking model. According to the main forms and causes of damage of the prestressed hollow slab beams, the main choice of concrete material in this paper was the plastic damage model, which could simulate the forms of damage of the concrete materials.
By comparing the simulated values obtained using the ABAQUS software with the measured values obtained during the test, it was found that the changing trends in the midspan load–displacement curves of the two values were quite similar (shown in Figure 16). However, in the software simulation processing, the bond-slip between the steel bars, prestressed bars, and concrete was neglected; therefore, the load value obtained during the test was larger for a constant deflection. The load–displacement curves of the measured and simulated values underwent three stages: The first stage was the elastic stage, wherein the load and deflection increased proportionally. The second stage was the yield stage, wherein the cracking load of the prestressed hollow slab was 200 kN, and the slope of the load–displacement curve decreased owing to the decrease in stiffness caused by the cracking of the test plate. The third stage was the strengthening stage, wherein the load increased gradually, but the deflection decreased rapidly. The ultimate load was determined as the longitudinal reinforcement yield. In addition, the finite element simulation of the concrete damage can be seen in Figure 17. When a static load was applied to the prestressed hollow slab finite element model, the damage cracks mainly occurred at both ends of the bearing, which was consistent with the results of the actual static load tests. Therefore, the accuracy of the prestressed hollow slab finite element model was verified.

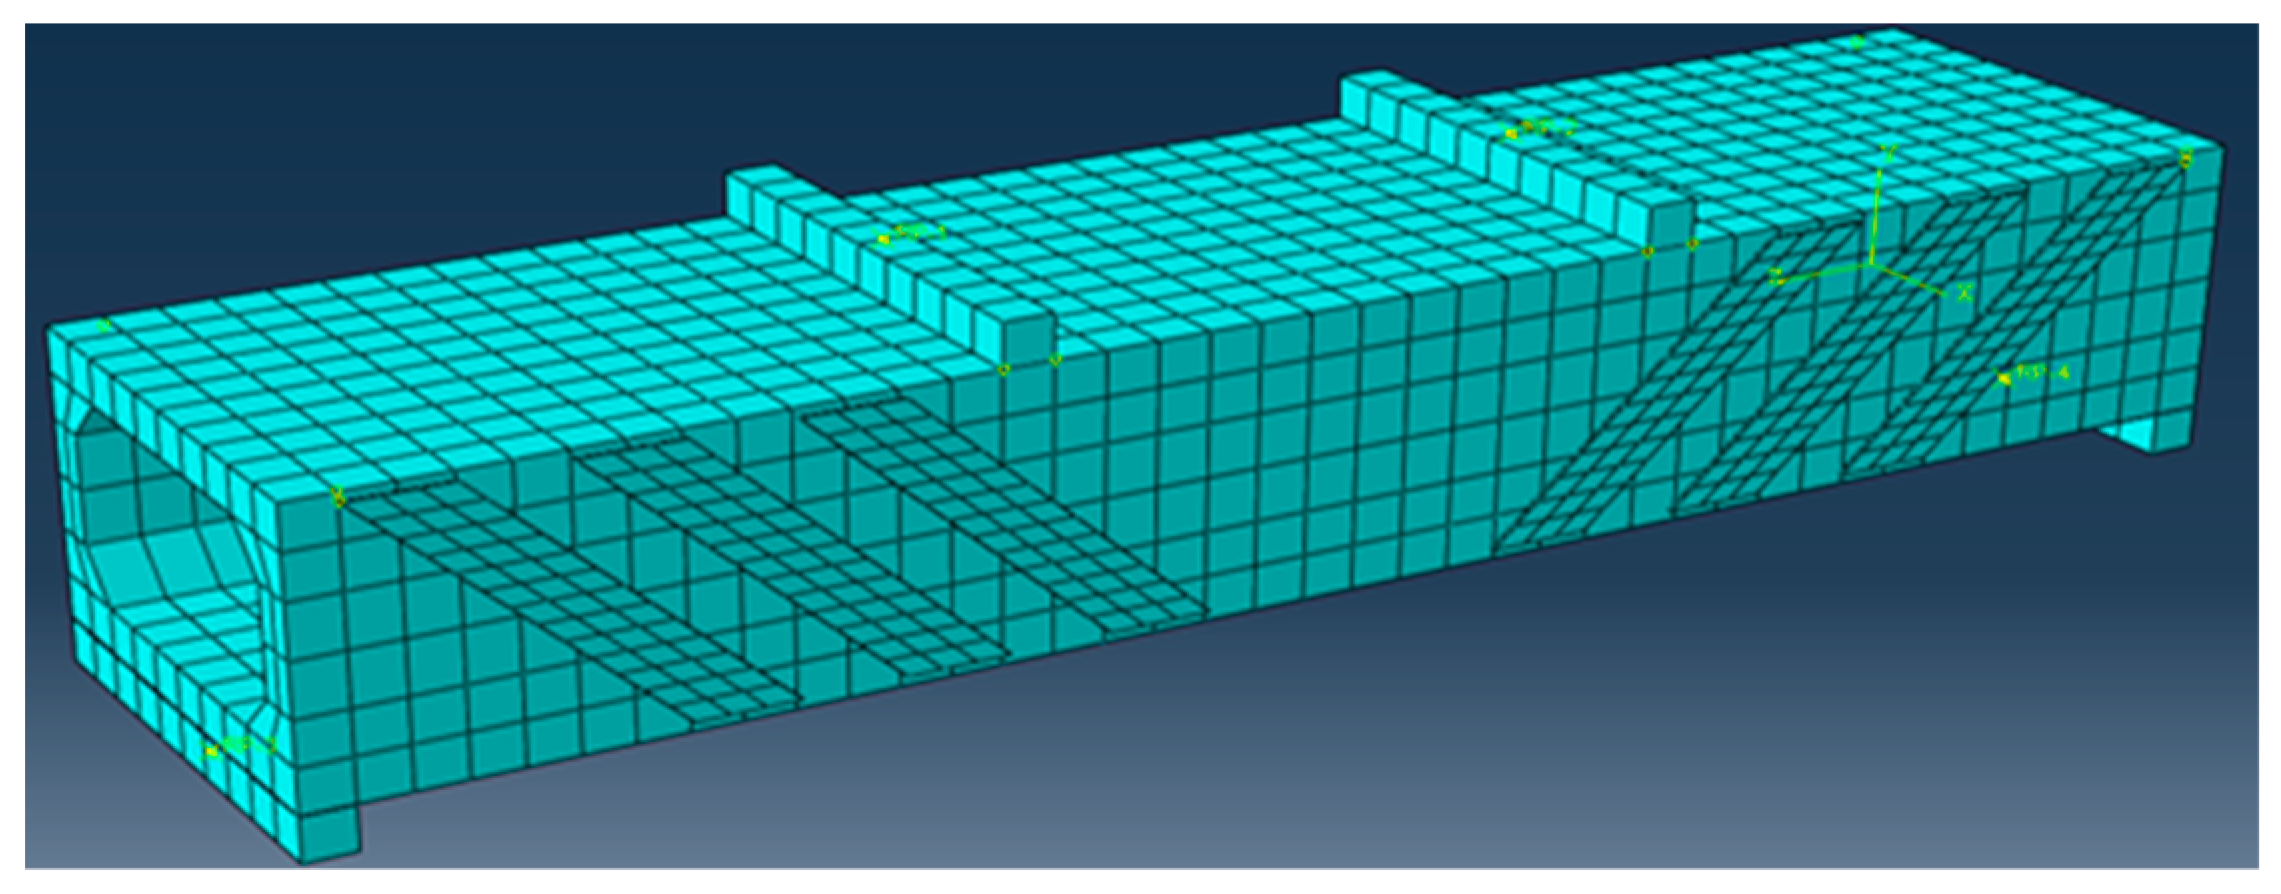
6.2. Establishment of the Finite Element Model for the Prestressed Hollow Slab Reinforced Components

As mentioned above, the prestressed hollow slabs after fatigue damage were strengthened using either steel plates or carbon fiber cloths. Moreover, fatigue tests under freeze–thaw erosion were conducted on two different types of prestressed hollow slab reinforced components. Consequently, it was proven that the reinforcement effect of pasting steel plates on the prestressed hollow slab fatigue damaged specimen was superior to the reinforcement effect of bonded carbon fiber sheets under the same conditions. Therefore, this study focused on the numerical finite element analysis of prestressed hollow slab reinforced components strengthened with bonded steel plates.
As shown in Figure 18, the relevant structural dimensions and material parameters in the finite element model were set according to the prestressed hollow slab reinforced component model constructed for the experiments mentioned earlier. The bonded steel plate used was Q235, the elastic modulus was 2.1 × 10¹¹ Pa, and the steel plate was placed obliquely at 45° and bilaterally bound to the prestressed hollow plate.

6.3. Numerical Simulation Analysis of the Fatigue Characteristics of the Prestressed Hollow Slab Reinforced Components under Freeze–Thaw Erosion

6.3.1. Theoretical Calculation Model of Material Compressive Strength

In the past few years, scholars have conducted extensive research on the fatigue durability of pre-stressed flexural components under freeze–thaw environments, and found that there exists a correlation between freeze–thaw erosion and fatigue. Several macro damage models of materials and theoretical calculation models of material physical properties have been established. Xiao et al. [40] found that a change in the compressive strength of concrete could be measured by 300 freeze–thaw cycles of concrete, and a model for the decay of compressive strength of concrete under freeze–thaw erosion was derived and calculated.
f c , c ( n ˜ ) = C 1 f c , c ( 0 ˜ ) e λ 1 n ˜
In the formula, f c , c ( n ˜ ) indicates the residual compressive strength of the concrete as a function of the freeze–thaw cycles. C 1 and λ 1 are the material characteristic parameters and f c , c ( 0 ˜ ) indicates the initial compressive strength of the concrete.

6.3.2. Theoretical Calculation Model of the Elastic Moduli of the Materials

Xiao [41] performed a freeze–thaw test on concrete by controlling related influencing factors. The constitutive law for the dynamic modulus of elasticity of the concrete was analyzed under freezing and thawing conditions, and an equation for the change in this dynamic modulus of elasticity with the number of freeze–thaw cycles was derived.
E c ( n ˜ ) = C 2 E c ( 0 ) e λ 2 n ˜
In the formula, E c ( n ˜ ) indicates the residual dynamic elastic modulus of the concrete as a function of the freeze–thaw cycles. E c ( 0 ) indicates the initial elastic modulus of the concrete. C 2 and λ 2 are the material characteristic parameters.
In addition, the dynamic and static elastic moduli of concrete can be interconverted, and the conversion formula was presented in [42].
E c ^ ( n ˜ ) = 0.52 + 0.77 E c ( n ˜ )
where E c ^ ( n ˜ ) and E c ( n ˜ ) indicate the static and dynamic elastic moduli of the concrete, respectively.

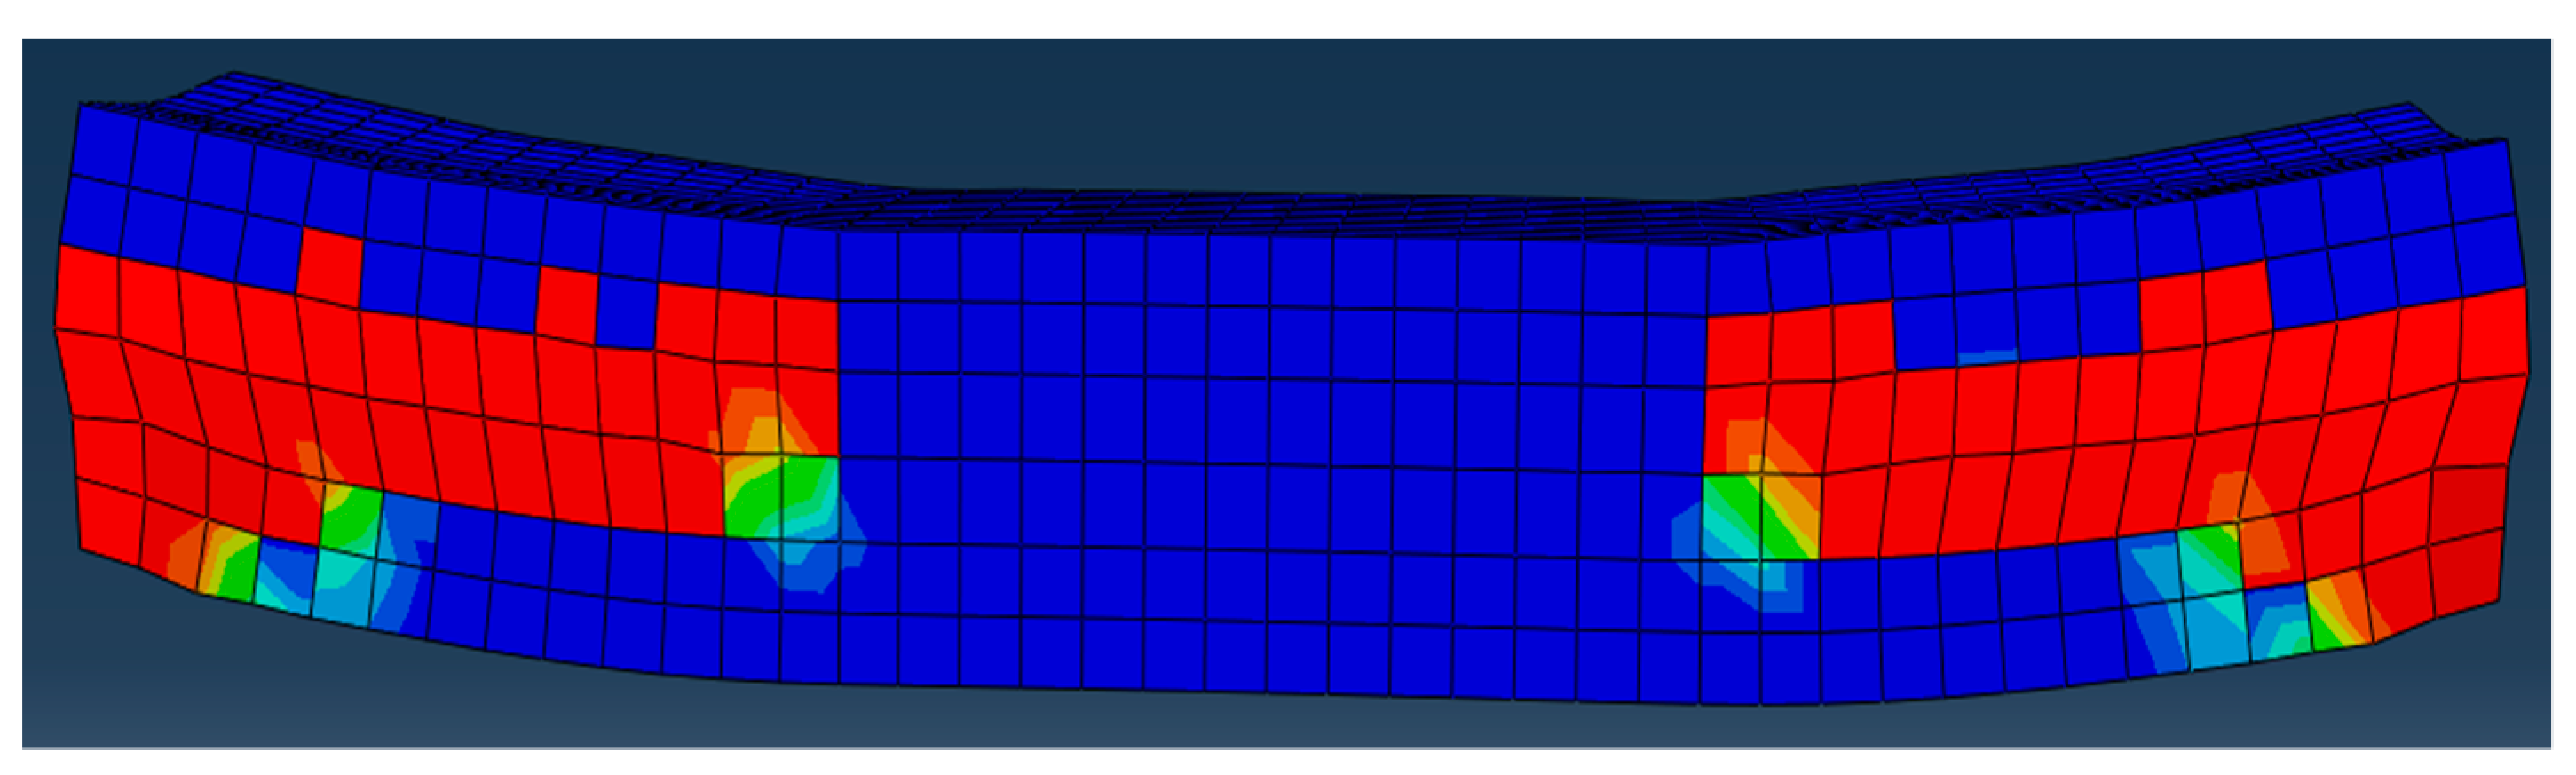
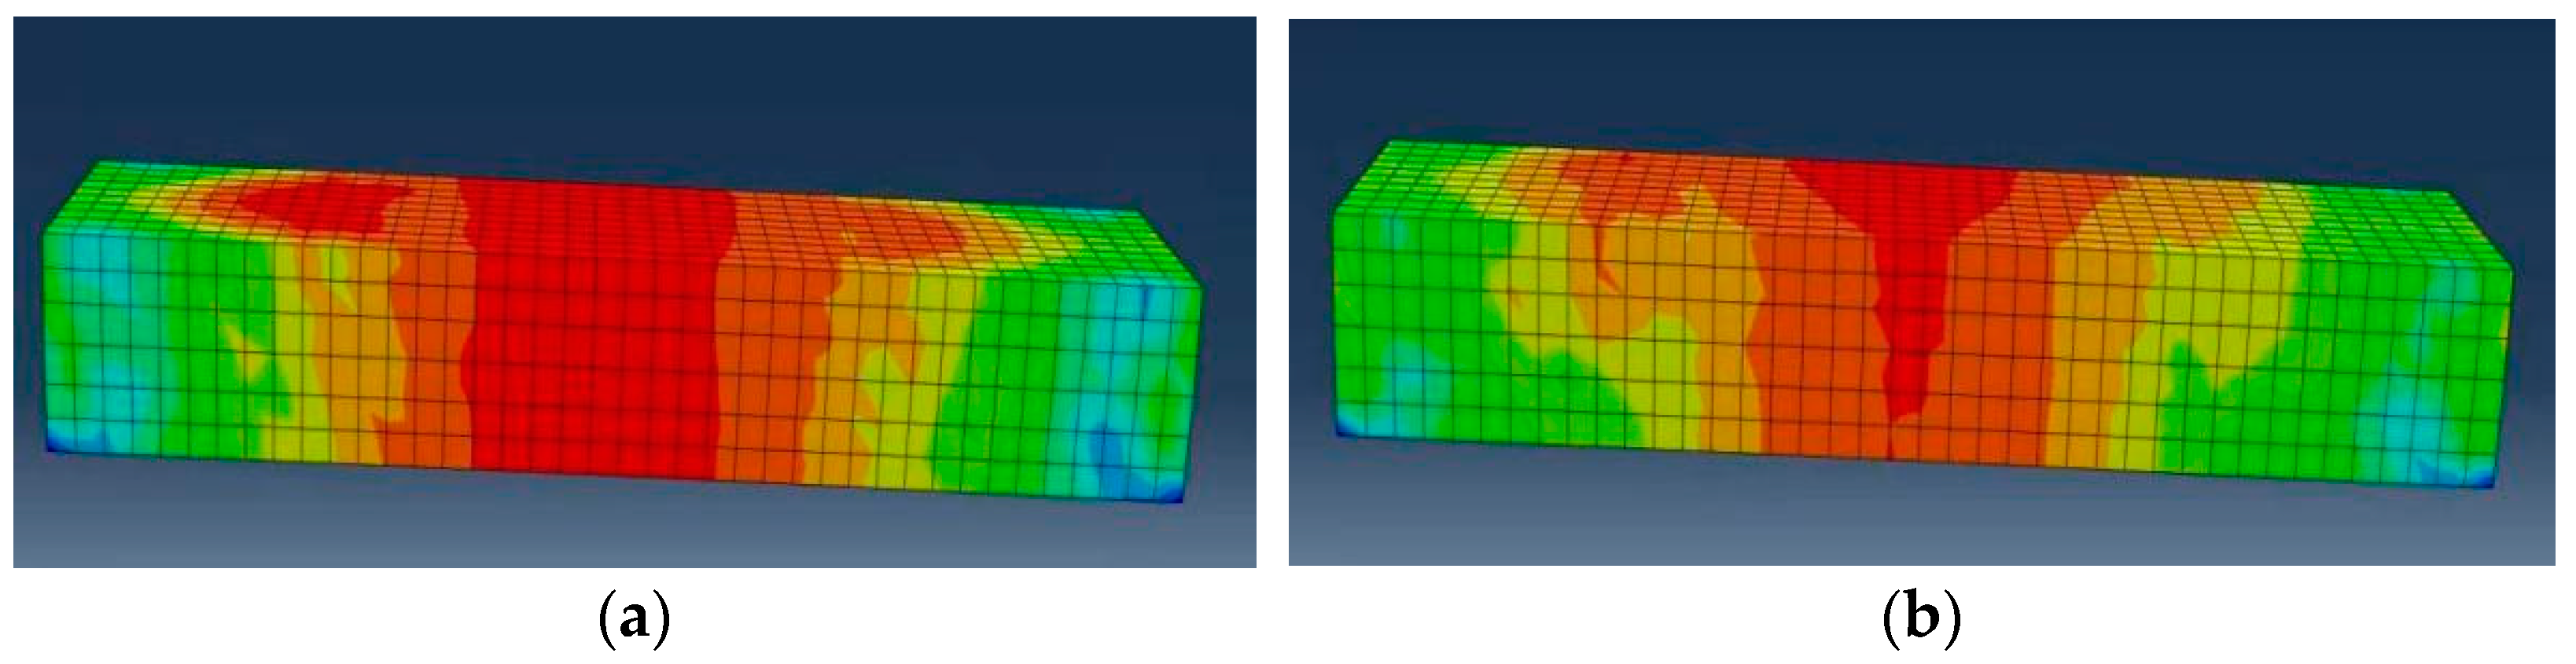
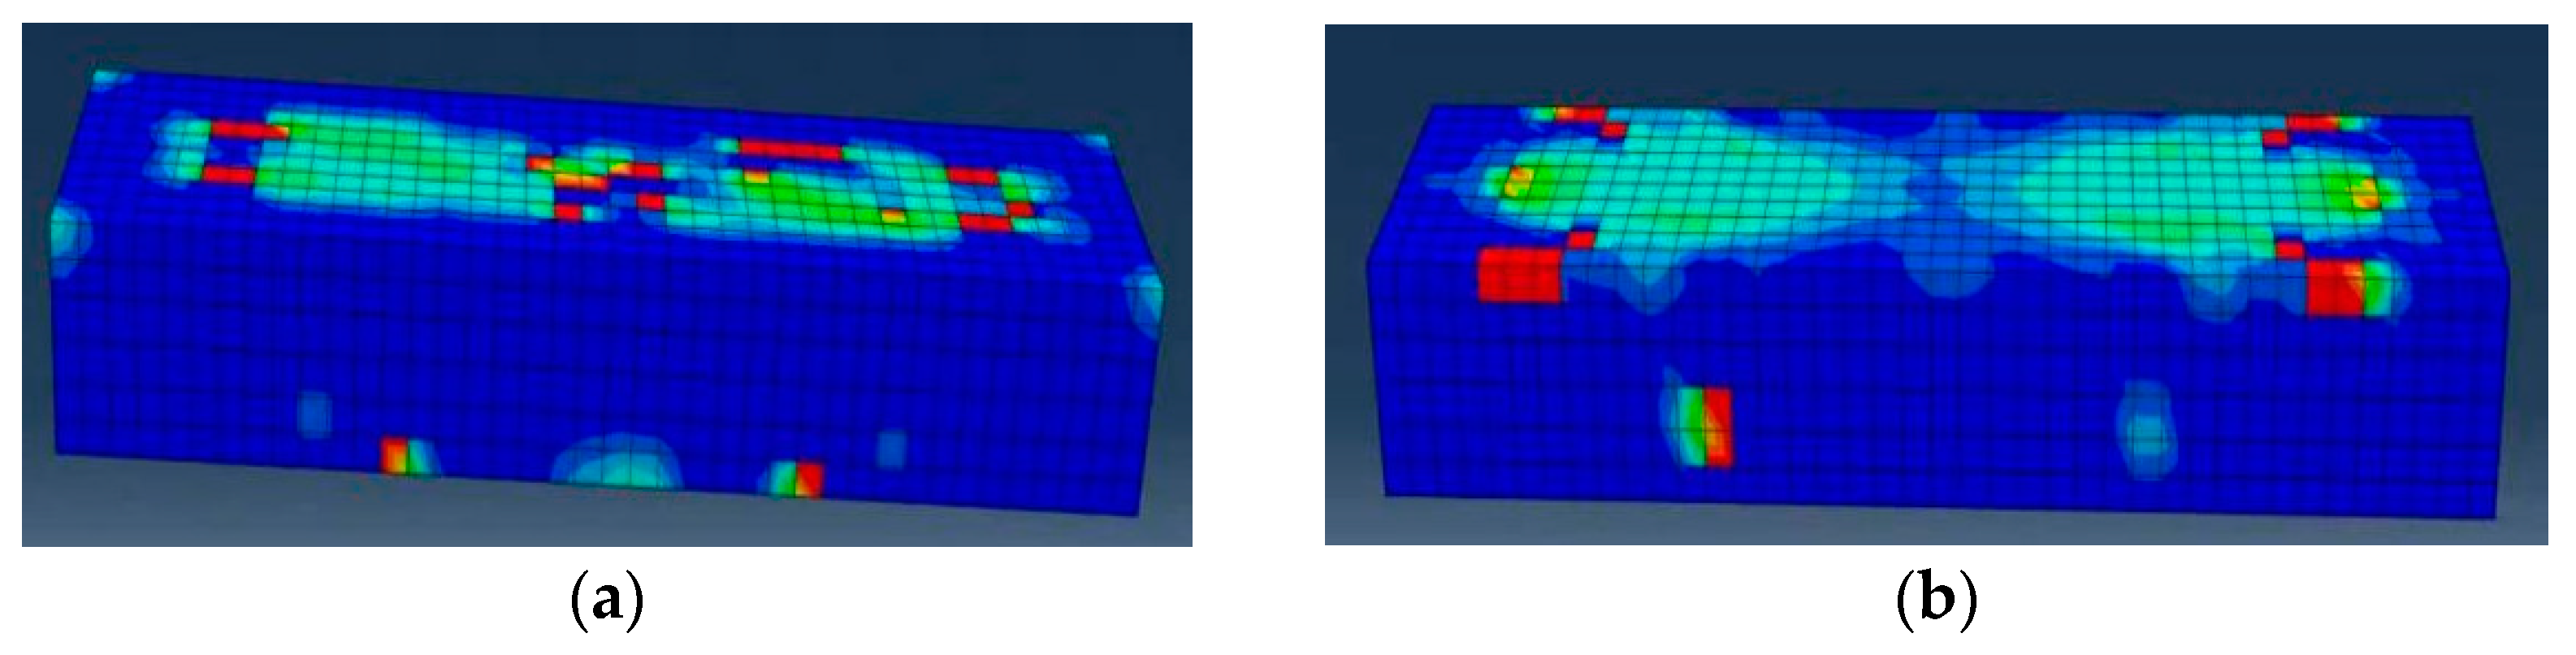
6.3.3. Finite Element Analysis of Fatigue Characteristics of Prestressed Reinforcement Components under Different Freeze–Thaw Cycles

A simulation analysis of the fatigue characteristics of the finite element model for the reinforced prestressed hollow slabs subjected to freezing and thawing corrosion was performed according to the theoretical decay model for the strength and elasticity of the concrete materials, which were primarily subjected to freezing and thawing. The fatigue properties were simulated and analyzed by changing the material parameters of the concrete materials under freeze–thaw erosion. The initial compressive strength of the concrete obtained from the experiment was 31.6 MPa. After 50, 100, 150, and 200 freeze–thaw cycles, the residual compressive strengths of the concrete were calculated to be 28.63 MPa, 27.23 MPa, 25.91 MPa, and 24.64 MPa, respectively, using Formula (1). The modulus of elasticity of the concrete was set based on the theoretical decay model for the concrete materials in the freeze–thaw cycle. The residual dynamic modulus of the concrete after the freeze–thaw cycle was calculated using Formula (2) and converted into a static elastic modulus using Formula (3). The initial elastic modulus was 34,500 MPa, and the residual static elastic moduli of the concrete after 50, 100, 150, and 200 freeze–thaw cycles were 20,577 MPa, 18,084 MPa, 15,582 MPa, and 13,412 MPa, respectively.
In addition, the material degradation in the steel bars under the action of freeze–thaw cycles was minute; therefore, the effects of freezing and thawing on the mechanical properties of the steel bars were not considered. In the fatigue cyclic loading simulation, 5.0 × 10⁵ cycles of fatigue loading were applied for different freeze–thaw cycles at a 0.8 stress level. The vertical displacement program of the reinforced components is shown in Figure 19.
Figure 19 shows that the reinforced specimens primarily produced large displacement deformations in the middle of the span under the double effects of freeze–thaw cycles and fatigue loads. Thus, the midspan node 576 was selected as the reference node, and the deflection values at this reference node for different freeze–thaw cycles and 20.0 × 10⁵ fatigue cycles of loading were extracted, as shown in Figure 20. It was shown that the midspan deflection in the reinforced component that had not undergone freeze–thaw cycle corrosion was 1.12 mm after 20.0 × 10⁵ cycles of fatigue loading. The deflection values of the reinforced components after 50, 100, 150, and 200 freeze–thaw cycles and fatigue loading were 1.19 mm, 1.3 mm, 1.46 mm, and 1.68 mm, respectively, which were increased by 6%, 16%, 30%, and 50%, respectively. As described above, the flexure of the intermediate portion of the reinforced component increased continuously with the increasing number of freeze–thaw cycles. The rate of increase in the midspan deflection also increased, namely the downward deflection of the reinforced component became increasingly rapid.

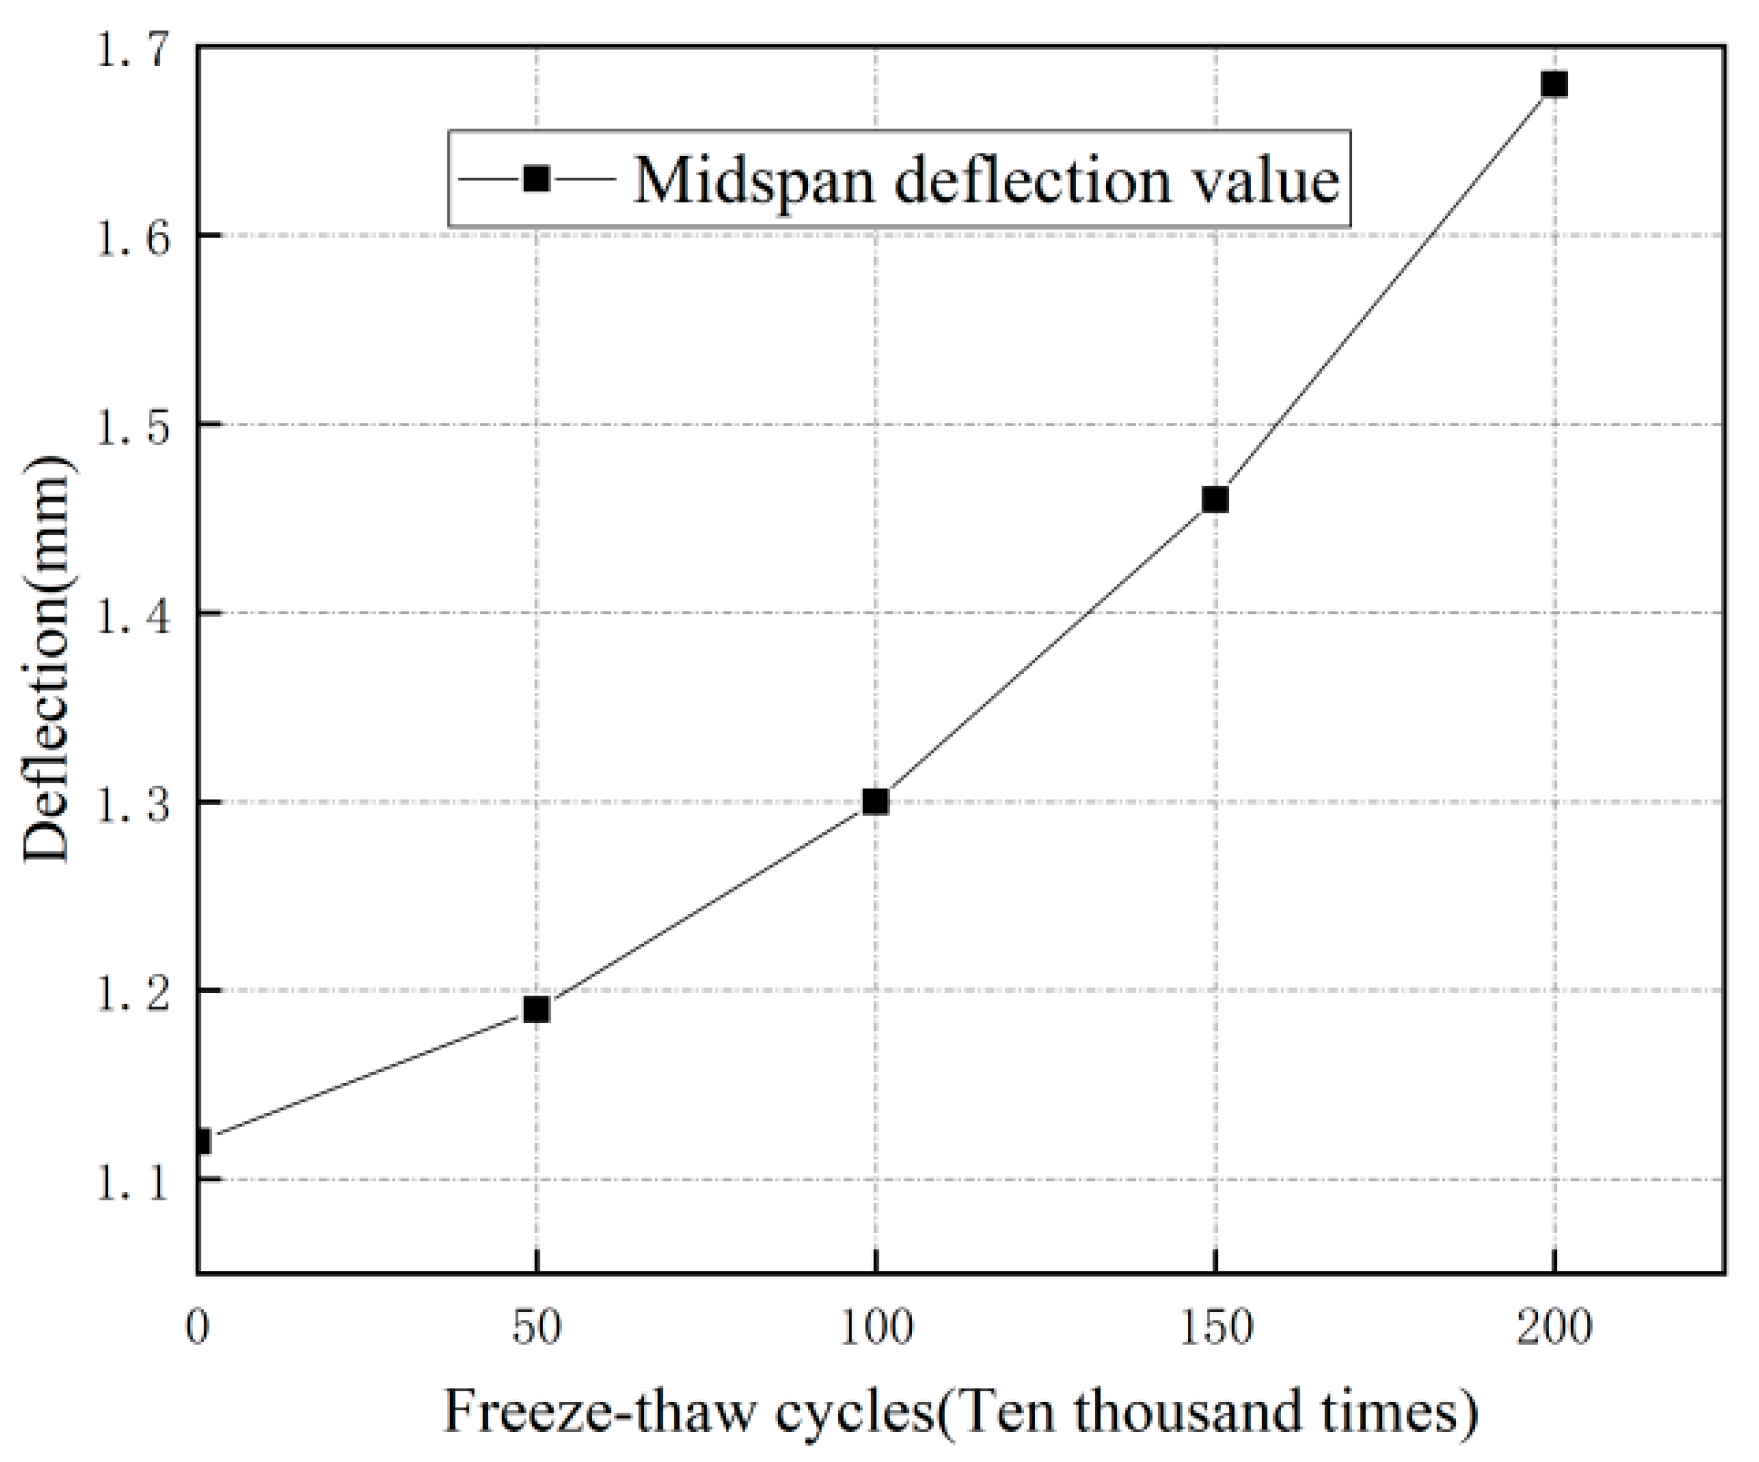
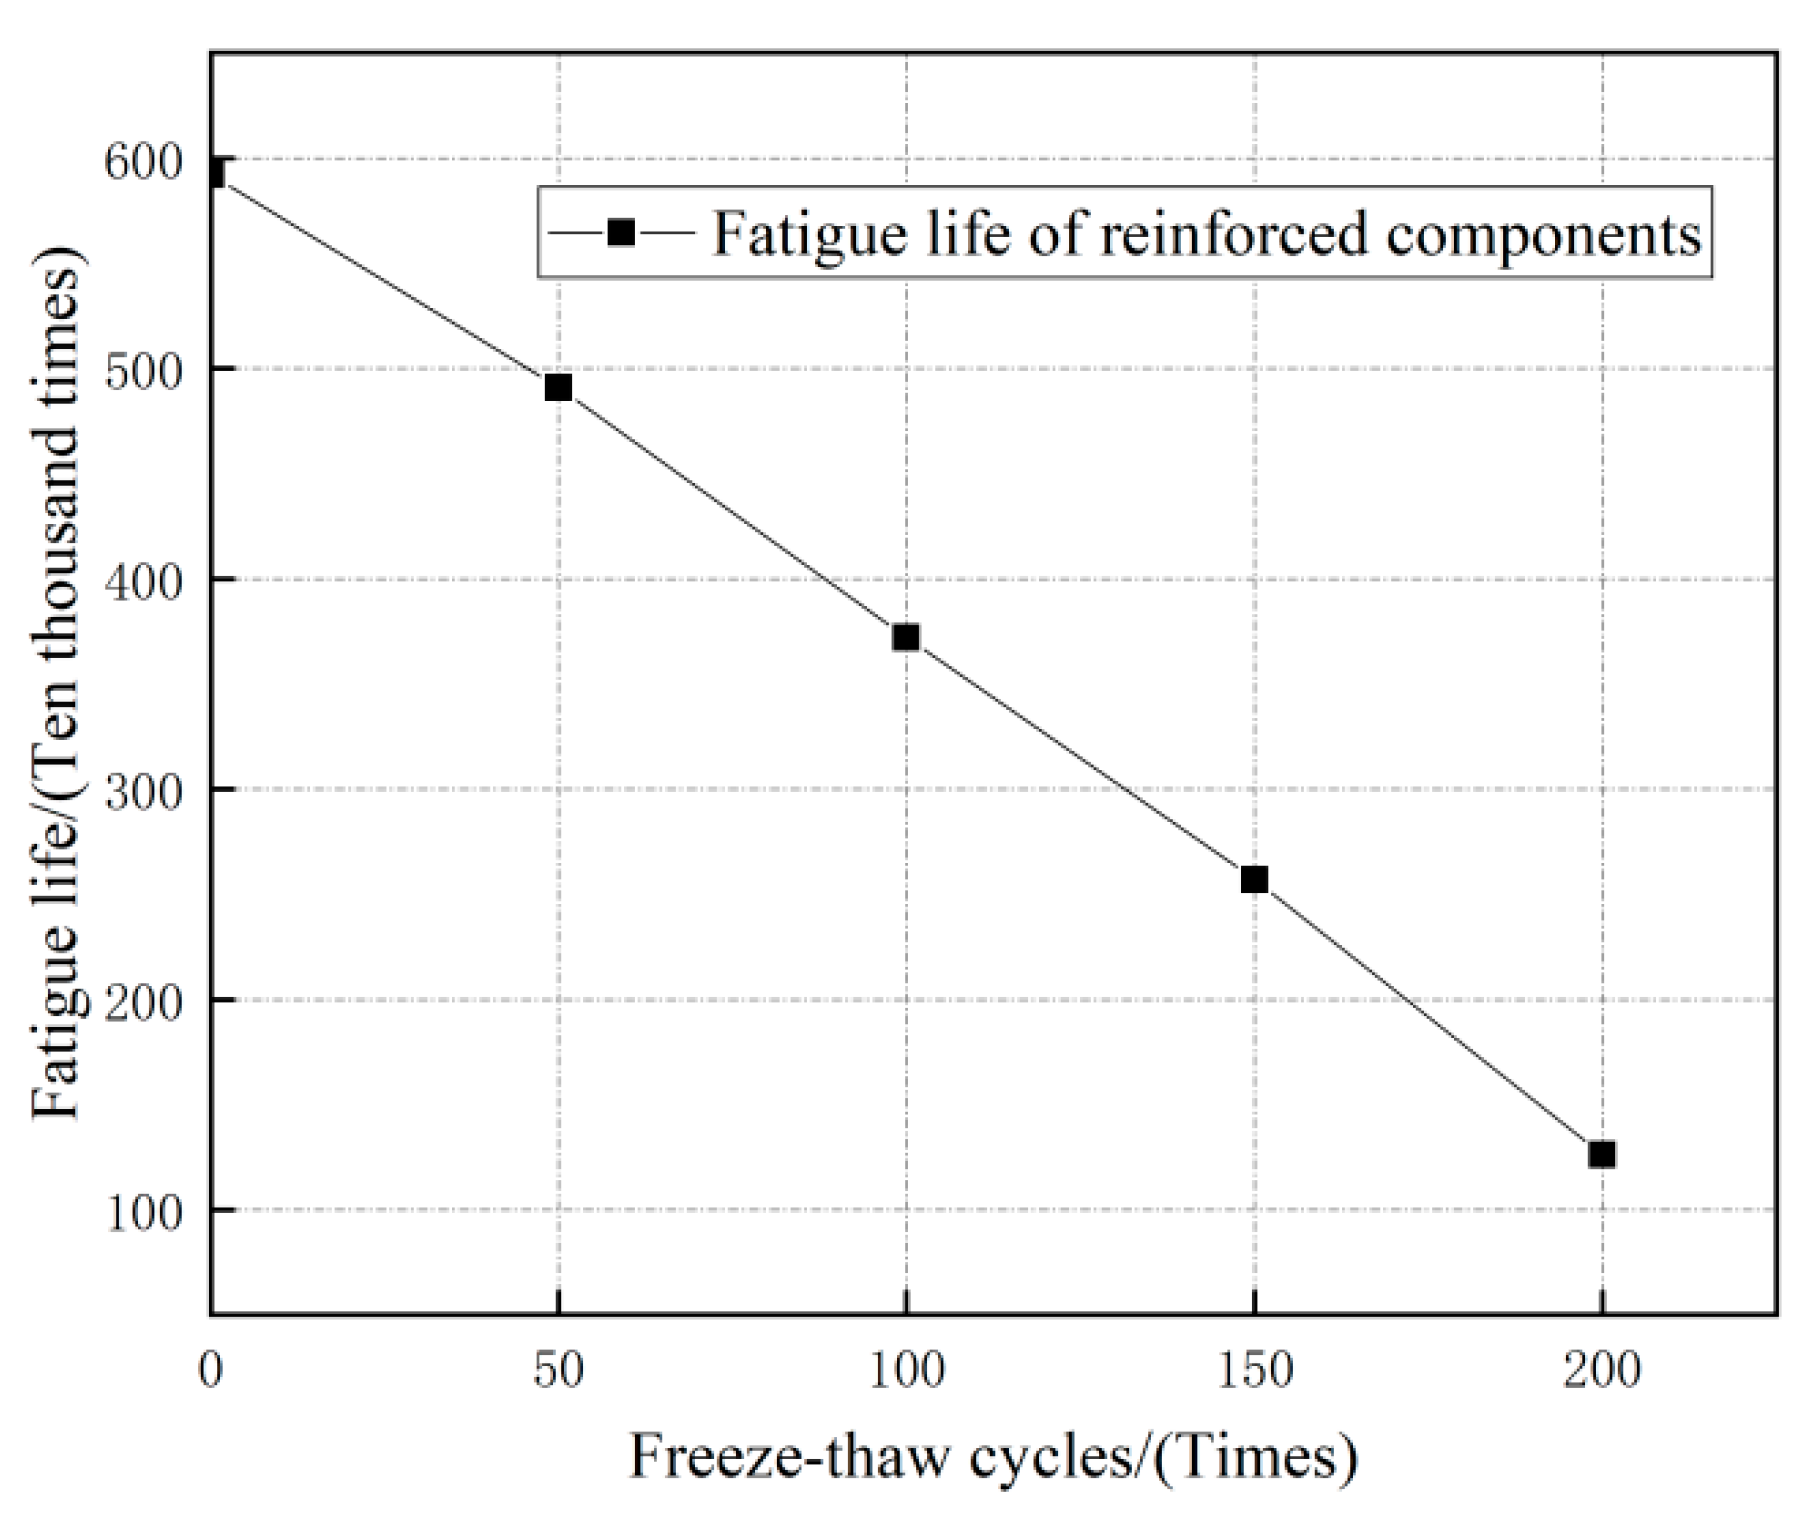
6.3.4. Fatigue Life Analysis of the Prestressed Strengthened Components for Different Freeze–Thaw Cycles

Many fatigue tests have been conducted by scholars on different materials of different sizes, and the S-N curves of the fatigue properties under different conditions were obtained. In this paper, the S-N curve of the concrete flexural fatigue performance in the analysis of the fatigue life of reinforced components for different freeze–thaw cycles obtained by Shi et al. [43] is presented.
l g S = l g a 0.0422 ( 1 R ) l g N
where a is the correlation coefficient related to the failure probability of the material and R is the ratio of high to low stress.
In addition, the S-N curve of reinforcement in the prestressed hollow slab reinforced components primarily used the S-N curve equation for reinforcement fatigue proposed by Zeng et al. [44].
l o g N = 15.1348 4.3827 l o g Δ σ
where N is the number of fatigue loads, and Δ σ is the stress amplitude.
In this study, the fatigue life analysis of reinforcement components for different freezing and thawing cycles was conducted using the Fe-safe fatigue analysis software. The fatigue life of the prestressed hollow slab reinforcement was simulated by setting the fatigue performance S-N curve of the main related materials in the reinforced component based on the finite element stress analysis results for different freezing and thawing cycles. The fatigue life program of the reinforced components is shown in Figure 21.
Figure 21 shows that the freeze–thaw cycle corrosion mainly caused damage to the concrete and reduced its fatigue life, and the regions with relatively weak fatigue lives were primarily concentrated on the damaged concrete bottom surface. Figure 22 shows that the fatigue life of the prestressed hollow slab reinforced component exceeded 2 million cycles under the action of 0, 50, 100, and 150 freeze–thaw cycles. Therefore, the prestressed hollow slab reinforced components bonded with steel plates exhibited certain anti-fatigue characteristics. However, as the number of freezing and thawing cycles increased, the fatigue lives of the prestressed reinforced hollow slabs continuously decreased and the decay of the fatigue life tended to increase. The fatigue life of the prestressed hollow slab reinforced component that had not undergone freeze–thaw cycle corrosion was 5.92 million cycles. After 50, 100, 150, and 200 freeze–thaw cycles, the fatigue lif of the reinforced components was reduced to 4.91 million, 3.72 million, 2.57 million, and 1.26 million cycles, respectively. Under the effect of corrosion by the freezing and thawing cycles, the fatigue life of reinforced components was reduced by 17–78% relative to the fatigue life obtained in the cases without corrosion. The freeze–thaw cycle corrosion greatly affected the fatigue life of the prestressed hollow slab reinforced with bonded steel plates.

7. Conclusions

In this study, freeze–thaw cycle and fatigue tests were performed on prestressed hollow slab model components reinforced by pasting steel plates and bonded carbon fiber sheets after fatigue damage. Based on the finite element model for the components reinforced by pasting steel plates, the relevant mechanical properties and fatigue characteristics of the prestressed hollow slab strengthened components with fatigue damage under freeze–thaw cycle erosion were systematically studied. The main conclusions of this study are as follows.
(1) For a 2 m long hollow slab beam, the midspan deflection in the prestressed hollow slab beam strengthened by pasting steel plates and carbon fiber sheets was less than that in the prestressed hollow slab beam after fatigue damage and prior to strengthening. Under a constant load, the compressive strain generated by the concrete at the top of the midspan of the reinforced test plate was less than that generated in the unreinforced prestressed hollow core slab, and the tensile strain generated at the bottom under a load was also less than that of the unreinforced components.
(2) The test 2 m long hollow slab beam strengthened using steel plates and carbon fiber sheets could withstand 2 million cycles of fatigue loading at a 0.8 stress level. The test plates exhibited good fatigue resistance characteristics for both methods of reinforcement. Under the fatigue load, the original cracks did not expand further and no new cracks appeared in the test plate reinforced by pasting steel plates. The bonded carbon fiber sheet produced new shear cracks during fatigue loading; however, the new cracks expanded slowly during continued loading.
(3) After the freeze–thaw cycle erosion of the 2 m long hollow slab beams reinforced by pasting carbon fiber sheets during 2 million cycles of fatigue loading, the original cracks were not noticeable, there were a few newly emerged cracks, and the top plate was significantly damaged. Cracks were almost absent during the 2 million cycles of fatigue loading for the bonded steel plate reinforced components, which exhibited good anti-cracking performance. Under fatigue loading, the freezing–thawing cyclic effect increased the deflection and strain of the reinforced components, and the growth rate increased with the number of fatigue loading cycles. In addition, there existed a dynamic displacement of the strengthened components after the erosive effect of the freeze–thaw cycles during fatigue loading. The impact resistance of the strengthened components under the action of the freeze–thaw cycles was weakened.
(4) By establishing a numerical model for the 2 m long hollow slab beam strengthened by bonded steel plates, the midspan deflection in the strengthened components increased with increasing freeze–thaw cycles, and its rate of increase grew gradually. Furthermore, an increase in the number of freeze–thaw cycles significantly affected the fatigue lives of the components reinforced by bonded steel plate.

Author Contributions

Methodology, Y.Z.; conceptualization, Y.Z. and J.L.; software, Y.Z. and J.L.; writing—original draft preparation, Y.Z. and J.L.; writing—review and editing, Y.Z., C.G. and P.G.; funding acquisition, Y.Z. All authors have read and agreed to the published version of the manuscript.

Funding

This work was supported by National Natural Science Foundation of China (Grant No. 51878623, U2040224), Key Research and Development and Promotion Special Project of Henan Province in 2020 (Key Science and Technology Tack) (Grant No. 202102310241), and Program for Young Backbone Teachers in Colleges and Universities in Henan (Grant 2018GGJS005).

Institutional Review Board Statement

Not applicable.

Informed Consent Statement

Not applicable.

Data Availability Statement

Not applicable.

Acknowledgments

Special thanks are extended to the anonymous reviewers for their valuable comments.

Conflicts of Interest

The authors declare that they have no conflict of interest.

References

  1. Fagerlund, G. The significance of critical degrees of saturation at freezing of porous and brittle materials. In Durability of Concrete; Seholer, C.F., Ed.; American Concrete Institute: Detroit, MI, USA, 1975; pp. 13–65. [Google Scholar]
  2. Hu, Q.S. Study on Mechanical Performance of Prestressed Concrete Bending Members under Freeze-thawing Environment. Master’s Thesis, Jiangsu University of Science and Technology, Zhenjiang, China, 2014. [Google Scholar]
  3. Ban, J.; Han, M.Z. Research on influence of air content on frost resistance of fly ash concrete. J. Water Resour. Water Eng. 2014, 25, 137–139. [Google Scholar]
  4. Mu, R. Durability and Service Life Prediction of Concrete Subjecte1 to the Combined Action of Freezing-Thawing, Sustained External Flexural Stress and Salt Solution. Ph.D. Thesis, Southeast University, Nanjing, China, 2000. [Google Scholar]
  5. Wu, W.Y. Experimental and Numerical Study on Mechanical Properties of Concrete under Different Loading Rates and Freeze-thaw Cycles. Master’s Thesis, Chang’an University, Xi’an, China, 2019. [Google Scholar]
  6. Wang, X. Fatigue Numerical Simulation and Reliability Study of Prestressed Concrete Flexural Members Subjected to Fatigue Loading and Freeze-thaw Cycles. Master’s Thesis, Jiangsu University of Science and Technology, Zhenjiang, China, 2017. [Google Scholar]
  7. Hasan, M.; Ueda, T.; Sato, Y. Stress-Strain Relationship of Frost-Damaged Concrete Subjected to Fatigue Loading. J. Mater. Civ. Eng. 2008, 20, 37–45. [Google Scholar] [CrossRef]
  8. Li, W.T.; Sun, W.; Jiang, J.Y. Damage of concrete experiencing flexural fatigue load and closed freeze/thaw cycles simultaneously. Constr. Build. Mater. 2011, 25, 2604–2610. [Google Scholar] [CrossRef]
  9. Wei, J.; Wu, X.H.; Zhao, X.L. A Model for Concrete Durability Degradation in Freeze-thawing cycles. ACTA Mech. Solida Sin. 2003, 16, 353–358. [Google Scholar]
  10. Xu, L.L. The Fatigue Performance of the Prestressed Concrete under Bending Loads in the Freeze-Thaw Environment. Master’s Thesis, Jiangsu University of Science and Technology, Zhenjiang, China, 2013. [Google Scholar]
  11. Li, C.C.; Gao, D.Y.; Zhao, J. Experimental study on durability of FRP entirely-wrapped concrete cylinders and FRP strip-wrapped concrete cylinders under wet-dry cycles in salt solution. China Civ. Eng. J. 2009, 42, 8–14. [Google Scholar]
  12. Ali, O.; Bigaud, D.; Ferrier, E. Comparative durability analysis of CFRP-strengthened RC highway bridges. Constr. Build. Mater. 2012, 30, 629–642. [Google Scholar] [CrossRef] [Green Version]
  13. Zhang, L.L.; Zhang, L.; Ma, J.X. Durability test of reinforced concrete structures externally bonded with CFRP in marine environment. China Civ. Eng. J. 2010, 43, 77–81. [Google Scholar]
  14. Arora, H.C.; Sharma, U.K.; Rao, B.K.; Chakraborty, A. A pilot investigation for comparative assessment of corrosion durability of reinforced concrete beams. Indian Concr. J. 2014, 88, 36–44. [Google Scholar]
  15. Hall, M.R.; Najim, K.B. Structural behavior and durability of steel-reinforced structural Plain/Self-Compacting Rubberised Concrete (PRC/SCRC). Constr. Build. Mater. 2014, 73, 490–497. [Google Scholar] [CrossRef]
  16. Cheewaket, T.; Jaturapitakkul, C.; Chalee, W. Concrete durability presented by acceptable chloride level and chloride diffusion coefficient in concrete: 10-year results in marine site. Mater. Struct. 2014, 47, 1501–1511. [Google Scholar] [CrossRef]
  17. Xue, F. Study of Detection Theory and Test for Old Bridges. Master’s Thesis, Wuhan University, Wuhan, China, 2004. [Google Scholar]
  18. Huang, X.D.; Tian, Y.; Wang, Y.W.; Lou, Y. Identification, Reinforcement and Storied Addition of Buildings; China Architecture & Building Press: Beijing, China, 2008. [Google Scholar]
  19. Wang, W.Y. FRP Reinforced Concrete Structure Technology and Application; China Architecture & Building Press: Beijing, China, 2007. [Google Scholar]
  20. Shuang, Y.; Qiu, H.W.; Wang, H.H. Structural Reliability Evaluation and Reinforcement Technology; China Water & Power Press: Beijing, China, 2002. [Google Scholar]
  21. Ma, J.; Sun, S.Z.; Yang, Q. Review on China’s Bridge Engineering Research. China J. Highw. Transp. 2021, 5, 91–96. [Google Scholar]
  22. Naaman, A. Repair and Strengthening of Reinforced Concrete Beams Using CFRP Laminates; Testing and Research Section, Construction and Technology Division, Research Project No. RC-1372; University of Michigan, Department of Civil and Engineering: Ann Arbor, MI, USA, 1999. [Google Scholar]
  23. Bizindavyi, L.; Neale, K.W.; Erki, M.A. Experimental Investigation of Bonded Fiber Reinforced Polymer-Concrete Joints under Cyclic Loading. J. Compos. Constr. 2003, 7, 127–134. [Google Scholar] [CrossRef]
  24. Ning, B.K.; Li, S.; Liu, W.; Zhang, J. Experiment on freezing and thawing characteristics of prestressed carbon fiber cloth reinforced concrete beams. J. Shenyang Univ. Technol. 2017, 39, 567–571. [Google Scholar]
  25. Cui, X. Bearing Capacity of High Strengthened Concrete Beams with Prestressed CFRP under Freeze-Thaw Cycles. Master’s Thesis, Dalian University of Technology, Dalian, China, 2020. [Google Scholar]
  26. Jiang, H.X. Durability Study of High Strengthened Concrete with Prestressed CFRP under Freeze-Thaw and Wet-Dry Cycles. Master’s Thesis, Dalian University of Technology, Dalian, China, 2017. [Google Scholar]
  27. Zhang, H.K. The Durability Research of Basalt Fiber Reinforced Concrete Continuous Beam Fatigue and Freeze-thaw. Master’s Thesis, Ji Lin Jianzhu University, Changchun, China, 2015. [Google Scholar]
  28. Yu, L.; Qian, X.D.; Wu, X.H. Influence of Freeze—Thaw Environment on the Fatigue Performance of CFRP Reinforced Concrete Beam. Concrete 2012, 5, 27–28, 31. [Google Scholar]
  29. Ziraba, Y.N.; Baluch, M.H.; Basunbul, I.A.; Sharif, A.M.; Azad, A.K.; Al-Sulaimani, G.J. Guidelines toward the design of reinforced concrete (RC) beams with external plates. Struct. J. 1994, 91, 639–646. [Google Scholar]
  30. Swamy, R.N.; Mukhopadhyaya, P.; Lynsdale, C.J. Strengthening for shear of RC beams by external plate bonding. Struct. Eng. 1999, 77, 19–30. [Google Scholar]
  31. Xie, L.L.; Yu, S.G.; Liu, L.X.; Peng, C.L.; Wang, M.Z. Experimental Study on Flexural Properties of R.C. Beams Strengthened with Externally Bonded Steel Plate Anchored by Rivetsor Screw. J. Zhengzhou Univ. (Eng. Sci.) 2008, 29, 31–34. [Google Scholar]
  32. Xie, L.L.; Yu, S.G.; Liu, L.X.; Peng, C.L.; Wang, M.Z. Experimental Study on Shear Properties of R.C. Beams Strengthened with Externally Bonded Steel Plate Anchored by Rivetsor Screw. J. Zhengzhou Univ. (Eng. Sci.) 2009, 30, 18–21, 47. [Google Scholar]
  33. Wang, M.Z. Experimental Study on Steel Plate Reinforced Concrete Beam Fatigue Mechanical Properties. Ph.D. Thesis, Zhengzhou University, Zhengzhou, China, 2009. [Google Scholar]
  34. Inoue, S.; Nishibayashi, S.; Yoshino, A.; Omata, F. Deformation characteristics, static and fatigue strengths of reinforced concrete beams strengthened with carbon fiber-reinforced plastic plate. Trans. Jpn. Concr. Inst. 1997, 18, 143–150. [Google Scholar]
  35. Capozucca, R.; Cerri, M.N. Static and dynamic behavior of RC beam model strengthened by CFRP-sheets. Constr. Build. Mater. 2002, 16, 91–99. [Google Scholar] [CrossRef]
  36. Zhang, J.X.; Ye, J.X.; Yao, W.F. Fatigue behavior of the reinforced concrete beam strengthened with steel plate or CFRP. Build. Struct. 2010, 40, 392–394. [Google Scholar]
  37. Zhang, Y.X.; Li, K.; Ji, M.G.; Moshtagh, E. Study on Fatigue Characteristics of Carbonation Erosion Prestressed Hollow Slabs in Whole Life Cycle. Adv. Civ. Eng. 2020, 2020, 8816767. [Google Scholar] [CrossRef]
  38. Ministry of Transport of the People’s Republic of China. Specifications for Strengthening Design of Highway Bridges; JTG/T J22-2008; China Communications Press: Beijing, China, 2008.
  39. Ministry of Housing and Urban Rural Development of the People’s Republic of China. Standard for Test Methods of Long-Term Performance and Durability of Ordinary Concrete; GB-T50082-2009; China Architecture & Building Press: Beijing, China, 2009.
  40. Xiao, Q.H.; Niu, D.T.; Zhu, W.P. Strength degradation model and durability service life prediction of concrete in freezing-thawing circumstance. Build. Struct. 2011, S2, 203–207. [Google Scholar]
  41. Xiao, Q.H. Concrete Structure Durability in Freezing-thawing Circumstance Based on Multi-Facor Effects. Ph.D. Thesis, Xi’an University of Architecture & Technology, Xi’an, China, 2010. [Google Scholar]
  42. Zhang, J.R.; Tang, T. Experimental study on the correlation between dynamic and static elastic modulus of concrete. J. China Foreign Highw. 2010, 30, 256–260. [Google Scholar]
  43. Shi, X.P.; Yao, Z.K.; Li, H.; Gu, M.H. Study on flexural fatigue behavior of cement concrete. China Civ. Eng. J. 1990, 23, 11–22. [Google Scholar]
  44. Zeng, Z.B.; Li, Z.R. Research on Fatigue S-N Curves of Reinforcing Bars in Common Reinforced Concrete Beams. China Civ. Eng. J. 1999, 10, 10–14. [Google Scholar]
Figure 1. Longitudinal section, cross-section, and distributed steel of the prestressed hollow slab girder (mm): (a) Longitudinal section and; (b) Cross-section and distributed steel.
Applsci 11 07692 g001
Figure 2. Elevation of test beam layout of electronic strain gauges (mm).
Applsci 11 07692 g002
Figure 3. Layout of digital displacement meters in elevation on the test beam (mm).
Applsci 11 07692 g003
Figure 4. The static loading test.
Applsci 11 07692 g004
Figure 5. Fatigue load crack diagram of the test plate.
Applsci 11 07692 g005
Figure 6. Construction drawing of the test beam reinforced with carbon fiber sheets.
Applsci 11 07692 g006
Figure 7. Construction drawing of the test beam strengthened by pasting steel plates.
Applsci 11 07692 g007
Figure 8. Freeze–thaw test process for the reinforced test plate and corresponding test blocks: (a) freezing of the reinforced test plate; (b) water melting of the test plate; (c) melted test plate; (d) simultaneous immersion melting of the test blocks.
Applsci 11 07692 g008
Figure 9. Pasting a carbon fiber cloth reinforced component interface after freeze–thaw erosion.
Applsci 11 07692 g009
Figure 10. Surface rust on the affixed steel plate after freeze–thaw erosion.
Applsci 11 07692 g010
Figure 11. Damage diagram of test plate reinforced by carbon fiber cloth during fatigue testing: (a) local crushing after 2 million fatigue cycles at the roof; (b) damage map of roof concrete.
Applsci 11 07692 g011
Figure 12. Deflection rend diagram of fatigue process by freeze–thawing erosion of strengthened test plate.
Applsci 11 07692 g012
Figure 13. Figures of tensile strain and compressive strain of strengthened test plate during freeze–thaw fatigue process: (a) tensile strain; (b) compressive strain.
Applsci 11 07692 g013
Figure 14. Dynamic displacement diagram of fatigue test process of steel plate strengthened component.
Applsci 11 07692 g014
Figure 15. Finite element model of the prestressed hollow slab.
Applsci 11 07692 g015
Figure 16. Comparison of measured and simulated load-displacement curves of test plate.
Applsci 11 07692 g016
Figure 17. Damage diagram of prestressed hollow slab concrete.
Applsci 11 07692 g017
Figure 18. Finite element model of the prestressed hollow slab reinforced component.
Applsci 11 07692 g018
Figure 19. Vertical displacement program of reinforced components with different freeze–thaw cycles: (a) 100 freeze–thaw cycles; (b) 150 freeze–thaw cycles.
Applsci 11 07692 g019
Figure 20. Midspan deflection of reinforced components under different freeze–thaw cycles.
Applsci 11 07692 g020
Figure 21. Fatigue life map of reinforced components under different freeze–thaw cycles: (a) 50 freeze–thaw cycles; (b) 100 freeze–thaw cycles.
Applsci 11 07692 g021
Figure 22. Fatigue life of reinforced components under different freeze–thaw cycles.
Applsci 11 07692 g022
Table 1. Partial similarity coefficient of the model.
Physical Quantity of the ModelSectional Area (A)Length (L)Elastic Modulus of Steel Strand (ES)Elastic Modulus of Concrete (Ec)Poisson’s Ratio of Concrete (μc)
Similarity ratioCA = 0.25CL = 0.1CEs = 1CEc = 1Cμc = 1
Table 2. Design of test scheme.
Test Group NumberDegree of ErosionReinforcement MethodLoading Mode
B-0No erosionNo reinforcementStatic
B-1No erosionNo reinforcementFatigue
B-2No erosionBonding steel plateFatigue
B-3No erosionSticking carbon fiber clothFatigue
B-4Freeze–thawSticking carbon fiber clothFatigue
B-5Freeze–thawBonding steel plateFatigue
Table 3. Deflection and strain of prestressed hollow slab before and after strengthening with carbon fiber cloth.
Before StrengtheningAfter Strengthening
Load
(kN)
D-1/2
(mm)
D-1/4
(mm)
S-1
(με)
S-2
(με)
D-1/2
(mm)
D-1/4
(mm)
S-1
(με)
S-2
(με)
500.300.36−118.267.30.250.24−111.167.6
1000.660.48−208.5122.10.530.36−197.8110.2
1500.940.64−301.7162.70.790.53−292.1154.4
Table 4. Deflection and strain of prestressed hollow slab before and after strengthening with steel plate.
Before StrengtheningAfter Strengthening
Load
(kN)
D-1/2
(mm)
D-1/4
(mm)
S-1
(με)
S-2
(με)
D-1/2
(mm)
D-1/4
(mm)
S-1
(με)
S-2
(με)
500.490.24−76.758.80.440.23−53.657.6
1000.670.34−139.4116.20.630.37−111.6110
1500.970.49−204.3180.90.830.48−163.5162.4
Table 5. Variations of velocity and relative dynamic elastic modulus of the concrete cubic test block.
Test BlockUnfreeze–Thaw Cycle50 Freeze–Thaw Cycles
Average propagation speed (m/s)43503789
Relative dynamic elastic modulus100%87.10%
Table 6. Compressive strength test results of concrete cubic blocks.
Freeze–Thaw CyclesLimit Average Failure Load of Cubic Specimens after Freezing and Thawing (kN)Average Compressive Strength of Cubic Specimens after Freezing and Thawing (MPa)
0553.652.59
50482.045.79
Table 7. Table of mid-span tensile strain variation with fatigue times after freeze–thaw damage of test plate strengthened with bonded steel plate (με).
Number of Fatigue Cycles50 kN100 kN150 kN200 kN
060.1115.0178.1237.5
5.0 × 10565.5126.5198.4264.5
10.0 × 10566.0134.6200.1276.9
15.0 × 10570.2142.2210.2280.3
20.0 × 10580.2153.2230.1300.2
Table 8. Table of mid-span compressive strain variation with fatigue times after freeze–thaw damage of test plate strengthened with bonded steel plate (με).
Number of Fatigue Cycles50 kN100 kN150 kN200 kN
0−87.2−168.1−246.4−328.5
5.0 × 10⁵−96.0−178.4−257.5−343.3
10.0 × 10⁵−89.4−177.7−278.2−370.9
15.0 × 10⁵−100.3−185.5−290.4−387.2
20.0 × 10⁵−112.3−196.3−300.6−412.3
Table 9. Table for variation of the deflection of the bonded steel plate reinforced test plate in span, with number of fatigue damages after freeze–thaw damage (mm).
Number of Fatigue Cycles50 kN100 kN150 kN200 kN
00.480.710.871.16
5.0 × 1050.500.730.931.25
10.0 × 1050.530.841.021.36
15.0 × 1050.630.881.131.51
20.0 × 1050.650.931.321.76
Table 10. Table of dynamic displacement change of test plate under 2 million fatigue loads.
Test Group NumberDegree of ErosionReinforcement MethodPeak
(mm)
Trough
(mm)
Amplitude
(mm)
B-2No erosionPasting steel plate0.9−0.320.71
B-3No erosionPasting carbon fiber cloth0.37−0.330.71
B-4Freeze–thawPasting carbon fiber cloth0.54−0.521.06
B-5Freeze–thawPasting steel plate0.53−0.481.01
Publisher’s Note: MDPI stays neutral with regard to jurisdictional claims in published maps and institutional affiliations.

