Article

Capacitive Online Corn Moisture Content Sensor Considering Porosity Distributions: Modeling, Design, and Experiments

College of Engineering, South China Agricultural University, Guangzhou 510642, China
*
Author to whom correspondence should be addressed.
Appl. Sci. 2021, 11(16), 7655; https://doi.org/10.3390/app11167655
Submission received: 24 July 2021 / Revised: 11 August 2021 / Accepted: 19 August 2021 / Published: 20 August 2021
(This article belongs to the Topic New Frontiers in Industry 4.0)

Abstract

:
An online corn moisture content measurement device would be a key technology for providing accurate feedback information for industrial drying processes to enable the dynamic tracking and closed-loop control of the process. To overcome the problem of large measurement error caused by the characteristics of the corn flow state and the pore distribution when a parallel plate capacitor is applied to the online moisture content measurement process, in this study, we summarized the constraint conditions of the sensor’s structure parameters by mathematical modeling and calculated the optimal sensor design size. Moreover, the influence of porosity variation on moisture content measurement was studied by using the designed sensor. In addition, a mathematical model for calculating corn moisture content was obtained for the moisture content range of 14.7% to 26.4% w.b., temperature of 5 °C to 35 °C, and porosity of 38.4% to 44.6%. The results indicated that the fluctuation in the online moisture content measurement value was obviously reduced after the porosity compensation. The absolute error of the measured moisture content value was −0.62 to 0.67% w.b., and the average of absolute values of error was 0.32% w.b. The main results provide a theoretical basis and technical support for the development of intelligent industrial grain–drying equipment.

1. Introduction

Industrial corn drying plays an important role in improving grain storage, inhibiting the growth of pests and microorganisms, increasing product storage period, and reducing transportation costs [1,2]. In recent years, the method used to control industrial corn dryers have entered the stage of intelligent control with the development of computer control technology and artificial intelligence [3,4]. To realize the intelligent control of the grain drying process, modeling the complex drying system with an artificial intelligence algorithm in combination with modern control technology might help to effectively construct an intelligent predictive controller [5]. However, an online corn moisture content measurement device is necessary to provide accurate data samples for establishing a data-driven model of the drying process and for providing accurate feedback information for the dryer controller. Therefore, an in-depth study of online corn moisture content sensor is vital to improving the intelligent control theory of grain drying and to developing intelligent control technology.
In recent years, for the moisture content measurement of agricultural products, researchers have developed a variety of static measurement instruments with high measurement accuracy based on optical [6,7], nuclear [8], hygrometric [9], and dielectric methods [10,11,12]. However, due to the difference in drying parameters, environmental conditions, material properties, and development costs, the most practical method is an electronic online measurement device based on the resistance and capacitance properties of materials [13,14]. Due to the shape of a corn kernel being flat or nearly spherical, the moisture content of different parts in a single kernel varies widely, and water diffusion occurs from the endosperm to the embryo during the drying process [15]. Thus, it is difficult to develop a high-precision online measurement device based on the resistance characteristics of a single grain given the difference in the texture and the dynamic change in the moisture distribution in a single kernel.
Since Nelson’s research in 1977, [16] showed that a strong correlation exists between grain’s dielectric properties and moisture content, various practical applications of moisture content measurement of agricultural products based on their dielectric properties have emerged, such as for flaxseed [17], safflower seeds [18], meat [19], date [20], and hazelnut [21]. The capacitive sensor is a low-cost and easy-to-use method to detect some features of agricultural products according to their dielectric properties. The parallel plate capacitor, designed based on the capacitance method, is a classic and mature application of the capacitance method. For decades, this type of sensor was widely used in quality measurement (especially moisture content measurement) of some agricultural products, having acceptable accuracy. In the grain drying process, a moisture sensor based on the parallel plate structure can accurately and quickly reflect the average moisture content in the drying layer.
Porosity is an essential physical parameter that is related to the shape, filling method, size, and distribution of the material; moisture content; storage time; motion state; and many other factors [22]. Considering the porosity change caused by the objective conditions of the drying process, such as the mechanical properties of the grain and the flow characteristics caused by the filling method, the online moisture content measurement devices based on capacitance method still have some defects, such as low precision and poor stability. In the industrial corn drying process, some complex factors, such as the flow of corn [23], harsh external environment [24], and impurities [25], lead to changes in the porosity in the measurement cavity. Given the complex process of corn drying, a researcher should not only consider the traditional sensor design index, such as range, resolution, and measure precision, but also the factors causing interference due to the objective conditions of the drying process such as the mechanical properties of the corn and the flow characteristics caused by the filling method. In addition, applications in actual drying sites are still unreliable. Therefore, it is necessary to consider the influence of porosity when designing a capacitive online moisture content sensor to be applied in the drying process.
Based on the above considerations, the objectives of this study were: (1) to summarize the constraint conditions of a sensor’s structure parameters by mathematical modeling and to calculate the optimal size of a sensor; (2) to reveal the effects of porosity on the capacitance characteristics of the filling layer through designing a multiple–factor experiment and to obtain the mathematical model calculating corn moisture content. The novelty aspect of this study is that the porosity, which is a basic physical parameter of agricultural materials, was unified and quantified to establish the characteristic function to fully characterize the proportion relations of all phase system components (i.e., air and corn) of the filling layer to identify the path optimizing moisture content measurement technology in the industrial corn drying process.

2. Materials and Methods

2.1. Modeling

2.1.1. Theory Consideration

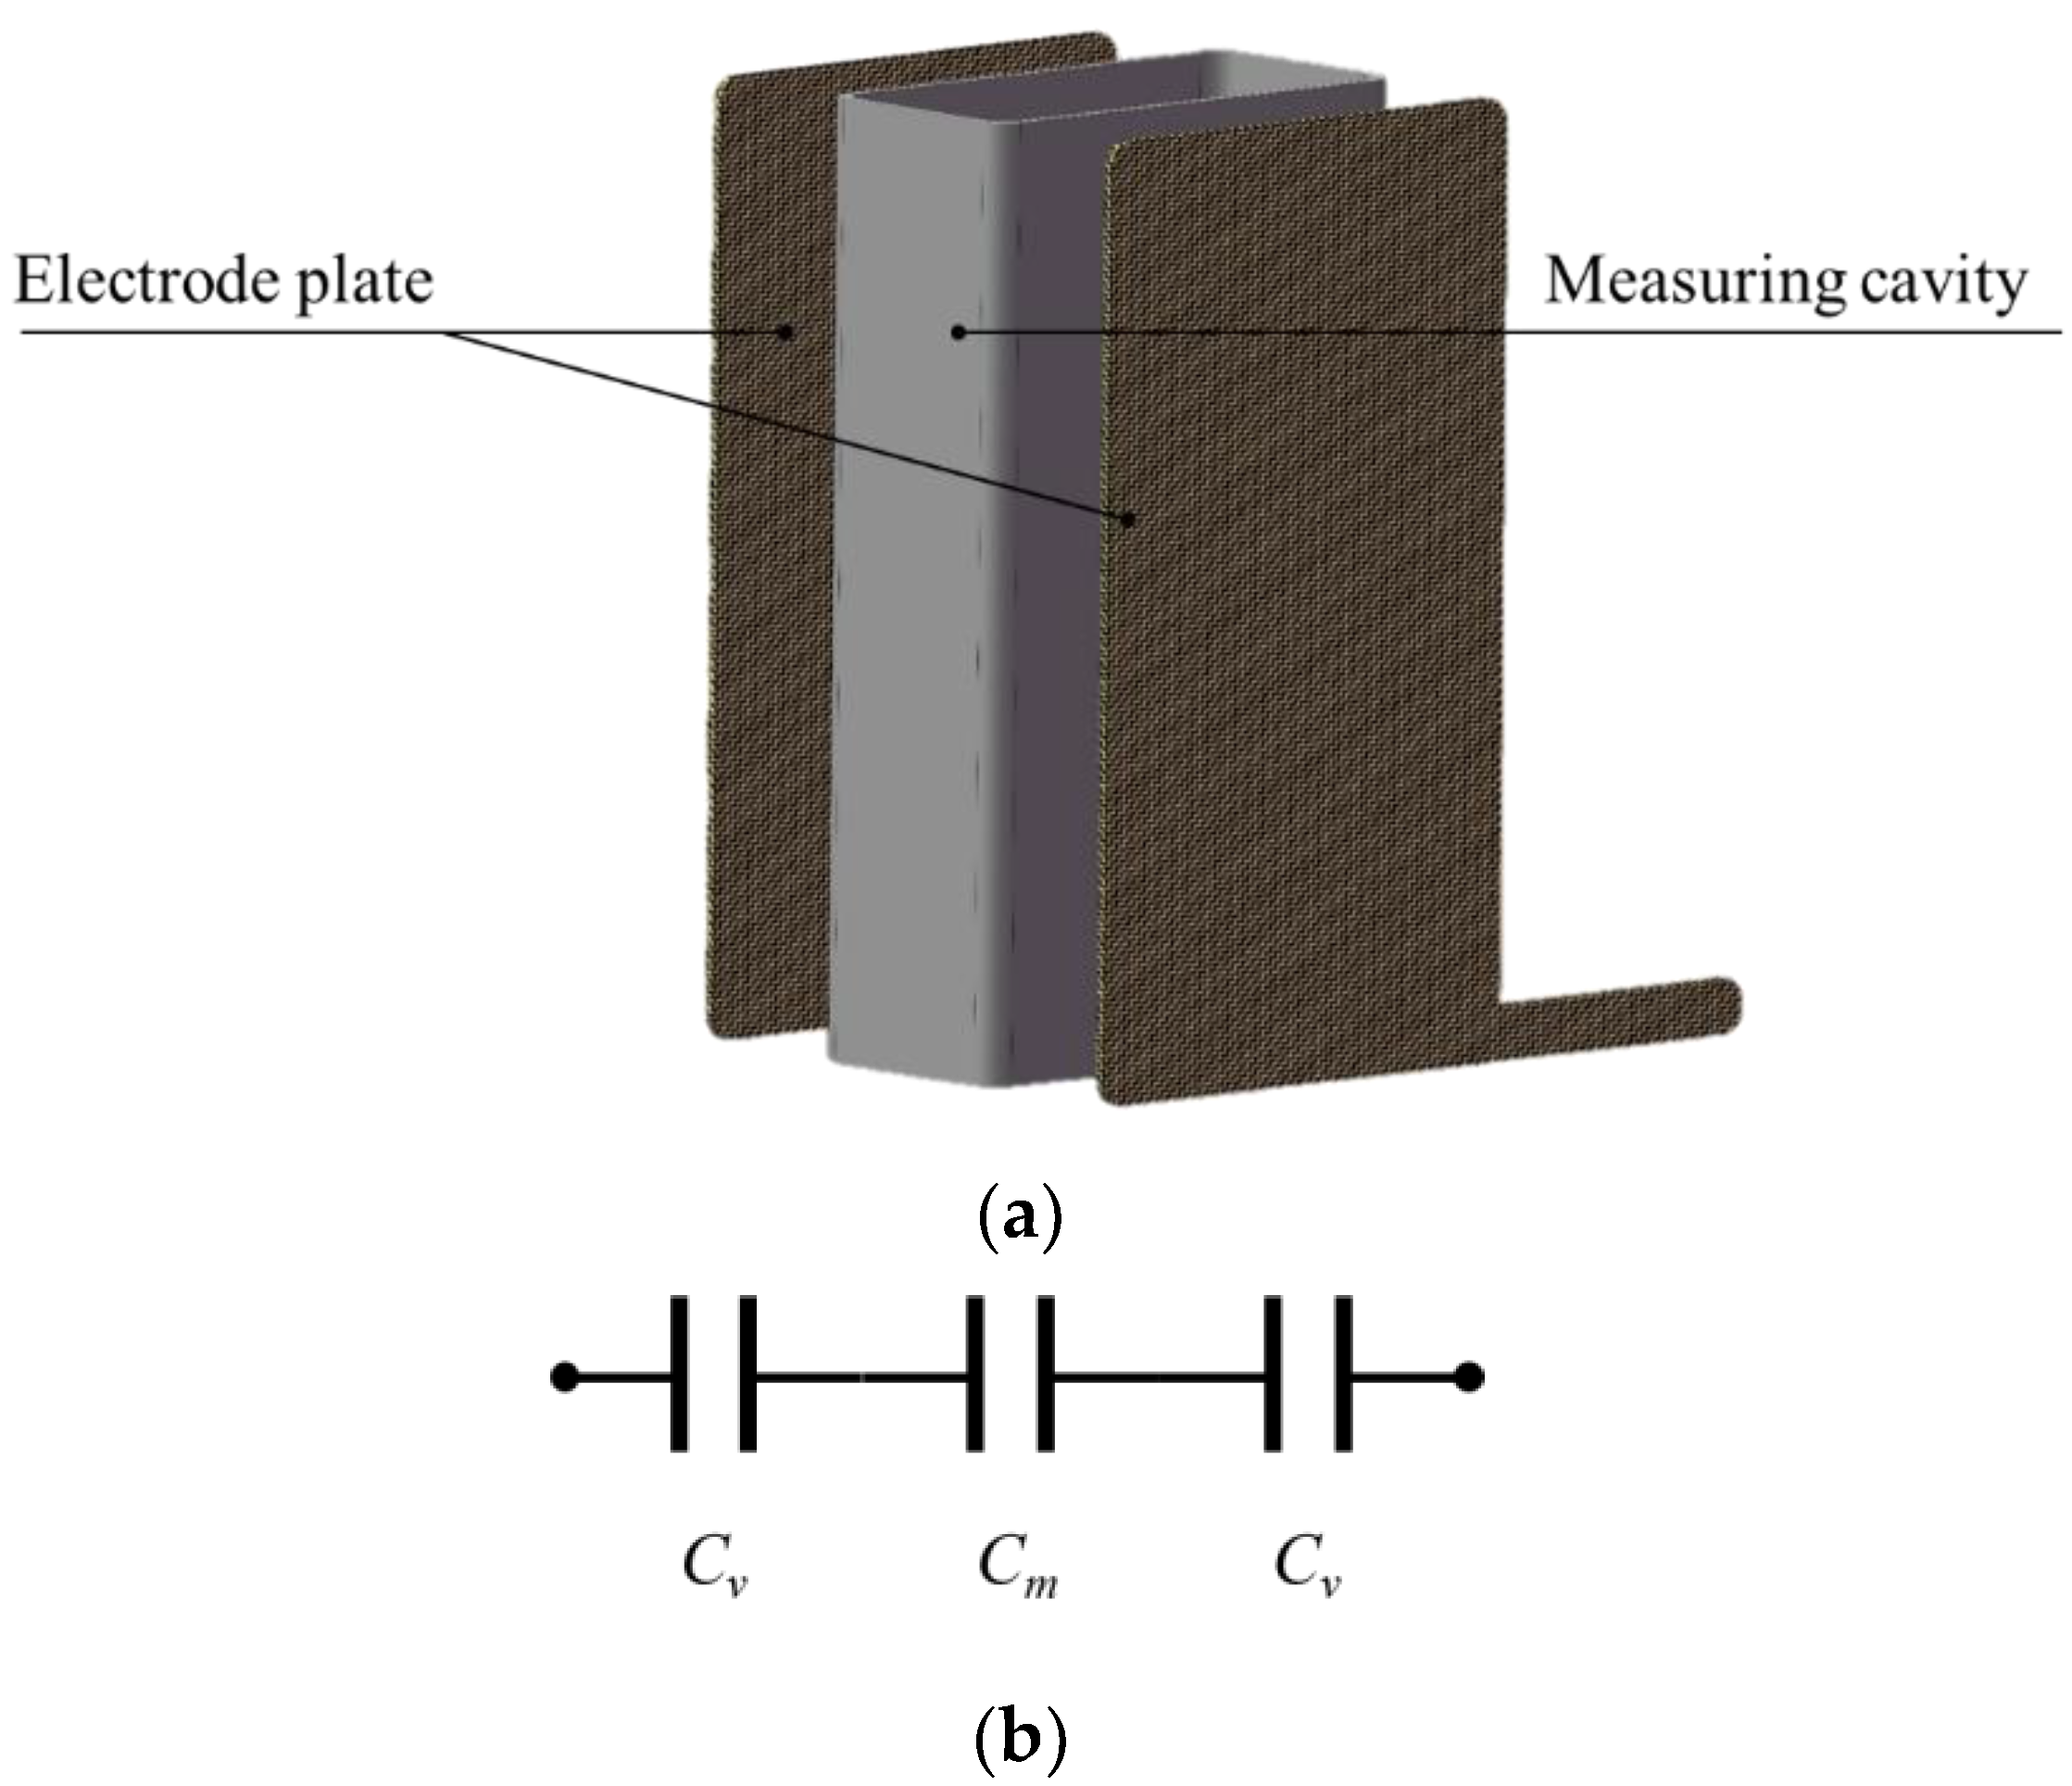
The relatively mature corn online moisture content sensor is generally a parallel plate capacitor designed based on the dielectric properties of materials, and its structure is modeled in Figure 1a. The measuring cavity is composed of insulating material, the metal plate placed on the outer wall of the cavity is an electrode plate, and the cavity is filled with corn to be measured. The structure shown in Figure 1a is equivalent to a series capacitance model when the edge effect of the capacitance sensor is ignored, as shown in Figure 1b.
When the corn reaches the state to be measured in the measurement cavity, the output capacitance (C) of sensor is:
C = S ε 0 ε m d ,
where ε0 is the vacuum dielectric constant, which is 8.85 pF/m [22]; εm is the relative dielectric constant of the corn; d is the distance between the two parallel plates; and S is the area of plate. The medium between two plates included dry matter, water, and air. The total volume (V) and the total relative dielectric constant (εm) of above three can be expressed, respectively, as:
V = V 1 + V 2 + V 3 ,
ε m = V 1 V ε 1 + V 2 V ε 2 + V 3 V ε 3 ,
where V1, V2, and V3 are the volume of dry matter, water, and air, respectively; ε1, ε2, and ε3 the relative dielectric constant of these three, respectively. Substituting Equation (3) into Equation (1), the Equation (4) can be obtained:
C = S ε 0 d ( V 1 V ε 1 + V 2 V ε 2 + V 3 V ε 3 )
The porosity of the filling layer in the measurement cavity is calculated using Equation (5):
p = V 3 V
The moisture content of corn feeding into the measurement cavity is calculated as:
M d = ρ 2 V 2 ρ 1 V 2 ,
where Md is the moisture content, dry basis, and ρ1 and ρ2 are the density of water and dry matter, respectively.
Defining K1, and K2 as follows, and substituting Equations (5) and (6) into Equation (4), the Equation (9) can be obtained:
K 1 = ρ 1 ρ 2 ,
K 2 = V ρ 1 G ,
C = ε 1 + K 1 M d ε 2 1 + K 1 M d + ( 1 + M d ) K 2 p + ε ε 3 ,
where G is the total mass of corn filled into the measurement cavity, which generally changed little and can be regarded as a constant value under the constraint of the determined installation position of the level sensor. According to Equation (9), the output capacitance of sensor is mainly related to Md, p, ε1, ε2, ε3, ρ1, ρ2, V, and G. Among the above parameters, V, ρ2, and G were the determined constants; ρ1 is a function depending on Md [22]; and ε1, ε2, and ε3 are also related to temperature T. Therefore, the feedback capacitance value of the sensor in practical application is a function depending on Md, p, and t. However, the porosity in Equation (9), which is not only affected by the air volume among grains but also by the air volume inside grains [23], is one of the important factors affecting the dielectric properties of materials, especially in online moisture content measurement devices installed to monitor the extremely complex process of industrial corn drying.

2.1.2. Mathematical Modeling

Based on the series capacitance calculation method, Equations (10) and (11) were obtained for calculating the corn capacitance and the capacitance of the cavity outer wall, respectively:
C m = ε 0 ε m S y m ,
C c = ε 0 ε c S y c ,
where Cm and Cc are the capacitance of the corn and outer wall, respectively; εm and εc are the dielectric constant of the corn and outer wall, respectively; and ym and yc are the thickness of corn and outer wall, respectively. Therefore, the total capacitance to be measured is the sum of the series capacitance, which can be calculated using Equation (12):
C t o t = ε 0 ε m ε c S 2 ε m y c + ε c y m ,
where Ctot is the total capacitance value of the series capacitance to be measured.
Equation (12) shows that the measured capacitance is only related to the relative dielectric constant, which corresponds to the moisture content one-by-one under the determined electric field frequency, corn porosity, and temperature. Thus, Equation (13) can be obtained:
C t o t = f ( M ) ,
where M is the moisture content of the corn to be measured, in wet basis. Equation (14) can be obtained by differentiating Equation (13):
d C t o t d M = ε 0 ε c 2 S y m ( 2 ε m y c + ε c y m ) 2 d ε m d M
A relationship exists between the resolution of the capacitance measurement circuit and the resolution of the moisture sensor, as shown in Equation (15):
R c R m = d C d ε m d ε m d M = d C d M ,
where RC and Rm are the resolution of the capacitance measurement circuit and moisture sensor, respectively. Assuming the change rate of the corn dielectric constant with moisture content was K, the full-range resolution of the moisture sensor, as shown in Equation (16), can be obtained from Equation (14):
R m = R c K ( 2 ε m y c + ε c y m ) 2 ε 0 ε c 2 S y m
From Equation (16), when the corn dielectric constant changes little with the moisture content, the resolution of moisture sensor decreases with decreasing moisture content. Therefore, in the process of designing a sensor, it is necessary to ensure that the measurement near the safe moisture content meets the minimum resolution requirements.
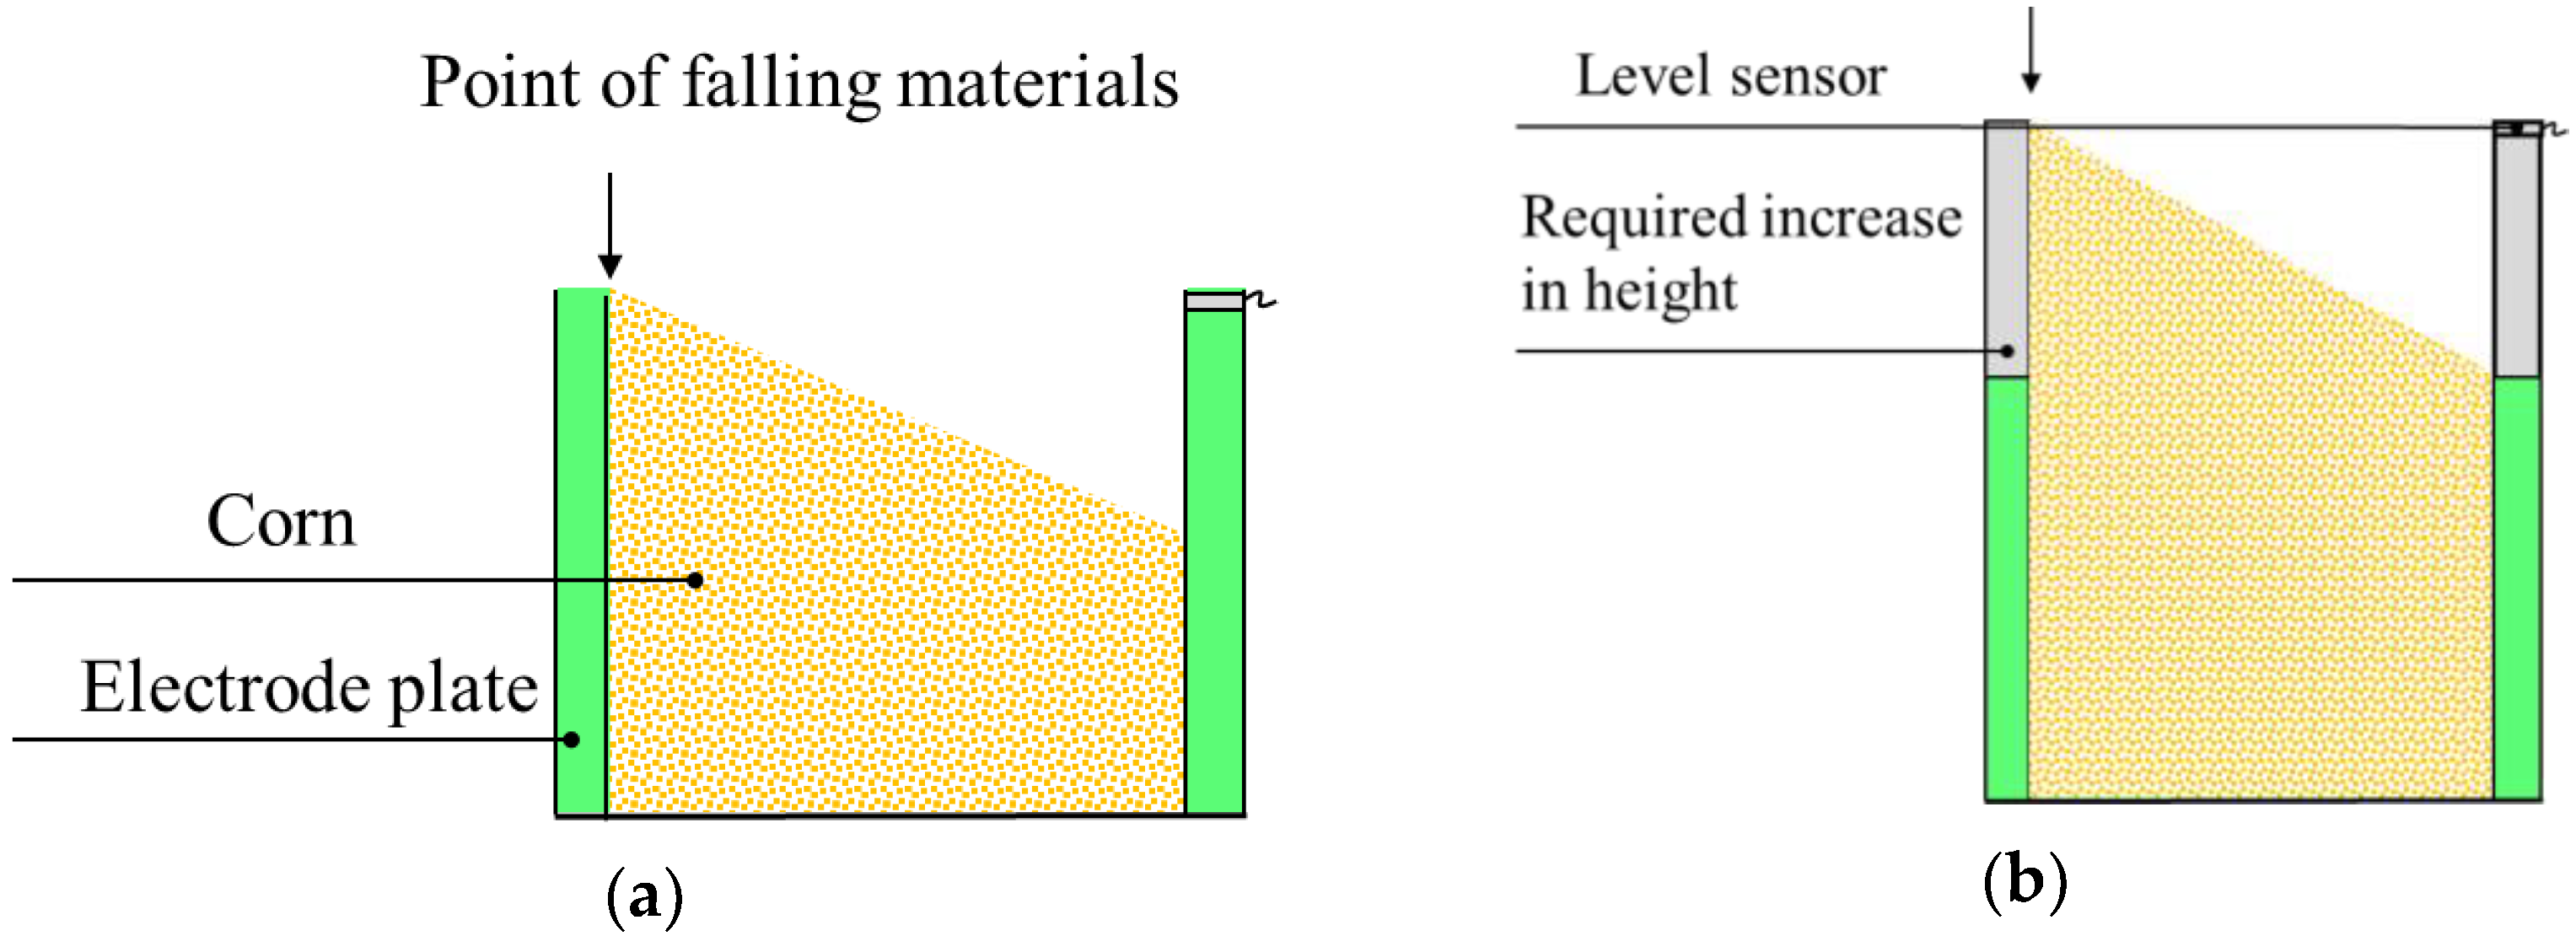
On the other side, due to the internal friction of corn, the corn gradually forms a cone in the process of flowing into measurement cavity. Thus, the chamber will not be filled with corn with an unreasonable sensor structure design, as shown in Figure 2a.
However, the level sensor still judges that the chamber is full of corn at this time, which causes measurement error. Increasing the height of the cavity can cover the measurement area with corn. When the grain filling method is determined, grain with same moisture content has the same repose angle. Therefore, when the material’s falling point is at the top of measurement cavity, as shown in Figure 2b, the required increase in height has the largest value, which should satisfy Equation (17):
Δ z Δ z max = x m 2 + y m 2 tan ( α max ) ,
where ∆z is the required increase in height, xm is the width of parallel plate, and α is the repose angle. Based on the mathematical relationship, when xm is equal to ym, the minimum value of ∆z is obtained, and the structure of the designed sensor is the most compact. Thus, the height and the required increase in height of cavity can be calculated using Equations (18) and (19), respectively:
z m = V 2 y m 3 tan ( α max ) y 2 ,
Δ z = 2 y m tan ( α max )
To summarize, the constraint conditions of the moisture sensor’s structural parameters are as follows:
{ ε 0 ( ε m ) max ε c S 2 ( ε m ) max y c + ε c y m ε 0 ( ε m ) min ε c S 2 ( ε m ) min y c + ε c y m < C d y ε 0 ( ε m ) max ε c S 2 ( ε m ) max y c + ε c y m < C max ε 0 ( ε m ) min ε c S 2 ( ε m ) min y c + ε c y m > C min R m R c K ( 2 ε m y c + ε c y m ) 2 ε 0 ε c 2 S y m min ( x m , y m , z m ) > L y v > δ x m = y m z m = V 2 y m 3 tan ( α max ) y 2 ,
where Cdy is the measurable dynamic capacitance range of the measurement circuit, [Cmax, Cmax] is the measurable statistic capacitance range, L is the corn bridge size, and δ is the minimum safe thickness of the measurement cavity.

2.2. Experiments

Three experiments needed to be conducted, including one lab experiment and two field experiments. The purpose of field experiment was to calibrate the moisture content calculation equation (without considering the porosity distributions), and then observe the influence of filling layer porosity on the measurement accuracy. The purpose of lab experiment was to calibrate the calculation equation of moisture content considering the porosity distributions. Finally, the accuracy of the calibrated model was verified by field experiment.

2.2.1. Sample Preparation

The fresh corn used in this study was a native variety named Changcheng 799#, which was obtained from Zhencheng Farm in Xinzhou Shanxi Province, China. The average initial moisture content was 27.9% w.b. measured using an air convection oven (Model DHG070B, Shanghai Anting Scientific Instrument Factory, Shanghai, China) according to the standard oven method [13]. The impurities and broken grains of corn to be dried were filtered through a filter screen and an air separator before entering the dryer, and the impurity content was less than 1%. The fresh corn was dried to achieve the different target moisture content necessary for the lab experiment [23].

2.2.2. Experimental Apparatus and Method

The capacitance sensor used in this study was a parallel plate capacitor manufactured according to the design example in Section 2.1, and the capacitance was measured by the designed measurement circuit board. The calibration experiment of the field experiment was also conducted at Zhencheng Farm. The target moisture content of corn drying was 14.5% w.b. The online moisture measurement device equipped with the capacitance sensor was installed between the grain discharge bucket and the elevator bucket of 5HP-50 double tower dryer, as shown in Figure 3. The corn was let out of the dryer through the grain discharge bucket, and flowed into the measurement device by free falling. After the measurement, the corn was discharged from the bottom into the elevator bucket to recover the material. The corn in each position of the drying bed was collected in a discharge bucket, which represented the average discharging grain state. The samples collected here reflected the overall drying process. A few corns were sampled manually at grain outlet of the online moisture content measurement device every 30 min. The corn temperature was measured using an infrared thermometer (Model: MT4 MAX, −30 °C to 350 °C, accuracy 0.1 °C, Fluke Testing Instruments (Shanghai) Co., Ltd., Shanghai, China).
In the lab experiment, the porosity of the experimental sample was measured using a self-developed porosimeter, as shown in Figure 4. The relevant indicators of the porosimeter are provided in the paper by Li et al. [26]. The capacitor was placed into the measuring chamber of the porosimeter to measure the porosity of the capacitor without corn filling. Then, the capacitor was filled with the corn sample using a free-falling style at a certain height. The corn porosity was changed by applying different pressures to the upper surface of the capacitor. The excess sample was scraped off with a scraper to ensure constant volume filling. Finally, the porosity of the sample was calculated using Equation (21):
p = p t + p 0 V c V 0 V c 1 ,
where p is the porosity of corn sample, p0 is the porosity of the capacitor without material filling, pt is the porosity of the capacitor material filling, Vc was the chamber volume of the porosimeter, and V0 is the volume of the capacitor.

3. Results and Discussion

3.1. Sensor Design

A high-precision and high-reliability capacitance digital conversion chip AD7793 (Analog Devices, Inc., Norwood, MA, USA) featuring a 32 kHZ working excitation frequency, a measurable dynamic capacitance range of −4 to 4 pF, and a minimum resolution of 0.004 pF was adopted as the core of the circuit [27]. The maximum measurable capacitance can be expanded by configuring the offset capacitance (for example, when the offset capacitance is 17 pF, the measurable range is 13 to 21 pF and the maximum measurable capacitance is 21 pF). In addition, the change in the equation of the dielectric constant with corn moisture content can be obtained by fitting the experimental data of the corn dielectric constant with moisture content at a 32 kHZ frequency according to Song et al. [28]:
ε m = 3.467 M 44.582 ( R 2 = 0.989 )
In this study, the proposed sensor had a measurement range of 0% to35% w.b. and a resolution of 0.1% w.b. To shorten the feeding and discharging period to ensure rapid measurement, a small amount of corn sample (about 600 g) should be filled. Thus, according to the calculation function of corn bulk density [29], the calculated total volume of the sensor to be designed was 0.0007 m3. Moreover, according to the relative research [22], the corn repose angle is supposed to be 35°. In addition, the cavity was composed of PVC insulating plastic with a dielectric constant of four. Therefore, when the filling corn moisture content was 35% w.b., the distribution nephogram of the sensor capacitance with the thickness of the material and the thickness of the cavity wall was obtained by calculating the above parameters and solving Equation (20), as shown in Figure 5.
Figure 5 shows the sensor capacitance decreased rapidly with the increasing thickness of the corn and increasing thickness of the cavity wall, and the influence of the thickness of the cavity wall on the capacitance is more significant. Therefore, the thickness of the cavity wall is also an important parameter when considering the appropriate plate spacing in the process of designing a parallel plate capacitance sensor. In addition, Cmax is the maximum measurable capacitance isoline, that is, the maximum capacitance value under the constraints of the capacitance measurement circuit described above, and the measurable region is above the curve. Rm is the isoline whose resolution is less than 0.1% w.b. when the corn moisture content is 10% w.b., and the measurement resolution in the area under the curve met the design requirements. Cdy indicates the capacitance range of isoline, that is, when the size of the sensor on the line is selected, the difference between the maximum capacitance and the minimum capacitance is the maximum measurable dynamic capacitance range of the measurement circuit (8 pF). In addition, considering the requirements regarding mechanical strength and smooth corn flow, the sensor’s minimum plate spacing (L) should be no less than 50 mm, and the minimum thickness of cavity wall (δ) should be no less than 2 mm, as shown in the corresponding mark in Figure 5. Based on the above discussion, the area enclosed by the red dotted line in Figure 5 is the dimension point meeting the design requirements. For the measurement circuit to be full scale at the maximum moisture content, the dimension point should be close to Cdy. In this study, the point pointed by the design value in Figure 5 was selected as the actual sensor size, corresponding to xm = ym = 80 mm, zm = 31 mm, and ∆z = 79 mm. The sensor structure is shown in Figure 6. with this sensor structure and size, the measured capacitance range was 0.17 to 8.17 pF.

3.2. Effect of Porosity on Moisture Content Measurement

A total of 22 sets of experimental data in the calibration experiment were obtained after drying, as shown in Table 1. The data were fitted with the capacitance and temperature of corn measured by the online moisture content measurement device at the same time according to a previous study [14], and Equation (23) was obtained. The results of the variance evaluation are also provided in Table 2. Table 2 shows that, for the obtained model, the sum of squares (SS) was 161.604, the mean square (MS) was 32.318, the statistic F was 40730.27, and the corresponding confidence level P was less than 0.001. Based on the above data, the mathematical model established had strong significance. Thus, this equation can be used as a standard algorithm for online corn moisture content measurement.
M C = 0.3453 C 2 + 0.01908 T g + 0.1295 T g × C 3.08 C 1.386 T g + 38.25
where C is the capacitance, MC is the moisture content, in wet basis, Tg is the paddy temperature.
At room temperature (25 °C), the measured capacitance of the corn samples with a moisture content of 14.7%, 18.2%, 21.5%, 24.3%, and 26.4% w.b. at different porosities were substituted into Equation (23). The corn was filled into the online measurement device, and the calculated value and measured moisture content were recorded separately. The calculated moisture content was compared to the actual measured moisture content, and the calculated moisture content deviation is shown in Figure 7.
Figure 7 shows that the porosity change in the cavity, caused by different extrusion pressures, will significantly interfere with the moisture content measurement. For corn with the same moisture content, the measurement absolute error was larger when the extrusion force was larger. For example, when corn with 21.5% w.b. moisture content was filled into the cavity through free falling (porosity was 42.5%), the measured value of moisture content was 21.4% w.b. and the absolute error was 0.1%. When this moisture content was fed back to the dryer controller as data, it was acceptable in the industrial grain drying process. The absolute error was 0.4% when slight extrusion was applied (porosity was 41.27%). When the extrusion force was applied continuously, the measurement deviation increased gradually. For example, the measurement deviation was 0.9% with a high degree of extrusion (porosity is 39.5%). This moisture content used as data feedback to the controller might lead to overshoot of the controller and other negative phenomena, thus affecting the grain quality after drying. The measurement accuracy of corn with high moisture content was considerably affected by changes in porosity. For example, the measurement absolute error range of corn with 26.4% w.b. moisture content was 0.6% to 1.4%, which is much higher than the measurement absolute error of corn with 14.7% w.b. moisture content (0.1% to 0.6%).
In the actual drying process, corn with the same moisture content often shows different porosities under the high dust conditions, fluctuations in flow state, changes in the impurity rate, changes in the filling way, and other interferences. When the same batch of grain with uniform texture is filled into the test cavity, the inner gap of the material pile with low porosity is relatively tight. According to Lichtenecker’s dielectric constant calculation function [30], in the same mixed material system, the dielectric properties of materials were also different when the volume ratio of each component was different. Under normal pressure, the permittivity of air is approximately equal to one, whereas that of corn is greater than one. Therefore, for gas–solid two-phase systems, such as corn pile, the pile with lower porosity corresponds to a larger dielectric constant, producing a higher capacitance value, so the measurement error might be larger. In addition, increasing the moisture content leads to a decrease in the internal space of a single grain, and to a gradual increase in the internal friction coefficient on the grain surface and the viscosity force among grains [31], resulting in the adhesion and the agglomeration among grains, which is generally manifested as a decrease in the porosity of the grain pile, thus affecting the measurement accuracy. From the above analysis, we concluded that the changes in the pore distribution of the test cavity caused by the changes in the drying environment and the material properties significantly affected the online moisture content measurement during the drying process. To reveal the change law and to propose a solution to reduce the measurement error, the porosity, which is a basic physical parameter of agricultural materials, can be unified and quantified to establish the characteristic function to reveal the capacitance characteristics of the filling layer to identify the path to optimizing online moisture content measurement technology in the industrial grain drying process.

3.3. Calculation Function

Relevant studies showed that temperature has a significant effect on the dielectric properties of grain. Therefore, it was necessary to analyze the interaction effects of process variation on the measured capacitance of the sensor to fully determine the variation law of capacitance in the filling layer and obtain the calculation function in the process of online moisture content measurement by capacitance method. Table 3 shows the measured corn capacitance under different moisture content, temperature and porosity by the measurement device developed in this study. Analysis of variation was used to determine the effect of process variables on the response and to fit second-order polynomial models to the experimental data. After multiple regression fitting of the experimental data, the ternary quadratic mathematical equation describing the corn capacitance and moisture content, temperature, and porosity was established, as shown in Equation (24), in which P was the porosity. The correlation coefficient (R2) of the fitting function was 0.999, which indicated that the predictions were in close agreement with the measured values.
C = 10.25 + 0.4409 M C + 0.14336 T g 0.668 P + 0.001019 M C × T g + 0.005868 M C × T g 0.003144 T g × P + 0.001911 M C 2 + 0.001046 T g 2 + 0.00895 P 2
The results of variance analysis of Equation (24) are shown in Table 4. The moisture content, temperature, porosity, and their interactions all significantly influenced capacitance, among which moisture content had an extremely significant influence. The F–value of the model was 49.57; however, the p–value was less than 0.0001, which proved that model was significant and the experimental results were not random. Both Adj–R2 and Pre–R2 were 0.998. These consistent results further demonstrate the effectiveness of model. Therefore, the fitting mathematical model can be used to predict corn moisture content in the drying process.
In order to verify the accuracy and rationality of Equation (24), parameters, such as moisture content, temperature, and porosity were randomly set as the conditions of the validation experiments, which are listed in Table 5. The moisture contents of paddy were 15.2%, 20.6%, and 25.4% w.b., respectively. The calculated capacitance obtained by subbing moisture content, temperature, and porosity into Equation (24) was taken as the predicted value, and the measured capacitance obtained by the developed instrument was taken as the measured value for error analysis. Table 5 shows the results of the validation. Compared with the measured values of capacitance, the relative difference between the model predictions and the measured values was in the range of 3.42% to 8.11%, and the average relative difference was 5.83%. The results of the validation experiments demonstrated that the capacitance predicted by measurement device and the function of capacitance was in good agreement with the measured value, and the feasibility of predicting function of corn capacitance was thus validated.

3.4. Validation Experiment

To verify the reliability of the mathematical model of moisture content prediction, the model was written into the microcontroller of the online moisture content measurement device. The moisture content value of corn during drying was predicted online, and the predicted value was compared to the measured value. The verification experiment of online moisture content measurement was also conducted at Zhencheng Farm. The moisture content measurement device continuously collected corn temperature and capacitance values during the drying process, and Equation (23) was used to calculate the online moisture content value without porosity compensation. The sensor full of corn was removed every 30 min and placed into the porosimeter to measure the porosity of the corn, and Equation (24) was used to calculate the moisture content value after porosity compensation. A few corns were sampled at the outlet of the grain hopper of dryer, and the moisture content of the samples was determined by the standard oven method [13]. The calculated results were compared to the online measurement results of moisture content online device simultaneously. The experimental results are shown in Figure 8.
As shown in Figure 8, the online moisture content measurement value is in good agreement with the offline measurement value as a whole, and the dynamic change trend in the moisture content and porosity with drying time is consistent. In the early stage of drying, the fluctuations in the online and offline measurement values were both relatively large. When the moisture content was greater than 22.45% w.b., the absolute error of measured moisture content was between −2.4% and 1.2%. The moisture content of corn decreased gradually with the drying process, and the absolute error of moisture content measurement also decreased gradually. When the moisture content was below 17.43% w.b., the measured moisture content value without porosity compensation was basically consistent with the value after porosity compensation, with a deviation of −0.4–0.6%. In the whole drying process, the online moisture content value without porosity compensation fluctuated widely, with an absolute error of −2.4% to 0.6% and an average absolute error of 0.79%. After porosity compensation, the fluctuation in the online moisture content value significantly reduced. The absolute error of moisture content measurement was −0.62% to 0.67%, and the average of absolute values of error was 0.32%, which is more accurate than the device (absolute error of ±0.4%) developed by Mai et al. [14]. Therefore, by introducing the quantitative porosity parameter, the variation law of the capacitance in the filling layer can be more comprehensively revealed. The online measurement accuracy of moisture content in the drying process was also significantly improved, especially for grain with high moisture content, which is crucial for the data feedback for closed–loop and optimal control in the initial stage of the drying process.

4. Conclusions

The key findings of this study can be summarized as follows:
(1)
The optimal size of the sensor was obtained by modeling. The length and width of the measurement area were both 80 mm, the height of sensor was 31 mm, and the optimized height was 79 mm;
(2)
The absolute error of online corn moisture content measurement increased with increasing corn porosity in the filling layer. Moreover, the measurement accuracy of corn with high moisture content was more susceptible to the change in porosity, and the maximum measurement error reached 1.4%;
(3)
The mathematical equation for moisture content calculation was obtained, and the statistical analysis results and the validation experiment showed that the equation had good agreement with actual measurements and reliability;
(4)
The field corn drying experimental results showed that after porosity compensation, the fluctuation of moisture content was significantly reduced. The absolute error of the measured value was –0.62% to 0.67%, and the average of absolute values of error was 0.32%.

Author Contributions

Data curation, C.L. (Chengjie Li) and B.L.; Writing—original draft, C.L. (Changyou Li); funding acquisition, C.L. (Chengjie Li); investigation, C.L. (Chengjie Li), X.Z. and B.L.; software, M.M.; supervision, C.L. (Changyou Li). All authors have read and agreed to the published version of the manuscript.

Funding

This work is supported by the National Natural Science Foundation of China (№:31671783; №:31371871).

Institutional Review Board Statement

Not applicable.

Informed Consent Statement

Not applicable.

Data Availability Statement

Data are contained within the article.

Acknowledgments

The authors would like to thank the editors and reviewers for their valuable and constructive comments.

Conflicts of Interest

The authors declare that they have no known competing financial interests or personal relationships that could have influenced the work reported in this paper.

Nomenclature

CCapacitance (pF)
SPlate area (m2)
dSpacing (m)
yThickness (m)
VVolume (m3)
MMoisture content (%w.b.)
pPorosity
GGrain mass (kg)
Subscripts
zHeight of capacitor (m)
TTemperature (°C)
Greek symbols
ρDensity (kg·m3)
εDielectric constant
αResponse angle ()
cCavity
mMaterial
dDry basis

References

  1. Zhu, W. Principle and Technology of Food Drying; Science Press: Beijing, China, 2009; pp. 3–9. [Google Scholar]
  2. Pan, Y.; Wang, X.; Liu, X. Modern Drying Technology; Chemical Industry Press: Beijing, China, 2001; pp. 20–24. [Google Scholar]
  3. Lutfy, O.F.; Noor, S.B.M.; Marhaban, M.H.; Abbas, A.K. Non-linear modelling and control of a conveyor-belt grain dryer utilizing neuro-fuzzy systems. Proc. Inst. Mech. Engineers. Part I J. Syst. Control. Eng. 2011, 225, 611–622. [Google Scholar] [CrossRef]
  4. Negnevitsky, M. Artificial Intelligence: A guide to Intelligent Systems; Addison-Wesley Publisher: Boston, MA, USA, 2005. [Google Scholar]
  5. Dai, A.; Zhou, X.; Dang, H.; Sun, M.; Wu, Z. Intelligent Modeling Method for a Combined Radiation-Convection Grain Dryer: A Support Vector Regression Algorithm Based on an Improved Particle Swarm Optimization Algorithm. IEEE Access 2018, 6, 14285–14297. [Google Scholar] [CrossRef]
  6. Huang, H.; Yu, H.; Xu, H.; Ying, Y. Near infrared spectroscopy for on/in-line monitoring of quality in foods and beverages: A review. J. Food Eng. 2008, 87, 303–313. [Google Scholar] [CrossRef]
  7. Amjad, W.; Crichton, S.O.J.; Munir, A.; Hensel, O.; Sturm, B. Hyperspectral imaging for the determination of potato slice moisture content and chromaticity during the convective hot air drying process. J. Biosyst. Eng. 2018, 166, 170–183. [Google Scholar] [CrossRef]
  8. Patel, K.K.; Khan, M.A.; Kar, A. Recent developments in applications of MRI techniques for foods and agricultural produce-an overview. J. Food. Sci. Tech. 2015, 52, 1–25. [Google Scholar] [CrossRef]
  9. Chen, A.; Chen, H.Y.; Chen, C. Use of temperature and humidity sensors to determine moisture content of oolong tea. Sensors 2014, 14, 15593–15609. [Google Scholar] [CrossRef] [Green Version]
  10. Cataldo, A.; Tarricone, L.; Vallone, M.; Cannazza, G.; Cipressa, M. TDR moisture measurements in granular materials: From the siliceous sand test case to the applications for agro-food industrial monitoring. Comput. Stand. Inter. 2010, 3, 86–95. [Google Scholar] [CrossRef]
  11. Lewis, M.A.; Trabelsi, S.; Nelson, S.O.; Tollner, E.W.; Haidekker, M.A. An automated approach to peanut drying with real-time microwave monitoring of inshell kernel moisture content. Appl. Eng. Agric. 2013, 29, 583–593. [Google Scholar] [CrossRef]
  12. Zhang, S.; Zhou, L.; Ling, B.; Wang, S. Dielectric properties of peanut kernels associated with microwave and radio frequency drying. Biosyst. Eng. 2015, 145, 108–117. [Google Scholar] [CrossRef]
  13. Li, C.; Li, B.; Huang, J.; Li, C. Developing an online measurement device based on resistance sensor for measurement of single grain moisture content in drying process. Sensors 2020, 20, 4102. [Google Scholar] [CrossRef]
  14. Mai, Z.; Li, C.; Xu, F.; Fang, Z. Design and test of grain moisture online measuring system based on floating ground capacitance. Trans. Chin. Soc. Agric. Mach. 2014, 45, 207–213. [Google Scholar] [CrossRef]
  15. Wei, S.; Wang, Z.; Wang, F.; Xie, W.; Chen, P.; Yang, D. Simulation and experimental studies of heat and mass transfer in corn kernel during hot air drying. Food Bioprod. Process. 2019, 117, 360–372. [Google Scholar] [CrossRef]
  16. Nelson, S.O. Use of Electrical Properties for Grain-Moisture Measurement. J. Microw. Power 1977, 12, 67–72. [Google Scholar] [CrossRef]
  17. Sacilik, K.; Tarimci, C.; Colak, A. Dielectric properties of flaxseeds as affected by moisture content and bulk density in the radio frequency range. Biosyst. Eng. 2006, 93, 753–760. [Google Scholar] [CrossRef]
  18. Sacilik, K.; Tarimci, C.; Colak, A. Moisture content and bulk density dependence of dielectric properties of safflower seed in the radio frequency range. J. Food Eng. 2006, 78, 7776–7777. [Google Scholar] [CrossRef]
  19. Castro-Giraldez, M.; Botella, P.; Toldra, F.; Fito, P. Low-frequency dielectric spectrum to determine pork meat quality. Innov. Food Sci. Emerg. 2010, 11, 376–386. [Google Scholar] [CrossRef]
  20. Mireei, S.A.M.; Bagheri, R.; Sadeghi, M.; Shahrake, A. Developing an electronic portable device based on dielectric power spectroscopy for non-destructive prediction of date moisture content. Sens. Actuators A. Phys. 2016, 247, 289–297. [Google Scholar] [CrossRef]
  21. Solar, M.; Solar, A. Non-destructive determination of moisture content in hazelnut (corylus avellana L.). Comput. Electron. Agricult. 2016, 121, 320–330. [Google Scholar] [CrossRef]
  22. Zhou, Z. Agricultural Materials Science; Agriculture Press: Beijing, China, 1994. [Google Scholar]
  23. Li, T.; Li, C.; Li, C.; Xu, F.; Fang, Z. Porosity of flowing rice layer: Experiments and numerical simulation. Biosyst. Eng. 2019, 179, 1–12. [Google Scholar] [CrossRef]
  24. Mortaza, A.; Soleiman, H.; Mujumdar, A.S. Application of artificial neural networks (ANNs) in drying technology: A comprehensive review. Dry. Tech. 2015, 33, 1397–1462. [Google Scholar]
  25. Wang, J.; Tang, T.; Tang, H.; Xu, C.; Zhou, W.; Wang, Q. Design and experiment of on-line detection device for capacitive paddy rice Moisture content of combine harvester. Trans. Chin. Soc. Agric. Mach. 2021, 52, 207–213. [Google Scholar] [CrossRef]
  26. Li, C.; Fang, Z.; Mai, Z. Design and test on porosimeter for particle material. Trans. Chin. Soc. Agric. Mach. 2014, 45, 200–206. [Google Scholar] [CrossRef]
  27. Analog-Devices. 3-Channel, Low Noise, Low Power, 24-Bit Capacitance Digital Sensor, AD7745/AD7746 Data Sheet; Analog Device: Norwood, MA, USA, 2005. [Google Scholar]
  28. Song, H.; Yan, Y.; Song, Z.; Sun, J.; Li, D.; Li, F. Nondestructive testing model for maize grain moisture content established by screening dielectric parameters and variables. Trans. Chin. Soc. Agric. 2019, 35, 262–272. [Google Scholar] [CrossRef]
  29. Li, C. Analysis of Grain Drying; Science Press: Beijing, China, 2018. [Google Scholar]
  30. Goncharenko, A.V.; Lozovski, V.Z.; Venger, E.F. Lichtenecker’s equation: Applicability and limitations. Opt. Commun. 2000, 174, 1–4, 19–32. [Google Scholar] [CrossRef]
  31. Duran, J. Sands, Powders, and Grains; Springer: New York, NY, USA, 2000. [Google Scholar]
Figure 1. Model of a parallel plate capacitor sensor: (a) the original model and (b) the equivalent model.
Applsci 11 07655 g001
Figure 2. Improvement in moisture sensor: (a) underfilling of corn and (b) scheme for increasing chamber height.
Applsci 11 07655 g002
Figure 3. Installation position of the online moisture content device in the drying process.
Applsci 11 07655 g003
Figure 4. Experimental apparatus for measuring the porosity.
Applsci 11 07655 g004
Figure 5. The distribution nephogram of sensor capacitance under different corn thicknesses and cavity wall thicknesses. Note: the filling corn moisture content was 35% w.b.
Applsci 11 07655 g005
Figure 6. The structure and size of the designed sensor.
Applsci 11 07655 g006
Figure 7. The moisture content deviation under different porosities. Note: LE, ME, and HE represent a low, medium, and high degree of extrusion, respectively.
Applsci 11 07655 g007
Figure 8. Comparison of discharged grain moisture content determined by the online method and the standard method.
Applsci 11 07655 g008
Table 1. Experimental values of response variables for the calibration experiment.
Drying Time (min)Moisture Content (%w.b.)Temperature (°C)Capacitance (pF)Drying Time (min)Moisture Content (%w.b.)Temperature (°C)Capacitance (pF)
022.4221.24.3133018.3928.22.68
3021.8421.64.0936018.3328.82.66
6020.8922.43.6739017.4329.22.26
9023.5822.74.742017.6429.42.36
12022.5623.54.3345016.8129.91.98
15023.2223.74.5648016.0430.11.61
18022.4524.54.2951016.1830.41.68
21019.8524.93.3154016.5131.51.83
24019.226.23.0457015.8531.91.51
27019.9327.53.3260015.6132.31.39
30019.5627.53.1863014.6732.80.89
Table 2. Results of the variance evaluation.
SourceDfSSMSFp
C10.0040.00374.630.047
Tg10.0080.00799.920.006
C210.0230.022628.52<0.001
Tg210.0080.00769.620.007
C·Tg10.0080.008510.660.005
Model5161.59132.31840,730.27<0.001
Error160.013<0.001
Total21161.604
R20.99
Adj-R20.99
Pre-R20.98
Table 3. Obtained capacitance of corn samples in different moisture contents, temperatures, and porosities.
Moisture Content (%w.b.)Porosity (%)Temperature (°C)
512.52027.535
14.738.40.931.351.892.543.32
41.50.71.051.512.12.8
44.60.640.921.311.822.45
17.638.41.642.072.633.34.1
41.51.361.732.212.813.53
44.61.261.551.962.493.14
20.5538.42.633.093.674.375.19
41.52.292.683.193.824.56
44.62.122.442.883.434.1
23.538.43.53.994.595.316.16
41.53.113.534.064.715.48
44.62.893.323.694.274.97
26.438.44.384.895.516.267.12
41.53.944.374.935.66.39
44.63.664.034.515.115.83
Table 4. Variance evaluation of linear, quadratic, and interaction terms for the response and coefficient of the prediction models.
SourceDfSSMSF–Valuep–Value
MC1170.91918.99107637.55<0.001
T10.6020.6022242.20<0.001
P10.5510.5510221.59<0.001
MC·T10.1040.103741.72<0.001
MC·P10.1510.150560.55<0.001
T·P10.2840.2841114.25<0.001
MC210.5340.5344214.90<0.001
T210.0560.055922.48<0.001
P210.7260.7263292.09<0.001
Model90.1230.123349.57<0.001
Error650.1620.0025
Total74171.080
R20.999
Adj-R20.998
Pre-R20.998
Table 5. Results of validation experiments.
No.Moisture Content (%w.b.)Temperature (°C)Porosity (%)Predicted Capacitance (pF)Measured Capacitance (pF)Relative Error (%)
115.2538.81.031.09 5.5
215.22043.11.521.64 7.31
320.63043.23.824.16 8.11
425.41542.14.034.19 3.79
525.42542.14.955.31 6.86
620.61039.12.832.93 3.42
Publisher’s Note: MDPI stays neutral with regard to jurisdictional claims in published maps and institutional affiliations.

