1. Introduction
Over the last decade, several research studies have evaluated the use of microalgae as a source of nutrients and bioactive compounds. This is due to a growing interest in the development of new foods that provide health benefits and that meet basic energy and nutritional requirements [
1,
2]. It is preferred that functional foods have a natural origin, such as from plants, algae and/or microalgae. In this sense, proteins obtained from microalgae have been used to replace proteins of animal origin in meat-like preparations such as turkey burgers [
3] or in the fortification of vegan foods such as kefir produced from soy and almond based beverages [
4].
Microalgae are becoming increasingly relevant, especially for their composition, since they are a source of high-added-value compounds [
5], such as carotenoids, chlorophylls, and other pigments (antioxidants) [
6], and polyunsaturated fatty acids [
7,
8].
Conventional extraction of antioxidant bioactive compounds from microalgae is often carried out using solvents and using dry biomass [
9]. However, this conventional extraction method is very slow, involves the extraction of unwanted compounds, and can promote the degradation of some thermolabile compounds. Therefore, there is a need for innovative approaches such as pulsed electric fields (PEF) that affect the quality of the extracted compounds to a lesser extent and can be applied in a continuous flow to obtain higher extraction efficiency rates, minimize the use of solvents, and thus be a more efficient and sustainable extraction alternative [
10,
11].
In recent years, several studies have applied PEF technology on microalgae for extraction purposes [
12,
13,
14,
15]. This non-thermal technique consists of applying high-voltage electrical pulses between two electrodes in the treatment chamber [
16]. Short electric pulses (1–100 μs) at field intensities of 0.1–1 kV cm
−1 are employed for reversible permeabilization in plant cells for stress induction, at 0.5–3 kV cm
−1 for irreversible permeabilization of plant and animal tissues, and at 15–40 kV cm
−1 for irreversible permeabilization of microbial cells.
The external electric field increases the transmembrane potential and promotes membrane pore formation of the biological cell. High-intensity electric pulses can be generated by the switched discharge of a suitable capacitor bank. The properties of the discharge circuit determine the shape of the time-dependent potential at the treatment chamber. Parallel plate electrodes or colinear type treatment chambers constitute the most commonly used circuits [
17]. The PEF technique can be effectively applied in many food processing applications such as microorganism/enzyme inactivation, recovery of bioactive compounds, drying and freezing processes, and to promote the enhancement of some selected properties of food macromolecules and some chemical reactions [
16]. It has several advantages compared to conventional techniques as it favours the extraction of bioactive compounds by generating reversible or irreversible micropores in the plasma membrane of the cells, promoting the migration of interesting compounds into the cytoplasm through the membrane with high selectivity/purity, no thermal effect, and short extraction times [
18]. The efficiency of PEF to permeabilize cell membranes differs according to process parameters such as electric field strength, treatment time, specific energy, pulse shape, pulse width, frequency, temperature, the properties of the treated food sample such as its pH and conductivity, and the characteristics of the target cells [
19].
An example of its usefulness is observed in the extraction of lipids from microalgae. In this regard, a first PEF-assisted extraction of water-soluble bioactive compounds that cross the membrane through the formed micropores can be performed and then a second extraction with ethanol (EtOH) can be applied to obtain lipids or lipid-soluble metabolites that have remained inside the cell, which provides advantages in subsequent purification processing [
20]. The use of PEF is possible in aqueous solutions with a low dry matter content, facilitating the more energy-efficient isolation of high-added-value compounds extracted from microalgae directly from the culture without dehydration or drying [
20,
21].
Most of the studies evaluating the application of PEF focus on the use of aqueous suspensions of microalgae, which mainly allows for the extraction of water-soluble compounds [
22,
23], while the extraction of non-polar pigments (e.g., chlorophylls and carotenoids) is very low under these conditions due to their low solubility in water [
24]. Some previous studies have evaluated the use of complementary extractions with EtOH (96%), obtaining higher yields in the extraction of pigments from microalgae pre-treated with PEF [
25]. Studies combining the use of PEF in suspensions of microalgae
(Nannochloropsis) in water and the subsequent addition of an organic solvent to improve pigment extraction efficiency have been also carried out [
12,
13].
PEF-assisted extraction yields of nutritionally valuable compounds (lipids, pigments, and proteins) can vary depending on the microalgae used [
26]. Therefore, specific studies are needed to evaluate the extraction in different microalgae species at different times and with different solvents to obtain the necessary information and thus be able to scale up the process to an industrial level in an efficient, sustainable way and with a high extraction yield.
Several studies are currently evaluating PEF-assisted extraction from microalgae biomass such as Chlorella and
Nannochloropsis [
12,
22,
25,
27]. However, there is a lack of data on the impact of PEF on the extraction of high-added-value compounds from other microalgae species such as spirulina (
Arthrospira platensis). Spirulina is an undifferentiated filamentous cyanobacterium [
28,
29] whose cells are 3–12 µm wide and can reach 16 µm [
30]; it has been used as food for centuries by various cultures as it has a biochemical profile rich in bioactive molecules and there are studies that support its benefits for human health [
31].
However, considering the gap that exists regarding different extraction levels of antioxidant compounds according to the different microalgae species, the main aim of this study was to evaluate how PEF pre-treatment combined with the binary mixtures of ethanol (EtOH)/H2O, 50:50, v/v and dimethyl sulfoxide (DMSO)/H2O, 50:50, v/v at different extraction times can affect to the recovery of antioxidant bioactive compounds from spirulina.
2. Materials and Methods
2.1. Sample
The spirulina, in noodle form, was produced by the company Ecospirulina (Serra, Comunitat Valenciana, Spain). The cultured biomass comes from the species Artrospira platensis (more recently Limnospira platensis), strain paracas 15016. The Paracas reference refers to the lake from which it originated, Lake Paracas, south of Lima, Peru.
In Ecospirulina, cultivation is carried out in ponds in a greenhouse under natural sunlight and without the use of artificial light. Shading is applied to partially cover the culture ponds, which allows pigment production to be controlled. During the production of the sample used in this trial, the average temperature during the day was 32 °C, while the average temperature during the night was 24 °C. The pH of the culture varied between 9.8 and 10.4, being regulated by the addition of CO2 at the time of each harvest.
The biomass was filtered through a drum filter with 30-micron mesh. The culture substrates were returned to the culture pond, while the biomass was vacuum pressed and then converted into noodle form. In this format, it was air-dried at low temperature (40 ± 2 °C) to reduce the degradation of poorly resistant bioactive compounds at higher temperatures.
2.2. Extraction Procedure
Four samples of 2% (
w/
v) aqueous suspensions were made from the spirulina dry matter (DM). For this, 198 mL of deionised water were added to 4 g of dry biomass. In two of four samples, the same volume (198 mL) of EtOH or DMSO was subsequently added to finish with a 1% suspension (
Figure 1). These two mixtures only received a conventional shaking treatment under stirring. The other 2% suspensions in water were treated with PEF before mixing with the organic solvents. As can be observed in
Figure 1, the extracts were obtained from the 1% suspensions at different times and centrifuged to obtain the supernatant to be analysed. A total of 24 extracts were obtained, 12 of which were obtained by conventional extraction and the other 12 by PEF-assisted extraction.
2.2.1. Pulsed Electric Fields (PEF) Extraction
For the PEF pre-treatment of the spirulina 2% (
w/
v) solution was used with the PEF-Cellcrack III equipment (German Institute for Food Technology (DIL)) (ELEA, Germany). A treatment chamber of 900 mL capacity was used, the distance between the electrodes was fixed at 10 cm, and the total mass added to the treatment chamber was 202 g (198 g of water + 4 g of microalgae). A 100 kJ/kg treatment was applied with an electric field of 3 kV/cm according to a previous work [
24]. Before and after the treatment, the temperature and conductivity of each sample was measured with a portable conductivity meter, ProfiLine Cond 3310 (WTW, Xylem Analytics, Weilheim in Oberbayern, Germany). The minimum electric field strength needed to produce changes in the cells is 1 kV/cm, and it has been shown that with a pulse duration of milliseconds, an electric field of 3–4 kV/cm is sufficient to create electroporation [
14,
32].
2.2.2. Solvent Extractions
First, conventional extraction (Control) was performed on one set of samples. The solvents dimethyl sulfoxide (DMSO) or ethanol (EtOH) (1:1, v/v) in deionised water were added up to a final volume of 400 mL to the dry spirulina samples for nutrient extraction. Once the solvents were added, the samples were shaken at 400 rpm for 5, 15, 30, 60, 60, 120, or 180 min at room temperature to test the effect of shaking time on the extraction of compounds from the processed biomasses. Subsequently, the samples were centrifuged for 10 min at 4000 rpm using a 5810R centrifuge (Eppendorf Ibérica, Madrid, Spain). The extract obtained was kept at −20 °C for further analysis.
Next, the remaining samples were pre-treated with PEF under the conditions described above, and then an extraction process was carried out following the same methodology used for the conventional method.
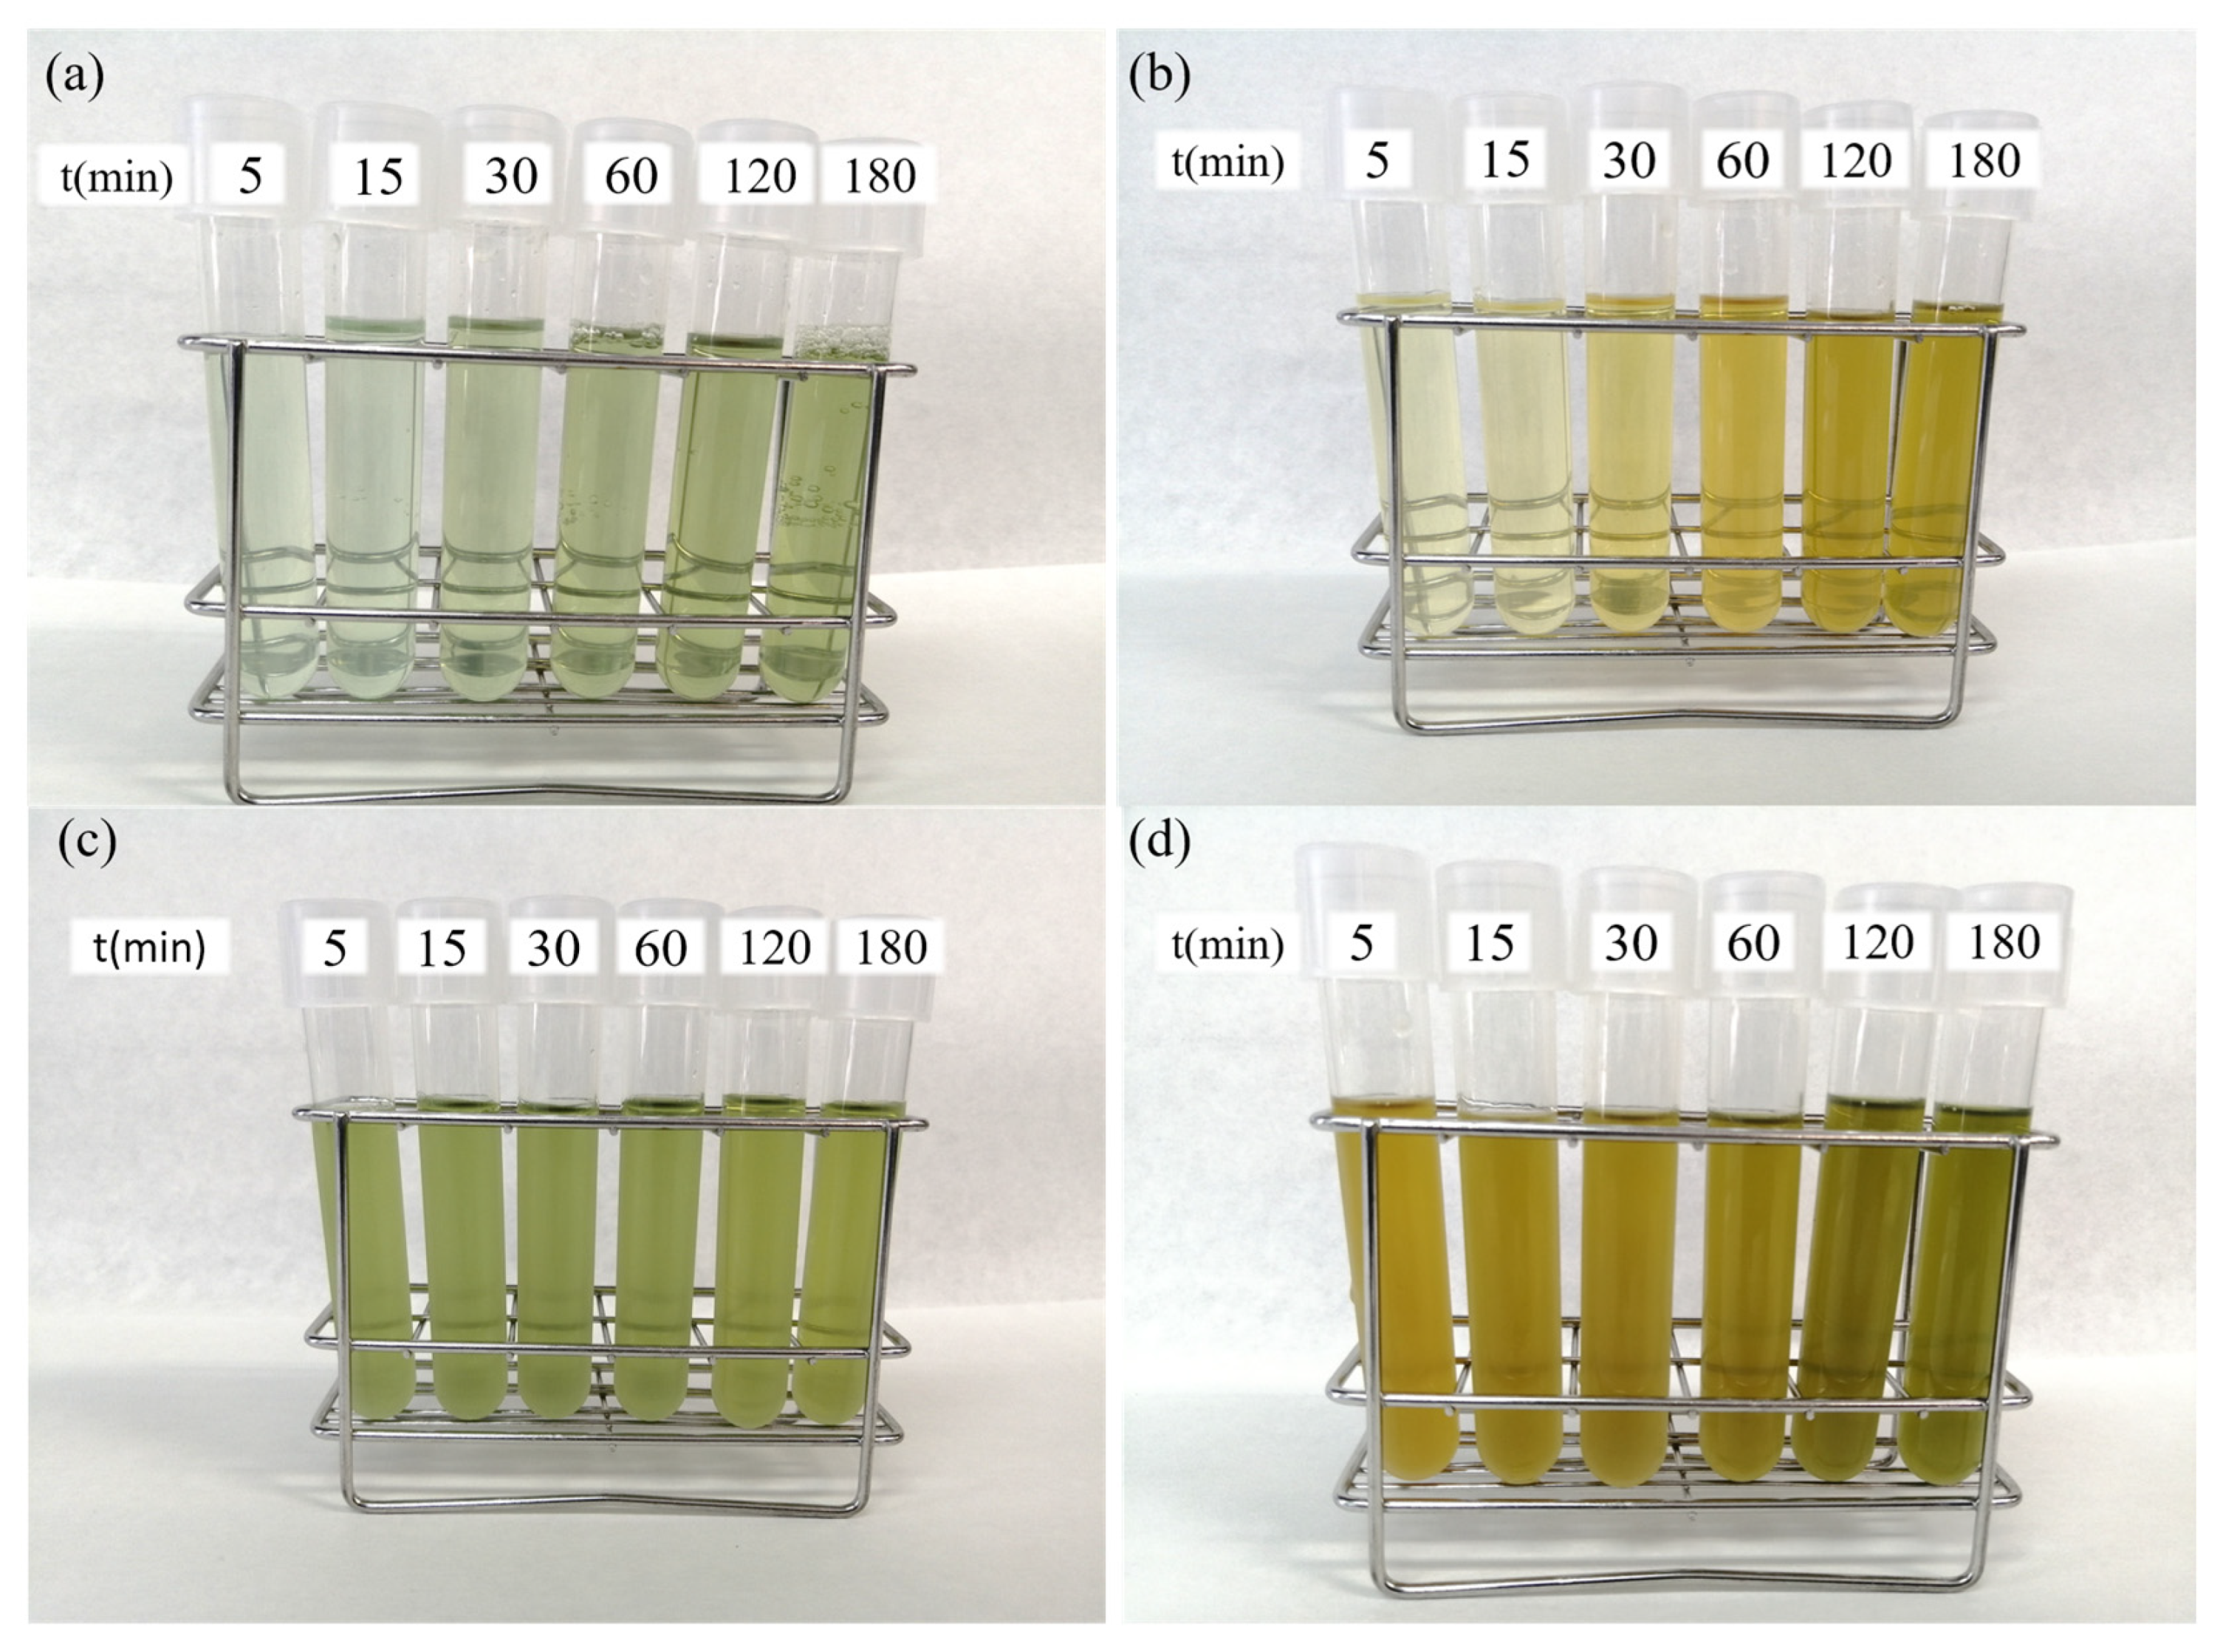
Figure 2 shows the extracts obtained after an extraction using (a) DMSO/H
2O or (b) EtOH/H
2O at different extraction times (5–180 min) and the extracts obtained after pre-treatment with PEF using (c) DMSO/H
2O and (d) EtOH/H
2O.
2.3. Chemical Analysis
2.3.1. Total Phenolic Compounds (TPC)
For the determination of total phenolic compounds (TPC) (mg gallic acid equivalents (GAE)/g DM), the Folin–Ciocalteu method was used, using the procedure described by Parniakov et al. [
12]. This technique is based on the property of phenols to react against oxidising agents. The Folin–Ciocalteu reagent contains molybdate and sodium tungstate, which react with the phenolic compounds present in the medium to form phosphomolybdic and phosphotungstic complexes. In a basic medium, electron transfer reduces these complexes to tungsten oxide (W
8O
23) and molybdenum oxide (Mo
8O
23), which are chromogens with an intense blue colour, proportional to the concentration of phenolic groups present in the sample. Gallic acid (Sigma-Aldrich, Steinheim, Germany) was used as a standard. First, Folin–Ciocalteu reagent at 50%
v/
v, 2% Na
2CO
3, and diluted gallic acid standards were prepared. To carry out the analysis, 3 mL of Na
2CO
3 was added to a test tube, then 100 μL of standard or sample extract was added, and finally 100 μL of Folin–Ciocalteu reagent was added to this mixture. The samples were incubated for 60 min at room temperature under darkness. Finally, the samples were measured at 750 nm wavelength using a Perkin-Elmer UV/Vis Lambda 2 spectrophotometer (Perkin-Elmer, Jügesheim, Germany). All analyses were performed in triplicate.
2.3.2. Trolox Equivalent Antioxidant Capacity (TEAC)
To determine the total antioxidant capacity (TAC), the Trolox equivalent antioxidant capacity (TEAC) assay was used. The TEAC value (micromolar Trolox equivalents, µM TE) measures the antioxidant capacity of a substance, compared to the standard, Trolox (Sigma-Aldrich, Steinheim, Germany). The TEAC value was measured using the method described by Safafar et al. [
33] based on the discolouration of the ABTS radical.
The radical cation ABTS•+ (chromophore) was produced by reacting a 7 mM ABTS stock solution with 440 µL of an oxidant such as 140 mM potassium persulphate (K2S2O8). The mixture was kept in the dark at room temperature for 16 h before use. The solution was then diluted with 96% EtOH until its absorbance at 734 nm was 0.70 ± 0.02 at 30 °C.
Once the initial absorbance was reached, 2 mL of ABTS•+ was mixed with 100 μL of extract and the sample was measured after 3 min. The reaction produced a discolouration due to neutralisation of the radical cation of ABTS•+, which depended on the concentration of antioxidants in the sample. The absorbance was measured at a wavelength 734 nm in a Perkin-Elmer UV/Vis Lambda 2 spectrophotometer (Perkin-Elmer, Jügesheim, Germany). All analyses were performed in triplicate.
2.3.3. Oxygen Radical Absorbance Capacity (ORAC)
The method used was previously described by Khawli et al. [
34]. This assay measures the oxidative degradation of a fluorescent molecule such as fluorescein (Sigma-Aldrich, St. Louis, MO, USA) after the addition of a free radical generator such as 2,2′-azobis(2-aminodinopropane) dihydrochloride (AAPH). The determination measures the degree of antioxidant protection of the sample with respect to the Trolox standard and is expressed in micromolar Trolox equivalents (µM TE).
The automated ORAC assay was performed on a Wallac 1420 VICTOR 2 plate reader (Perkin-Elmer, Jügesheim, Germany). The measurements were carried out in 96-well plates in which only the inner 60 wells were used. For the determination, a phosphate buffer solution (7.5 mM and pH 7–7.4) was prepared. For this purpose, 22.72 g of Na2HPO4 and 22.16 g of KH2PO4 were weighed and then each dissolved in 200 mL of deionised water. A volume of 61.6 mL of the first solution and 38.9 mL of the second solution were mixed and made up to 1000 mL with deionised water.
The standard (Trolox 100 µM) was prepared each day by adding 12.5 mg of Trolox to 50 mL of the previously prepared phosphate buffer. From this solution, 1 mL was taken and made up to 10 mL with the phosphate buffer to obtain the desired concentration. For fluorescein, 44 mg were weighed and made up to 100 mL with phosphate buffer. The working solution of 78 nM fluorescein was prepared daily. For this, 0.167 mL of the first solution was taken and made up to 25 mL with phosphate buffer.
Finally, the working dilution of the 221 mM AAPH radical was prepared daily by taking 600 mg of AAPH and bringing it up to 10 mL with phosphate buffer. As the ORAC assay is extremely sensitive, the microalgae extracts were adequately diluted prior to analysis to avoid interferences. In this case, the microalgae samples were diluted between 1:100 and 1:200, v/v.
For plate preparation, 50 μL of fluorescein (78 nM) and 50 μL of sample, blank (phosphate buffer), or standard (Trolox, 100 μM) were placed in each well and finally 25 μL of AAPH (221 mM) was added. As measurement variations may occur from well to well due to the low conductivity of polypropylene plates, the plates were pre-warmed at 37 °C for 10 min after the addition of fluorescein and before the addition of AAPH to avoid this problem. The plates were analysed immediately after the addition of AAPH and measurements were taken every 5 min until the relative fluorescence intensity of the standard (Trolox) was less than 5% of the initial reading value. All analyses were performed in triplicate.
2.3.4. Chlorophyll a, Chlorophyll b, and Carotenoids
Chlorophyll a, chlorophyll b, and carotenoids contents were estimated spectrophotometrically according to the study by Parniakov et al. [
35]. They were calculated using the equations of Lichtenthaler and Wellburn [
36] for EtOH and Wellburn [
37] for DMSO. This method is based on the determination of carotenoid and chlorophyll content based on the maximum absorbances of chlorophyll a (C
a), chlorophyll b (C
b), and total carotenoids (C
x+c). Using EtOH as a solvent, the maximum absorbances were found at the wavelengths of 664 nm, 648 nm, and 470 nm for chlorophyll a (C
a), chlorophyll b (C
b) and total carotenoids (C
x+c), respectively. For DMSO, the wavelengths were 665 nm, 649 nm, and 480 nm, respectively. Aliquots of the extracts obtained were diluted and the absorbances (
A) were measured at the wavelengths listed above according to the solvent used. All analyses were performed in triplicate.
2.4. Statistical Analysis
Data were analysed using analysis of variance (ANOVA), where PEF pre-treatment, solvents, and extraction time were the factors and chlorophyll, carotenoids, TPC, TEAC, and ORAC concentrations were the variables. Data were expressed as mean ± standard deviation in all cases. A value of p < 0.05 was considered significant. In addition, the LSD (Least Significant Differences) test was performed to determine the differences between the means of the values obtained. All analyses were performed with STATGRAPHICS Centurion XVI 16.1.03 (Statgraphics Technologies Inc., Princeton, NJ, USA).
3. Results and Discussion
In the present study, the effect of extraction time, the use of polar solvents such as DMSO and EtOH (aprotic and protic, respectively) combined with H2O (50:50, v/v), and the application of a PEF pre-treatment to improve the extraction yield and efficiency of pigments and antioxidant compounds were evaluated.
3.1. Conventional Extraction
3.1.1. Chlorophyll a, Chlorophyll b, and Carotenoids
Figure 3 shows the chlorophyll a, chlorophyll b, and carotenoid content of the extracts obtained after conventional extraction with respect to the extraction time and solvent used. After performing a 2-factor analysis of variance (ANOVA) (time and solvent), it was observed that both extraction time and solvent had a significant effect (
p < 0.05) on the extraction of chlorophyll a, chlorophyll b, and carotenoids, observing a higher extraction of all these compounds with the longer extraction times, and in general, observing higher values of chlorophyll a, chlorophyll b, and carotenoids when an EtOH/H
2O mixture was used compared to that seen with the DMSO/H
2O mixture. Thus, at 180 min, the highest values of chlorophyll a (0.57 ± 0.01 mg/g DM), chlorophyll b (0.55 ± 0.01 mg/g DM), and carotenoids (0.50 ± 0.01 mg/g DM) were obtained after using the EtOH/H
2O mixture, representing an increase of 34%, 54%, and 84.2%, respectively, compared to those obtained with the DMSO/H
2O solvent at equivalent extraction times.
However, it should be noted that this was not verified for all the compounds evaluated. For example, when using the solvent EtOH/H2O, no significant differences were found in the chlorophyll a content after 5 and 15 min of extraction. Moreover, no statistically significant differences in chlorophyll b content were observed after 15 and 30 min of extraction with the solvent DMSO/H2O. When analysing the statistical results between solvents, no differences were found in chlorophyll a extraction after 5 and 15 min of extraction.
These results are in agreement with those obtained by other authors, who observed a higher extraction of chlorophyll a, chlorophyll b, and carotenoids when the EtOH/H
2O mixture was used [
13]. They attributed this effect to a change in the polarity of the medium, which made it easier for the compounds to cross the lipid membrane of the cell, favouring the extraction of the compounds studied.
3.1.2. Total Phenolic Compounds (TPC) and Total Antioxidant Capacity (TAC)
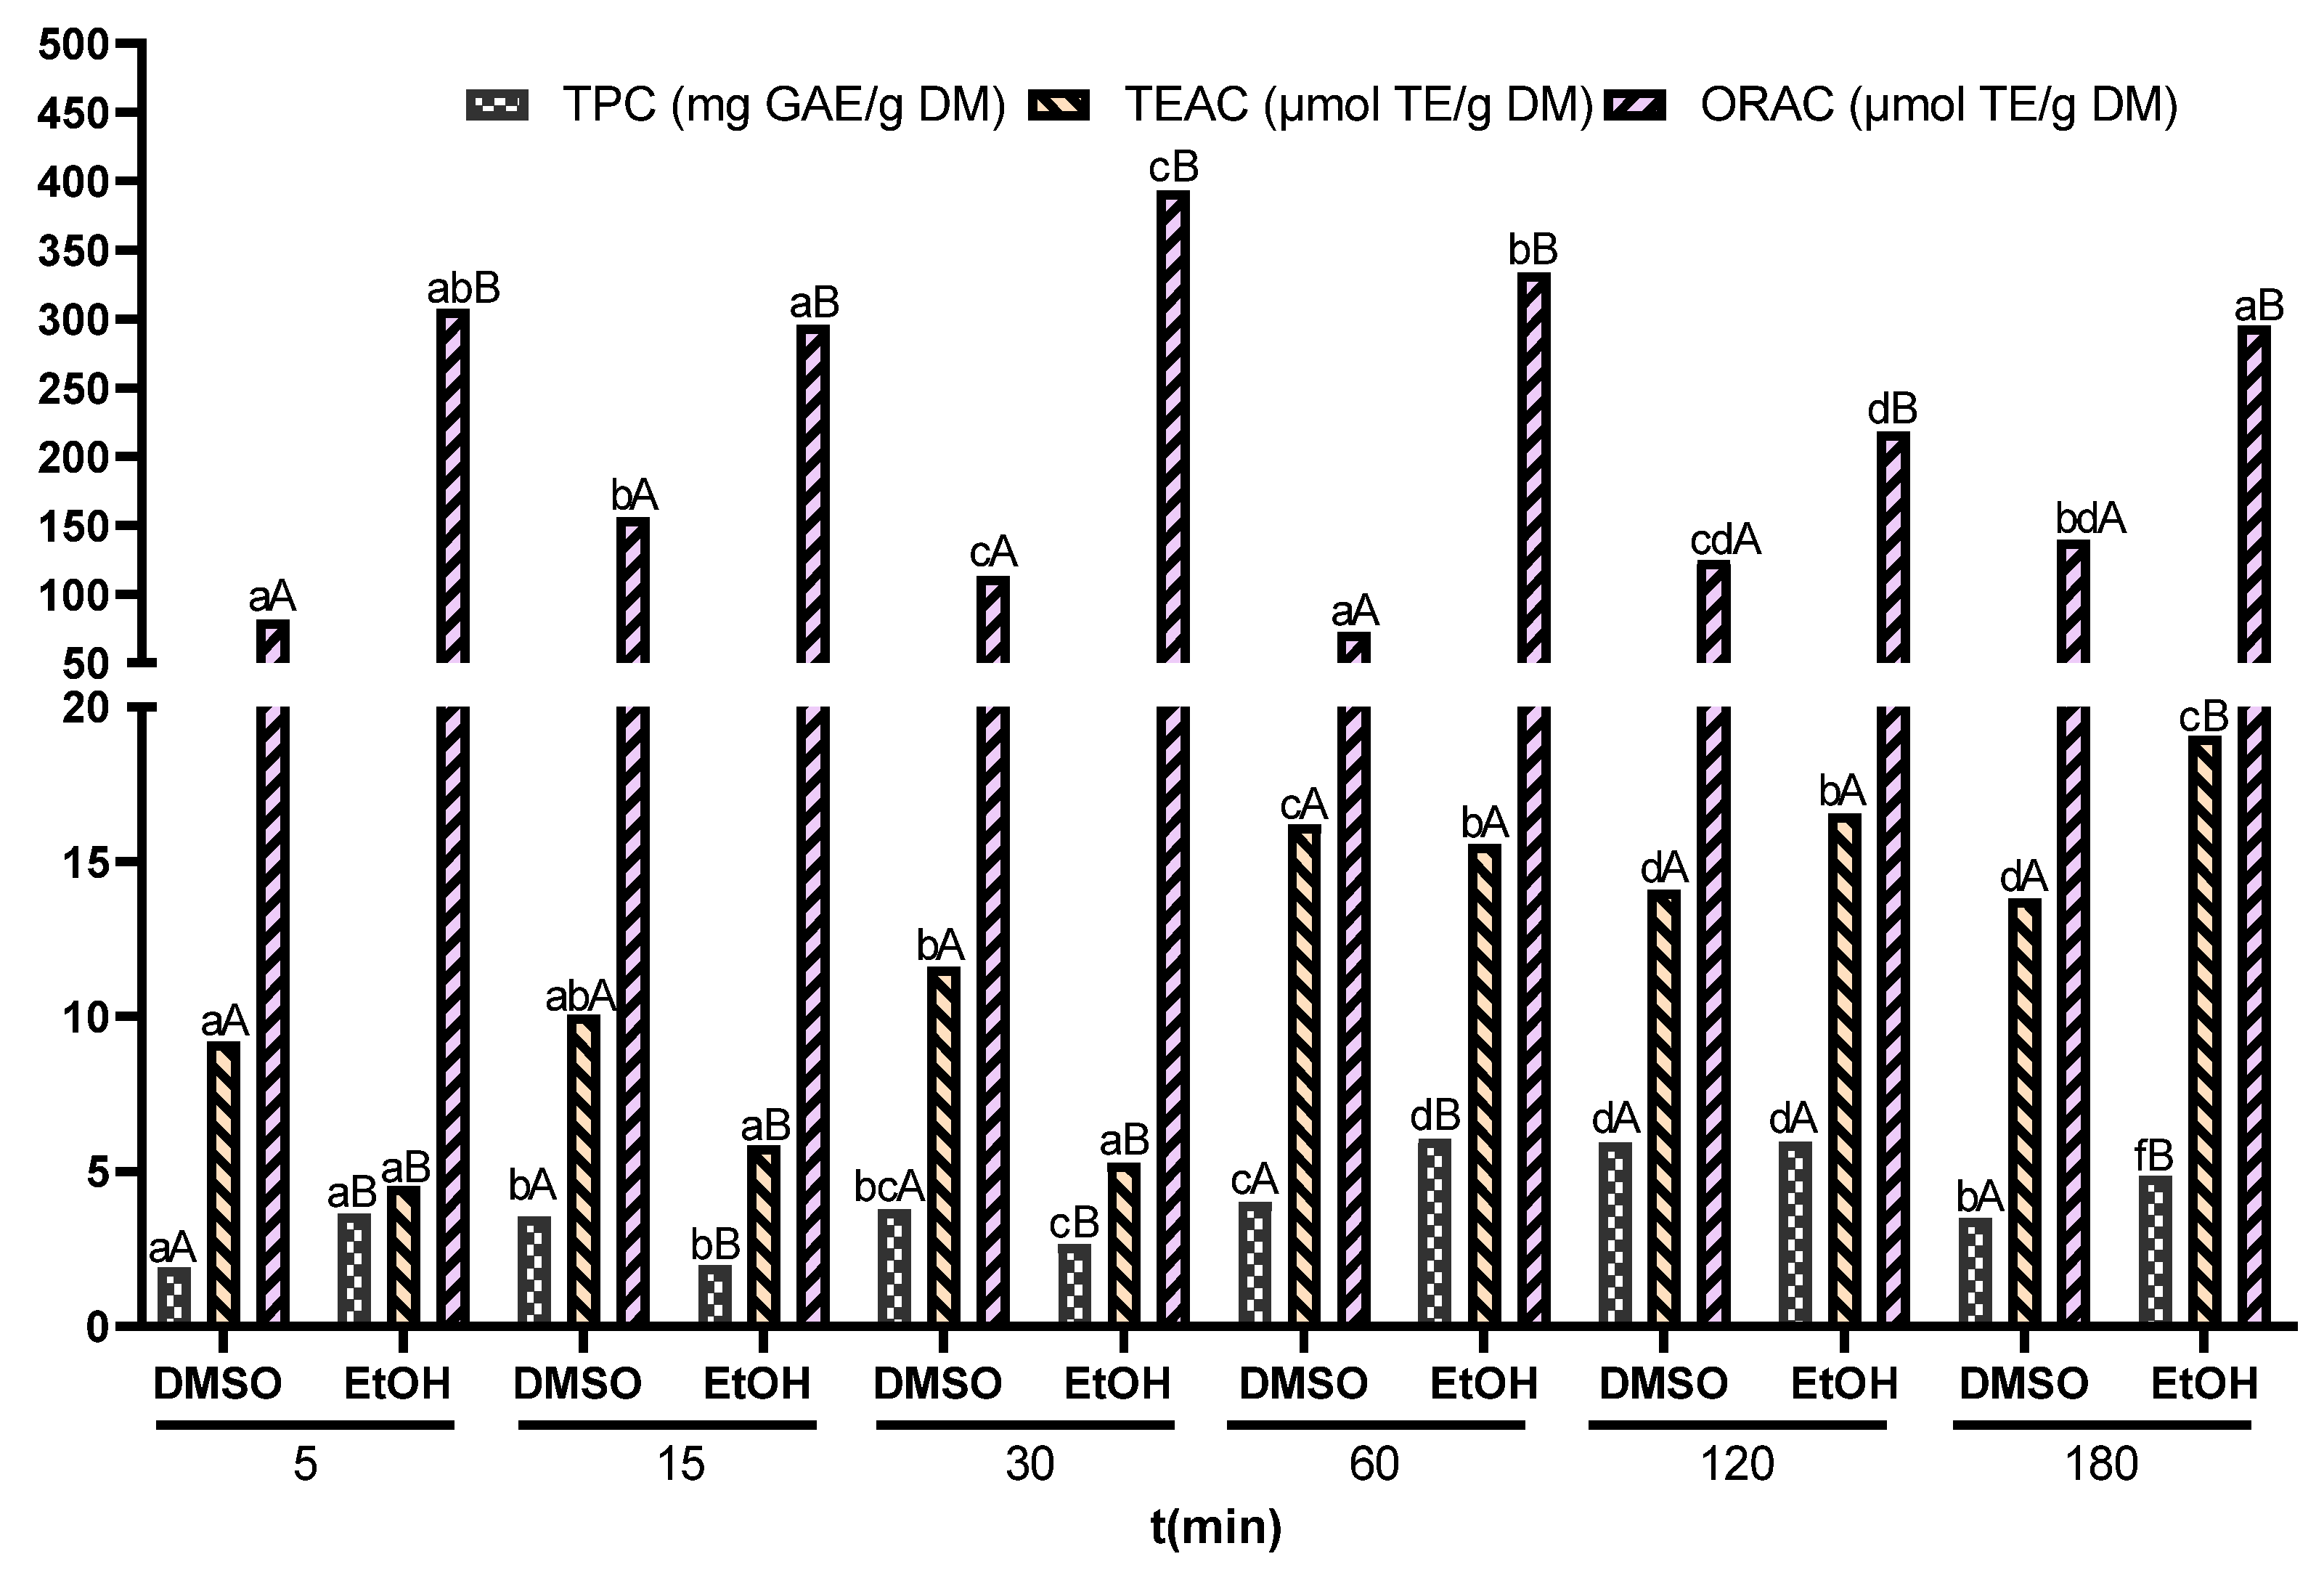
Figure 4 shows the results obtained for total phenolic compounds (TPC) and total antioxidant capacity (TAC) determined by TEAC and ORAC. After performing a 2-factor analysis of variance (ANOVA) (time and solvent), it was observed that both time and solvent had a significant effect (
p < 0.05) on the extraction of phenolic compounds.
ORAC values ranged from 295.87 ± 19.01 to 393.24 ± 15.28 µmol TE/g DM after using EtOH/H
2O and from 72.45 ± 5.95 to 155.95 ± 10.78 µmol TE/g DM when the mixture DMSO/H
2O was used. In addition, a greater effect on the extraction of antioxidant compounds was observed at 30 and 180 min, respectively. On the other hand, the TEAC values ranged from 4.52 ± 0.02 to 19.05 ± 1.25 µmol TE/g DM after using the EtOH/H
2O mixture and from 9.19 ± 0.62 to 16.19 ± 1.37 µmol TE/g DM with the DMSO/H
2O mixture. The maximum value for the TEAC assay (19.05 µmol TE/g DW) was obtained after 180 min extraction and using EtOH 50% as the solvent. The highest ORAC value was also obtained after using EtOH, but after 30 min of extraction (393.24 µmol TE/g DW). Regarding DMSO, the best values for TEAC and ORAC were obtained at 60 min (16.19 µmol TE/g DW) and 15 min (155.95 µmol TE/g DW), respectively. The higher ORAC values are due to other antioxidant compounds not measured in this study, especially fat-soluble compounds such as vitamin E that may have an impact on the antioxidant capacity [
38,
39,
40]. Moreover, ORAC sensitivity for other antioxidant compounds should also be taken into account [
34].
In the determination of total phenolic compounds (TPC), concentrations between 3.64 ± 0.07 and 6.04 ± 0.28 mg GAE/g DM were obtained for the EtOH/H
2O extraction and between 1.91 ± 0.07 and 5.921 ± 0.175 mg GAE/g DM for the DMSO/H
2O extraction and 5.921 ± 0.175 mg GAE/g DM in the extraction with DMSO/H
2O: For both solvents, the highest values were obtained at 120 min, the phenolic content at that time was similar to that obtained by Shanti et al. [
41] for spirulina.
Regarding the mean values of TAC (TEAC + ORAC), it is worth noting that the values obtained with DMSO/H
2O are relatively lower compared to those of the EtOH/H
2O mixture, independent of the extraction time (
Figure 5). This may be due to a lower extraction of chlorophylls, carotenoids, and phenolic compounds, as seen above, suggesting a clear contribution of these compounds to TAC. This same correlation has been previously observed by other authors after evaluating the use of these solvents for the extraction of these compounds from the microalgae
Nannochloropsis [
13].
To evaluate the possible correlations between the different antioxidant compounds (chlorophyll a, chlorophyll b, carotenoids, and total phenolic compounds) and the determination methods used for total antioxidant capacity (TEAC and ORAC), a Pearson’s test was performed for 36 samples (
Table 1). The main correlations were observed between TEAC and carotenoids (R = 0.9094,
p < 0.05), chlorophyll a (R = 0.7986,
p < 0.05), chlorophyll b (R = 0.8419,
p < 0.05), and total phenolic compounds (R = 0.7114,
p < 0.05), obtaining moderate to high positive correlation coefficients. These results are in agreement with those of other authors [
42,
43] who evaluated the existing correlations between the different antioxidant compounds and the methods used for the joint evaluation of the total antioxidant capacity.
It should be noted that there was no correlation between antioxidant compounds (chlorophyll a and chlorophyll b) and ORAC. This is because the ORAC method is a more sensitive technique and some authors consider it better than TEAC [
44] when measuring total antioxidant compounds, as ORAC measures the antioxidant capacity of compounds other than phenolics. A significant correlation was observed, but with a low correlation coefficient between ORAC and carotenoids (R = 0.3586,
p < 0.05).
3.2. Pulsed Electric Fields (PEF)-Assisted Extraction
3.2.1. Ethanol/Water
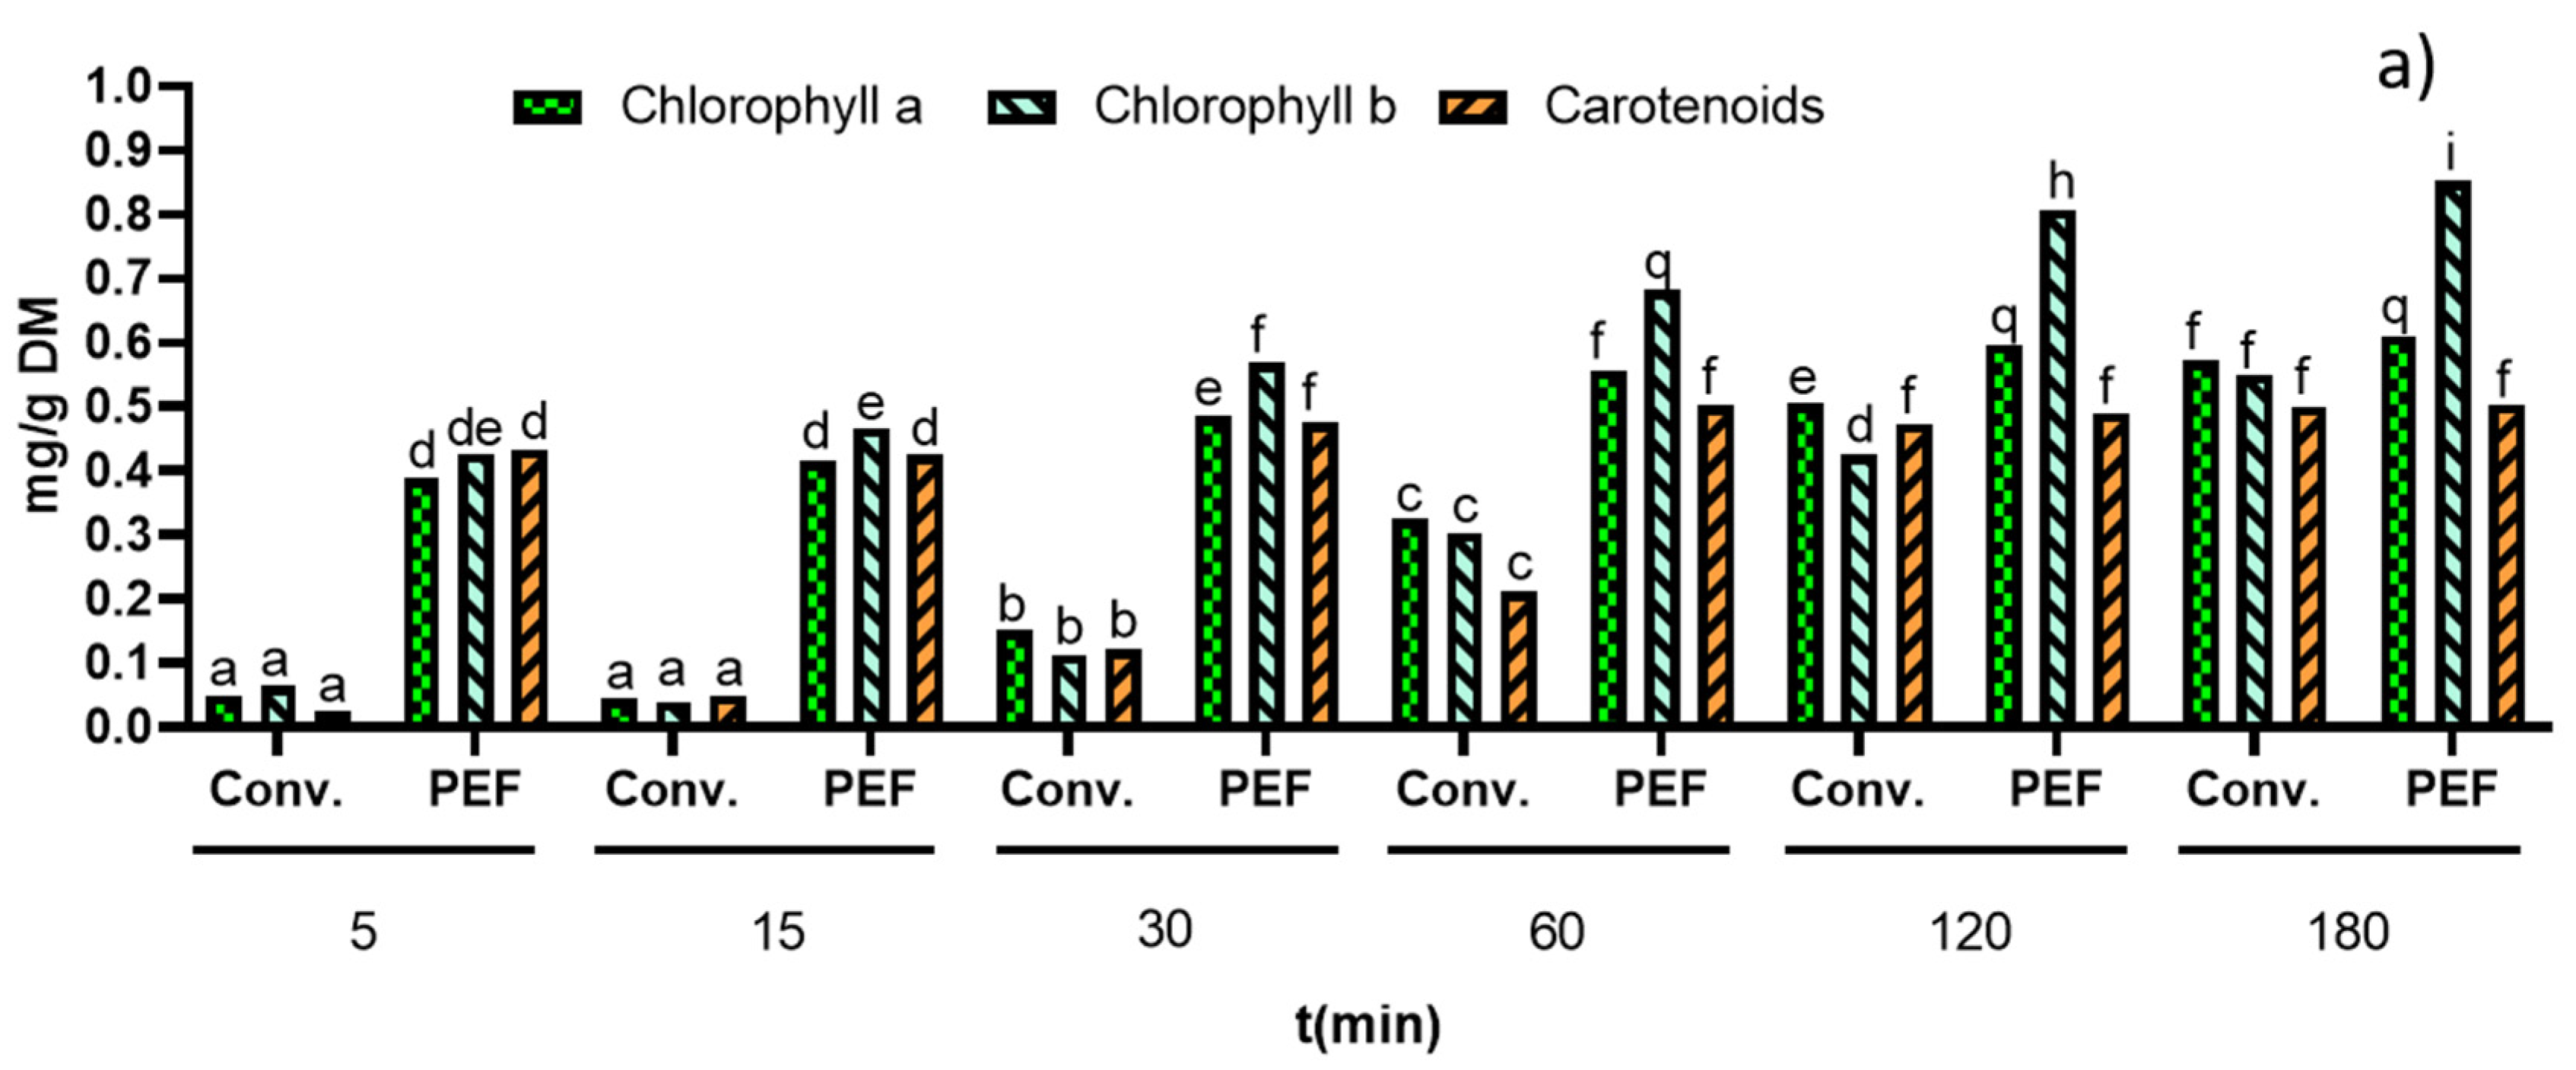
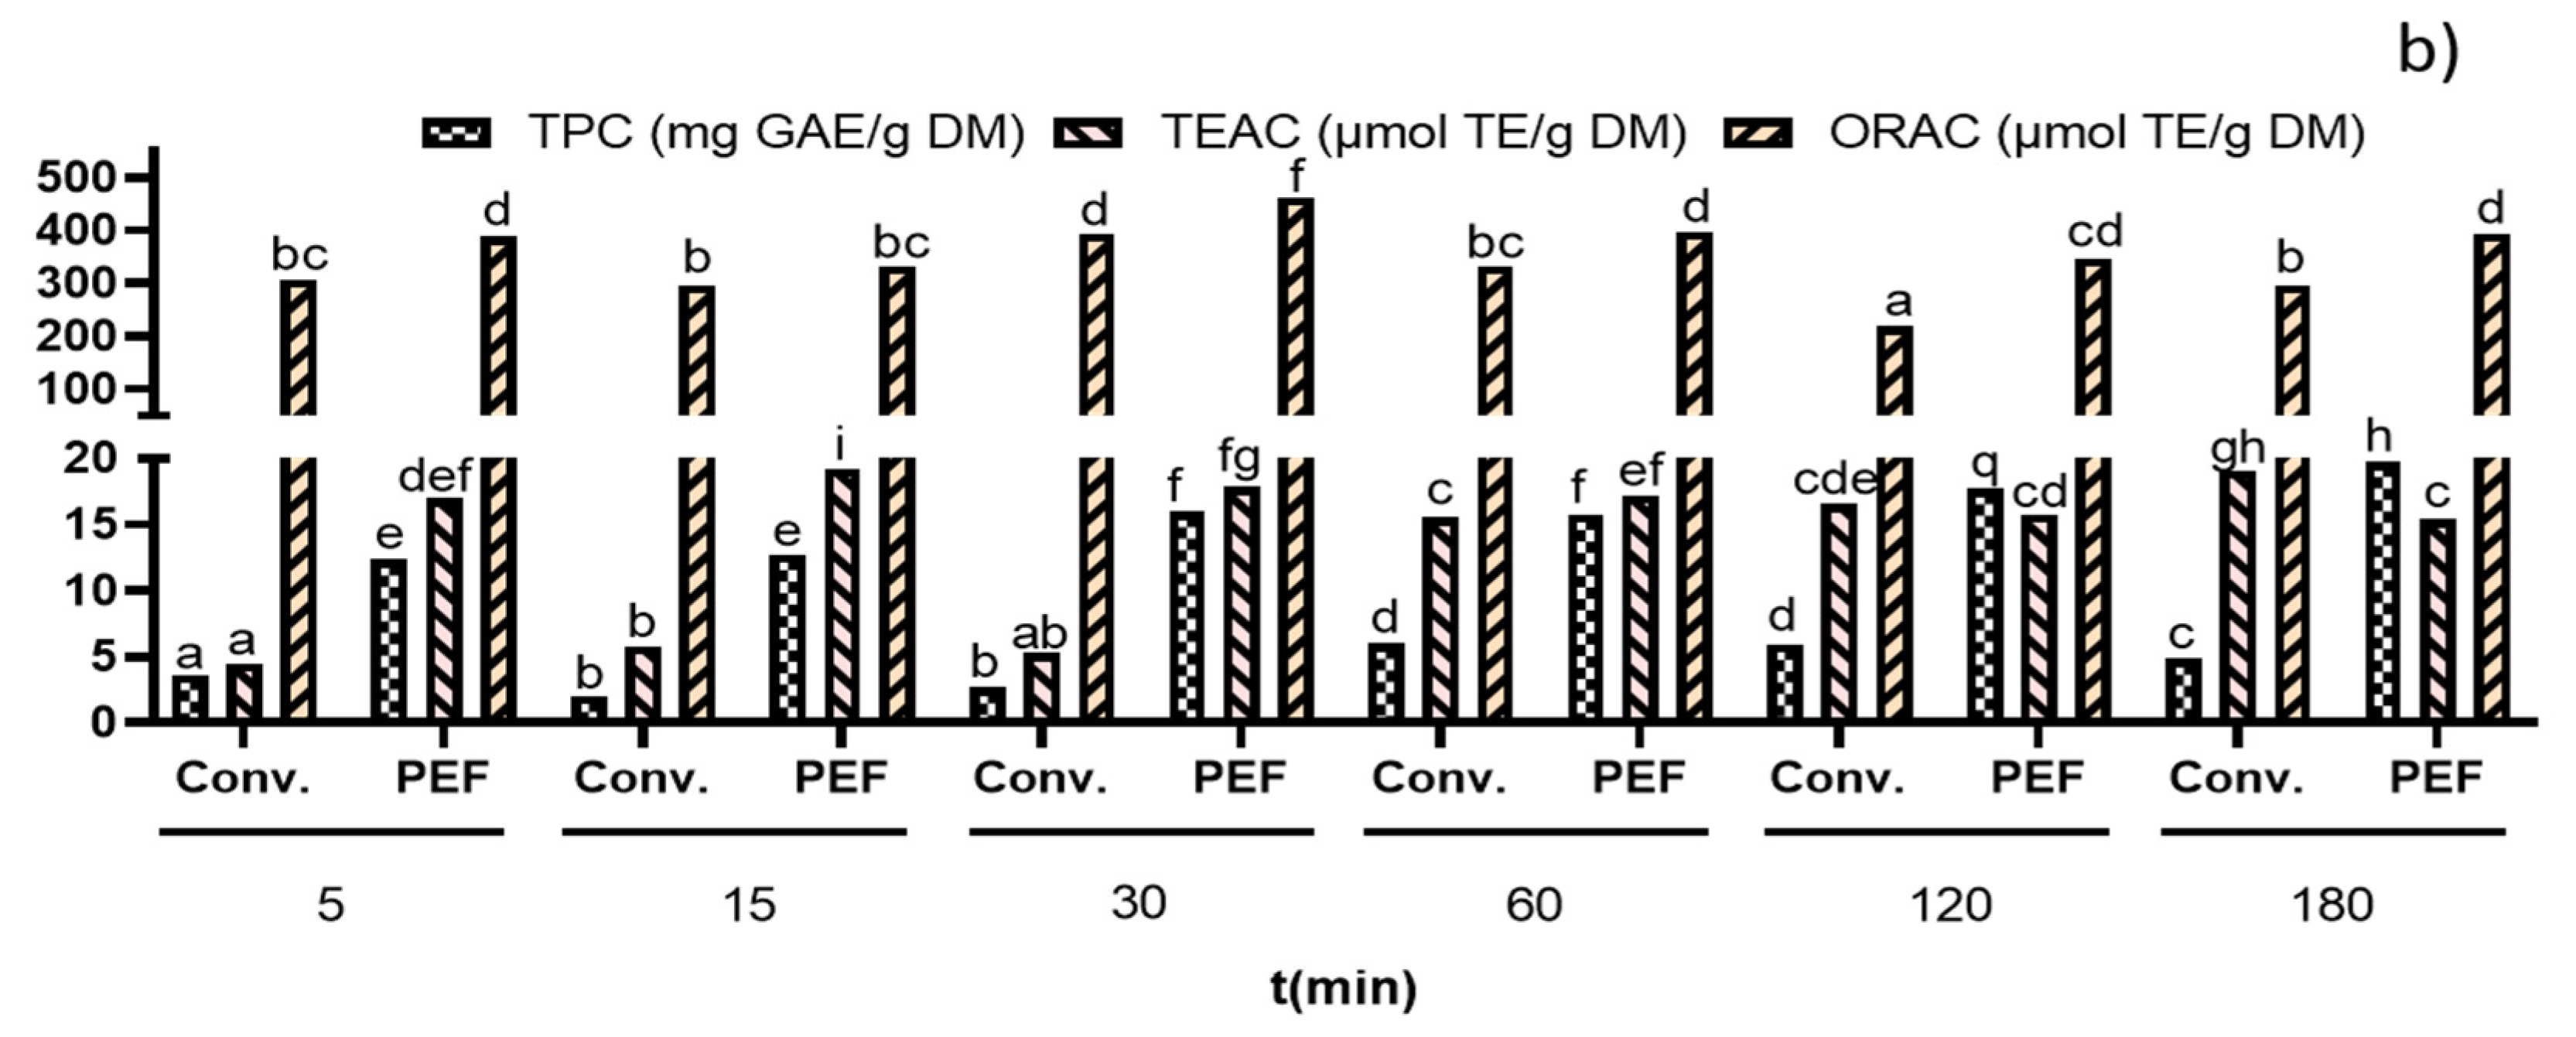
Figure 6 shows the results obtained after applying both treatments (conventional and PEF) using the mixture EtOH/H
2O. After performing a two-way ANOVA analysis (time and treatment), it was observed that both the extraction time and the use of the PEF pre-treatment had a significant effect (
p < 0.05) on the extraction of chlorophylls, carotenoids, (
Figure 6a), and total phenolic compounds (
Figure 6b). This effect is due to the electroporation produced by the PEF, which facilitates the extraction of these compounds more efficiently and with less agitation time.
It should be noted that no significant differences were observed regarding the maximum carotenoid content obtained after applying PEF pre-treatment for 60 min (0.50 ± 0.01 mg/g DM) or after conventional treatment without PEF for 180 min (0.50 ± 0.01 mg/g DM), which showed that PEF is an effective tool to reduce carotenoid extraction time, being 3 times faster than conventional extraction. A similar effect was observed for chlorophyll a: We obtained similar values after applying PEF and supplementary extraction for 120 min (0.60 ± 0.01 mg/g DM) as those obtained with conventional treatment for 180 min (0.57 ± 0.04 mg/g DM), observing a reduction of 60 min in the time to obtain the maximum chlorophyll a content. Moreover, PEF pre-treatment increased the extraction of chlorophyll b throughout all the extraction times compared to that of the control sample.
After analysing the statistical data of the TPC values, it was found that the pre-treatment with PEF also had a very positive effect on the extraction, obtaining significant differences (
p < 0.05) compared to those of the conventional treatment, independently of the extraction time. Moreover, it was also observed that after PEF extraction, the TPC values were 2–3-fold higher. For example, after 180 min of conventional extraction, TPC values of 4.84 ± 0.48 mg GAE/g DM were obtained, while the value obtained at the same time after PEF pre-treatment was 19.75 ± 0.50 mg GAE/g DM, representing a 75% increase. The increase in chlorophylls, carotenoids, total phenolic compounds, and TAC content obtained after PEF application compared to those of conventional extraction is in agreement with the results obtained by other authors after similar experiments with the microalgae
Nannochloropsis spp. [
13].
3.2.2. Dimethyl Sulfoxide/Water
Figure 7 shows the results obtained for chlorophyll, carotenoids, TPC, TEAC, and ORAC content after conventional and PEF-assisted extraction using DMSO/H
2O as a solvent. After performing a two-way ANOVA (time and treatment), it was observed that both extraction time and treatment had a significant effect (
p < 0.05) on the extraction of chlorophylls, carotenoids (
Figure 7a), and TPC (
Figure 7b). This effect was less than that observed after using the EtOH/H
2O mixture, mainly due to a lower solvent extraction capacity, as could be observed after using the conventional extraction method (
Figure 3 and
Figure 4).
Lower TEAC values were also observed due to a decreased extraction of antioxidant compounds (chlorophylls, carotenoids, and phenolic compounds) (
Table 1). However, the ORAC values were not significantly affected, although a non-significant increase was found when longer extraction times were used.
It should be noted that the maximum extraction of chlorophyll a and chlorophyll b occurred 15 min after applying the PEF pre-treatment, with values of 0.39 ± 0.01 mg/g DM and 0.32 ± 0.01 mg/g DM, respectively. However, after applying the conventional treatment, these values were not obtained until 180 min. PEF pre-treatment reduced the extraction time by 165 min. Regarding carotenoids, a similar effect was found, with the maximum carotenoid extraction (0.15 ± 0.01 mg/g DM) observed after applying the PEF pre-treatment and subsequent extraction for 15 min, obtaining lower values (0.08 ± 0.00 mg/g DM) than after using conventional extraction for 180 min.
The TPC content was also increased by PEF pre-treatment, for example, the maximum content extracted at 5 min after PEF pre-treatment (12.53 ± 0.31 mg AGE/g DM) was much higher than that obtained at 180 min after conventional treatment (4.84 ± 0.48 mg AGE/g DM).
3.3. Pulsed Electric Fields (PEF) Efficiency
In order to better evaluate the effect of PEF on the extraction of compounds and to compare it with conventional extraction, the Y
PEF efficiency coefficient was introduced. This coefficient is defined as the ratio between the values obtained for chlorophylls, carotenoids (
Figure 8a), TPC, TEAC, and ORAC (
Figure 8b) with PEF-assisted extraction and those same values obtained with conventional extraction.
The value of YPEF corresponds to (for chlorophyll a), (for chlorophyll b), etc.
It is important to note that the maximum YPEF values were observed at the optimum extraction times of 5 and 15 min, independently of the solvent mixture, obtaining a greater effect in the extraction of carotenoids and TPC. From 30 min onwards, YPEF values decreased rapidly, which gives an idea of the effectiveness of the PEF in extracting these compounds, suggesting that in a reduced time the extraction can be increased, and the cost reduced. In this regard, a recovery of 55–60% for chlorophylls, 85–90% for carotenoids, and 60–70% for total phenolic compounds was obtained with respect to the maximum total content extracted.
The YPEF values for TEAC were also increased, as these are directly related to the extraction of the antioxidant compounds. However, this effect was not observed for the ORAC method, as no direct relation between higher extraction and ORAC values was obtained.
4. Conclusions
From the results obtained in this study it can be concluded that both time and solvent have a significant impact on the recovery of antioxidant compounds when conventional extraction is used, obtaining the highest values of phenolic compounds, chlorophyll a, chlorophyll b, and carotenoids when the mixture EtOH/H2O was used for 180 min. Moreover, a strong relationship of TEAC values with total phenolic compounds, carotenoids, and chlorophylls was found while ORAC values were positively correlated with carotenoids. Both PEF treatment and extraction time had a statistically significant effect on the recovery of antioxidant compounds when the EtOH/H2O mixture was used, showing a considerable reduction in the extraction time required to recover polyphenols, carotenoids, and chlorophylls compared to those of conventional treatment. When the impact of PEF and the DMSO/H2O mixture was evaluated, it was found that both the treatment and the extraction time had a statistically significant effect, reducing the extraction times compared to the conventional treatment; however, in this case the maximum content of antioxidant compounds was lower than that observed for EtOH/H2O. TAC values were also increased after PEF treatment, mainly due to an increase in the extraction of antioxidant compounds. In addition, the maximum efficiency values were observed at 5 and 15 min for the two solvents, with a greater effect on the extraction of carotenoids and total phenolic compounds. In the future, the implementation of PEF in the extraction of antioxidant bioactive compounds from microalgae would be interesting, as it could be a promising and environmentally sustainable technology.


 ,
, 


