Article

In-Cylinder Oxygen Concentration Estimation Based on Virtual Measurement and Data Fusion Algorithm for Turbocharged Diesel Engines

1
School of Transportation Science and Engineering, Beihang University, Beijing 100191, China
2
Intelligent Network R&D Institute, China FAW Group Co., Ltd., Changchun 130011 , China
*
Author to whom correspondence should be addressed.
Appl. Sci. 2021, 11(16), 7594; https://doi.org/10.3390/app11167594
Submission received: 9 July 2021 / Revised: 10 August 2021 / Accepted: 16 August 2021 / Published: 18 August 2021
(This article belongs to the Topic Dynamical Systems: Theory and Applications)

Abstract

:
In-cylinder oxygen concentration (ICOC) is critical for advanced combustion control of internal combustion engines, and is hard to be accessed in commercial measurements. In existing research, ICOC is predicted by conventional dynamical model based on mass/energy conservation, which suffers from uncertainties such as inaccuracy of volumetric efficiency or the error of orifice geometry. In this paper, we enhance the ICOC estimation by implementing two vital strategies. Firstly, we introduce a method called virtual measurement to resist the conventional model uncertainties, in this method we modeling the ICOC as a function of ignition delay which can be obtained by measuring the in-cylinder pressure. Secondly, we apply Kalman filter to fuse the ICOC results from the conventional dynamical model and the virtual measurement. The data fusion algorithm turns the estimation to a predictor-corrector fashion, which further improves the overall accuracy and robustness. The proposed approach is validated through a calibrated GT-Power engine model. The results show that the estimation error can be achieved form at worst 0.03 to at best 0.01 on steady state.

1. Introduction

Advanced combustion concepts, including homogeneous charge compression ignition (HCCI), low temperature diffusion combustion (LTDC), premixed charge compression ignition (PCCI), and reactivity controlled compression ignition (RCCI), offer a promising solution for emission-reducing [1] and engine efficiency-promoting [2] for commercial vehicles. However, these technologies operate in a limited range of engine conditions closing to the combustion stability boundaries [2,3,4]. In this case, combustion failure such as misfire [5,6] and knock [7,8] happen under slightly mismatching of in-cylinder conditions. To achieve promising performance, advanced combustion control strategies are demanded. In-cylinder conditions can be controlled through air-path system [9,10]. A typical air-path system of engines is shown in Figure 1. With the help of variable geometry turbocharger (VGT), exhaust gas re-circulation (EGR) valve and variable valve timing (VVT), the in-cylinder conditions can be regulated in a flexible fashion. Nevertheless, highly accurate information of the in-cylinder conditions is demanded for the control strategies implementation. As one of the key parameter of in-cylinder conditions, in-cylinder oxygen concentration (ICOC) is critical to advanced engine combustion control. Studies show that reducing ICOC can effectively suppress the NOx and soot emission simultaneously [11,12]. At the same time as increasing the intake air oxygen concentration, thermal efficiency, and power output are extensively enhanced [13].
The ICOC can hardly be directly measured in commercial applications. Model-based observer is thus developed to estimate it. In [14], linear parameter-varying model is utilized for the estimation of the ICOC at intake valve closing (IVC). In [15], the robustness of three observers for in-cylinder oxygen fraction is analyzed based on input to state stable (ISS) theory. In [16], the author outlines a physics-based time-varying transport delay model for oxygen concentration estimation for dual-loop EGR engine, which revealing the oxygen concentration relation between exhaust and intake manifold. Literature [17] proposes a model based on plug flow, which applied the effects of the time-varying transport delay. The method possesses an estimation error within 0.2% (RMS value). However, these model-based methods are mostly derived based on mass/energy conservation and vulnerable to uncertainties, such as the inaccuracy of volumetric efficiency [18] or the error of orifice geometry [19], etc. Additionally, semi-model based or numerical-based approaches are also developed. In [20], a semi-empirical model is presented for NOx emission prediction, which combine dynamical model and empirical data to develop the relation between the NOx emission and intake oxygen concentration. In [21], a numerical approach is developed to study the engine performance and emission for various blend fuels under various oxygen concentration. Despite of its accuracy, it cannot be implemented to combustion control.
In this paper, the concept called “virtual measurement” is introduced. Virtual measurement means not physically measured by sensors but obtained by mathematical models or other relations, such as looking up tables, etc. Combining the virtual measurement with the information that calculated from dynamical equations by data association algorithm, the concerned information is supposed to be refined better. Back to the oxygen concentration estimation, as for the virtual measurement, we modeled the oxygen concentration as a function of ignition delay, which can be captured by the in-cylinder pressure trace. Once the ignition delay obtained, the in-cylinder oxygen information can be obtained accordingly. Thus, the virtual measurement is actually related to the in-cylinder pressure which is independent with the existing dynamical model-based strategy (on the basis of mass/energy conservation). To improve the overall robustness and accuracy, Kalman filter is utilized to fuse the data from in-cylinder pressure trace and the conventional dynamical model. Therefore, the virtual measurement (by in-cylinder pressure trace) of ICOC combines with the predicted one by the dynamical model to enable the ICOC to be estimated in a predictor-corrector fashion. The proposed method is validated through a calibrated GT-power model, the simulation results reveal the improved estimation accuracy and robustness.
The flow of the paper is described as Figure 2. Contributions of the paper mainly include,
  • An ICOC model based on ignition delay is proposed;
  • Kalman filter is applied as a data fusion algorithm to improve ICOC estimation results;
  • The influence of gas mass uncertainty to ICOC estimation is studied quantitative;
  • A calibrated GT-power model is designed to validate the proposed method, results show that the ICOC estimation errors improved form at worst 0.03 to at best 0.01 on steady state.
The rest of the paper is organized as: in Section 2, the conventional oxygen dynamical models are proposed for predicting the ICOC. In Section 3, the virtual measurement is introduced, the ICOC is modeled as a function of ignition delay. In Section 4, Kalman filter is designed to fuse the ICOC results from the convention dynamical model and those from the virtual measurement. In Section 5, the proposed method is validated by a calibrated GT-power model. In Section 6, conclusive remarks are presented.

2. Dynamical Modeling

The ICOC can be captured by the dynamical relations with the air mass within cylinders and manifolds. In this section, the relationship among oxygen concentration (including in-cylinder, intake, and exhaust), residual gas mass, and fuel mass are derived.

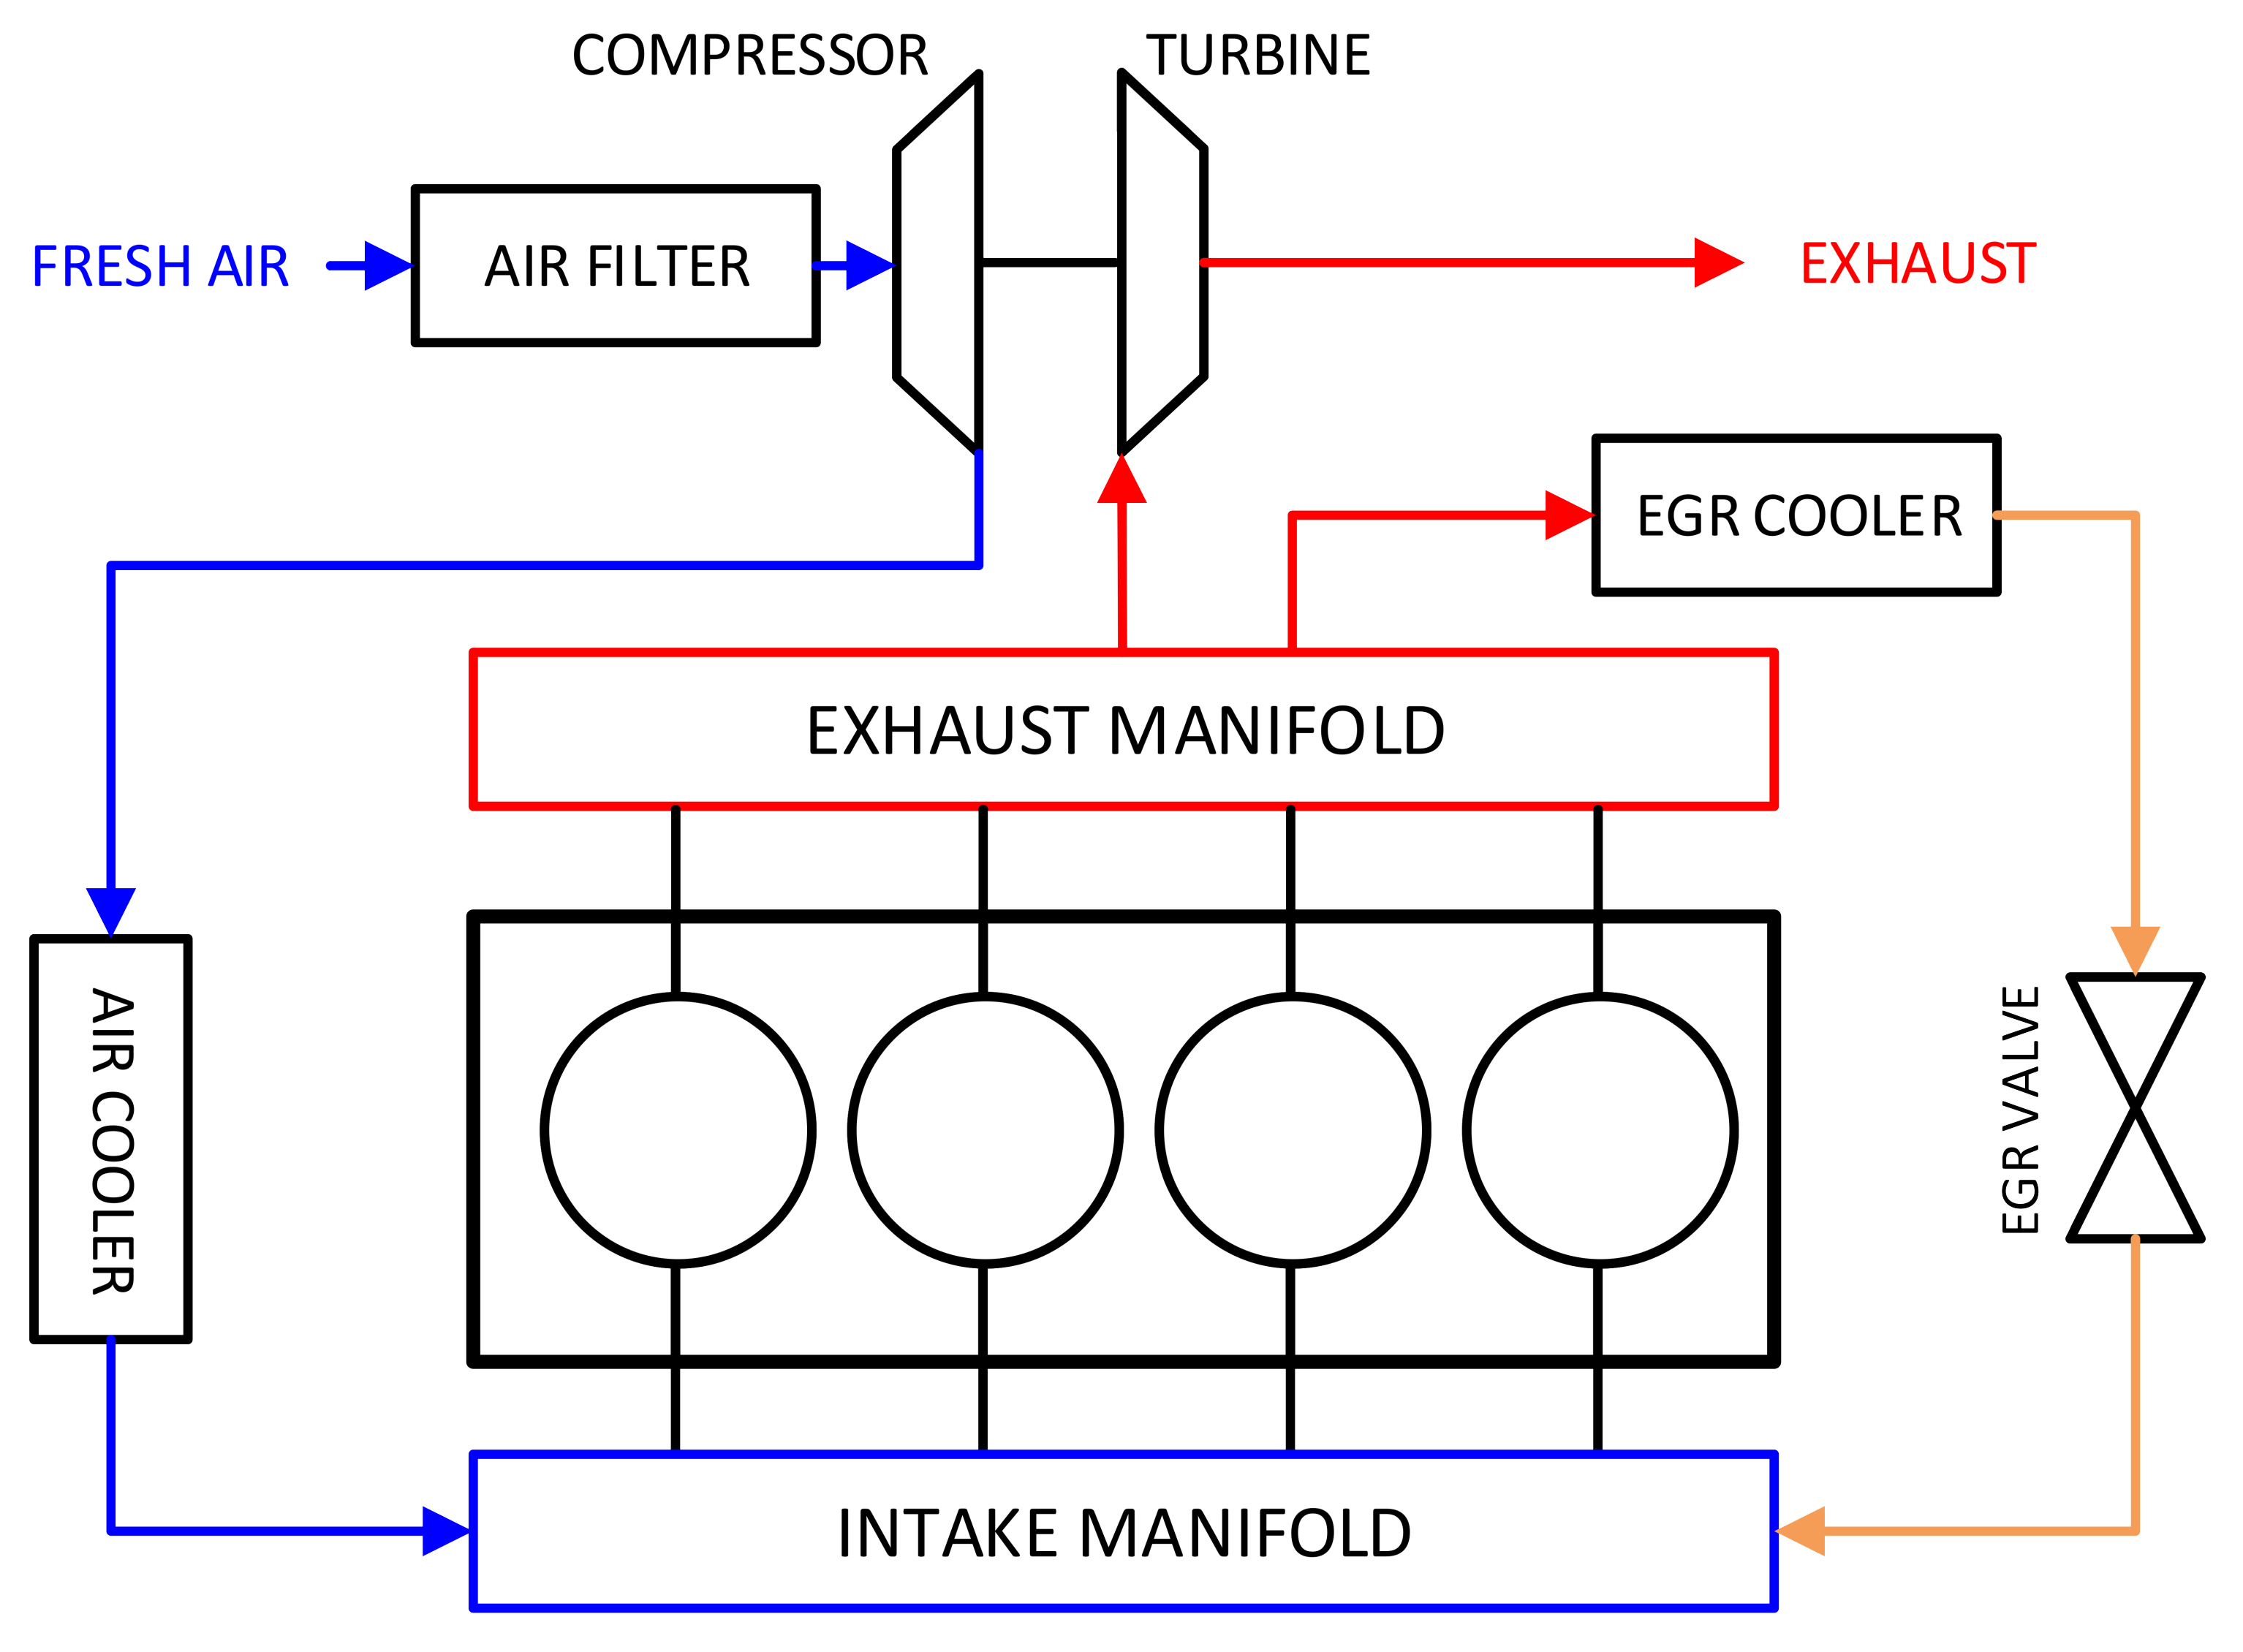
2.1. Modeling of VGT

The VGT is a compressor-turbine machine with a variable flow orifice geometry. The energy is conducted from turbine to compressor via mechanical shaft. Applying power balance between the two sides of the turbocharger [10],
J v g t N v g t d N v g t d t = P t u r P c o m
where,
P t u r = m ˙ t u r R c p η t u r T e x h 1 1 π t u r γ 1 γ P c o m = m ˙ c o m R c p 1 η c o m T i n t π c o m γ 1 γ 1

2.2. In-Cylinder, Intake and Exhaust Oxygen Concentration

Considering the IVC as the boundary of adjacent cycles. Thus, the contribution for in-cylinder gas mass includes residual gas mass, injection mass, aspirated gas mass, and exhaled gas mass. Hence the relationship between cycle k and cycle k + 1 is formulated as,
m c y l ( k + 1 ) = m r e s ( k ) + m i n j ( k ) + m i t c ( k ) m c t e ( k )
where, the residual gas mass is estimated by applying ideal gas law,
m r e s ( k ) = p i v c ( k ) V i v c ( k ) C d i s T ¯ i n t ( k ) m i t c ( k ) + m f ( k )
where in Equation (4), T ¯ i n t is measured in the intake manifold. p i v c is in-cylinder pressure at intake valve closing time, which is measured in engine cylinder by in-cylinder pressure sensor. We apply mean temperature of intake manifold because the in-cylinder temperature can be hardly measured. The introduced error by this approximation is acceptable. Assuming the T ¯ is 50 Kelvin less than the in-cylinder temperature, the residual fraction is 30%, and the combustion efficiency is 90%, then the estimation error for trapped unburned fuel mass is within 3%.
For conventional dynamical model, the aspirated gas mass is calculated from the integral of its mass rate, also known as speed-density model,
m ˙ i t c = η v P i n t V d N e n g 120 C d i s T i n t
where the volumetric efficiency η v is a model uncertainty, demanding calibration.
The in-cylinder oxygen concentration is the mass fraction for related parameters. the in-cylinder oxygen concentration of cycle k + 1 is expressed as,
Φ c y l ( k + 1 ) = Φ c y l ( k ) m c y l ( k ) m f ( k ) λ s m c t e ( k ) Φ c t e ( k ) + Φ i n t ( k ) m i t c ( k ) m c y l ( k + 1 )
where, the relationship among the exhaust oxygen concentration, in-cylinder oxygen mass (before combustion), consumed oxygen mass, and injection mass are derived as,
Φ c t e ( k ) = Φ c y l ( k ) m c y l ( k ) m f ( k ) λ s m c y l ( k ) + m i n j ( k )
and, the exhaled gas mass is the difference of in-cylinder gas mass and residual gas mass,
m c t e ( k ) = m c y l ( k ) m r e s ( k )
The intake oxygen concentration of cycle k + 1 is computed from the intake gas oxygen mass, EGR gas oxygen mass, fresh air gas mass, and the overall gas mass,
Φ i n t ( k + 1 ) = Φ i n t ( k ) m i n t ( k ) m i t c ( k ) + Φ e x h ( k ) m e g r ( k ) + Φ a i r m c o m ( k ) m e g r ( k ) m i n t ( k ) + m c o m ( k ) m i t c ( k )
The exhaust manifold oxygen concentration can be calculated from the previous manifold gas oxygen mass, the turbocharge gas oxygen mass, the exhaled gas oxygen mass and the overall gas mass,
Φ e x h ( k + 1 ) = Φ e x h ( k ) m e x h ( k ) m t u r ( k ) + Φ c t e ( k ) m c t e ( k ) m e x h ( k ) + m c t e ( k ) m t u r ( k )
where, m e g r is formulated as,
  • When the flow is not choked p d p u > 2 γ + 1 γ / ( γ 1 ) ,
    m ˙ = C d i s A v r p u C g a s T u p d p u 1 / γ 2 γ γ 1 1 p d p u ( γ 1 ) / γ 0.5
  • When the flow is choked p d p u 2 γ + 1 γ / ( γ 1 ) ,
    m ˙ = C d i s A v r p u C g a s T u γ 2 γ + 1 0.5 ( γ + 1 ) ( γ 1 )
Applying the ideal gas law, the intake/exhaust gas mass can be calculated,
m i n t ( e x h ) ( k ) = P ¯ i n t ( e x h ) ( k ) V i n t ( e x h ) C d i s T ¯ i n t ( e x h )

2.3. System Dynamic Equations in State-Space Form

For intake, exhaust, and in-cylinder oxygen concentration, rearranging the above equation into state-space form,
Φ i n t ( k + 1 ) Φ e x h ( k + 1 ) Φ c y l ( k + 1 ) = A 11 A 12 0 0 A 22 A 23 A 31 0 A 33 Φ i n t ( k ) Φ e x h ( k ) Φ c y l ( k ) + B 11 B 21 B 31
where A i j and B i j can be found at Appendix A.
For commercial applications, the intake and exhaust oxygen concentration can be measured by sensors. Thus, the measurement equation owns a form as,
Y ( k ) = 1 0 0 0 1 0 H Φ i n t ( k ) Φ e x h ( k ) Φ c y l ( k )
Since the ICOC is predicted by the dynamical equations, to distinguish it from the model derived in the following section, here we call Equations (14) and (15) as “dynamical model”.
To be noted, too many variables of gas masses are involved in this system and they can only be obtained either by integrating the mass flow rate, as speed-density Equation (5) and orifice Equations (11) and (12), or by looking up maps, as η v , or by combining these two strategies, as m c o m and m t u r . Almost none of them is directly measured by physical sensors in real engines, thus the accuracy of the final estimation result of the ICOC is vulnerable to model uncertainties.
As aforementioned in the introduction section, to improve the accuracy and robustness of this system, “virtual measurement” strategy is introduced in the following section.

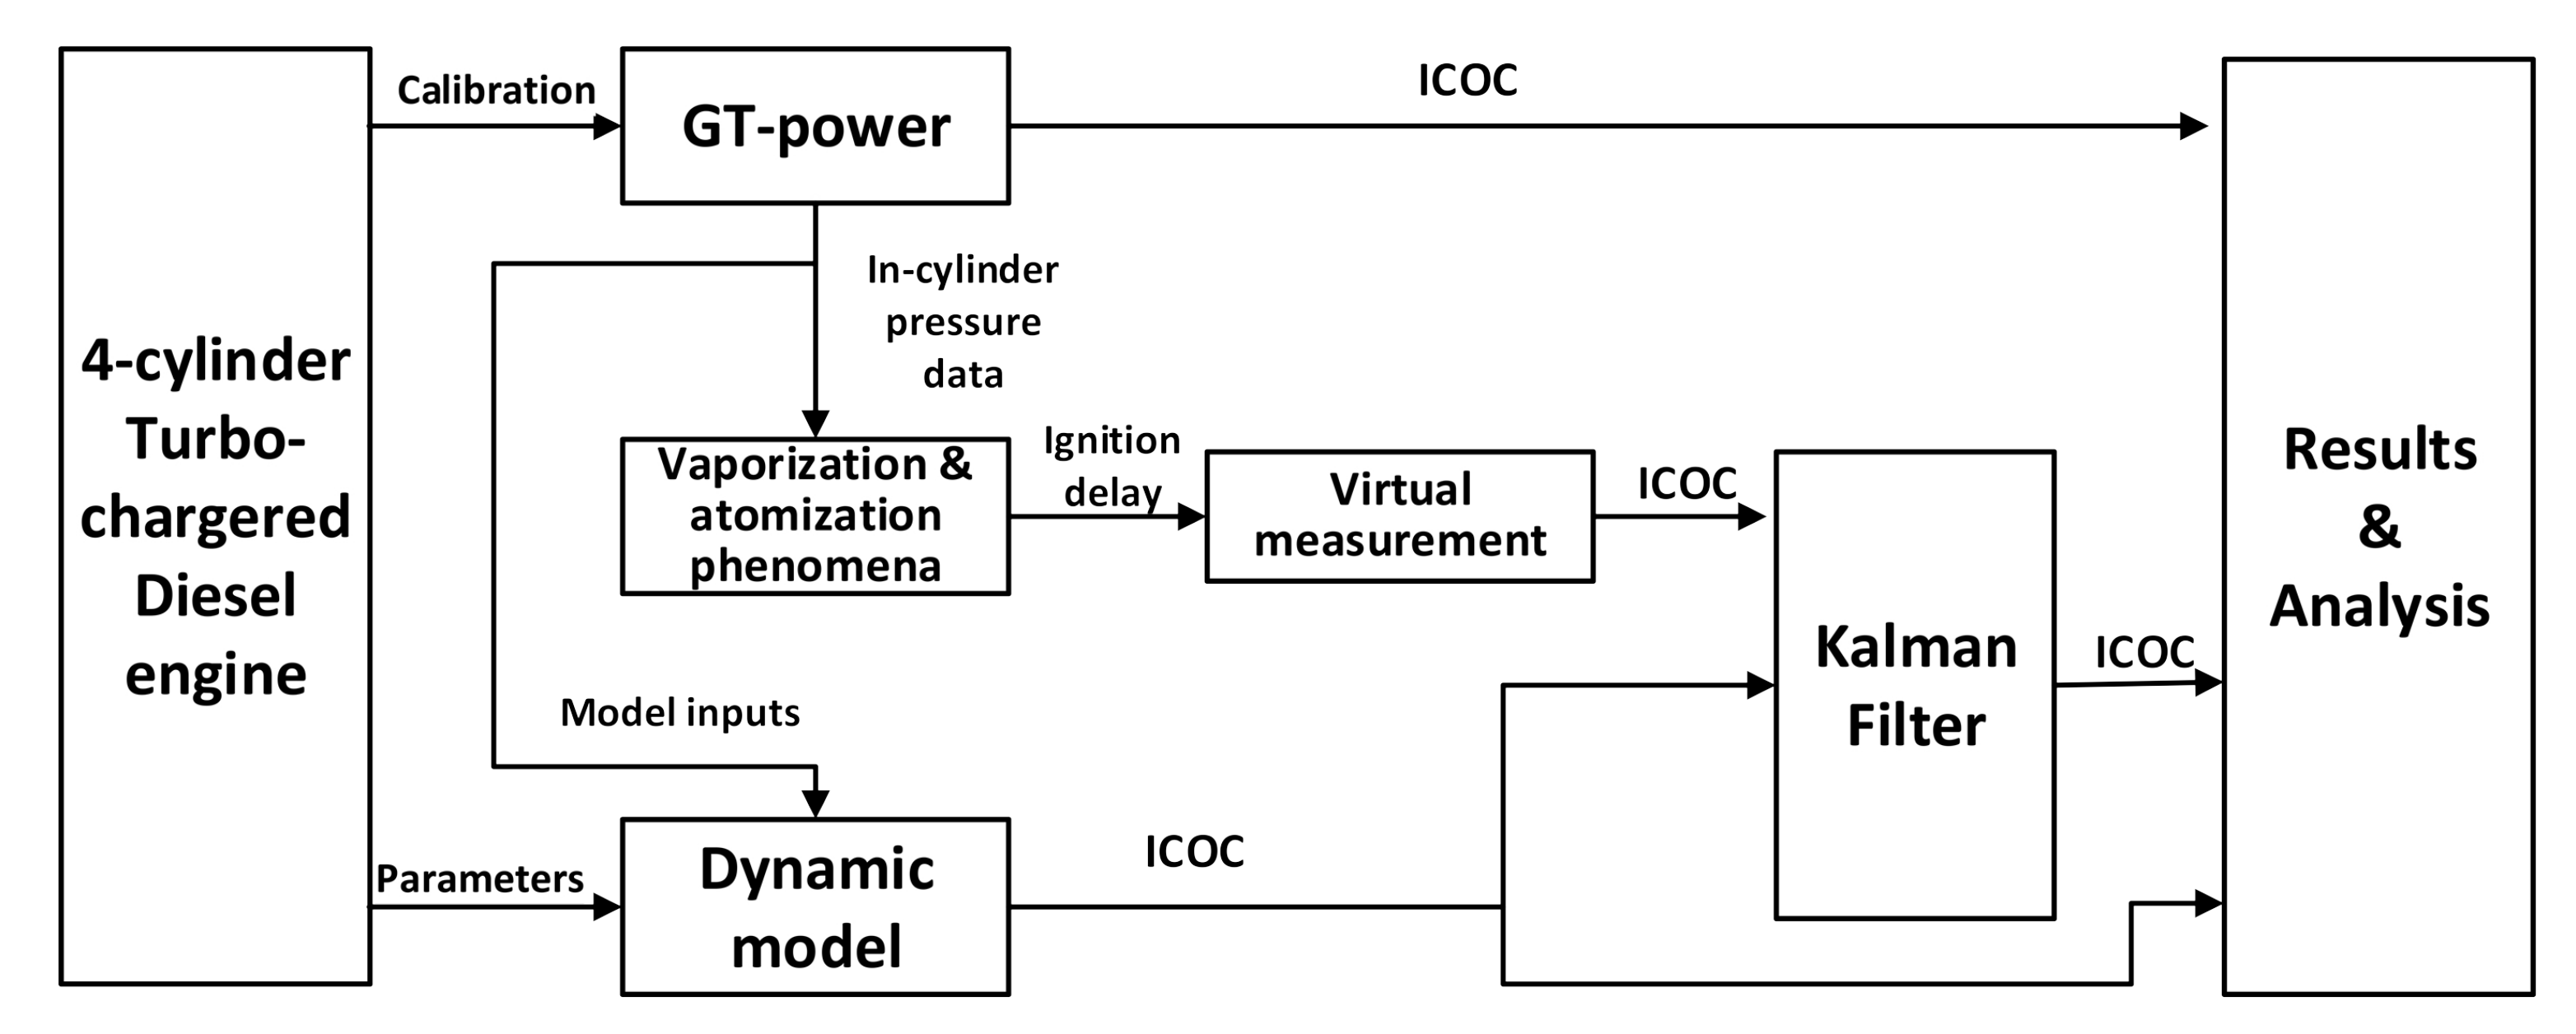
3. Virtual Measurement

In this section, we apply a empirical formula to identify the relationship between ICOC and ignition delay, where, the ignition delay can be obtained from in-cylinder pressure data. Hence, by measuring the in-cylinder pressure (pressure trace), we can measure ICOC indirectly. This method is so called virtual measurement.
Intuitively, to improve the estimation for ICOC, we want to link it to other information. This information should satisfy the following requirements, (1) it can be measured directly or easily by physical sensors; (2) its relationship with the in-cylinder oxygen is strong enough.
It has been stated in [22], apart from the temperature, pressure and injection mass, the ICOC also has an effect on the ignition delay for diesel engines. Moreover, ignition delay can be tracked by checking the measurable pressure trace, which is measurable for commercial engines. Therefore, modeling the ICOC as a function of ignition delay, the aforementioned two requirements can be satisfied. Here, the oxygen information calculated from ignition delay is served as virtual measurement, which can be utilized to refine the result from the dynamical model in Section 2.
However, the in-cylinder temperature is inaccessible and many other factors also contribute to the ignition delay, such as the fuel type and the injection timing, etc. Here, assuming the injection timing and the fuel type are fixed and then, to a large extent, the ignition delay can be captured by the intake temperature, pressure, ICOC, and injection mass, in empirical formula
τ i d = A p i n t a e b T i n t Φ c y l c m f d
where, τ i d represents the ignition delay and A, a, b, c, and d are constant.

3.1. Calibration

To calibrate this model, a high-fidelity GT-Power model is constructed with a configuration as Figure 1, and its combustion model is predictive combustion model which is calibrated by real in-cylinder pressure data and injection profile. It has been demonstrated in [23] that such a model can capture the combustion process for transient conditions.
The injection timing and engine speed is set as -10CA TDC and 2000 rpm, respectively. To cover an operating range as wide as possible, other operating conditions, such as the operating of EGR valve is set from 20% to 70%, the rack position for the VGT is adjusted from 0.2 to 0.8, and the fuel is injected from 35 mg to 65 mg. In total, 168 cases with different combinations of operating conditions are simulated, and the intake manifold temperature, pressure, ICOC and ignition delay are sampled for each case when the engine reached steady state.
The intake manifold temperatures and pressures of the 168 cases are plotted in Figure 3.
Taking logarithm of both sides of Equation (13) and applying least square method, the model is calibrated as,
τ i d = e 3.594 p i n t 1.734 e 613.25 T i n t O 2 0.116 m f 0.08
The modeled and simulated ignition delay are compared in Figure 4.
Figure 4 tells that the modeled ignition delay matches well with the simulation, and the model error is roughly within 0.2 CA degrees (see lower part of Figure 4).

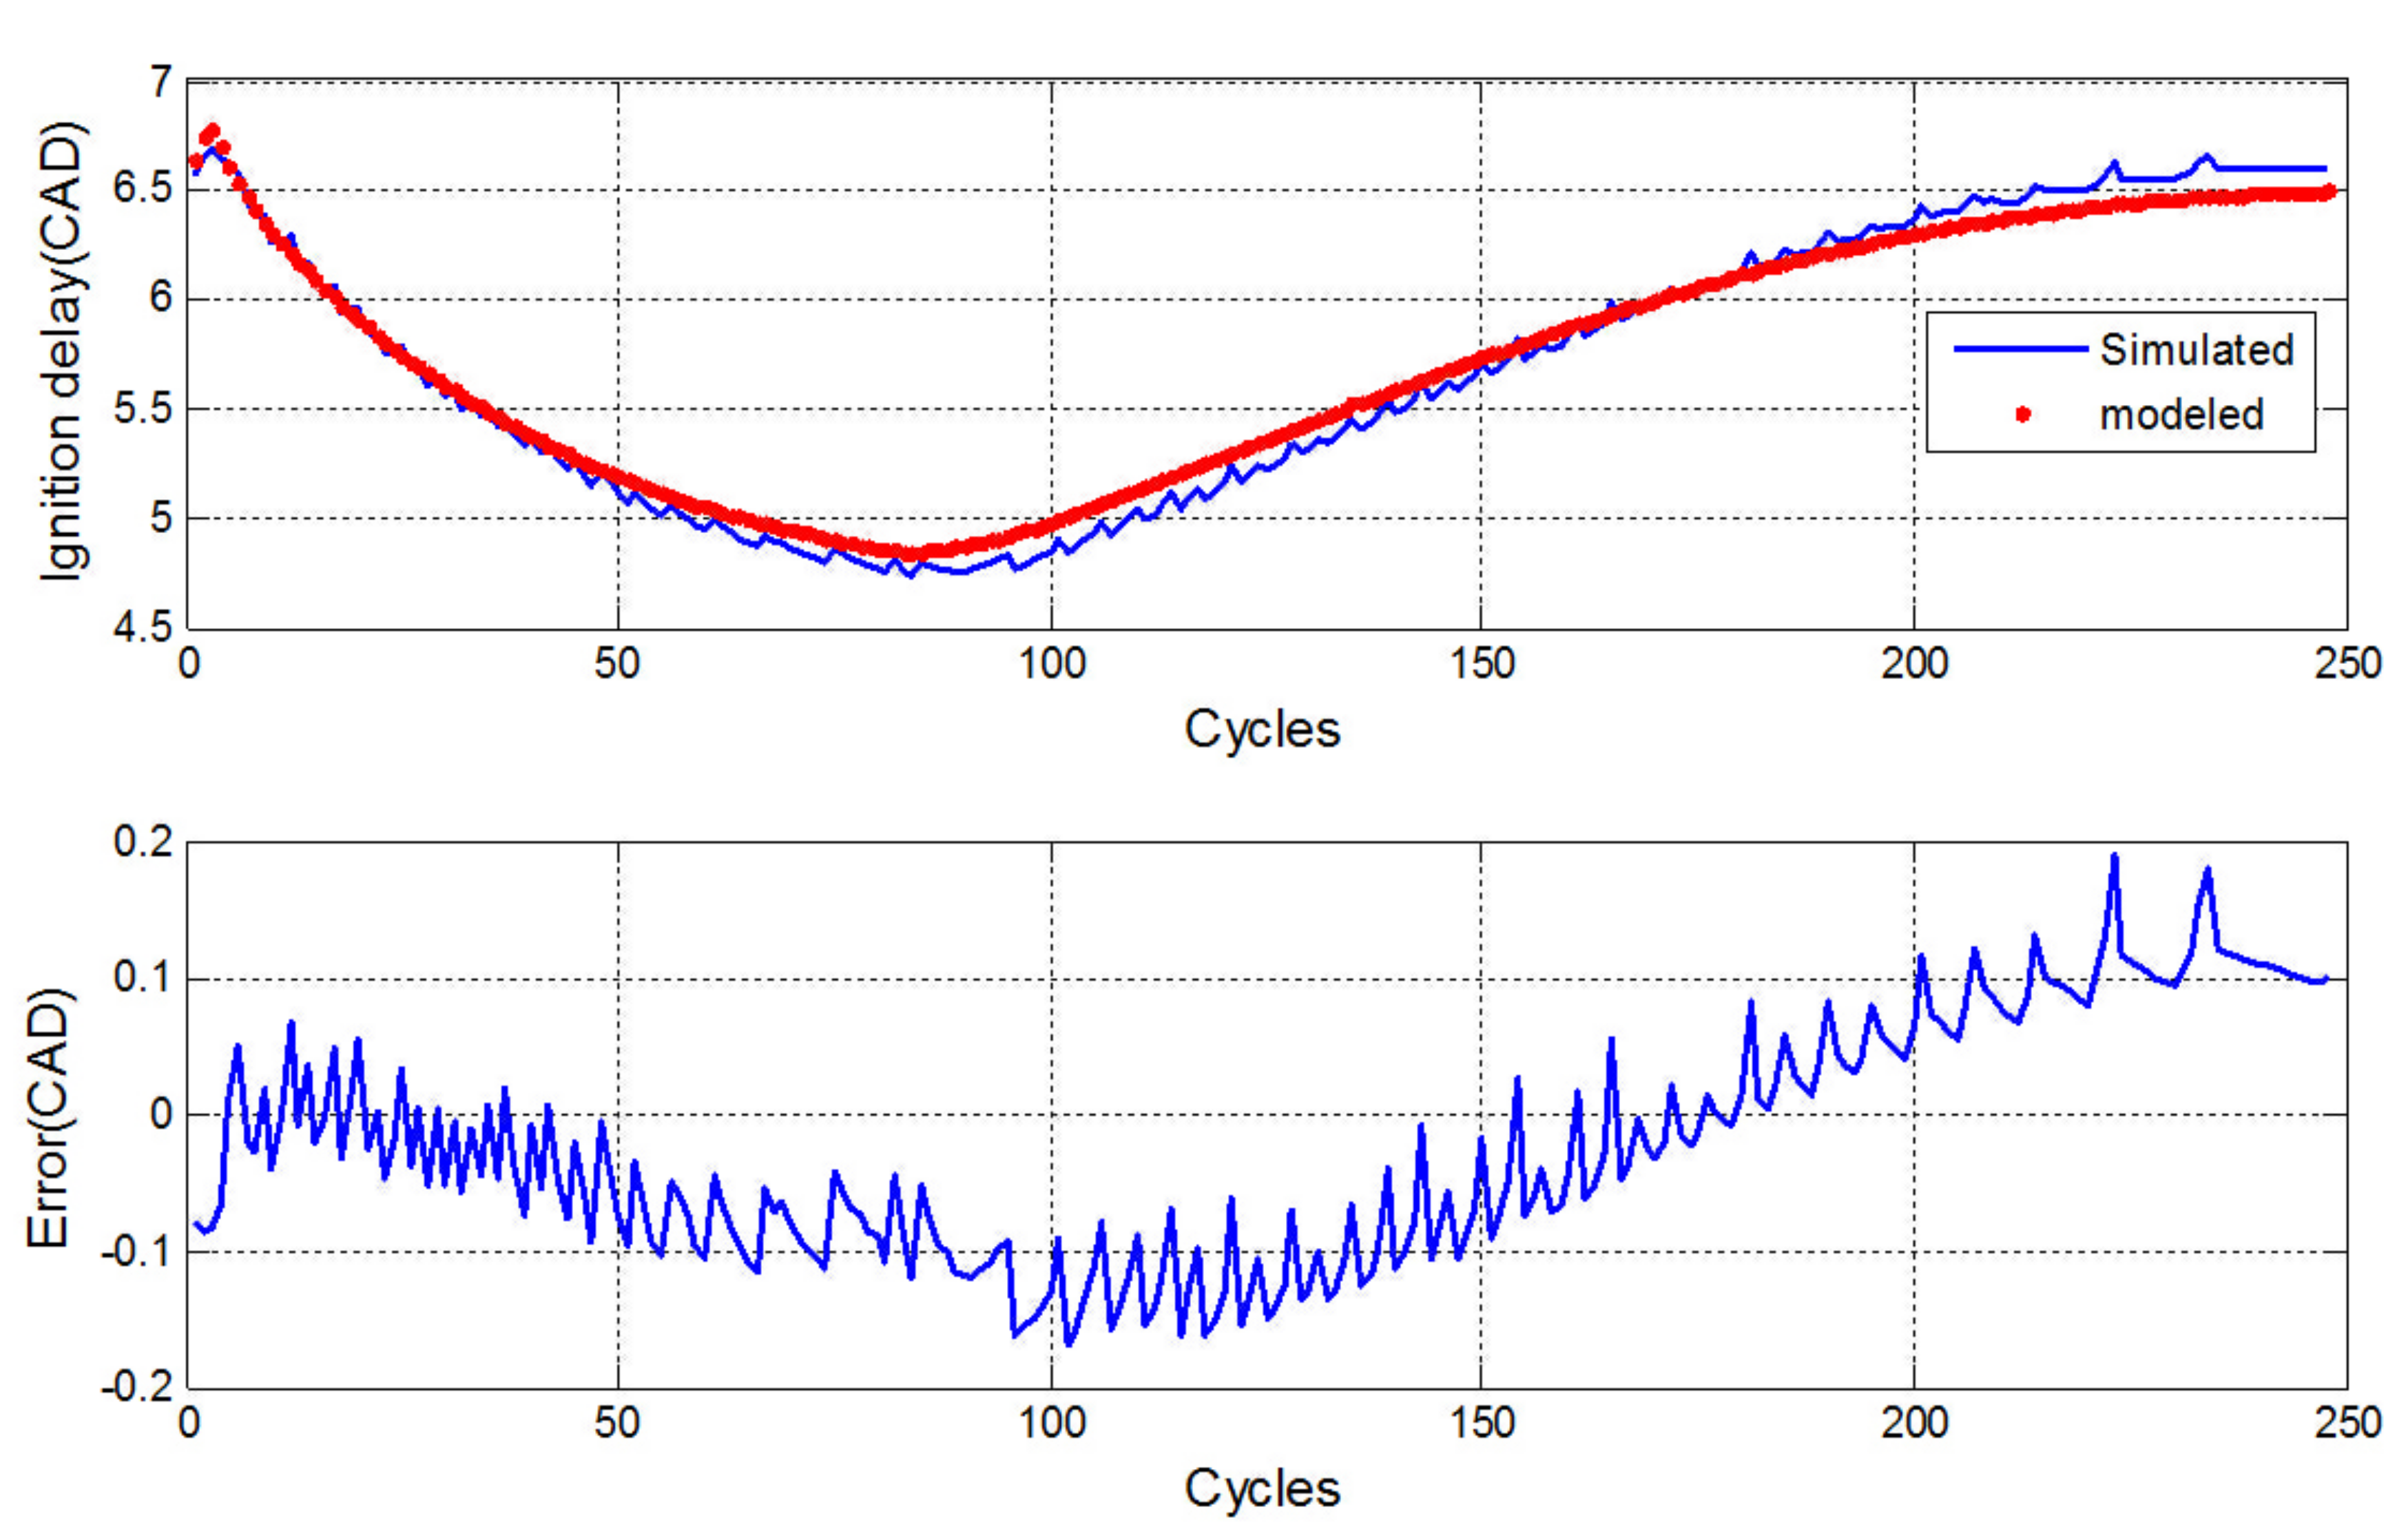
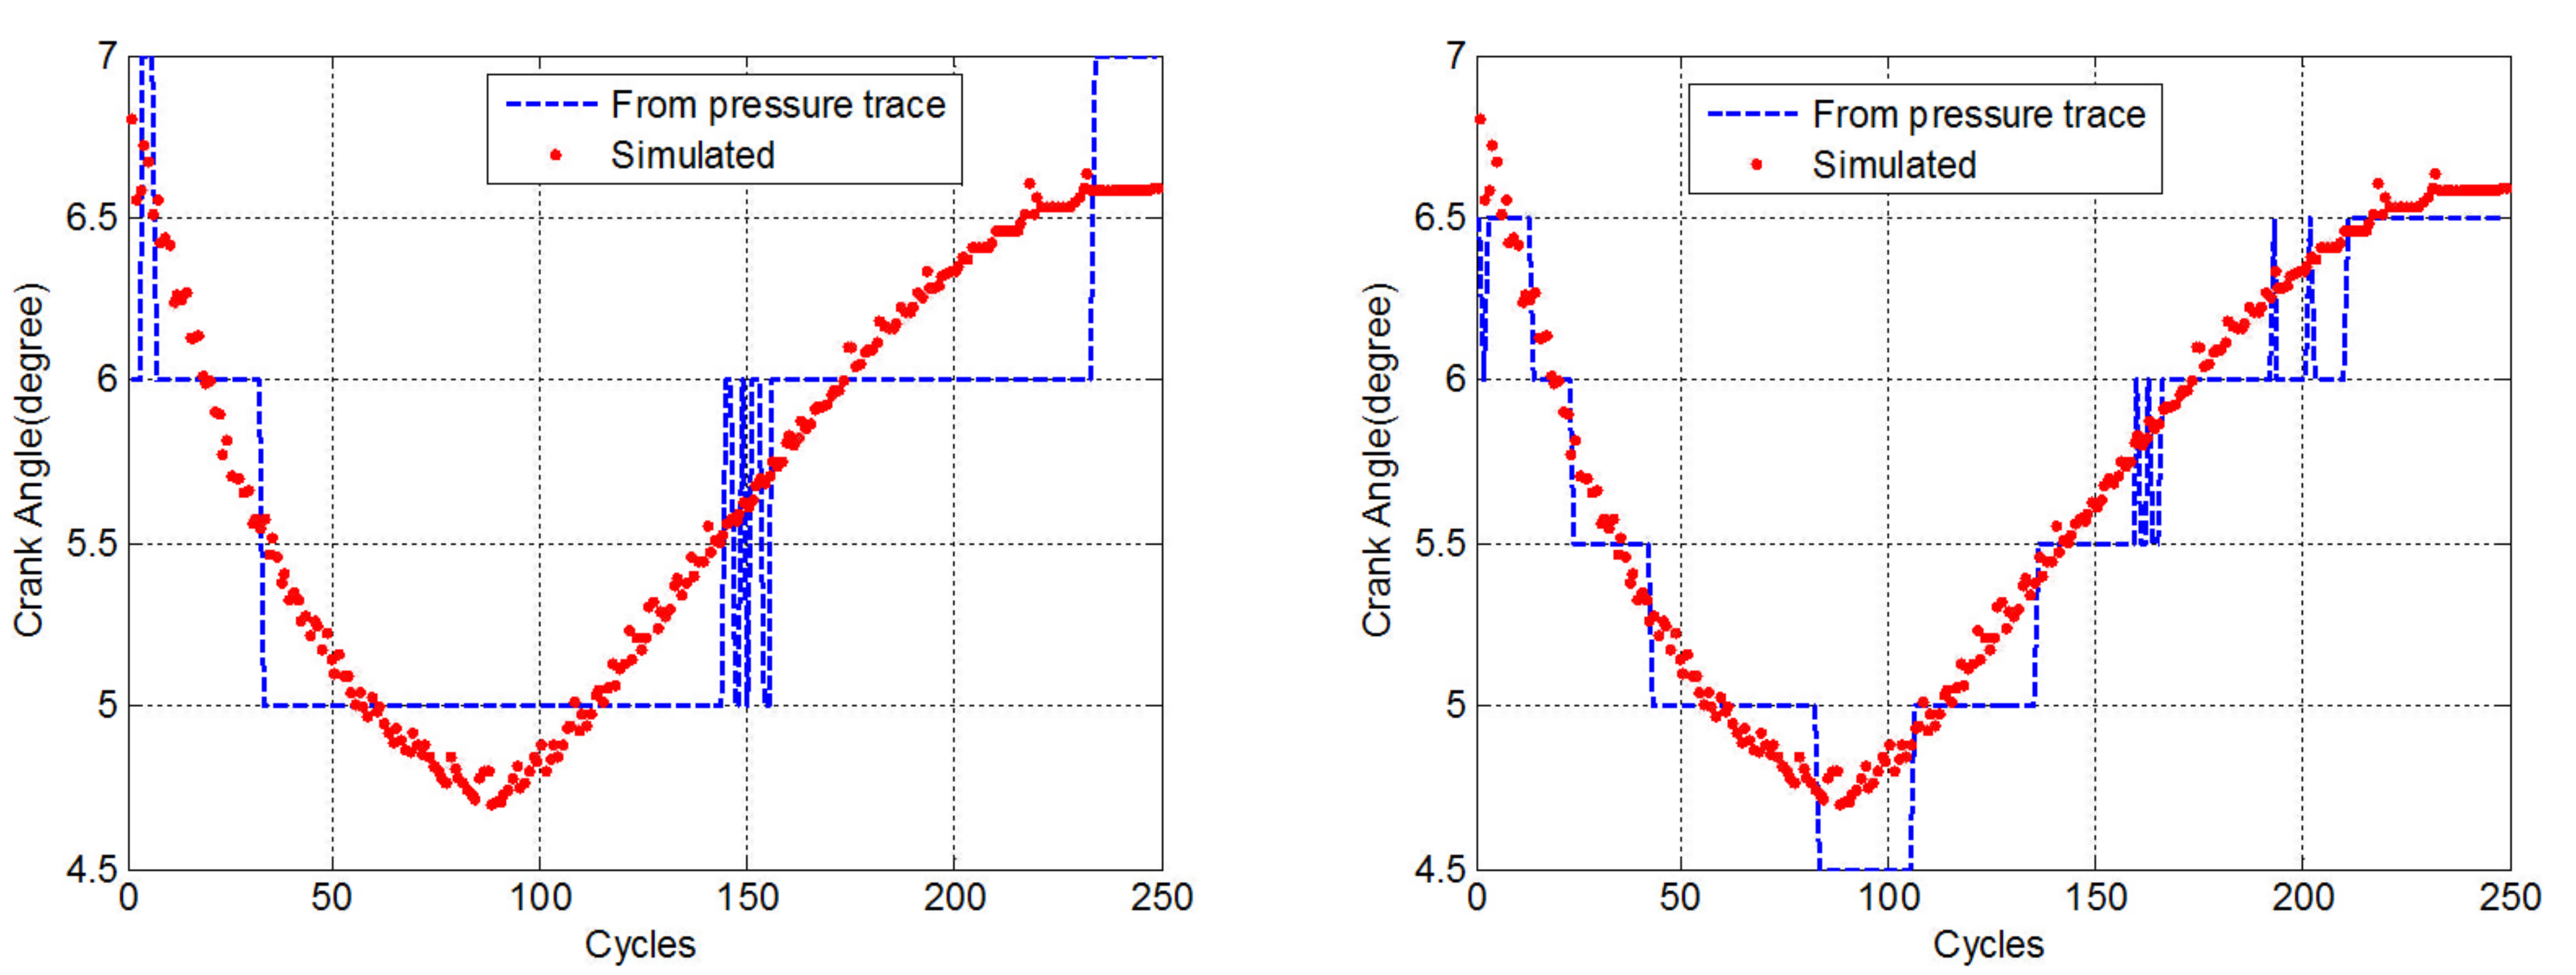
3.2. Model Validation
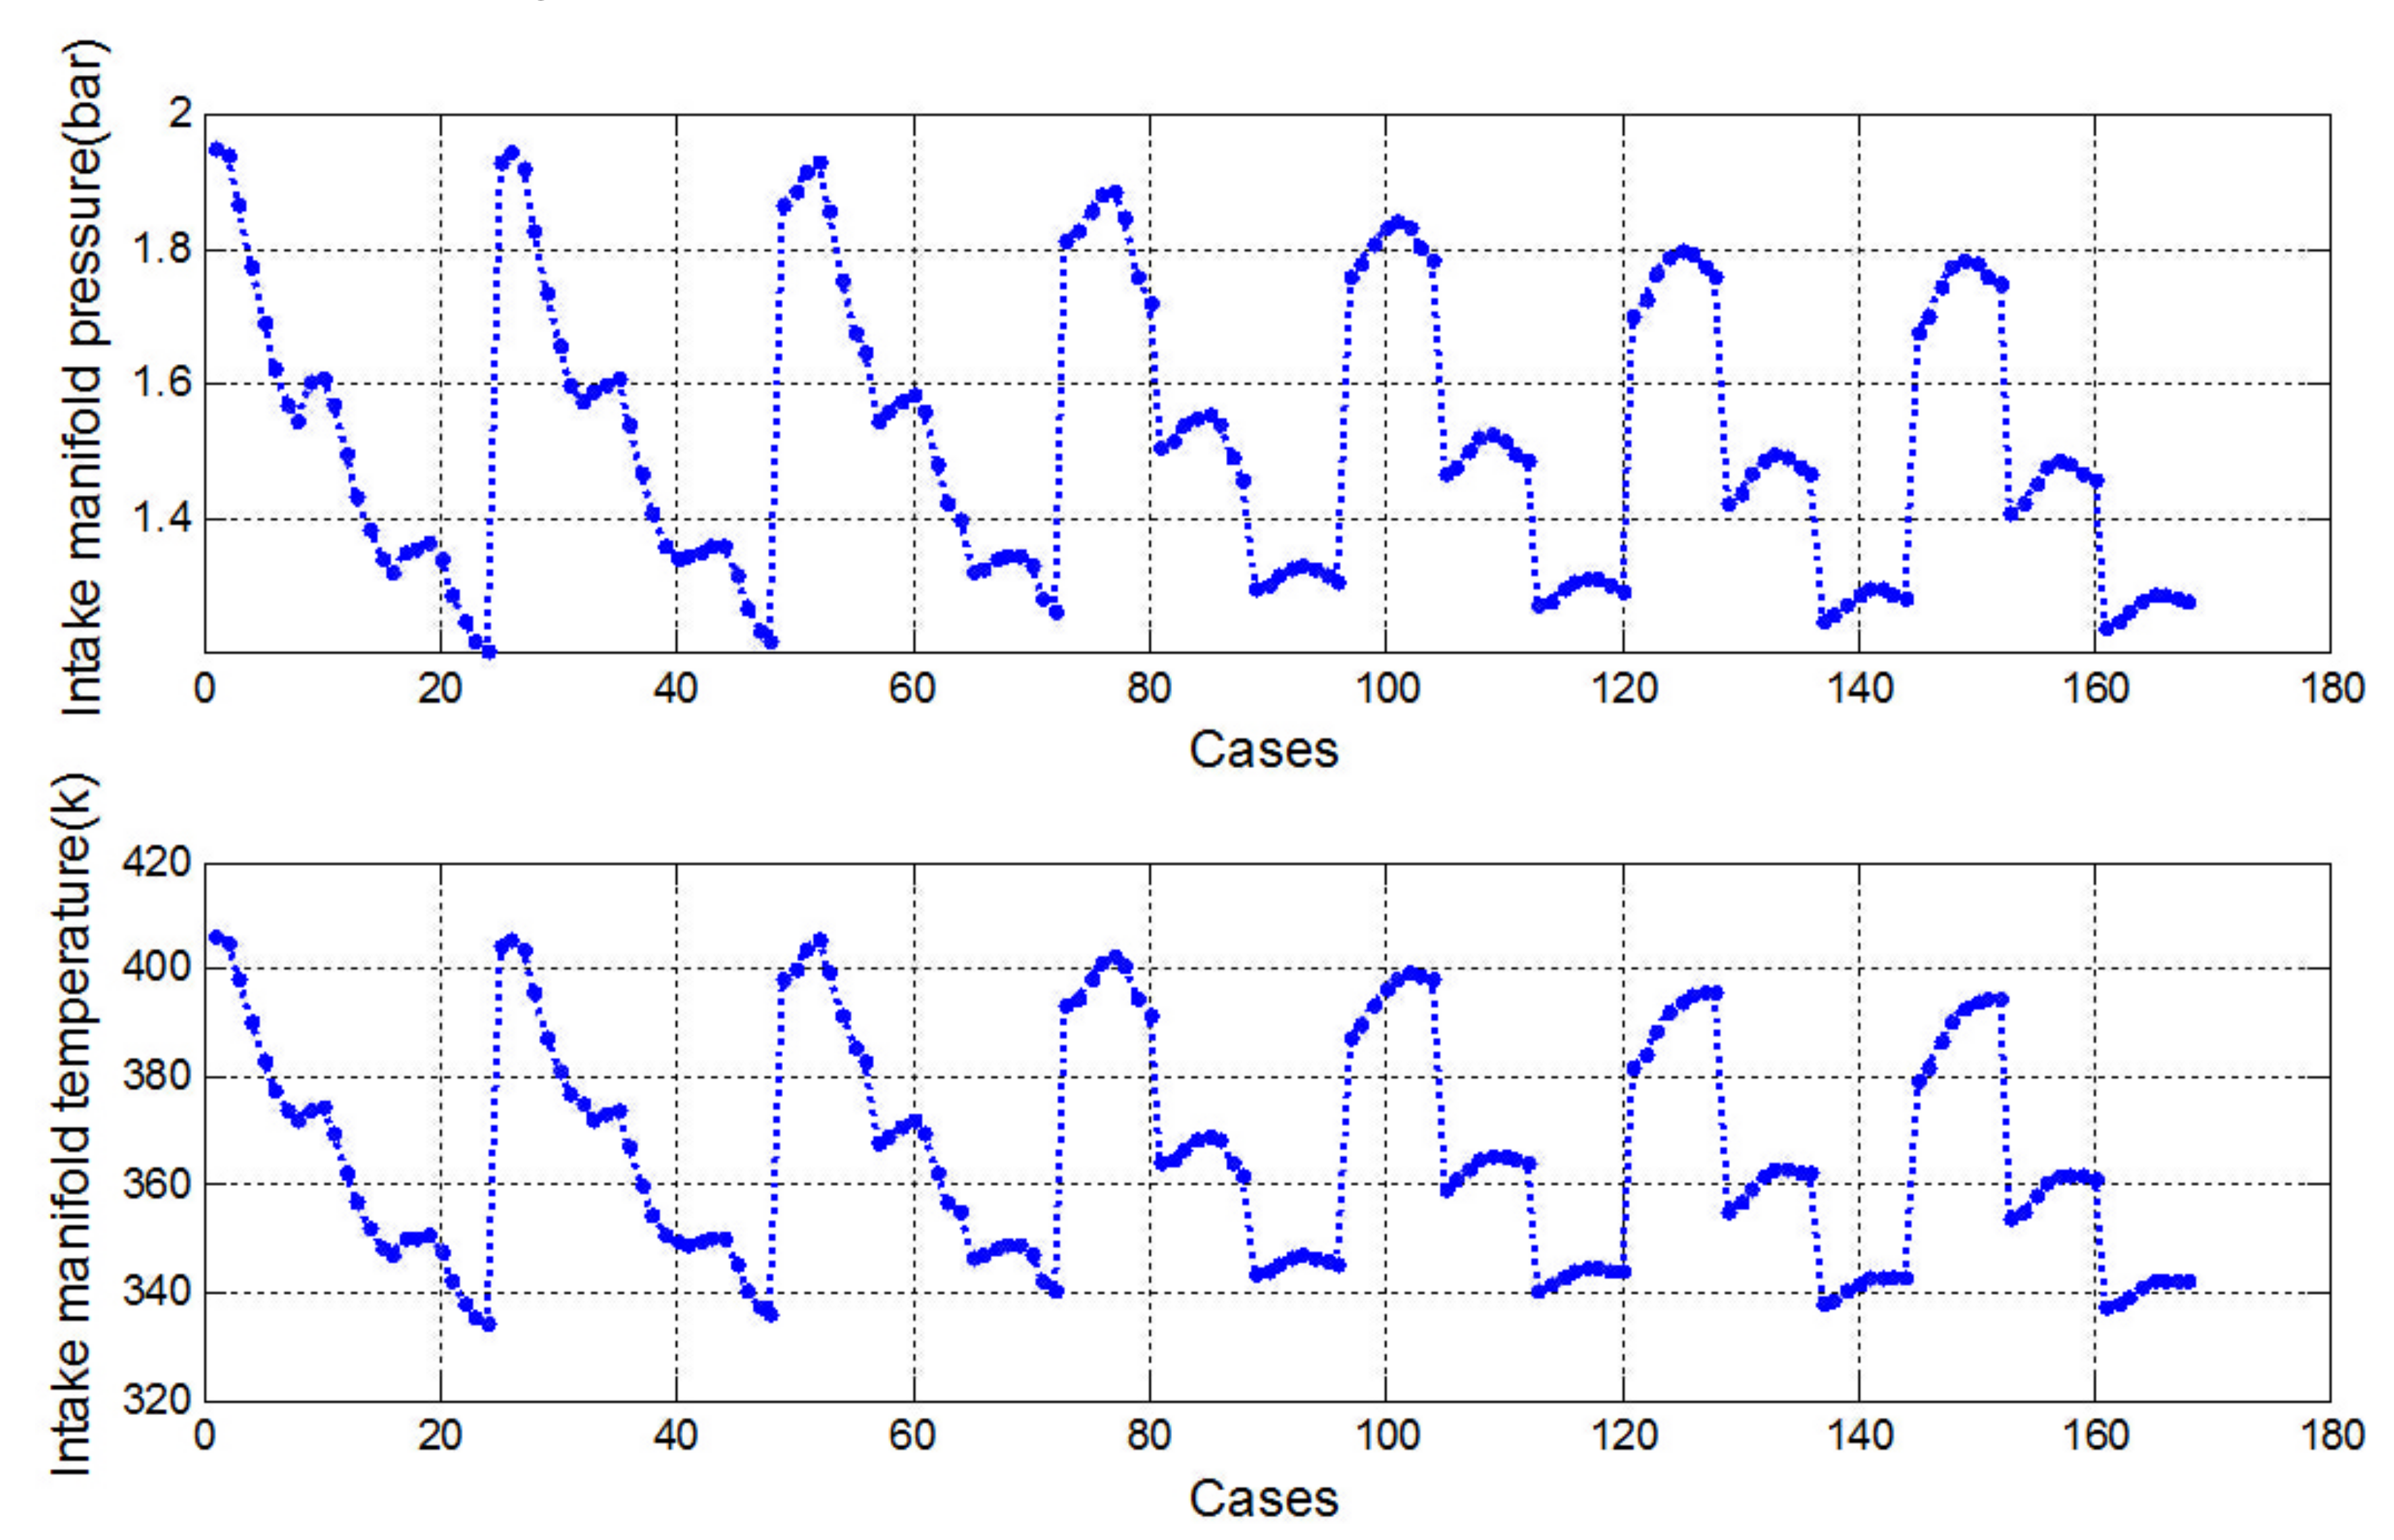
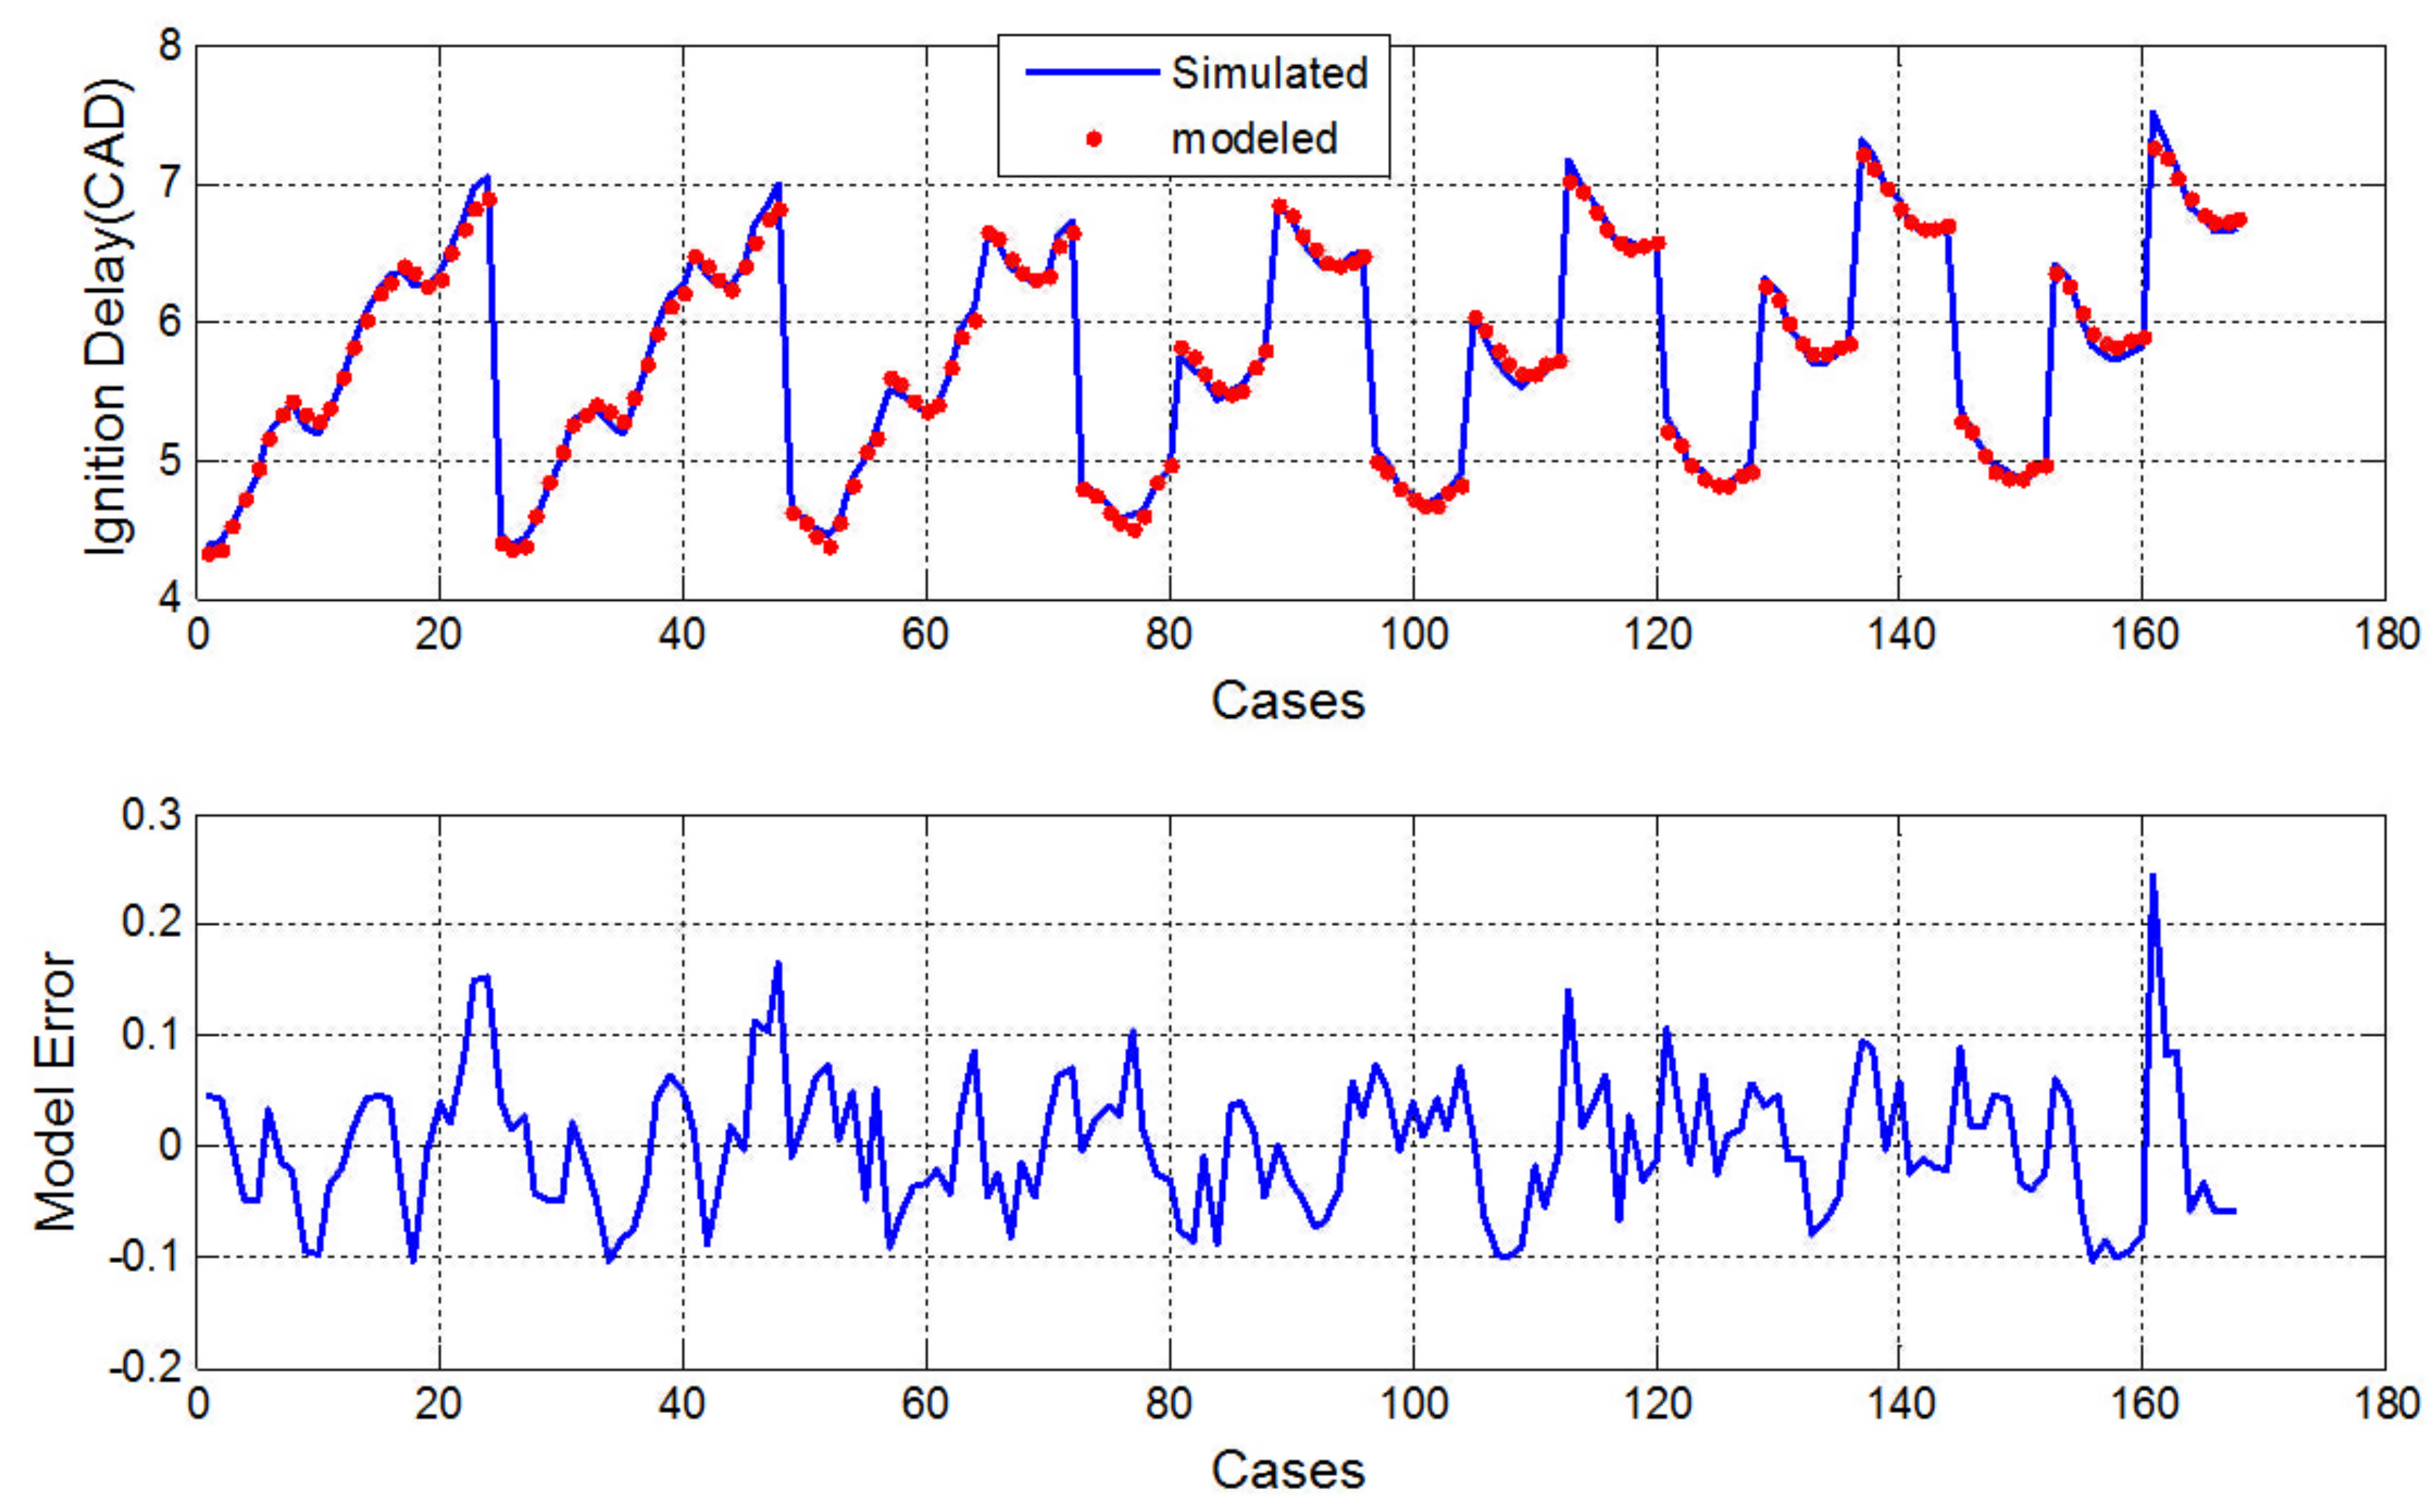
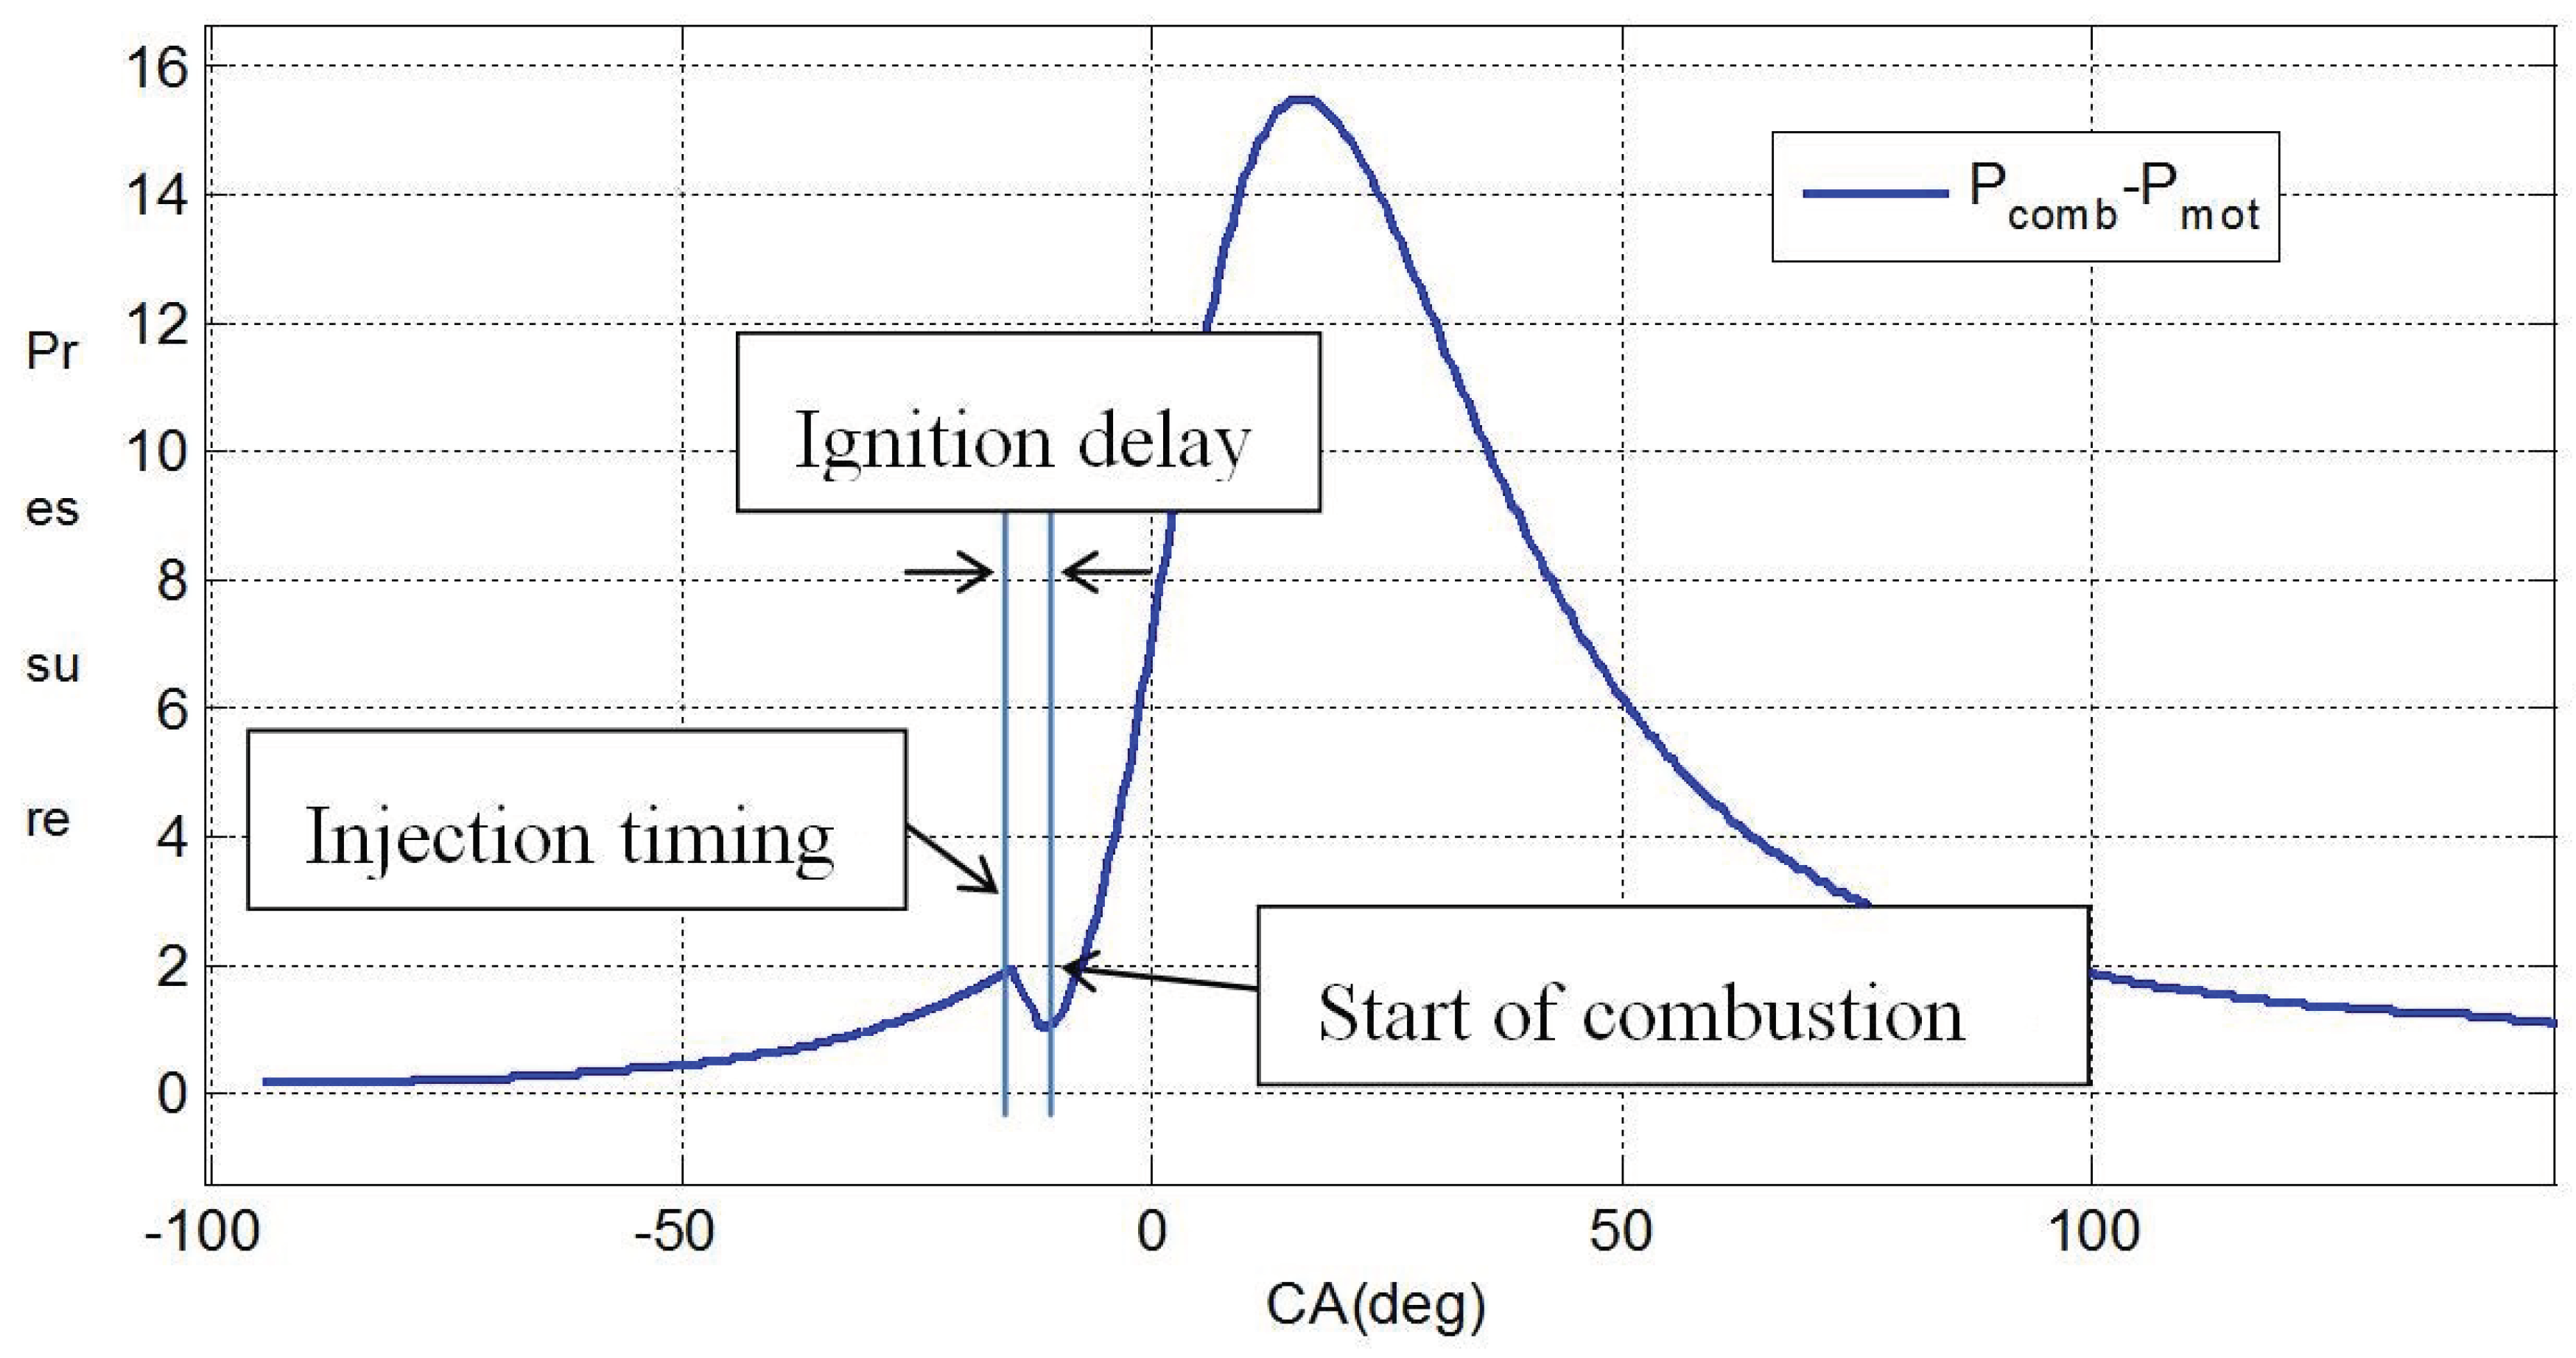
For validating the model, a transient case is simulated. The engine runs from cold start for 250 cycles with continuous changing of EGR valve and injection mass. The operating conditions are shown in Figure 5.
By applying the calibrated model (Equation (17)), the modeled ignition delay is plotted in Figure 6.
As one can see from Figure 6, the ignition delay can be well captured by the proposed model and the error is within 0.2 CA degrees, which shows well consistency with the calibration part.

3.3. Pressure Trace

During the ignition delay period, the process of vaporization and atomization of the fuel will bring influence on the in-cylinder pressure. This phenomenon can be clearly observed in the pressure trace. By taking the difference between the combusted pressure and the motored pressure, the injection timing, ignition delay, and start of combustion are distinctly demonstrated in Figure 7.
Thus, the ignition delay can be obtained from pressure trace (which can be measured using physical sensors), and combining with other measurable parameters used in Equation (17), the ICOC can be calculated accordingly.
Usually, the ignition delay is within a range of 10 CA degrees, such short period means the sampling rate of the pressure sensor is of critical importance. A stair effect may appear if the sampling rate is too low. The effect of the pressure sampling rate on the reconstructed ignition delay is simulated and shown in Figure 8.
Figure 8 shows the comparisons of the simulated and reconstructed ignition delay by utilizing the pressure difference (as detailed in Figure 7) with different sampling rates. The pressure is sampled every 1 CA degree in Figure 8a, while the Figure 8b is with a 0.5 CA degree sampling rate. As one can see, if the sampling interval for the pressure is as long as 1 CA degree, it can lead the resolution of the reconstructed ignition delay too low to capture small changes. Although the shorter the pressure sampling interval the better, an ultra-quick sampling rate may bring noise (if sensor filter is not applied). Figure 8b tells, the ignition delay reconstructed by pressure trace with a sampling interval of 0.5 CA degrees has an error around 0.3 CA degree (half of the sampling interval) which is sufficient for calculating the ICOC and is also achievable for commercial pressure sensors. Therefore, the following data association algorithm is derived based on 0.5 CA degree pressure sampling rate.
Similarly, since the ICOC obtained by the ignition delay model will serve as a special measurement for the following estimation strategy, it is called the “virtual measurement” comparing to the “dynamical model” in Section 2.

4. Data Fusion Algorithm

Combining the “virtual measurement” with the “dynamical model”, a predictor-corrector fashion estimation algorithm is established. Considering the “dynamical model” is linear, a Kalman filter is utilized, and the ICOC can be estimated in an optimal way in the Bayesian sense. Thus, the measurement equation (Equation (15)) turns to be,
Y ( k ) = 1 0 0 0 1 0 0 0 1 H ¯ Φ i n t ( k ) Φ e x h ( k ) Φ ¯ c y l ( k )
where, H ¯ is the measurement matrix, and Φ ¯ c y l is the virtual measurement calculated by inversing Equation (17).

Kalman Filter Design

A Kalman filter consists of 6 steps,
1.
State predicting,
Φ ^ i n t ( k + 1 , k ) Φ ^ e x h ( k + 1 , k ) Φ ^ c y l ( k + 1 , k ) = A ( ρ ( k ) ) Φ ^ i n t ( k , k ) Φ ^ e x h ( k , k ) Φ ^ c y l ( k , k ) + B ( ρ ( k ) )
2.
State covariance predicting,
S ( k + 1 , k ) = A ( ρ ( k ) ) S ( k , k ) A ( ρ ( k ) ) T + Q
3.
Covariance innovation,
N ( k + 1 ) = R + H S ( k + 1 , k ) H T
4.
Filter gain,
G ( k + 1 ) = S ( k + 1 , k ) H T N ( k + 1 ) 1
5.
State estimation updating,
Φ ^ i n t ( k + 1 , k + 1 ) Φ ^ e x h ( k + 1 , k + 1 ) Φ ^ c y l ( k + 1 , k + 1 ) = Φ ^ i n t ( k + 1 , k ) Φ ^ e x h ( k + 1 , k ) Φ ^ c y l ( k + 1 , k ) + G ( k + 1 ) Y ( k + 1 ) H Φ ^ i n t ( k + 1 , k ) Φ ^ e x h ( k + 1 , k ) Φ ^ c y l ( k + 1 , k )
6.
State covariance updating,
S ( k + 1 , k + 1 ) = A ( ρ ( k ) ) S ( k + 1 , k ) A ( ρ ( k ) ) T + Q

5. Simulation Validation

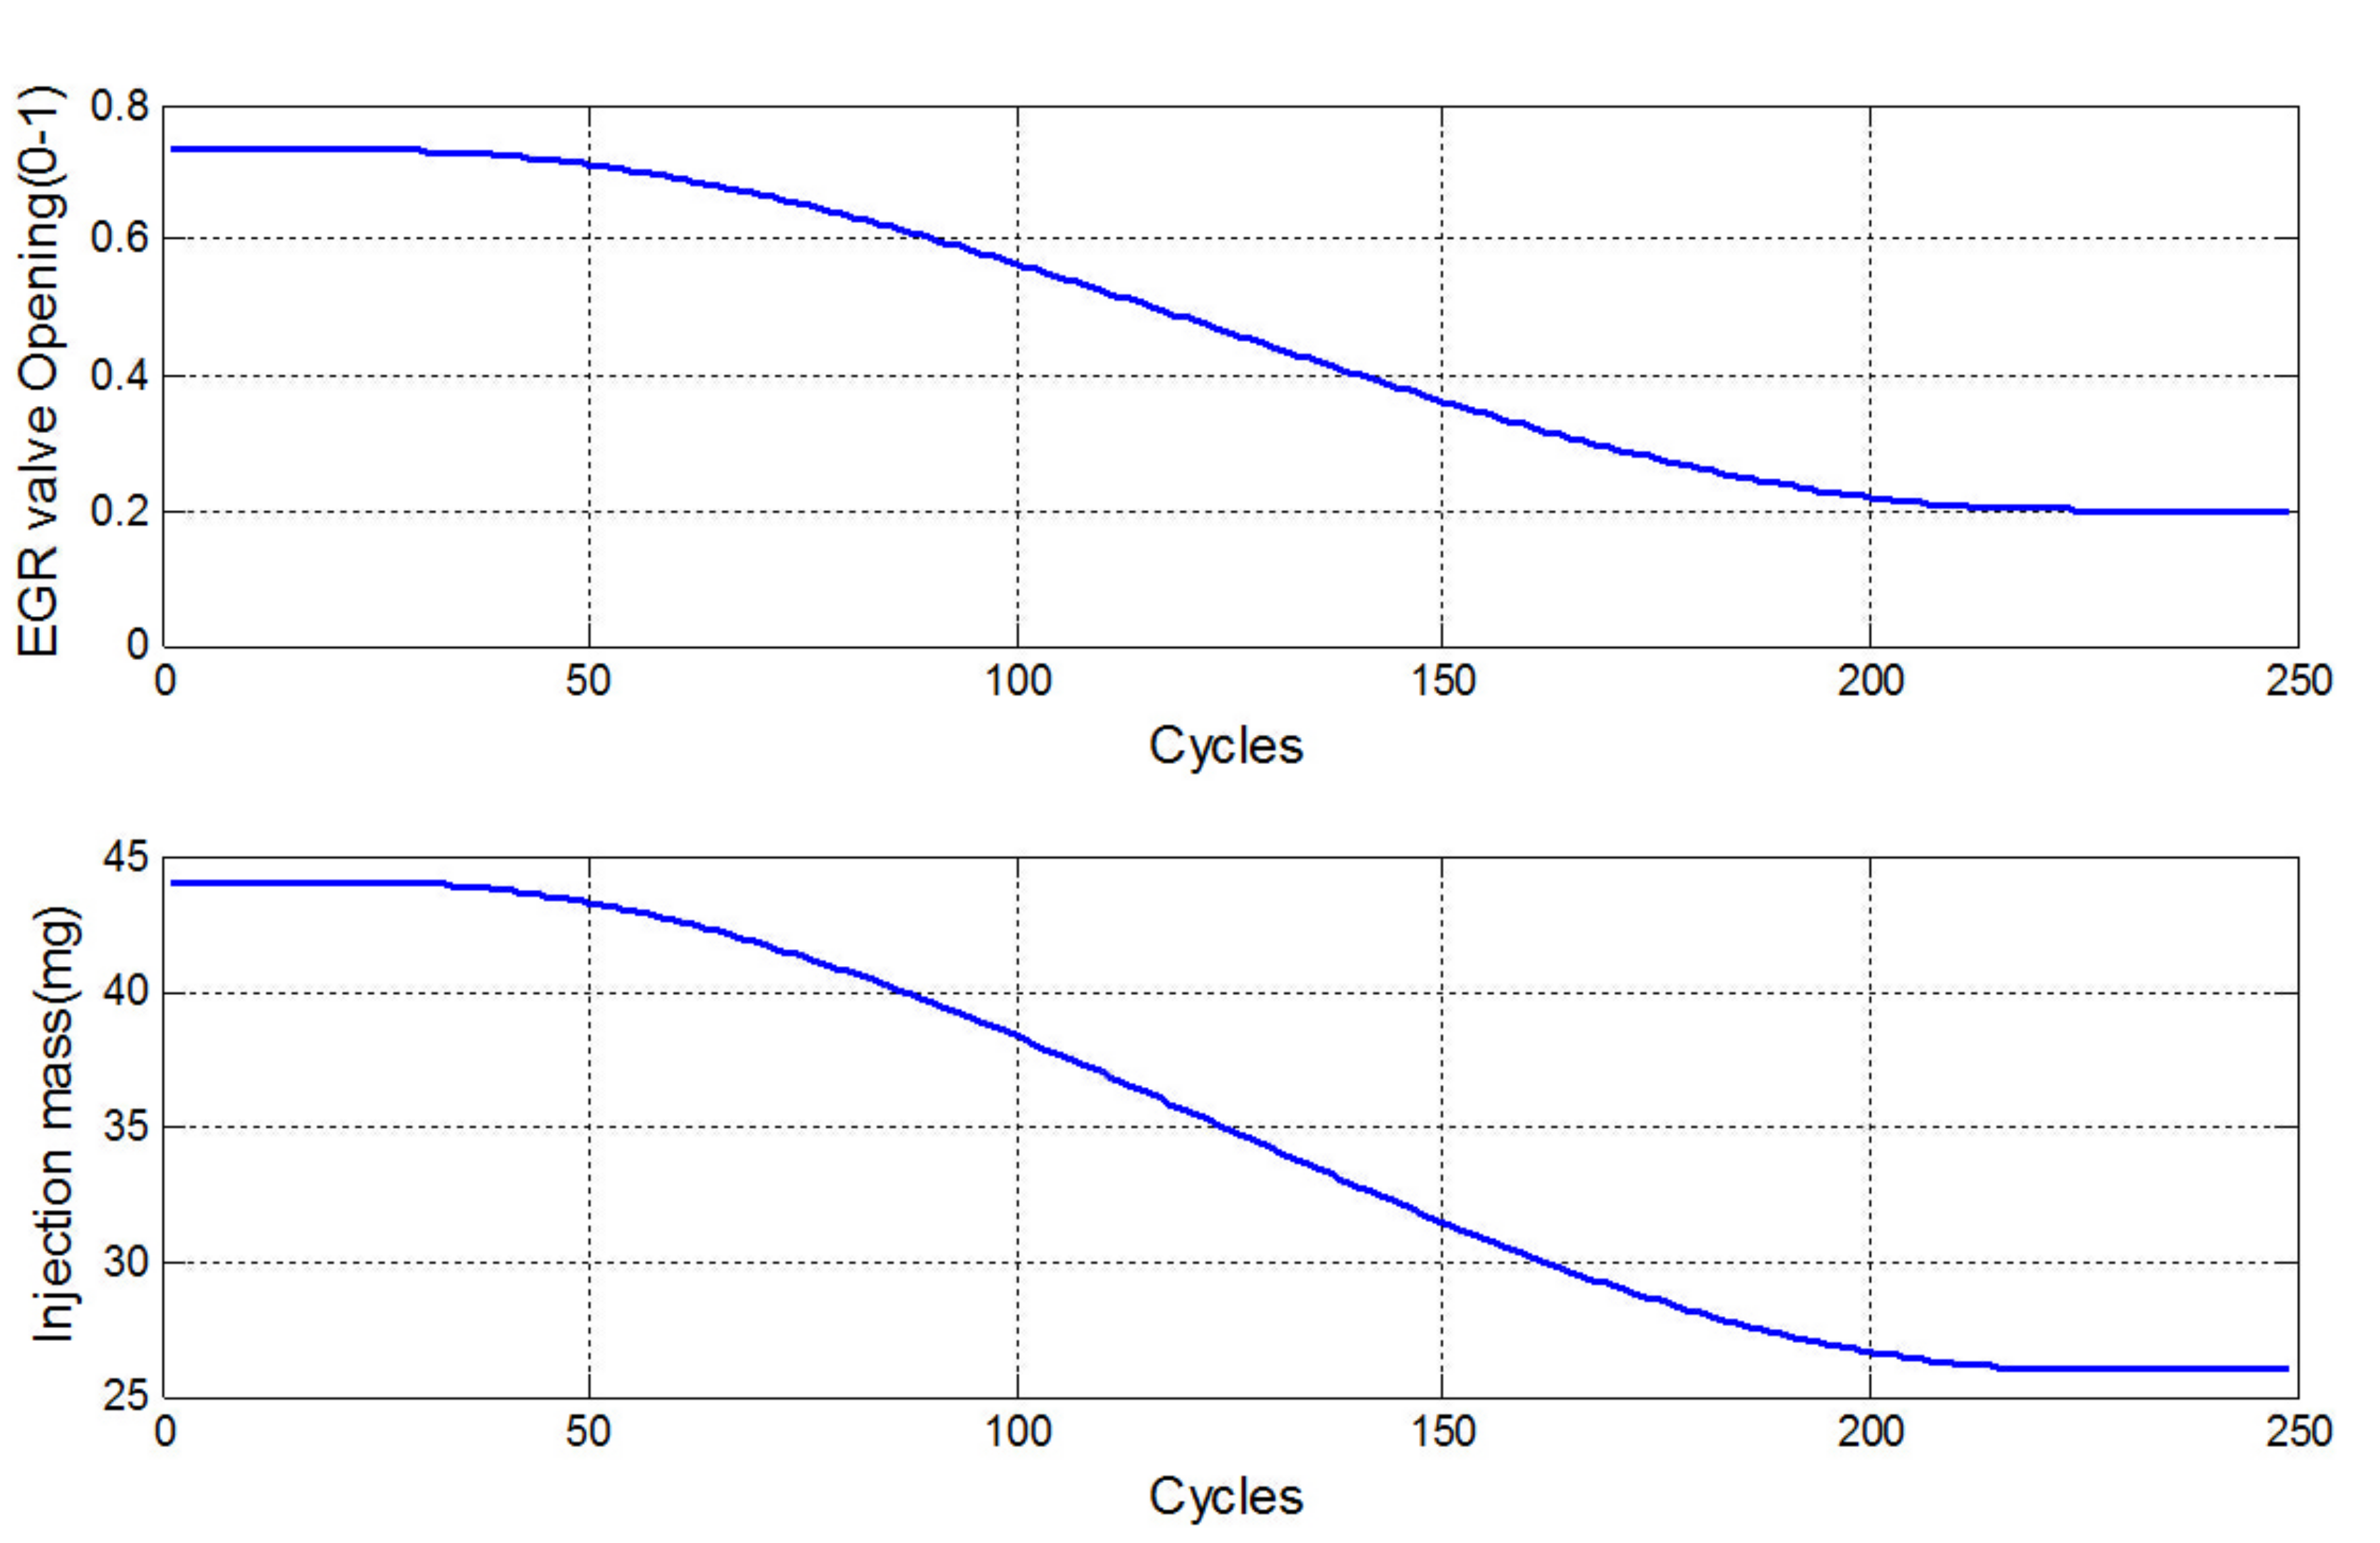
5.1. Simulation Settings

As mentioned in Section 2, several gas-mass uncertainties can contaminate the performance of the dynamical model, including the inaccuracy of the speed-density equation, the imperfect VGT equation and maps and so on. As a key factor for engine efficiency calculation, the volumetric efficiency is pressure- and temperature-varying and hard to be measured accurately. Therefore, in the following simulations, the inaccurate volumetric efficiency is selected to demonstrate the effect of the gas-mass uncertainties on the dynamical model. The uncertainty level is set as 10% for simulation.
As for the virtual measurement, it is more robust for the reasons that: (1) the main variable is the in-cylinder pressure difference (between the combusted and motored pressure) which means it resists the pressure drift brought by sensor weariness and ageing; (2) all other requested information can be measured by physical sensor rather than by looking up maps. However, the model error and the stair effect caused by low sampling rate (seeing Figure 8b) should not be ignored. The pressure sampling rate is set as 1 per 0.5 CAD and the measuring error levels are set as No (no drift), and 10% drift in the following simulations.
A serial of simulations with scenarios of medium-load, cold start, 4-cylinder diesel engines are conducted. The operating conditions are the same with the model validation subsection in Section 3, as detailed in Figure 5.

5.2. Covariance Matrices

The covariance matrices Q , R , need to be adjusted accordingly for different situations. Since the Q represents the internal property of the dynamic model, it has little relationship with the measurement. Thus, Q and R can be tuned separately.
For Q , when there is no gas mass uncertainties, it is tuned as,
Q = 0.01 2 0 0 0 0.01 2 0 0 0 0.01 2
If the volumetric efficiency is inaccurate, then it will affect the correlation between the Φ i n t ( k ) and Φ c y l ( k ) , as shown in Equation (14). Taking the error of the volumetric efficiency (i.e.0.1) into Equation (14), Q is finally tuned as,
Q = 0.02 2 0 0.01 2 0 0.01 2 0 0.01 2 0 0.02 2
For R , assuming physical sensors are independent, if the virtual measurement is not applied, it is tuned as,
R = 0.01 2 0 0 0.01 2
If the virtual measurement is added on the system, since the virtual measurement is obtained from the virtual sensor (the inverse of the ignition delay model, Equation (17)), it is reasonable to assume it is independent on the physical oxygen sensors. For the virtual sensor with a error of 10% drift, the R turns to be,
R = 0.01 2 0 0 0 0.01 2 0 0 0 0.1 2
Applying different Q and R , different simulation scenarios can be implemented as follows.

5.3. Simulation Scenarios

To validate the proposed method comprehensively, 2 scenarios with diffident operating conditions are simulated. Figures that showing the performances of dynamical model based method, the virtual measurement based method, and the data fusion method (data fusion of the dynamical model and the virtual measurement method) with different combinations of uncertainties are summarized in Table 1.
Scenario I, with no gas mass uncertainties and various ignition delay model errors.
This scenario demonstrates the situations when there are no gas mass uncertainties (perfect knowledge for the dynamical model) and various errors of measuring model (imperfect knowledge for the virtual measurement).
Figure 9 shows the performance of the dynamical model based method when there are no uncertainties. The 2 main remarks can be found in Figure 9: (1) At cold start state, the estimation results are rather poor (roughly (−0.05, 0.05)) due to the inevitable pressure and temperature fluctuation on this engine state. (2) At steady state, the estimation results tracks the simulation value well with the error less than 0.01.
Figure 10 shows the performance of the virtual measurement. Remarks can be found as: (1) At cold start state, the error is improved from (−0.05, 0.05) to (0, 0.025). (2) At steady state, the stair effect damages the performance to some extent, but the overall error is much less than 0.01 (roughly (−0.005, 0.005)).
Compare Figure 9 and Figure 10, the results prove that the virtual measurement can promote the robustness (insensitive to cold start state and steady state) and the overall accuracy even with relatively large model error.
Scenario II, with gas mass uncertainties and various ignition delay model errors.
This scenario tests the performance of the data fusion method when the common gas mass errors (represented by the inaccurate volumetric efficiency) and large virtual measurement error exist.
Figure 11 and Figure 12 shows the simulation results for both methods.
Figure 11 shows that due to the inaccuracy of the volumetric efficiency, the dynamical model cannot estimate the ICOC accurately, the convergence cannot even be guaranteed. The estimation error is about (−0.05, 0.05) at cold start state, and (0, 0.03) at steady state, which is unacceptable for ICOC with a range from 12% to 23%.
Although Figure 12 represents the performance of the data fusion method. Even there are 10% volumetric efficiency uncertainty and 10% of model error of the virtual measurement, the ICOC can still be accurately estimated. The estimation error is about (−0.01, 0.01) at cold start state and is roughly (0, 0.005) at steady state, which is much better than the dynamical model.
To be noted, the data fusion method is also much better than by only applying the virtual measurement. More specifically: (1) At cold start state, the error is reduced from (0, 0.025) to (−0.01, 0.01). (2) At steady state, the error is reduced from (−0.005, 0.005) to (0, 0.005).

6. Conclusions

In this paper, a novel approach for ICOC estimation of diesel engines is proposed. The commonly happened uncertainties of gas mass can easily contaminate the accuracy of the ICOC estimated by mass flow based method (dynamical model). To overcome it, the concept of virtual measurement is introduced. Virtual measurement means treating the modeled or mapped immeasurable variable, the in-cylinder concentration in this paper, as a special measurement to directly correct its prediction by dynamical model. For further improve the estimation accuracy and robustness, a data fusion algorithm based on Kalman filter is presented. Analysis and simulation confirms that, by applying the virtual measurement and the data fusion algorithm, the ICOC estimation results show stronger robustness and higher accuracy than conventional method. More specific conclusions are listed as follows:
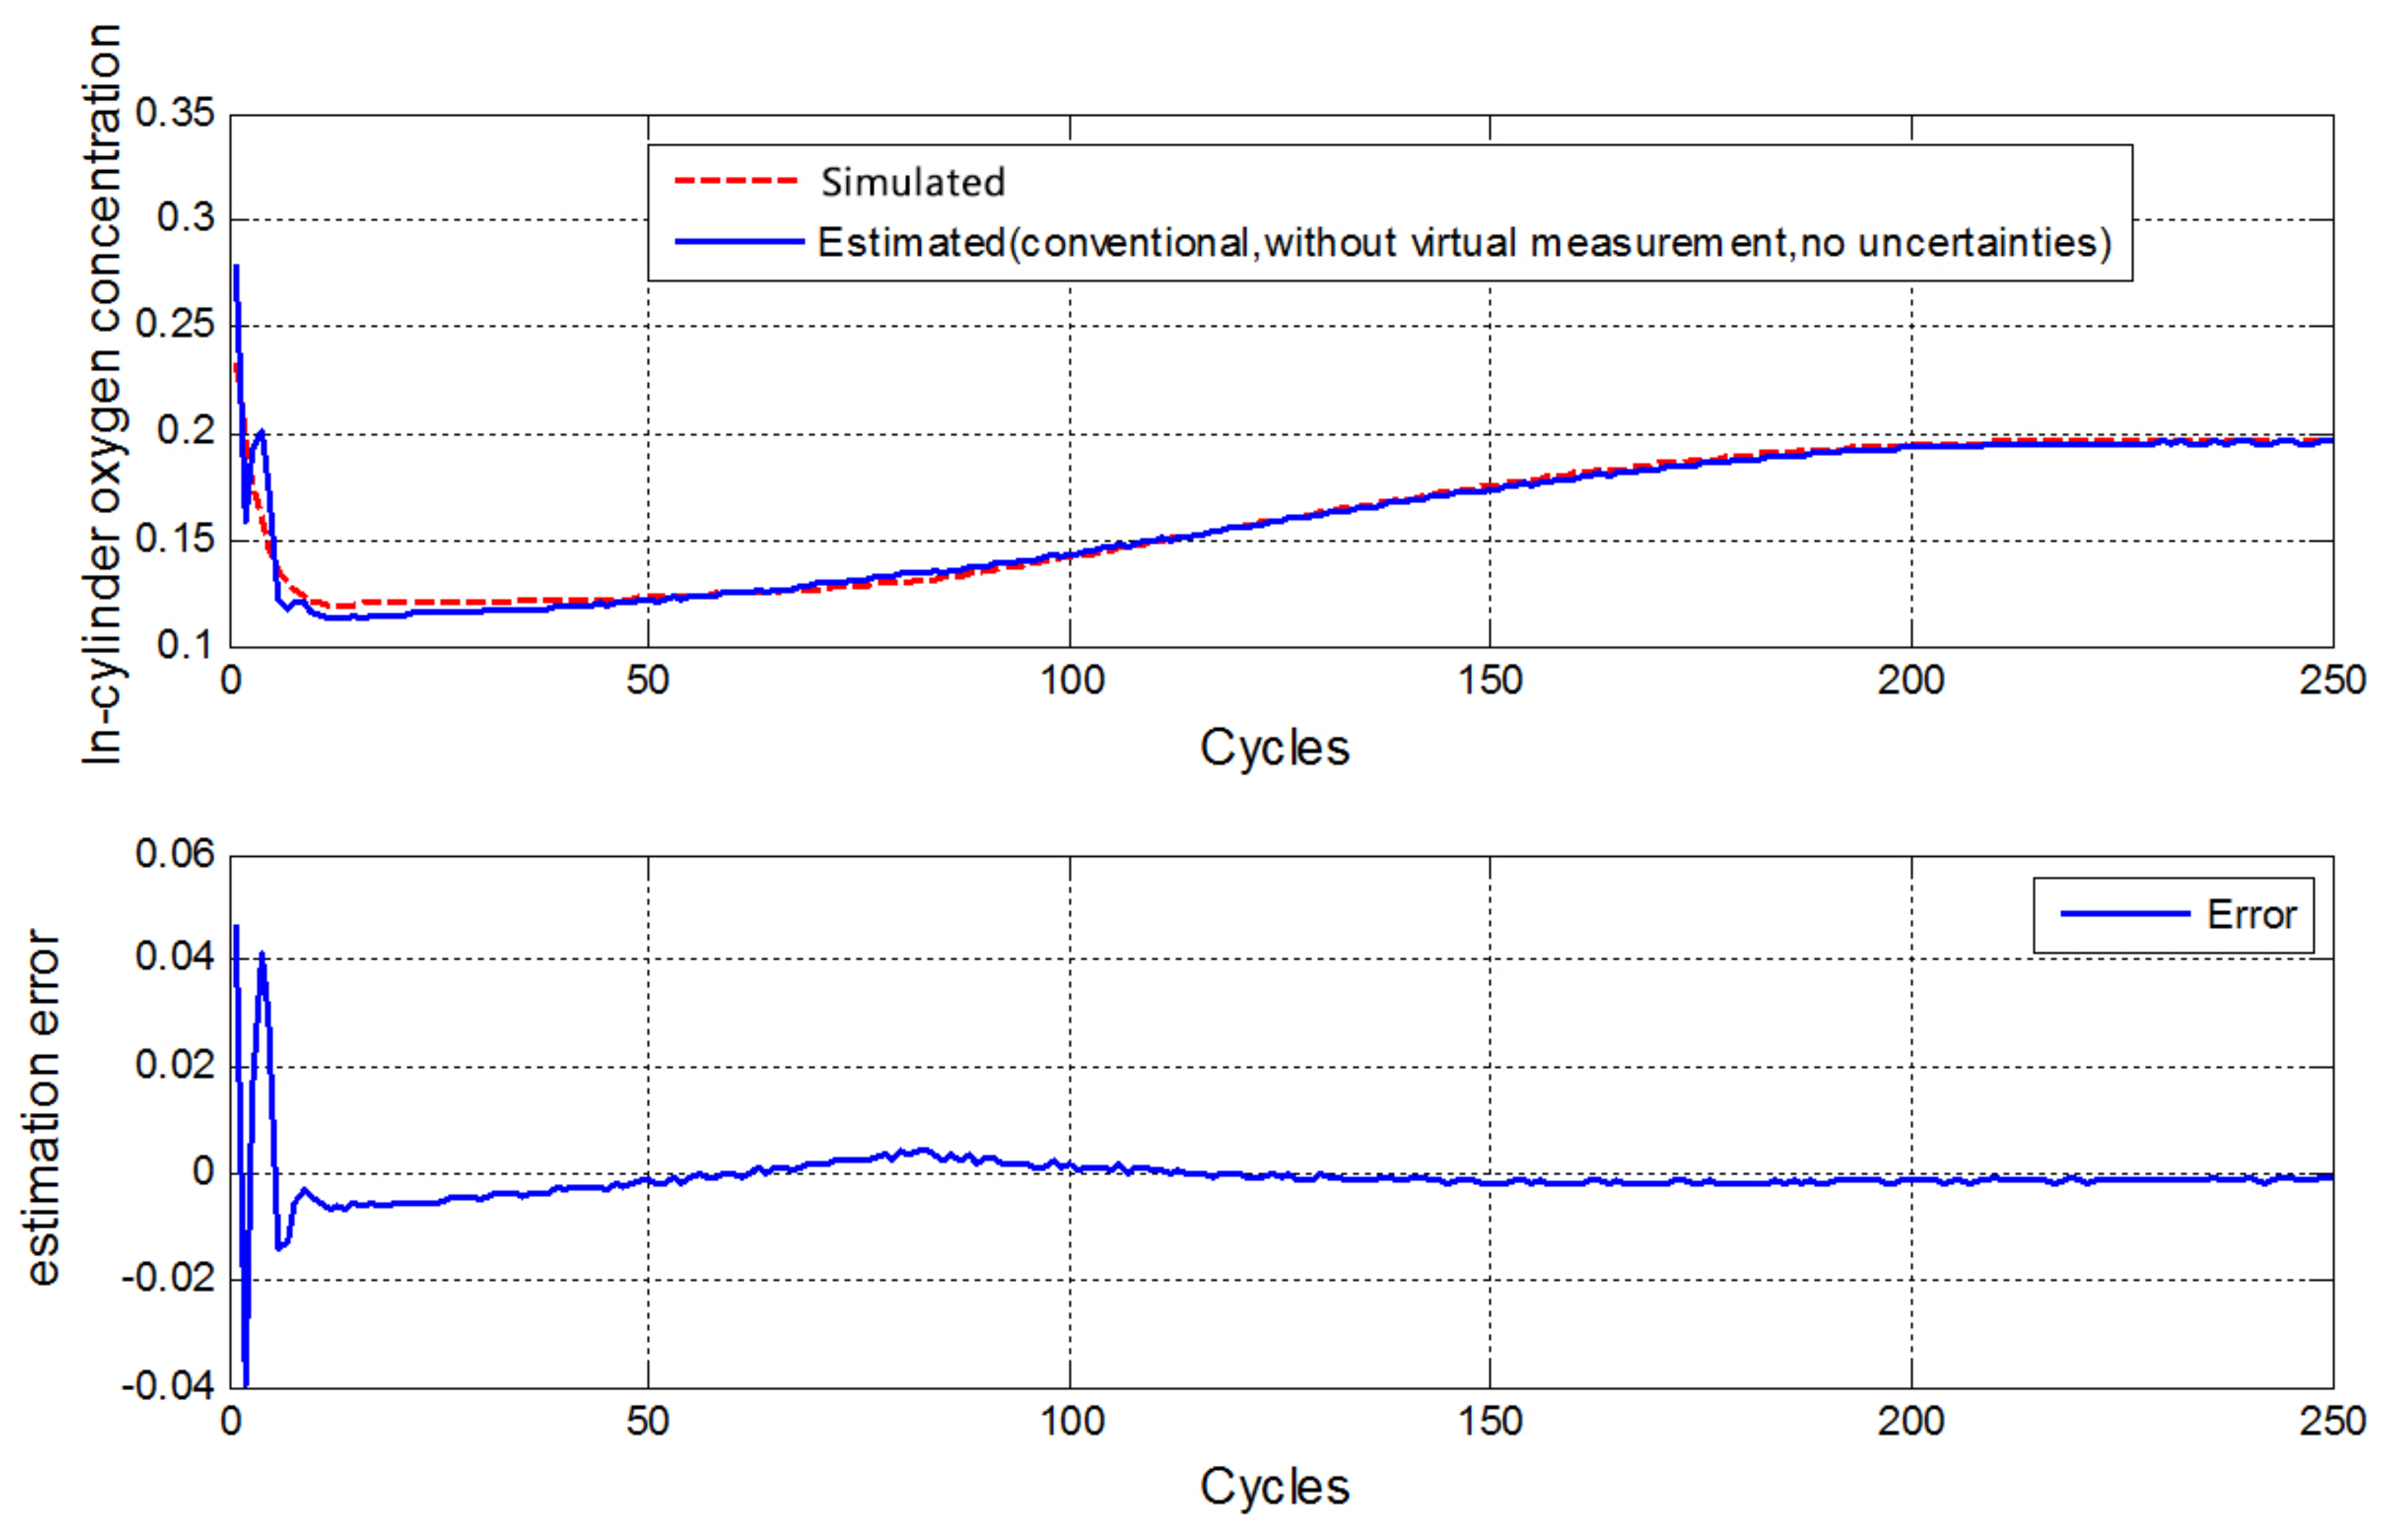
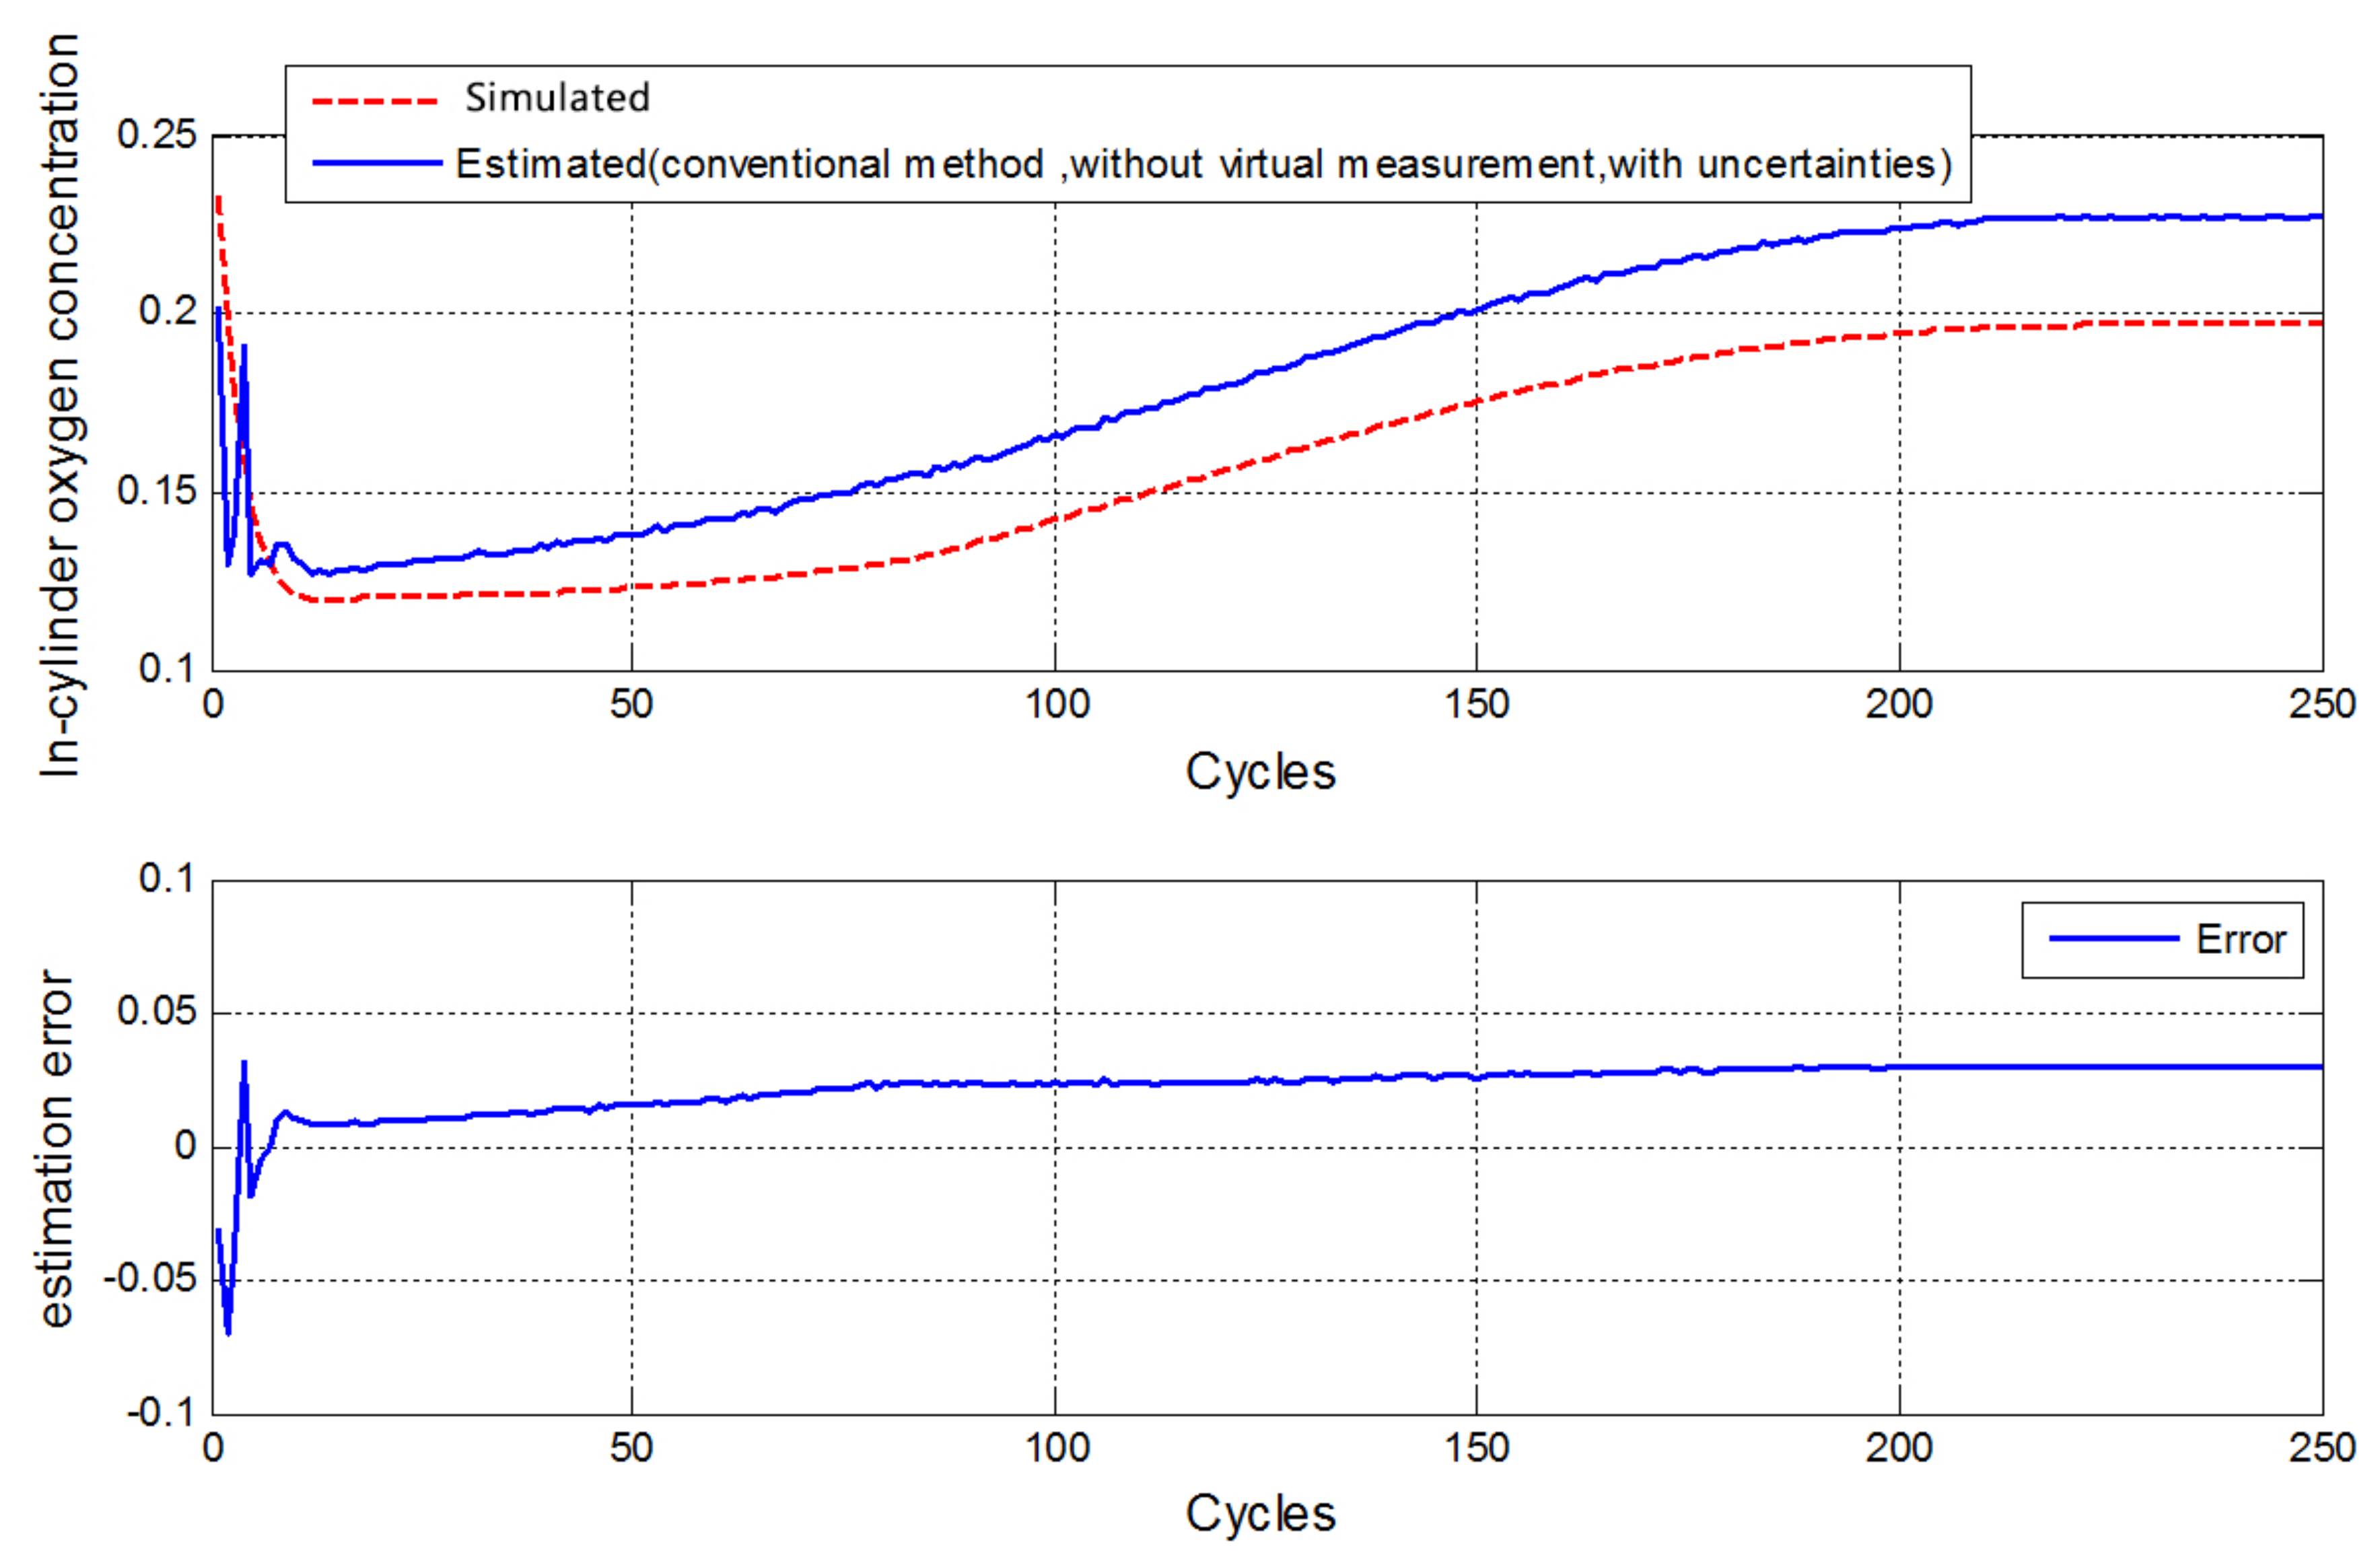
  • The dynamical model is sensitive to gas mass uncertainty and in-cylinder temperature and pressure. With no gas mass uncertainty, it can estimate ICOC finely at engine steady state, but poorly at cold start state. Whereas, with gas mass uncertainty, the estimation results becomes poor even at steady state;
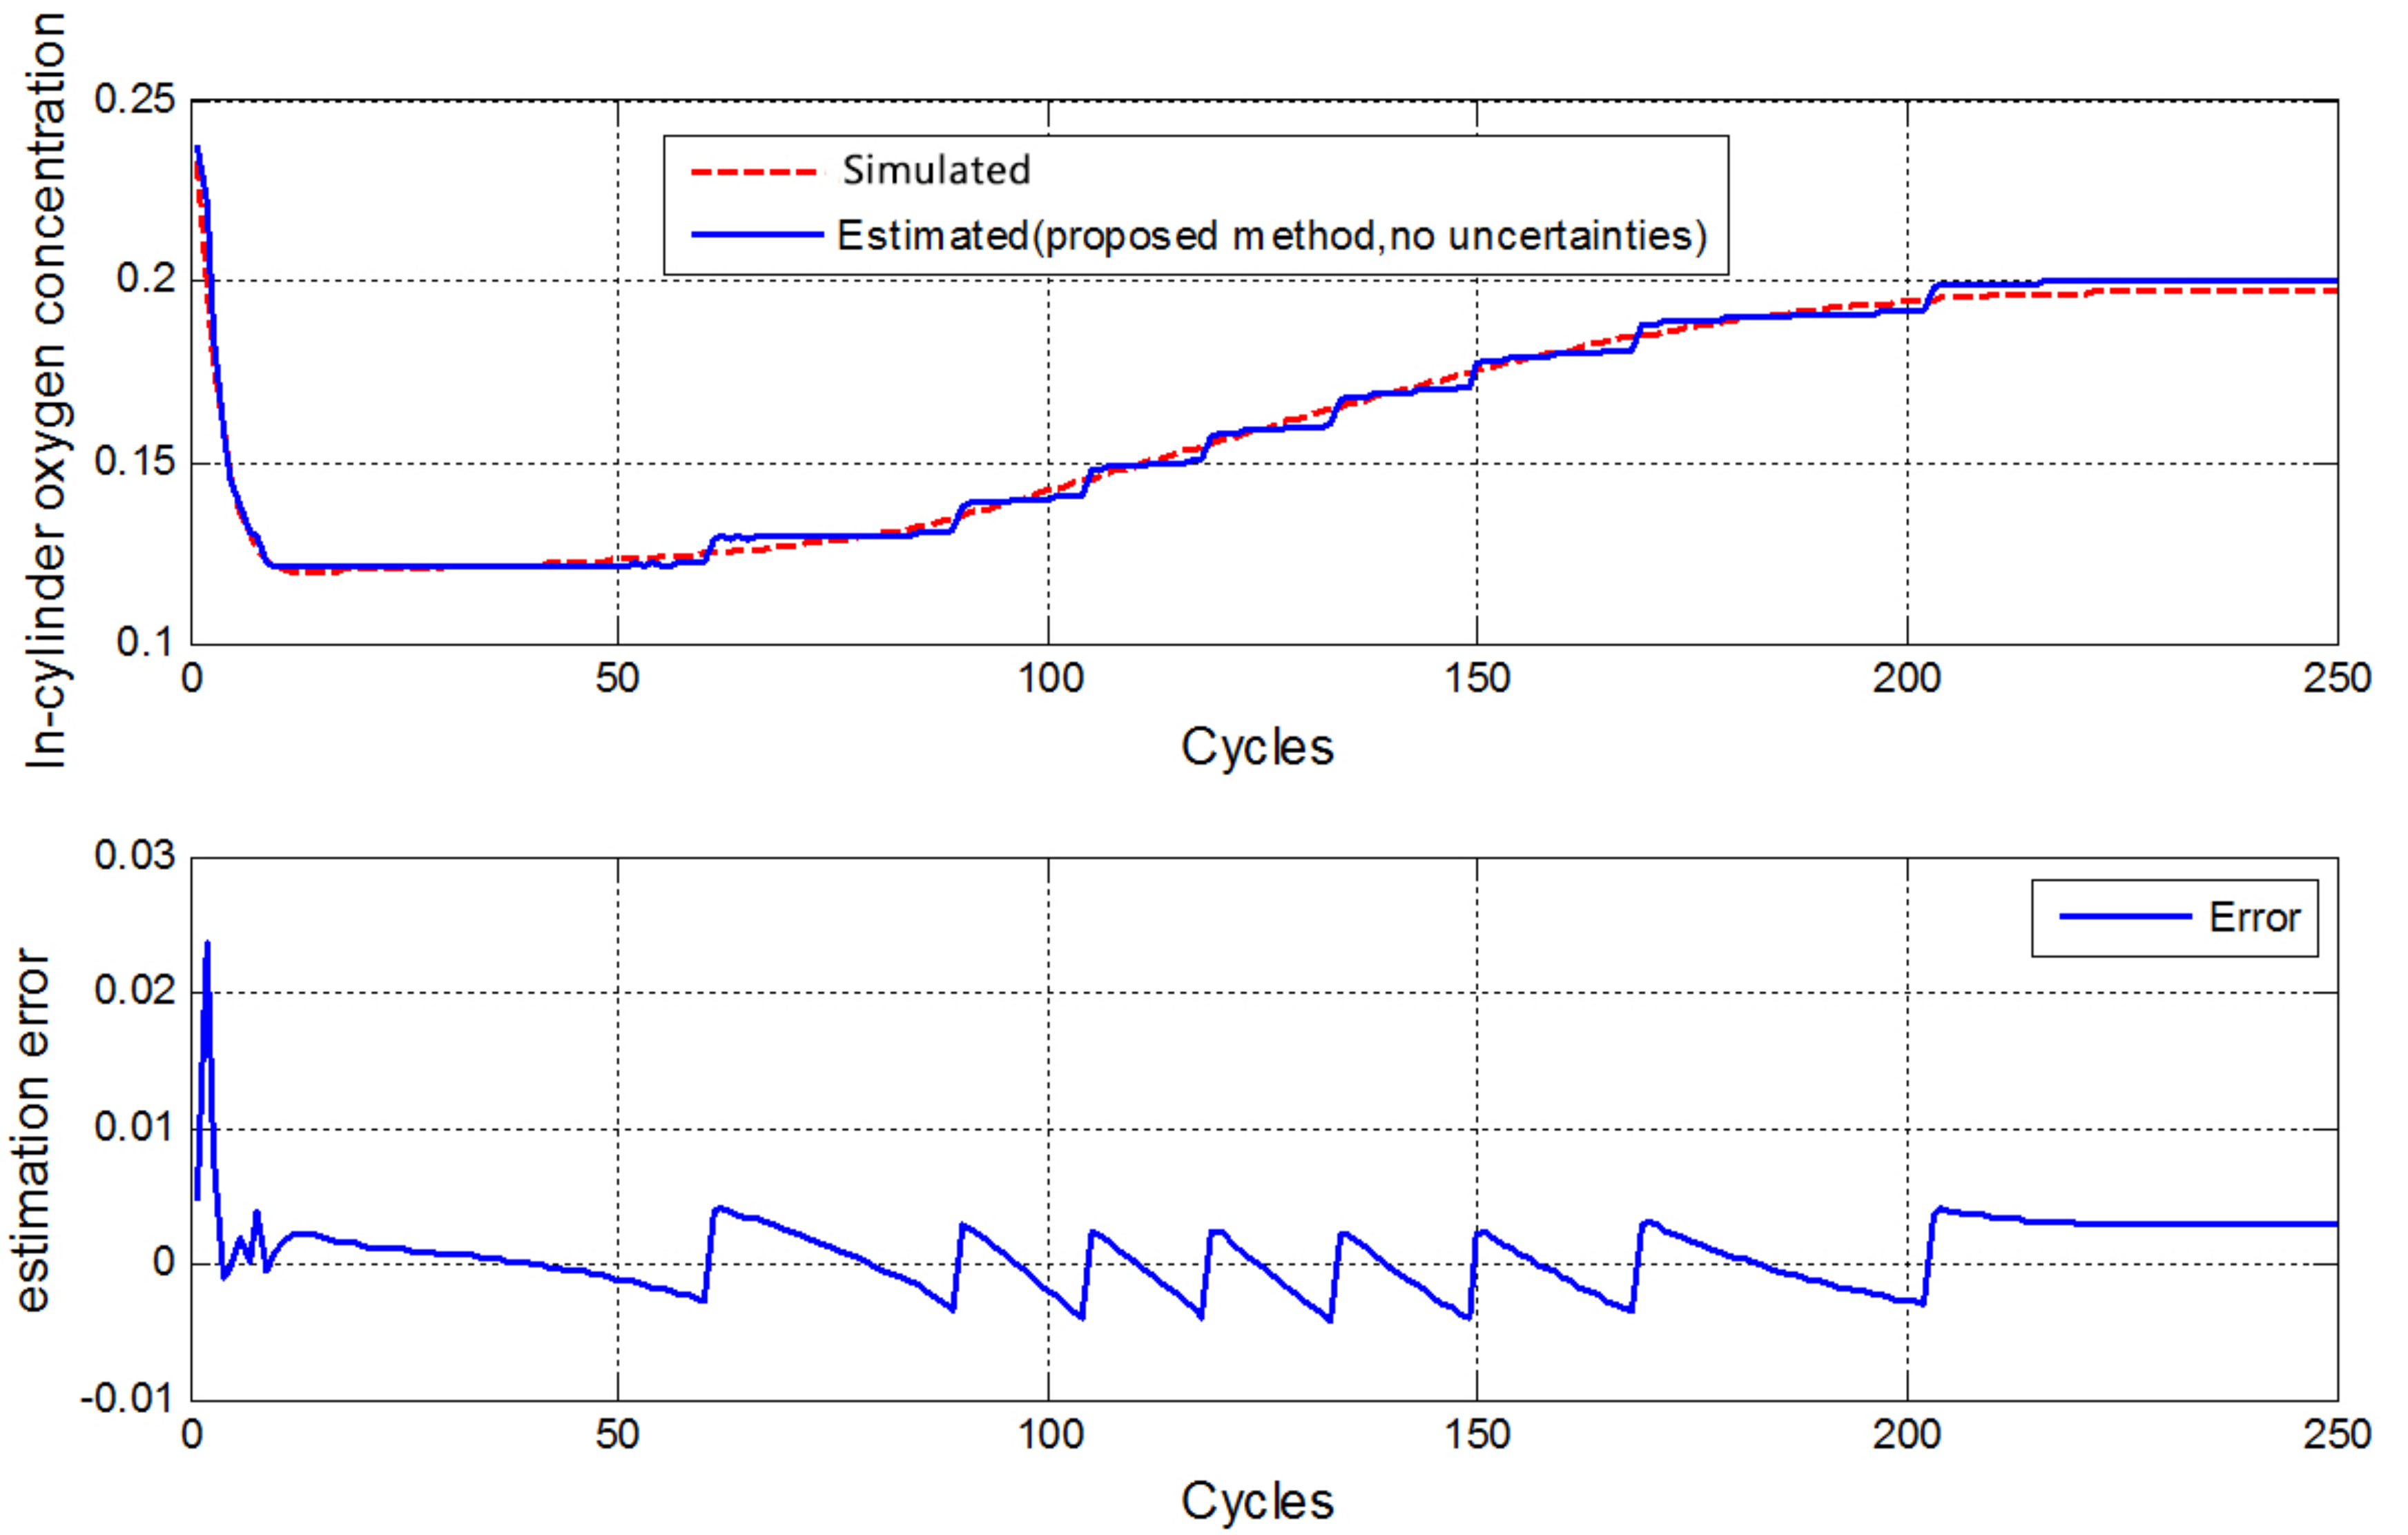
  • The virtual measurement, is insensitive to gas mass uncertainty and model error. With 10% model error, it can estimate ICOC with a error within (−0.005, 0.005) at steady state, and a error within (0, 0.025) at cold start state;
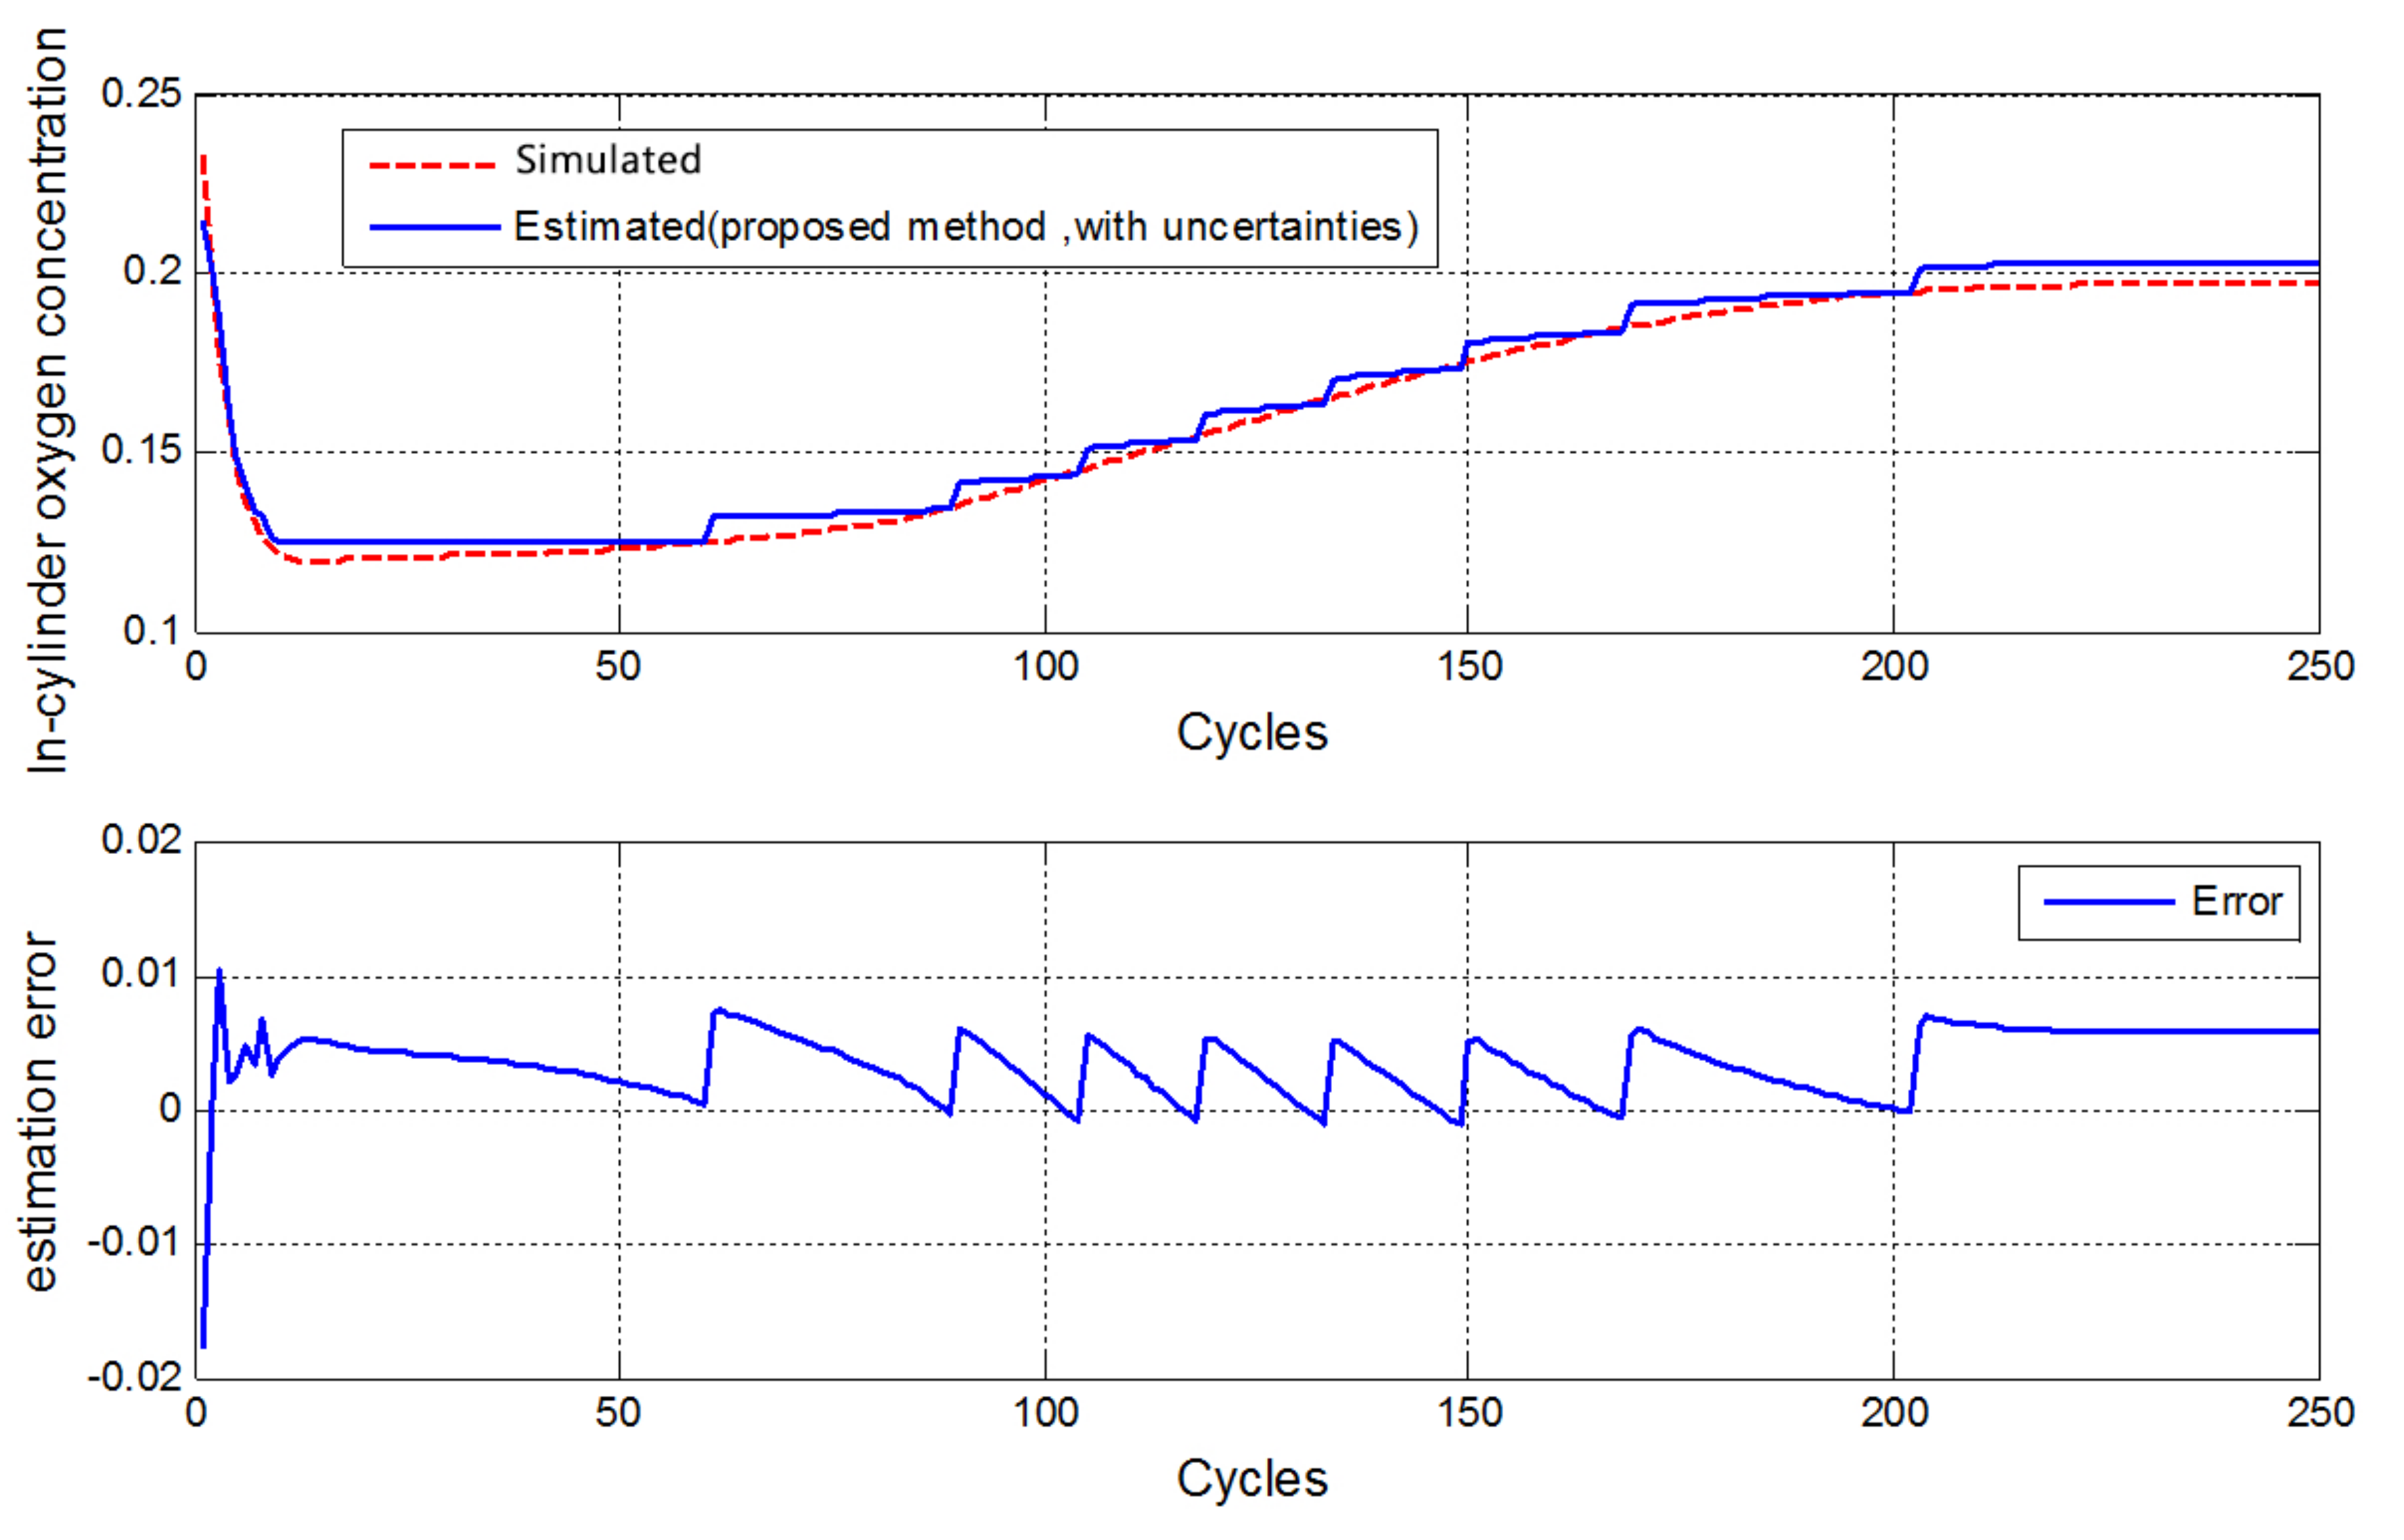
  • The data fusion algorithm, presented for correcting the virtual measurement results, further refines the estimation errors to (0, 0.005) at steady state and to (−0.01, 0.01) at cold start state.

Author Contributions

Conceptualization, Q.Z. and B.W.; methodology, B.W.; software, X.Z.; validation, K.W., X.W. and X.Z.; formal analysis, X.Z.; investigation, X.W.; resources, Y.Z.; data curation, Y.Z.; writing–original draft preparation, B.W.; writing–review and editing, B.W.; visualization, X.Z.; supervision, Q.Z.; project administration, Q.Z. All authors have read and agreed to the published version of the manuscript.

Funding

This research received no external funding.

Conflicts of Interest

The authors declare no conflict of interest.

Abbreviations

The following abbreviations are used in this manuscript:
ICOCIn-cylinder oxygen concentration;
HCCIHomogeneous charge compression ignition;
LTDCLow temperature diffusion combustion;
PCCIPremixed charge compression ignition;
RCCIReactivity controlled compression ignition;
VGTVariable geometry turbocharger;
VVTVariable valve timing;
IVCIntake valve closing;
ISSInput to state stable.

Nomenclature

Variables
k , k + 1 Cycle index;
J , N , P Moment of inertial, rotational speed, power, temperature;
R c p Specific heat ratio at constant pressure;
C g a s , C d i s Ideal gas constant, discharge coefficient;
η , γ , π Efficiency, specific heat ratio, pressure ratio;
m , m ˙ Mass, mass rate;
V , V d , A v r Volume, swept volume, valve reference area;
η v , λ s Volumetric efficiency, stoichiometric oxygen fuel ratio;
T , T ¯ , p , p ¯ Temperature, mean temperature, pressure, mean pressure;
Φ Oxygen concentration;
τ i d Ignition delay;
Y , H Measurement equation of oxygen concentrations, measurement matrix;
Q , S , R , N System, state, measurement, innovation covariance;
G Filter gain.
Subscripts
v g t Variable geometry turbocharger;
c o m Compressor;
t u r Turbine;
i n t Intake manifold;
e x h Exhaust manifold;
c y l In-cylinder;
i t c The charge flows from intake manifold to cylinder;
c t e The charge flows from cylinder to exhaust manifold;
r e s Residual gas;
i v c Crank angle at intake valve closing;
fFuel;
i n j Injection;
e g r Exhaust gas recirculation;
a i r Fresh air;
e n g Engine;
dDownstream;
uUpstream.

Appendix A

Details of the A i j and B i j in Equation (14),
A 11 = m i n t ( k ) m i t c ( k ) m i n t ( k ) + m c o m ( k ) m i t c ( k )
A 12 = m e g r ( k ) m i n t ( k ) + m c o m ( k ) m i t c ( k )
A 22 = m e x h ( k ) m t u r ( k ) m e x h ( k ) + m c t e ( k ) m t u r ( k )
A 23 = m c y l ( k ) m c t e ( k ) m c y l ( k ) + m f ( k ) m e x h ( k ) + m c t e ( k ) m t u r ( k )
A 31 = m i t c ( k ) m r e s ( k ) + m i n j ( k ) + m i t c ( k ) m c t e ( k )
A 33 = m c y l ( k ) m c y l ( k ) + m f ( k ) m c y l ( k ) m c t e ( k ) m c y l ( k ) + m f ( k ) m r e s ( k ) + m i n j ( k ) + m i t c ( k ) m c t e ( k )
B 11 = Φ a i r m c o m ( k ) m e g r ( k ) m i n t ( k ) + m c o m ( k ) m i t c ( k )
B 21 = m f ( k ) λ s m c t e ( k ) m c y l ( k ) + m f ( k ) m e x h ( k ) + m c t e ( k ) m t u r ( k )
B 31 = m c t e ( k ) m f ( k ) λ s m f ( k ) λ s m c y l ( k ) + m f ( k ) m c y l ( k ) + m f ( k ) m r e s ( k ) + m i n j ( k ) + m i t c ( k ) m c t e ( k )

References

  1. Noh, H.K.; No, S.Y. Effect of bioethanol on combustion and emissions in advanced CI engines: HCCI, PPC and GCI mode—A review. Appl. Energy 2017, 208, 782–802. [Google Scholar] [CrossRef]
  2. Krishnamoorthi, M.; Malayalamurthi, R.; He, Z.; Kandasamy, S. A review on low temperature combustion engines: Performance, combustion and emission characteristics. Renew. Sustain. Energy Rev. 2019, 116, 109404. [Google Scholar] [CrossRef]
  3. Yoon, S.H.; Kim, H.J.; Park, S. Study on optimal combustion strategy to improve combustion performance in a single-cylinder PCCI diesel engine with different combustion chamber geometry. Appl. Therm. Eng. 2018, 144, 1081–1090. [Google Scholar] [CrossRef]
  4. Park, H.; Shim, E.; Bae, C. Expansion of low-load operating range by mixture stratification in a natural gas-diesel dual-fuel premixed charge compression ignition engine. Energy Convers. Manag. 2019, 194, 186–198. [Google Scholar] [CrossRef]
  5. Goryntsev, D.; Sadiki, A.; Janicka, J. Analysis of misfire processes in realistic Direct Injection Spark Ignition engine using multi-cycle Large Eddy Simulation. Proc. Combust. Inst. 2013, 34, 2969–2976. [Google Scholar] [CrossRef]
  6. Moradi, J.; Gharehghani, A.; Mirsalim, M. Numerical investigation on the effect of oxygen in combustion characteristics and to extend low load operating range of a natural-gas HCCI engine. Appl. Energy 2020, 276, 115516. [Google Scholar] [CrossRef]
  7. Li, X.; Zhen, X.; Wang, Y.; Liu, D.; Tian, Z. The knock study of high compression ratio SI engine fueled with methanol in combination with different EGR rates. Fuel 2019, 257, 116098. [Google Scholar] [CrossRef]
  8. Zhou, L.; Dong, K.; Hua, J.; Wei, H.; Chen, R.; Han, Y. Effects of applying EGR with split injection strategy on combustion performance and knock resistance in a spark assisted compression ignition (SACI) engine. Appl. Therm. Eng. 2018, 145, 98–109. [Google Scholar] [CrossRef] [Green Version]
  9. Wang, J. Hybrid Robust Air-Path Control for Diesel Engines Operating Conventional and Low Temperature Combustion Modes. IEEE Trans. Control. Syst. Technol. 2008, 16, 1138–1151. [Google Scholar] [CrossRef]
  10. Chen, S.; Yan, F. Trapped Unburned Fuel Estimation and Robustness Analysis for a Turbocharged Diesel Engine with Negative Valve Overlap Strategy. J. Dyn. Syst. Meas. Control 2015, 137, 061004. [Google Scholar] [CrossRef]
  11. Desantes, J.M.; Benajes, J.; García, A.; Monsalve-Serrano, J. The role of the in-cylinder gas temperature and oxygen concentration over low load reactivity controlled compression ignition combustion efficiency. Energy 2014, 78, 854–868. [Google Scholar] [CrossRef]
  12. Benajes, J.; Novella, R.; García, A.; Arthozoul, S. The role of in-cylinder gas density and oxygen concentration on late spray mixing and soot oxidation processes. Energy 2011, 36, 1599–1611. [Google Scholar] [CrossRef]
  13. Porpatham, E.; Ramesh, A.; Nagalingam, B. Experimental studies on the effects of enhancing the concentration of oxygen in the inducted charge of a biogas fuelled spark ignition engine. Energy 2018, 142, 303–312. [Google Scholar] [CrossRef]
  14. Yan, F.; Wang, J. In-cylinder oxygen mass fraction cycle-by-cycle estimation via a lyapunov-based observer design. In Proceedings of the 2010 American Control Conference, Baltimore, MD, USA, 30 June–2 July 2010; pp. 652–657. [Google Scholar] [CrossRef]
  15. Yan, F.; Wang, J. Design and Robustness Analysis of Discrete Observers for Diesel Engine In-Cylinder Oxygen Mass Fraction Cycle-by-Cycle Estimation. IEEE Trans. Control. Syst. Technol. 2012, 20, 72–83. [Google Scholar] [CrossRef]
  16. Zeng, X.; Wang, J. A physics-based time-varying transport delay oxygen concentration model for dual-loop exhaust gas recirculation (EGR) engine air-paths. Appl. Energy 2014, 125, 300–307. [Google Scholar] [CrossRef]
  17. Meyer, J.; Midlam-Mohler, S.; Yurkovich, S. In-cylinder oxygen concentration estimation for diesel engines via transport delay modeling. In Proceedings of the 2011 American Control Conference, San Francisco, CA, USA, 29 June–1 July 2011; pp. 396–401. [Google Scholar] [CrossRef]
  18. Och, S.H.; Moura, L.M.; Mariani, V.C.; dos Santos Coelho, L.; Velásquez, J.A.; Domingues, E. Volumetric efficiency optimization of a single-cylinder D.I. diesel engine using differential evolution algorithm. Appl. Therm. Eng. 2016, 108, 660–669. [Google Scholar] [CrossRef]
  19. Cui, J.; Lai, H.; Li, J.; Ma, Y. Visualization of internal flow and the effect of orifice geometry on the characteristics of spray and flow field in pressure-swirl atomizers. Appl. Therm. Eng. 2017, 127, 812–822. [Google Scholar] [CrossRef]
  20. Finesso, R.; Hardy, G.; Maino, C.; Marello, O.; Spessa, E. A New Control-Oriented Semi-Empirical Approach to Predict Engine-Out NOx Emissions in a Euro VI 3.0 L Diesel Engine. Energies 2017, 10, 1978. [Google Scholar] [CrossRef] [Green Version]
  21. An, H.; Yang, W.; Li, J.; Zhou, D. Modeling study of oxygenated fuels on diesel combustion: Effects of oxygen concentration, cetane number and C/H ratio. Energy Convers. Manag. 2015, 90, 261–271. [Google Scholar] [CrossRef]
  22. Zhang, Y.; Huang, Z.; Wei, L.; Niu, S. Experimental and kinetic study on ignition delay times of methane/hydrogen/oxygen/nitrogen mixtures by shock tube. Chin. Sci. Bull. 2011, 56, 2853–2861. [Google Scholar] [CrossRef] [Green Version]
  23. Boretti, A. Conversion of a heavy duty truck diesel engine with an innovative power turbine connected to the crankshaft through a continuously variable transmission to operate compression ignition dual fuel diesel-LPG. Fuel Process. Technol. 2013, 113, 97–108. [Google Scholar] [CrossRef]
Figure 1. Engine architecture with air-path system.
Applsci 11 07594 g001
Figure 2. Work flow of the paper.
Applsci 11 07594 g002
Figure 3. Intake manifold pressures and temperatures in steady state.
Applsci 11 07594 g003
Figure 4. Comparison between the modeled and simulated ignition delay.
Applsci 11 07594 g004
Figure 5. EGR valve opening and injection mass for model validation.
Applsci 11 07594 g005
Figure 6. Comparison between the modeled and simulation ignition delay.
Applsci 11 07594 g006
Figure 7. Ignition delay demonstrated by pressure difference trace (measured from a medium-duty diesel engine).
Applsci 11 07594 g007
Figure 8. Ignition delay reconstructed by pressure trace with different sampling rate: (Left) Pressure sampled for every 1CA degree. (Right) Pressure sampled for every 0.5 CA degree.
Applsci 11 07594 g008
Figure 9. Performance of dynamical model based method (no uncertainties).
Applsci 11 07594 g009
Figure 10. Performance of the virtual measurement (no uncertainties, 10% drift).
Applsci 11 07594 g010
Figure 11. Performance of the dynamical model based method (with uncertainties).
Applsci 11 07594 g011
Figure 12. Performance of the data fusion method (with uncertainties, 10% model error).
Applsci 11 07594 g012
Table 1. Uncertainty combinations for figures.
Figure No.Gas Mass UncertaintiesMeasuring Model Errors
Figure 9 (DM)NoN/A
Figure 10 (VM)No10% drift
Figure 11 (DM)YesN/A
Figure 12 (DFM)Yes10% drift
DM = the dynamical model, VM = the virtual measurement method, DFM = proposed method (data fusion of the dynamical model and the virtual measurement method); For the gas mass uncertainties, Yes means the volumetric efficiency is inaccurate and is 10% larger than real value; for the ignition delay model errors, 10% drift means the oxygen fraction calculation error from ignition delay model is set as 10%.
Publisher’s Note: MDPI stays neutral with regard to jurisdictional claims in published maps and institutional affiliations.

