1. Introduction
Hospitalisation of a patient with diabetes is more likely to occur as a consequence of foot disease than any other complication [
1]. The resulting health care costs in western health systems may account for up to 20% of the total diabetes expenditure [
2]. Foot ulceration is a common diabetic foot complication, which most often is a precursor to lower limb amputation. Even though over 80% of diabetic foot ulcers are preventable, 1% of people living with diabetes are still at risk of ulcerating [
3].
The prognosis of diabetic foot ulceration (DFU) is poor, with three-year mortality rates after primary amputations thought to be as high as 20–50% [
4] and five-year mortality rates after a major amputation are second only to lung cancer [
5].
While high plantar pressure is a proposed predictor of diabetic foot ulceration, and different pressure thresholds have been proposed, no fixed and consistent pressure value has been given to quantify this effect [
6,
7]. A previous study considered 6 kg/cm
2 (588.6 kPa) as the pressure threshold that can cause soft tissue damage in high-risk patients living with Type 2 Diabetes Mellitus during walking [
7].
Indeed, pressures ranging from 200 kPa to 1000 kPa [
8] have been proposed as predictive thresholds for ulceration in persons living with DM; specific values include 588 kPa [
9] and 335 kPa [
10]. It was also suggested that plantar pressure greater than 700 kPa is the threshold in screening patients who are at risk of developing diabetic foot ulceration [
11]; it was also suggested that in the presence of a pre-ulcerative lesion, lack of in-shoe peak pressure below 200 kPa and “high barefoot dynamic peak plantar pressure” are risk factors for a pressure-related plantar ulcer [
12].
On the other hand, a study [
13] reports a peak plantar pressure of 348 kPa in participants living with diabetes for over 10 years and no known complications. Whilst this value exceeds some of the thresholds listed in the literature, none of the participants exhibited any trends towards ulceration. This demonstrates that, on its own, the pressure might not be an ideal model to actually “predict” foot ulceration, although it may be the only quantifiable value available to date. The data from a study by Lavery et al. support the belief that elevated foot pressure is an important risk factor for foot complications. However, the authors suggest that foot pressure by itself is a poor tool to predict foot ulcers [
14].
The current prognostic models rely either solely on measuring temperature, pressure, or some form of shear assessment; these parameters, however, rarely reach 50% specificity in relation to DFU. There is currently very limited evidence that supports the use of single clinical parameters in predicting the risk of DFU [
15].
One possible consequence of prolonged plantar pressure on a region of the foot is local ischemia in this region that may precede tissue breakdown. Thermography, the measurement of cutaneous temperature, may be a method of actually detecting these temperature changes since pressure may either reduce cutaneous blood flow, perhaps reducing the local temperature, or indeed raise this temperature if inflammatory changes occur. A study that categorized patients into healthy, healthy diabetic, ischaemic, neuropathic and neuroischaemic groups reported significant foot temperature differences between two groups: a healthy group (comprising healthy and healthy diabetic participants) compared to a complications groups (peripheral arterial disease, neuropathy and neuroischaemic) [
16]. These authors hypothesize that through their predictive model, these two groups—healthy and complications—can be identified through thermal imaging. This raises a query that those patients with peripheral arterial disease, where one would predict colder feet, actually exhibited higher temperatures which, however, has been evidenced through two different studies [
16,
17]. Although these findings are novel and showcase a substantial potential for the screening and categorization of patients into groups that could identify patients for more in-depth clinical assessment, these studies were conducted in a static environment. One possible alternative would be to investigate temperature and pressure changes dynamically, i.e., after a period of walking since temperature changes may require a period of time before changing significantly.
With thermography being sensitive enough to detect small temperature changes, as occurs in the ischemic foot, integrating foot pressure mapping and thermography may produce an innovative diagnostic process that could lead to the early identification of potential tissue breakdown and thus the prevention of plantar ulcers.
This preliminary investigation aimed to explore whether a correlation between pressure and temperature in different regions of the foot exist in different categories of participants following 15 min of walking. The results from this study could serve as an initial insight into the possibilities of developing a potential clinical test that fuses these two parameters in order to produce a more valid risk predictor than by using temperature or pressure measurements on their own. This fusion of pressure and temperature has been termed the “Thermo-pressure” concept.
2. Methodology
This prospective observational study was conducted following ethical approval from the University Research Ethics Committee. All participants were treated according to the Declaration of Helsinki [
18]. Participants were recruited by an intermediary from a primary care clinic and from a diabetes and endocrinology out-patient department in a general hospital. Following written informed consent, all participants were invited to a university clinical biomechanics laboratory where actual data collection took place.
Inclusion criteria for the 4 groups of recruited participants are listed in
Figure 1. Adults aged between 40 and 80 years were invited. Exclusion criteria for all groups included a history of alcohol abuse; history of /or current foot ulceration; history of lower extremity surgery, including hip, knee, ankle or foot, or severely pronated/supinated feet; leg length discrepancy; foot pain and deformities; use of walking aids; problems of cooperation, including eyes or cognitive disorders; and other significant medical co-morbidities.
Prior to data collection, demographics and medical history were recorded by a clinician (SP) in order to ensure that only those fitting the inclusion criteria were recruited.
3. Vascular Assessment
An extensive vascular assessment was vital in this study to classify individuals into different groups. The Huntleigh® Dopplex Assist vascular package was utilised to determine the arterial waveforms and Toe Brachial Pressure Index (TBPI) of both limbs in each participant since it was shown to have a sensitivity of over 90% and specificity of 95%.
Participants were placed in a relaxed supine position with their limbs straight. It was ensured that the ambient temperature of the room was set at 23 °C to prevent participants from developing cold limbs, thus leading to inaccurate TBPI readings for spectral waveform analysis and for the subsequent thermographic acquisition. Any tight clothing from both upper and lower limbs was loosened to allow unobstructed vascularisation.
The initial assessment modality involved the acquisition of spectral waveforms, which has been shown to be a reliable method when used by trained clinicians [
19]. Doppler ultrasound examinations of the posterior tibial, anterior tibial and dorsalis pedis arteries were performed. Triphasic waveforms were ensured in the healthy groups, with biphasic, monophasic and continuous monophasic waveforms being used to classify participants with peripheral arterial disease (PAD) and neuroischaemia (if neuropathy testing was also positive) [
16].
TBPI was then performed in order to consolidate the spectral waveform analysis results. This was performed by placing a toe cuff of appropriate size around the proximal phalanx of the hallux and recording the Doppler photoplethysmography (PPG) signal from the distal apex of the hallux. The cuff was inflated until the PPG signal disappeared and then slowly deflated. The point at which the PPG waveform reappeared was then recorded as the toe systolic blood pressure.
TBPI was calculated by dividing the highest toe systolic pressure by the highest brachial pressure. A value < 0.64 indicated arterial disease, for classification in the PAD group or neuroischaemic group if the participant demonstrated peripheral neuropathy as well.
The 5.07 Semmes–Weinstein monofilament was used for screening for peripheral sensory neuropathy. This was applied to the distal great toe, third toe and fifth toe; first, third and fifth metatarsal heads; medial foot, lateral foot and heel, avoiding areas of hyperkeratosis if present [
20]. The participant was deemed as having peripheral sensory neuropathy if at least 2 out of the tested sites were not felt.
4. Acquisition of Plantar Pressure Data
A Tekscan High-Resolution (HR) Mat (Tekscan, Boston, MA, USA) was used for collecting plantar pressure data.
The HR pressure mat was calibrated before collecting data from each participant as recommended by the manufacturer. The weight of each participant was measured separately using a calibrated hospital scale and inputted into the Research FootMat™ Software Version 7.5. The two-step gait protocol, a previously validated method, was utilized for all participants for acquiring data. This method was demonstrated to all participants before initiating data collection. All data were collected at 55 Hz. Three trials were recorded for each participant whilst walking at their own preferred speed and looking straight ahead since the literature suggests that this is sufficient to ensure reliability in the acquisition of plantar pressure and force data [
21]. Trials were excluded and repeated if the participant misplaced their foot on the pressure mat, or did not continue to walk on the mat for more than two steps or paused on the mat during walking. Standardised instructions were given to each participant by the same researcher. Each trial produced eight stance phases, four stance phases for the left foot and four stance phases for the right foot. Before analysing plantar pressure data, the first and last step for each participant were discarded as these could influence the mean result.
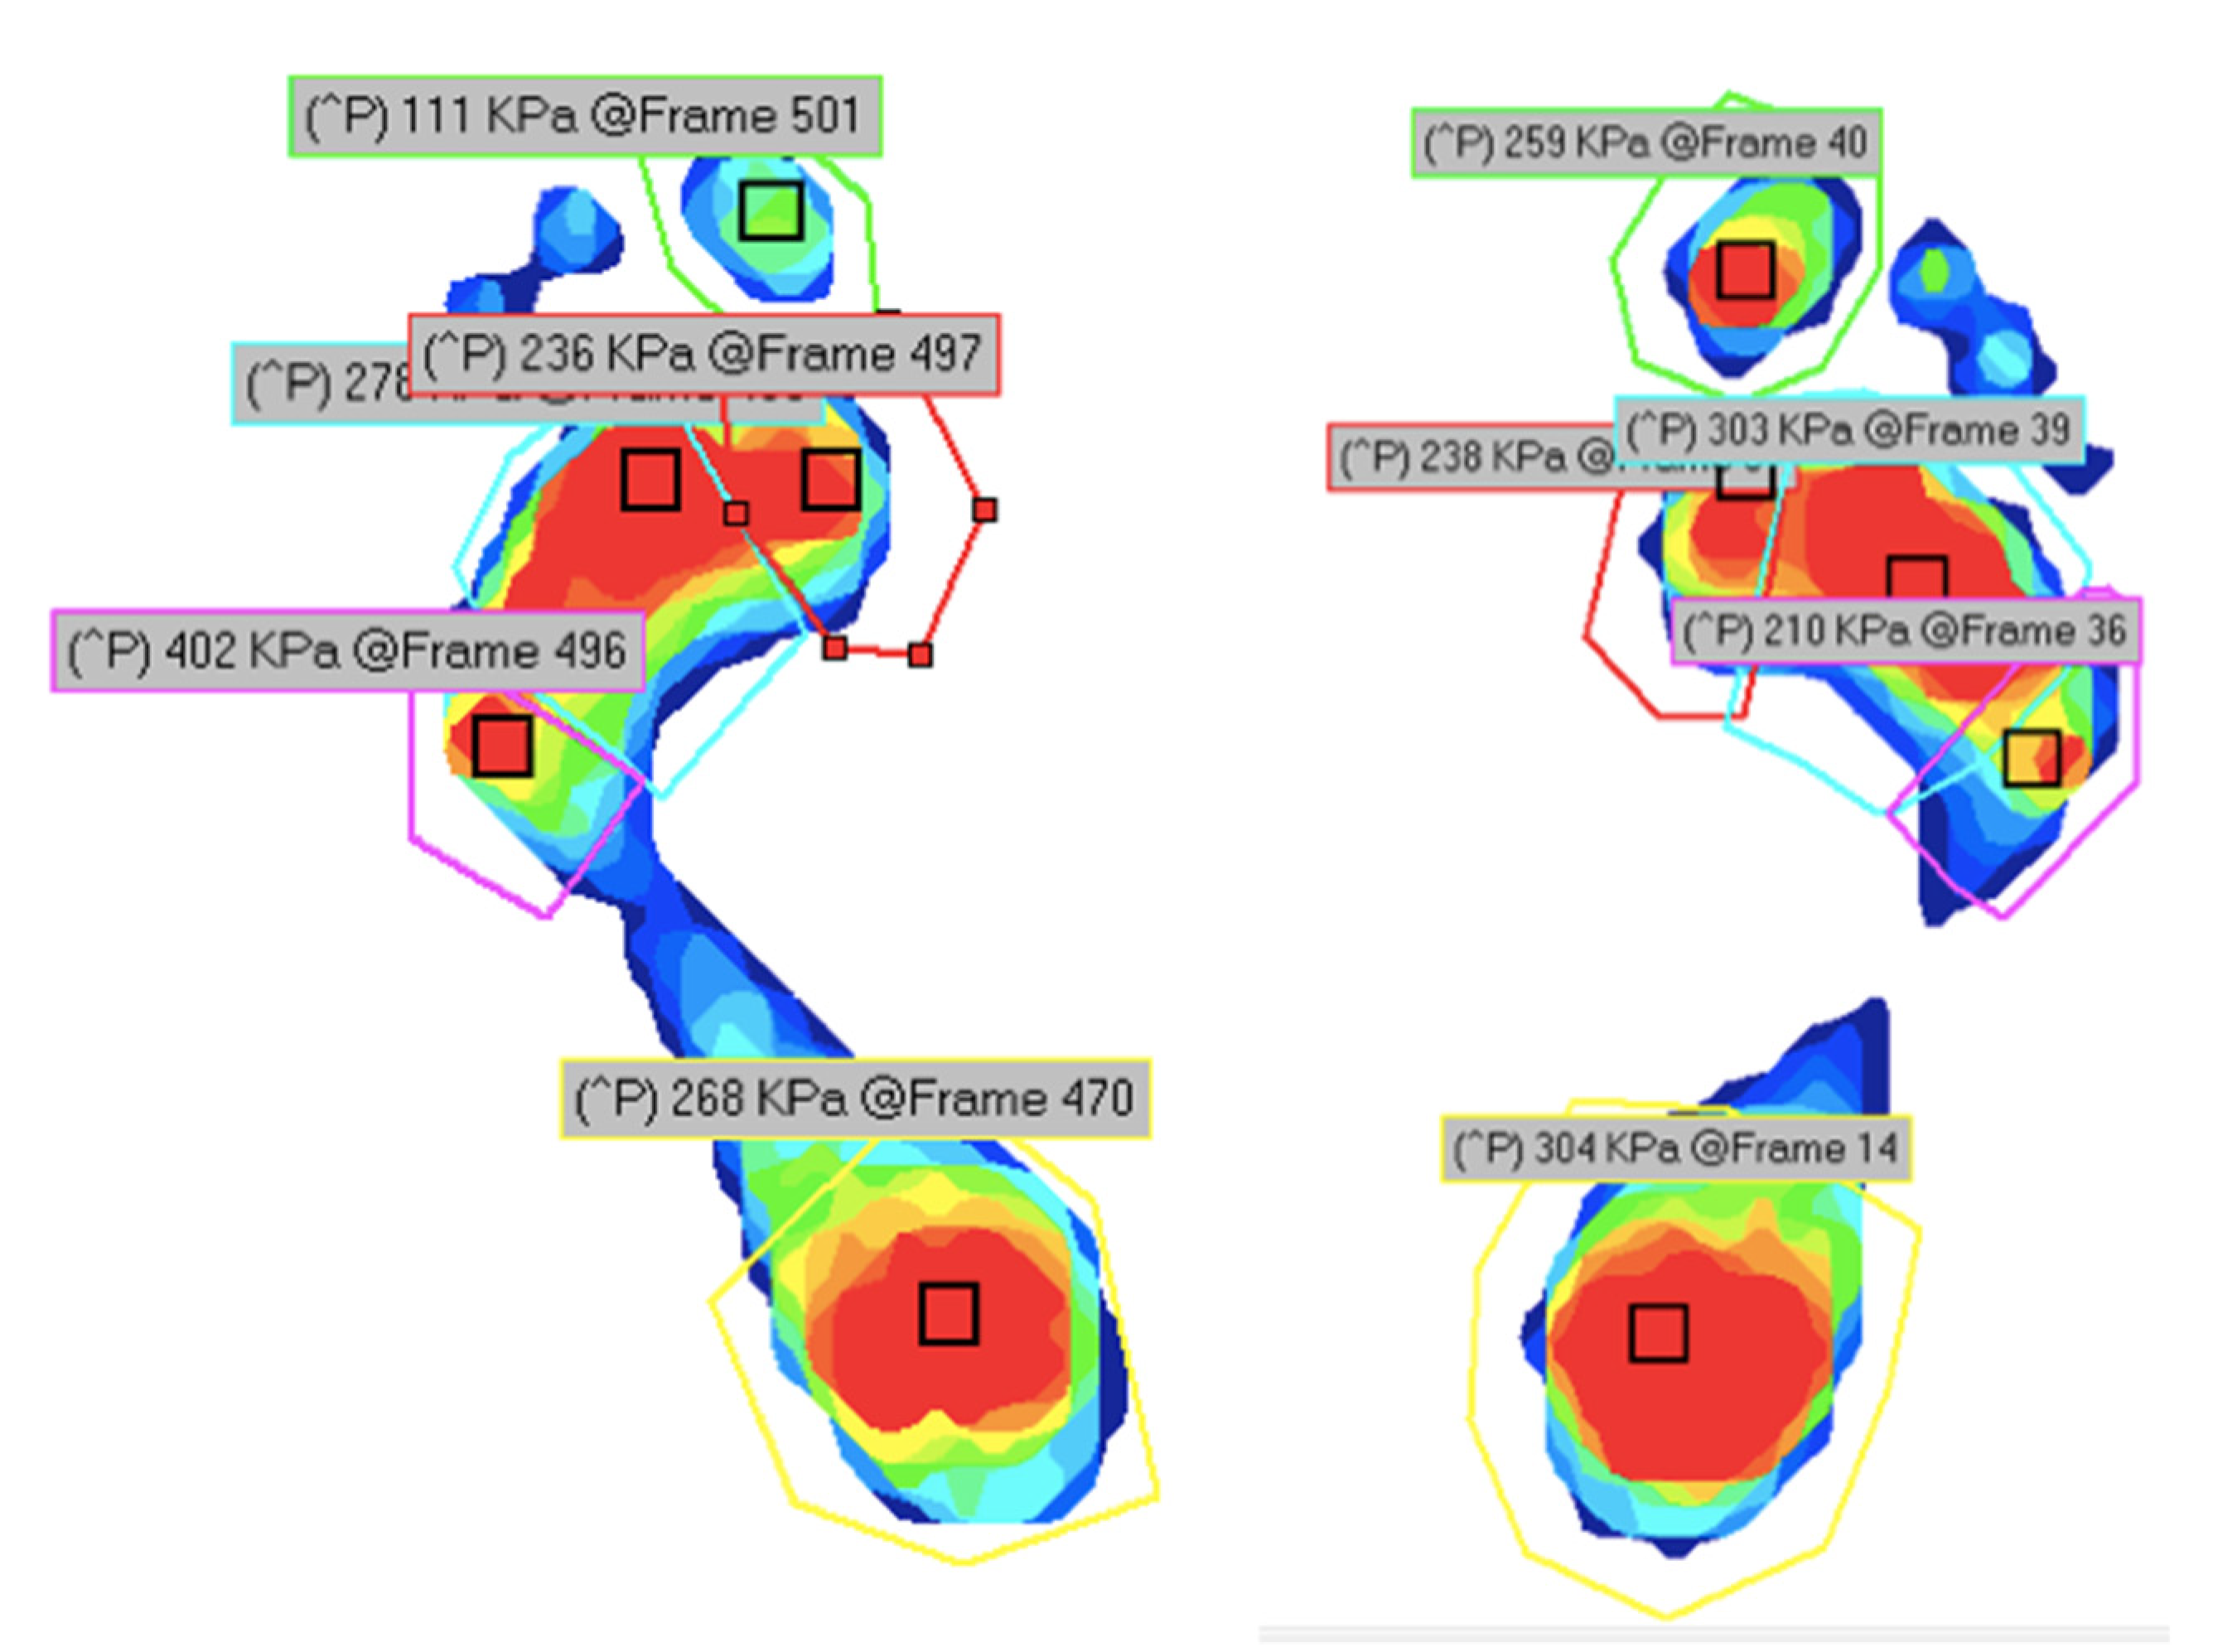
All the pressure recordings for both left and right feet were divided into five regions of interest (ROIs) by applying masks in the regions of the hallux, 1st metatarsophalangeal joint (MPJ), 2nd to 4th MPJs, 5th MPJ and heel (
Figure 2). From each division of the foot, data relating to peak plantar pressure (PPP) were extracted and documented as this variable plays an important role in the development of ulcers. Peak plantar pressure was defined as the highest observed pressure to a particular area.
5. Acquisition of Thermographic Data
Following initial plantar pressure acquisition, the participants were instructed to lie in a supine position on the couch for 15 min in a controlled air temperature of 23 °C as recommended by the literature. This time period was considered essential in order for the body to be acclimatized to the climate-controlled laboratory temperature in accordance with the standards [
22].
The participants were then asked to walk for 15min on a motorized treadmill. Within 1 min from walking cessation, thermograms of the plantar aspect of the foot were taken using the method described below as this allowed for the quantification of variations in temperatures in the region of interest after walking.
A thermal camera (FLIR, Wilsonville, OR, USA, T630C), positioned 1m away from the subject’s foot, was used to capture the thermal images. This camera has a resolution of 420 × 360 pixels and a thermal sensitivity of less than 0.04 at 30 °C. The capture of resting infrared thermographic images of the plantar foot were completed in accordance with the standard views for medical IR thermography developed by the University of Glamorgan (Ring, 2010) and as utilized in previous studies [
22]. Captured thermograms were saved automatically on an external flash memory device for subsequent analysis utilizing commercial (Flir Tools) software.
In order to extract temperatures from the soles of the feet, mean temperatures were extracted from the hallux, medial, central and lateral forefoot and heel (
Figure 3). These mean temperatures were automatically calculated by the thermographic analysis software by dividing the temperature at each pixel in the region of interest by the number of pixels. These were selected from locations pre-determined in another study that showed these locations as being reliable and repeatable for thermographic temperature recording and evaluation [
22]. The Statistical Package for Social Sciences (SPSS) program (IBM) version 27 was utilized for the statistical analysis and for correlating pressure and temperature data.
6. Results
Forty-eight participants were recruited: forty-two males and six females with a mean age of 67.7 years (SD: 5.19 years;
p = 0.069 demonstrated no significant differences between groups). For detailed demographics, please refer to
Table 1.
Figure 4 illustrates the mean temperatures and pressures of all areas and groups, clearly demonstrating increased temperatures in groups C and D (the DM + complications groups).
Pearson correlation tests were performed on the various areas of interest to determine whether a correlation between pressure and temperature exists. In the first statistical testing, the four groups were divided into two amalgamated groups: a healthy group, which included Groups A and B, and a complications group, which included Group C and D, as per Gatt et al., who identified no significant differences between healthy and healthy diabetic groups (
p > 0.05), and a significant difference between the “healthy” groups (healthy + DM without complications) and the complications groups (PAD + neuroischaemia) (
p < 0.05) [
16].
The results in
Table 2 indicate that the Pearson correlation test exhibited a positive relationship between the two variables in the areas marked with an asterisk (i.e.,
p < 0.05). For Group A and B combined, only the 5th MPJ accepts the alternative hypothesis as its
p- value is smaller than the 0.05 level of significance. Thus, there is a lack of correlation in all the other areas in these groups. On the other hand, for Groups C and D combined, the Hallux, 2nd to 4th MPJ, 5th MPJ and Heel accept the alternative hypothesis as their
p-value is smaller than the 0.05 criterion, thus demonstrating a positive correlation between temperature and pressure in these specific areas.
The scatter plot (
Figure 5) demonstrates the relation between plantar pressures and plantar infrared temperature for the Hallux region, of Groups A and B combined vs. Groups C and D combined. It illustrates that higher pressures relate to higher temperatures and that the plantar pressures and plantar infrared temperatures of Groups C and D combined are higher when compared to Groups A and B combined. Graphically, both lines follow an upward trend, indicating that both groups have a positive correlation coefficient. However, one can notice that the trend line for Groups C and D combined is slightly steeper than for Group A and B combined, illustrating that the correlation coefficient is significantly different from 0.
In the second statistical test, the two groups were divided into a healthy group (Group A) and a diabetes group (Groups B,C,D).
Table 3 demonstrates that, whilst there are only two positively correlated (
p < 0.05) regions of interest (ROIs) in Group A, all ROIs in Groups B, C and D combined demonstrate a positive correlation.
Figure 6 displays a scatter plot exhibiting the relation between plantar pressure and plantar infrared temperature in the regions of interest.
7. Discussion
Plantar pressure has long been identified as a risk factor for ulceration in diabetes. However, the quest for identifying the true threshold value at which diabetic skin breaks down to form an ulcer has been ongoing for many years, and indeed the values presented in the scientific literature are far apart and range between 200 kPA and 1000 kPa. However, Falzon et al. reported that in patients living with DM with no complications, the duration of diabetes itself increases peak plantar pressure at the centre of the forefoot to over 300 kPa, possibly due to non-enzymatic glycosylation of the plantar fat pat, yet none of their subjects exhibited any ulceration [
13]. This demonstrates that, on its own, peak plantar pressure may not be sensitive enough to predict ulceration in DM. Indeed, it has been shown to have a sensitivity of 60% as a risk factor.
On the other hand, thermography is sensitive enough to detect temperature changes in the diabetes complications group, but in a static setting [
22]. This study hypothesized that, if combined, temperature and pressure could be developed into a risk categorization model, termed a thermo-pressure model. This concept could be plausible when one considers that, before tissue breakdown, an inflammatory response is likely to occur at the site at risk of ulceration, possibly increasing the local temperature. On the other hand, if the pressure causes local ischaemia, the temperature is also likely to rise, as demonstrated by Gatt et al. Both these scenarios are known to commonly precede diabetic foot ulceration; hence, the timely detection of these two fused parameters could provide a pre-ulceration early warning mechanism.
However, before this could be carried out, a study to determine whether there is a correlation between pressure and temperature needed to be performed. The authors believe that this is the first time that these two important parameters have been combined, and this study confirms that, in persons living with diabetes, there is a significant positive correlation between the two. Although in healthy individuals, including healthy DM persons, there is also a trend for the areas of pressure to become warmer, this correlation is less significant than in those patients with diabetic foot complications.
This leads us to enquire whether, in the presence of pre-ulceration, this effect can be noted more than in subjects without pre-ulceration. This, unfortunately, was not possible to investigate within this study. Whilst the main strength of this study was the collection of thermal data following activity, as opposed to studies that have examined the thermal map of the diabetic foot at a purely sedentary level, there was an obvious limitation in that the participants needed to step down from the treadmill, undo their shoes and hosiery and get onto the couch for the thermal acquisition, meaning that these thermographic data were post-activity and, during the time elapsed, a slight drop in temperature could have occurred. This was minimalized by ensuring that thermal data capture was within 1 min of stopping the walking activity. In the future, it is envisaged to repeat this experiment using a custom-designed sensor that can measure both temperature and pressure simultaneously.
8. Conclusions
This pilot study demonstrated that there is a positive correlation between pressure and temperature, i.e., as pressure increases, so does temperature. This was more pronounced in the diabetic group of participants than in the healthy group. More research is required in this field, so that a thermo-pressure model that could hopefully be more sensitive to categorize whether patients living with diabetes mellitus are at risk of developing foot ulceration or not could be further developed.
Author Contributions
Conceptualization, A.G. and S.P.; methodology, A.G., C.F., S.P.; formal analysis, S.P., A.G., L.C.; investigation, S.P.; resources, C.F., A.G., N.C.; data curation, S.P.; writing—original draft preparation, S.P.; writing—review and editing, A.G., C.F., L.C., N.C.; supervision, A.G.; project administration, A.G. and C.F. All authors have read and agreed to the published version of the manuscript.
Funding
This research received no external funding.
Institutional Review Board Statement
Ethical approval was sought and granted by the University of Malta Ethics committee.
Informed Consent Statement
All participants provided full informed consent to participate in this study.
Data Availability Statement
Authors are happy to share a compiled data set.
Acknowledgments
The authors would like to thank all participants who consented to participate in this study.
Conflicts of Interest
The authors report no conflict of interest. The authors alone are responsible for the content and writing of the paper. The views expressed in the submitted article are those of all authors and not an official position of the institution or funder.
References
- O’Loughlin, A.; McIntosh, C.; Dinneen, S.; O’Brien, T. Review Paper: Basic Concepts to Novel Therapies: A Review of the Diabetic Foot. Int. J. Low. Extrem. Wounds 2010, 9, 90–102. [Google Scholar] [CrossRef]
- Boulton, A.J.; Vileikyte, L.; Ragnarson-Tennvall, G.; Apelqvist, J. The global burden of diabetic foot disease. Lancet 2005, 366, 1719–1724. [Google Scholar] [CrossRef]
- Singh, N.; Armstrong, D.G.; Lipsky, B.A. Preventing Foot Ulcers in Patients with Diabetes. JAMA 2005, 293, 217–228. [Google Scholar] [CrossRef]
- Kruse, I.; Edelman, S. Evaluation and Treatment of Diabetic Foot Ulcers. Clin. Diabetes 2006, 24, 91–93. [Google Scholar] [CrossRef] [Green Version]
- Armstrong, D.G.; Swerdlow, M.A.; Armstrong, A.A.; Conte, M.S.; Padula, W.V.; Bus, S.A. Five year mortality and direct costs of care for people with diabetic foot complications are comparable to cancer. J. Foot Ankle Res. 2020, 13, 16. [Google Scholar] [CrossRef] [PubMed] [Green Version]
- Pham, H.; Armstrong, D.G.; Harvey, C.; Harkless, L.B.; Giurini, J.M.; Veves, A. Screening techniques to identify people at high risk for diabetic foot ulceration: A prospective multicenter trial. Diabetes Care 2000, 23, 606–611. [Google Scholar] [CrossRef] [Green Version]
- Caselli, A.; Pham, H.; Giurini, J.M.; Armstrong, D.G.; Veves, A. The Forefoot-to-Rearfoot Plantar Pressure Ratio Is Increased in Severe Diabetic Neuropathy and Can Predict Foot Ulceration. Diabetes Care 2002, 25, 1066–1071. [Google Scholar] [CrossRef] [PubMed] [Green Version]
- Veves, A.; Murray, H.J.; Young, M.J.; Boulton, A.J.M. The risk of foot ulceration in diabetic patients with high foot pressure: A prospective study. Diabetologia 1992, 35, 660–663. [Google Scholar] [CrossRef]
- Frykberg, R.G.; A Lavery, L.; Pham, H.; Harvey, C.; Harkless, L.; Veves, A. Role of Neuropathy and High Foot Pressures in Diabetic Foot Ulceration. Diabetes Care 1998, 21, 1714–1719. [Google Scholar] [CrossRef]
- Fawzy, O.A.; Arafa, A.I.; Elwakeel, M.; Kareem, S.H.A. Plantar Pressure as a Risk Assessment Tool for Diabetic Foot Ulceration in Egyptian Patients with Diabetes. Clin. Med. Insights Endocrinol. Diabetes 2014, 7, 31–39. [Google Scholar] [CrossRef] [Green Version]
- Armstrong, D.G.; A Lavery, L. Diabetic foot ulcers: Prevention, diagnosis and classification. Am. Fam. Physician 1998, 57, 1325–1328. [Google Scholar]
- Armstrong, D.G.; Boulton, A.J.M.; Bus, S.A. Diabetic Foot Ulcers and Their Recurrence. N. Engl. J. Med. 2017, 376, 2367–2375. [Google Scholar] [CrossRef]
- Falzon, B.; Formosa, C.; Camilleri, L.; Gatt, A. Duration of Type 2 Diabetes is a Predictor of Elevated Plantar Foot Pressure. Rev. Diabet. Stud. 2017, 14, 372–380. [Google Scholar] [CrossRef] [Green Version]
- Lavery, L.A.; Armstrong, D.G.; Wunderlich, R.P.; Tredwell, J.; Boulton, A.J. Predictive Value of Foot Pressure Assessment as Part of a Population-Based Diabetes Disease Management Program. Diabetes Care 2003, 26, 1069–1073. [Google Scholar] [CrossRef] [Green Version]
- Jones, P.; Bibb, R.; Davies, M.; Khunti, K.; McCarthy, M.; Webb, D.; Zaccardi, F. Prediction of Diabetic Foot Ulceration: The Value of Using Microclimate Sensor Arrays. J. Diabetes Sci. Technol. 2019, 14, 55–64. [Google Scholar] [CrossRef] [PubMed]
- Gatt, A.; Falzon, O.; Cassar, K.; Ellul, C.; Camilleri, K.P.; Gauci, J.; Mizzi, S.; Mizzi, A.; Sturgeon, C.; Camilleri, L.; et al. Establishing Differences in Thermographic Patterns between the Various Complications in Diabetic Foot Disease. Int. J. Endocrinol. 2018, 2018, 1–7. [Google Scholar] [CrossRef] [Green Version]
- Gatt, A.; Cassar, K.; Falzon, O.; Ellul, C.; Camilleri, K.P.; Gauci, J.; Mizzi, S.; Mizzi, A.; Sturgeon, C.; Chockalingam, N.; et al. The identification of higher forefoot temperatures associated with peripheral arterial disease in type 2 diabetes mellitus as detected by thermography. Prim. Care Diabetes 2018, 12, 312–318. [Google Scholar] [CrossRef]
- General Assembly of the World Medical Association. World Medical Association Declaration of Helsinki: Ethical principles for medical research involving human subjects. J. Am. Coll. Dent. 2014, 813, 14–18. [Google Scholar]
- Formosa, C.; Ellul, C.; Mizzi, A.; Mizzi, S.; Gatt, A. Interrater Reliability of Spectral Doppler Waveform Analysis Among Podiatric Clinicians. J. Am. Podiatr. Med. Assoc. 2018, 1084, 280–284. [Google Scholar] [CrossRef] [PubMed]
- Boulton, A.J.; Armstrong, D.U.; Albert, S.F.; Frykberg, R.G.; Hellman, R.; Kirkman, M.S.; Lavery, L.A.; LeMaster, J.W.; Mills, J.L., Sr.; Mueller, M.J.; et al. Comprehensive foot examination and risk assessment. A report of the Task Force of the Foot Care Interest Group of the American Diabetes Association, with endorsement by the American Association of Clinical Endocrinologists. Phys. Ther. 2008, 8811, 1436–1443. [Google Scholar] [CrossRef] [Green Version]
- Bus, S.A.; de Lange, A. A comparison of the 1-step, 2-step, and 3-step protocols for obtaining barefoot plantar pressure data in the diabetic neuropathic foot. Clin. Biomech. 2005, 209, 892–899. [Google Scholar] [CrossRef] [PubMed]
- Gatt, A.; Formosa, C.; Cassar, K.; Camilleri, K.P.; De Raffaele, C.; Mizzi, A.; Azzopardi, C.; Mizzi, S.; Falzon, O.; Cristina, S.; et al. Thermographic Patterns of the Upper and Lower Limbs: Baseline Data. Int. J. Vasc. Med. 2015, 2015, 1–9. [Google Scholar] [CrossRef] [PubMed]
| Publisher’s Note: MDPI stays neutral with regard to jurisdictional claims in published maps and institutional affiliations. |
© 2021 by the authors. Licensee MDPI, Basel, Switzerland. This article is an open access article distributed under the terms and conditions of the Creative Commons Attribution (CC BY) license (https://creativecommons.org/licenses/by/4.0/).


 ,
, 


