Article

3D Modelling of the Scattering of the Fundamental Anti-Symmetric Lamb Mode (A0) Propagating within a Point-Impacted Transverse-Isotropic Composite Plate

by
Dilbag Singh
1,2,
Mourad Bentahar
1,*,
Charfeddine Mechri
1,3 and
Rachid El Guerjouma
1
1
Laboratoire d’Acoustique de l’Université du Mans (LAUM), Le Mans Université, CNRS UMR 6613, Avenue Olivier Messiaen, 72085 Le Mans, France
2
Department of Mathematics, Panjab University, Chandigarh 160014, India
3
Centre de Transfert de Technologie du Mans (CTTM), 20 Rue Thalès de Milet, 72000 Le Mans, France
*
Author to whom correspondence should be addressed.
Appl. Sci. 2021, 11(16), 7276; https://doi.org/10.3390/app11167276
Submission received: 21 June 2021 / Revised: 27 July 2021 / Accepted: 3 August 2021 / Published: 7 August 2021
(This article belongs to the Special Issue Ultrasonic Modelling for Non-destructive Testing)

Abstract

:
The present paper deals with an effort to model impact damage in 3D-FE simulation. In this work, we studied the scattering behavior of an incident A0 guided wave mode propagating towards an impacted damaged zone created within a quasi-isotropic composite plate. Besides, barely visible impact damage of the desired energy was created and imaged using ultrasonic bulk waves in order to measure the size of the damage. The 3D-FE frequency domain model is then used to simulate the scattering of an incident guided wave at a frequency below an A1 cut-off with a wavelength comparable to the size of the damaged zone. The damage inside the plate is modeled as a conical-shaped geometry with decayed elastic stiffness properties. The model was first validated by comparing the directivity of the scattered fields for the A0 Lamb mode predicted numerically with the experimental measurements. The modeling of the impact zone with conical-shape geometry showed that the scattering directivity of the displacement field depends significantly on the size (depth and width) of the conical damage created during the point-impact of the composite with potential applications allowing the determination of the geometric characteristics of the impacted areas.

1. Introduction

There is a rapid increase in the use of carbon-fiber-reinforced composite materials in the aerospace industry over the last decade [1,2]. The main advantage includes low weight, high static and fatigue strength, and the possibility to manufacture large integral shell structures. In present time, commercial aircraft contain such composites for primary and secondary wing and fuselage components. However, the main drawback of carbon fiber/epoxy is that these are inherently brittle and usually exhibit a linear elastic response up to failure with little or no plasticity. This makes composite structures very vulnerable to impact damage and must therefore satisfy certification procedures for high-velocity impact from runway debris or bird strike. Impact damage is considered to be a serious damage mechanism in composite structures, which limits performance and reliability for further use. The problem with impact damage is that it may not be visible from the surface of the material, and even so, small scratches at the surface may hide severe damages underneath the impacted surface. Indeed, the impact generates a shock wave whose mechanical energy propagates deep inside the material, thus causing different types of damage along its path. Generally, impact damage occurs during in-service applications or as a result of handling during manufacturing. Very common examples of impact events include tool drops during the manufacturing, preparation or storage of the structure, or during in-service use, e.g., birds’ collisions for aeronautic components, hail impact, volcanic ash, runway debris etc. Meanwhile, it is also well known that mechanical properties of composite materials can be severely degraded by the initiation and propagation of structural damages (fiber breakage, delamination, matrix cracking, etc.), which may appear during the components’ life cycles [1]. Since impacts can locally cause crack-like defects, they also may lead to local decays in material properties, i.e., in the vicinity of the impacted zone [1,3,4,5]. It is therefore necessary to reliably detect and evaluate impact damages, as well as their effects on residual resistance of the structure.
The use of non-destructive techniques to evaluate defects, such as the ones based on ultrasonic waves, is therefore suitable because the tested component remains available either for tests, as mentioned above, or for reuse in the whole structure. In particular, ultrasonic guided waves are very advantageous because they can finely interrogate the whole thickness of the material and be used for imaging internal hidden defects when appropriate post-processing is applied. Several authors have worked on locating the point of impact in composite plates [5,6,7,8]. Fromme and Rouge [9] investigated the directivity of the A0 Lamb mode scattered at a crack-like notch defect in an isotropic plate. Moreau et al. [10,11] analytically and numerically discussed the scattering of guided waves partly through thickness and/or flat bottom cavities with irregular shapes in plates. Caminero et al. [12] studied the sensitivity of phased array techniques to detect internal damage caused by impacts at different energy levels on unidirectional and multidirectional laminates depending on the stacking sequence. The problem of impact damage evolution and penetration within thick-section composites was investigated by Gama and Gillespie [13] using explicit finite element (FE) analysis in 3D. Various studies on modeling guided waves in composite plates have been performed by Veidt and his coworkers [14]. Agreement between modelling and experimental data is, in general, achieved for the signals, which are less affected by the damage scattered waves. This is mainly due to the complexity of the involved phenomena during the scattering of ultrasonic guided waves in the presence of point impact damage in composites [15].
Analytical solutions corresponding to Lamb waves scattering in the presence of delamination do not exist for composite laminates due to their multilayer characteristics [16]. Within the framework of a plane strain assumption, the reflection of the fundamental symmetric (S0) Lamb wave from a delamination in unidirectional and cross-ply laminates showed that S0 Lamb wave cannot be used to detect the delamination at locations with zero shear stress [17]. On the other hand, the use of a 2D method to study the reflection characteristics of S0 and A0 Lamb waves from a delamination showed that the A0 Lamb wave is sensitive to delamination at all through-thickness locations [18]. However, it should be noticed that the wave scattering mechanism depends on the involved guided mode as well as on the depth and size of the damage zone. In the case of a delamination, various investigations have shown that A0 and S0 modes propagate individually in the two regions separated by delamination and then interact with each other after exiting the delamination area [19,20]. However, the scattering of guided waves in the case of an impact damage is different from the one corresponding to a delamination created along the full width of the composite laminates. Indeed, Cantwell et al. [21] found that in thin composite specimens, the damage is initiated in the bottom layers, whereas in thick specimens, the damage is initiated in the top layers. As a result of the stresses induced by the hemispherical impactor, fiber breakage is expected in the top plies. The impact damage in the bottom layers is mainly dominated by delamination due to bending stresses, which does not cover the whole thickness of the composite [22,23]. For a given impact energy, the delamination area is expected to be proportional to the bending stiffness mismatching coefficient between the matrix and reinforcements. Therefore, high mismatching coefficients are to be expected when the difference between young’s moduli in the fiber and matrix directions is important [24]. Scatter amplitudes and scatter directivity distributions depend on the delamination size to wavelength ratio and the through-thickness location of the delamination damage. This effect is often studied by bonding masses to the surface of composite laminates in order to simulate delamination damage [16]. Different techniques and approaches have been used in order to model the propagation of ultrasonic guided waves within impacted composite plates. Zhang et al. proposed a modelling that combines low-velocity impact damage with the analysis of guided wave propagation, where delamination and matrix cracking are both directly meshed in the guided-wave model [25]. However, different types of damage could be created when composites are submitted to a low velocity impact. Indeed, impact damages in CFRP structures include delamination, shear cracks, transverse cracks, etc., which makes the precise modelling of all these micro-damages difficult [26,27,28]. The complexity of the multiple scattering phenomena, local resonances, etc., makes the use of a physical approach important and more realistic. Indeed, the effective medium approximation offers a good opportunity to simplify the modeling of complex media, where the inhomogeneous medium can be considered as homogeneous with effective properties. An application of the homogenization approach in the case of a strongly scattering medium can be found in the following references [29,30,31,32].
This work investigates the directivity pattern of the scattered field of incident A0 guided wave by the impact damage and provide much more material and a more in-depth study in connection with new experimental results to our previous contribution [33]. Unlike most of the studies in the literature, the damage zone considered in this paper is not across the full width of the laminates. Therefore, the three-dimensional (3D) characteristics of the damage zone are presented and used in a 3D frequency domain finite element model [34] to simulate the scattering phenomenon of fundamental incident A0 Lamb mode sent towards the damaged zone. The latter has been modeled as a right, circular, conical-shaped geometry with decayed material stiffness properties. Instead of only studying the backward and/or forward scattering [35], the present work investigates the scattering characteristics in different directions, where the frequency of the incident Lamb mode is chosen below A1 cut-off. It is found that in composite plates, the directivity of scattered A0 mode depends on the defect diameter to wavelength ratio, and on the through thickness of the conical damage as well. The numerically predicted scattered wave fields are compared with experiment measurements showing good agreement. Finally, the numerical finite-element-based-scattering characteristics is discussed for different geometrical parameters with a view towards modeling impact damage using conical-shape geometry with decay material properties.

2. Composite Plate and Material Characterization

The CFRC composite plate sample consists of 20 plain weave pattern laminas of 0.3 mm thickness each oriented in [45/0/0/45/0/45/0/45/0/45]S directions. The average thickness of the 50 × 50 cm2 composite plate is approximately 6.2 mm. The homogenized elastic moduli are optimized by matching them with the experimental group velocities of A0 and S0 Lamb modes for a given set of frequencies and the through thickness ultrasonic bulk wave velocities. The schematic of the composite plate as well as the measurement directions of the excited Lamb waves are shown in Figure 1. The homogenized composite plate is transversely isotropic (quasi-isotropic) with Y-axis as axis of symmetry. The A0 and S0 Lamb wave velocities are measured around the emitter (shown in red dot) along different angular positions and in a straight line from the emitter (shown in green and blue dots respectively) in XZ-plane. Velocities were found to be unchanged for all directions in the considered frequency range, namely 10 kHz–150 kHz. Under the transversely isotropic condition, the inversion method was performed by fitting the analytic group velocity dispersion curve with the experimental group velocities corresponding to A0, S0 and SH0 modes as well as bulk ultrasonic waves generated around the abovementioned frequency domain. The density ρ of the plate is first measured as 1.55 ± 0.05 g/cm3. The elastic constant C22 (along Y-axis) is obtained by measuring the longitudinal wave velocity along Y-axis where VL = 2860 ± 10 m/s, which gives C22 = V L 2 ρ = 12.6 GPa. The measured shear wave velocity propagating along Y-axis and vibrating in Z-axis is found to be equal to VT = 1550 ± 10 m/s giving the elastic constant C44 = V T 2 ρ = 3.72 GPa. The group velocity related to SH0 wave is found to be equal to 3300 ± 100 m/s. The value of the constant C13 is then adjusted in the dispersion curve to achieve the same velocity, where C13 is found to be equal to 17.8 GPa. On the other hand, the group velocity of S0 Lamb mode at 100 kHz is 5700 ± 100 m/s and the one corresponding to A0 mode at 40 kHz is 1500 ± 100 m/s. The speed of A0 mode primary depends on the constant C44, which is obtained using the abovementioned shear wave velocity VT. The speed of S0 mode (at 100 kHz) depends on the constants C11 and C12, whose optimization is essential to the constant C55, where C55 = 1/2 * (C11-C13) in the case of a transversely isotropic symmetry. The constants C11, C12 (or C23) are optimized using the S0 wave velocity. It is observed that a linear increase of C11 (keeping other constants fixed) will result in a linear increase in the group velocity of S0 mode while a linear increase of C12 (or C23) will result in a linear decrease in the group velocity of S0 mode (keeping other constants fixed). The change in C12 from 2 GPa to 10 GPa results in a linear decrease from 5800 to 5000 m/s in the group velocity of S0. The values of C11 and C12 are adjusted to fit the measured velocity of 5700 m/s. The optimized values of the stiffness tensor are given in Table 1.
Frequency dispersion curves corresponding to phase velocities are computed using the semi-analytic finite element (SAFE) method for the composite plate using the optimized elastic constants given in Table 1 and shown in Figure 2. Finally, we note that the attenuation is determined by measuring the amplitude variation for a given propagation distance in the far field. Measurements have shown that for the same propagation distance, the amplitudes of the considered fundamental Lamb modes decrease by approximately ~12% regardless of the direction of propagation, which corresponds to ~0.13 Np/m.

3. Impact Damage Setup and Ultrasonic C-Scan

A controlled laboratory experiment is performed to create point impact damage on the given sample plate as shown in Figure 3. The impact tests are carried out using an Imatek IM10 ITS drop tower with a capacity of 4000 Joules according to the ISO standard [ISO standard 6603-2, 2000]. The test is carried out using a falling mass in the form of a trolley with a mass of 8 kg fitted with a hemispherical impactor with a diameter of 20 mm. The composite plate is fixed inside a metallic part with an open area for impact. An anti-bouncing device is implemented to avoid a second shock, which could further damage the structure at a random energy. In order to obtain the desired energy, the drop height is changed. The specimen is placed in a compressed air clamping system on a circular support with an internal diameter of 40 mm and an external diameter of 60 mm in order to hold the specimen during the impact. The quantities measured, using sensors, are the impact force as well as the displacement of the falling mass. Then, the energies, initial (Ei), absorbed (Eabs) and restored (Er), are post-processed thanks to the displacement–time and effort–displacement graphs. Preliminary impact tests were carried out on similar composite plates in order to create a non-visible damage. We have found that 40 J of impact energy is sufficient to damage the plate without penetrating through, where damage is not visible on the impact side and barely visible on the other side.
Immersion c-scan ultrasonic images are obtained using 5 MHz longitudinal pulses propagating through the composite plate. The ultrasonic c-scan image is obtained using a pulse-echo configuration, where gates 1 and 3 correspond to the front and back wall echoes as presented in Figure 4a. The c-scan image shown in Figure 4b is performed on the basis of the change in the back-wall amplitude of the ultrasonic wave, which drops in the presence of damage. Indeed, the defect area appearing in blue color indicates that the 40-joules point-impact test creates a damaged area of ~30 mm diameter around the impact point. In the literature, the conical-shape cavity has been found in different contributions during the impact tests performed on composites. Indeed, the overall damage pattern through the thickness in composite materials follows a conical shape as found by [35,36,37]. The size of the defect region as well as the involved damage mechanisms depend on the used impactors (hemispherical, conical, etc.) and on the composite characteristics as well. The use of hemispherical impactors was found to produce larger delamination areas compared to a conical impactor in laminates [23]. For instance, Lee et al. [38] showed that the different impactor shapes produced different damage mechanisms, which directly affect the energy absorption characteristics of the material. This result was also confirmed by Zhou et al. [39]. Using a metallographic microscope, Shyr et al. found that the structure of the fibers affects the delamination pattern and size [40]. Since the composite studied is transverse-isotropic, we can reasonably suppose, on the basis of the presented ultrasonic c-scan imaging as well, that the structure of the fibers in our case affect the delamination in an isotropic way. The 3D finite elements (3D-FE) model will then reasonably consider a damage area with a conical geometry and the same diameter, the value of which is equal to 30 mm according to the c-scan image.

4. Impact Damage Shape and Modeling in 3D-FE Model

Due to point impact damage and based on the ultrasonic imaging, the composite plate is seriously micro-cracked inside the impact damaged zone. In order to model the damage zone in 3D-FE model, we can reasonably assume that a uniform point impact in the quasi-isotropic plate would produce a damage zone, the shape of which would be a right circular cone due to the impact conditions and the transversely isotropic nature of the plate. Damage in composites is a collection of various types of cracks of different characteristics (matrix voids, delamination, broken fibers, etc.), depending on the applied stress and the composite architecture. At the time when the strength can be clearly defined in metals (ex. unstable growth of a crack at the origin of the brittle fracture), failure in composite materials is still an active research topic, which often generates lively debates in the scientific community [41].
The development of a simple modeling method can be proposed when the wavelength of a Lamb wave is at least one order of magnitude greater than the microscopic defects created within the composite. In such a case, the homogenization procedure of the elastic properties can be expressed through a degradation of the elastic properties. In the literature [42], it has been observed that a decay of 80% in the elastic properties is quite representative of a severely cracked and delaminated zone, in terms of wave scattering. The choice of 80% decay in the material stiffness rather than other smaller values is motivated by the fact that the damaged zone in FE model is considered as a homogeneous medium with mass density equal to that of undamaged material (unchanged thickness), although it would likely be a heterogeneous region made of cracks, voids and delamination, which are known to be efficient scatterers of elastic waves. In the present FE model, we considered an 80% decrease in the material stiffness properties within the cracked zone, which is modeled as a right circular cone with height (h) and diameter (2 r). Finally, note that it was not possible through the ultrasonic imaging experiment to see how deep the damage occurred penetrating the plate through the thickness from the above surface. However, as the impact did not penetrate through the whole thickness, and for comparison with experimental data, the undamaged thickness below the conical damage is considered to be ~1 mm from the bottom surface of composite plate. Finally, we note that the effect of the damage depth on the scattering of the A0 mode will be presented in the present contribution.

5. 3D FE Model and Schematic of the Problem

To simulate the dynamic response of the viscoelastic composite plate in 3D, a commercially available numerical analysis package Comsol Multiphysics [43] based on the Finite Element method is used. Preliminary tests on guided waves dispersion curves were performed using the abovementioned software and revealed that all simulations matched well with the theory and also agreed fairly well with experiments [44]. In the proposed simulations, the PDE mode in coefficient form is used to model the composite plate, and Neumann boundary conditions have been applied on all faces of the plate. At the interface between the conical damage zone and the composite plate, the continuity of stress and displacement is used to solve the numerical model. Besides, one external routine is developed for computing normal displacement fields at the midplane around the point impact zone in a circular region at 360 different angular positions. The equation of the dynamic equilibrium for orthotropic viscoelastic material, with nine complex moduli, is written and solved in the Fourier domain in the 3D FE model as: [13]
j ,   k , l = 1 3 C i k j l [ 2 u j x k x l ] + ρ ω 2 u i = 0 ,     i = 1 ,   2 ,   3 ,
where ui is the Fourier transform of the components of the displacement vector u, with i = 1, 2, 3, representing the direction of the coordinate axis as shown in Figure 5. Here Cikjl is the component of the complex stiffness tensor, ρ is the material density and ω is the angular frequency. The above partial differential equations (PDE) have been written in the following form as: [13]
( c u ) a u = 0
where c is a 3 × 3 matrix. For an orthotropic material, the axis of symmetry coincides with the coordinate axis, and this matrix is composed of the following sub-matrices ckl, k, l = 1, 2, 3 as shown is Equation (3): [13]
c 11 = ( C 11 0 0 0 C 66 0 0 0 C 55 ) ,   c 12 = ( 0 C 12 0 C 66 0 0 0 0 0 ) ,   c 13 = ( 0 0 C 13 0 0 0 C 55 0 0 ) , c 21 = ( 0 C 66 0 C 21 0 0 0 0 0 ) ,   c 22 = ( C 66 0 0 0 C 22 0 0 0 C 44 ) ,   c 23 = ( 0 0 0 0 0 C 23 0 C 44 0 ) ,   c 31 = ( 0 0 C 55 0 0 0 C 31 0 0 ) , c 32 = ( 0 0 0 0 0 C 44 0 C 32 0 ) ,   c 33 = ( C 55 0 0 0 C 44 0 0 0 C 33 ) ,
The expression of ‘a’ is written as:
a = ( ρ ω 2 0 0 0 ρ ω 2 0 0 0 ρ ω 2 )
where Cij are the elastic moduli. As the 3D-FE model consists of modeling the propagation in the frequency domain, absorbing regions are used all around the plate to avoid undesired reflections. The absorbing regions (AR) in the 3D model are defined by a gradual increase of damping properties as explained in [45], where its formula is written as,
C i j A R = C i j ( 1 + i ( R a L a ) 3 ) + i C i j ,   C i j = C i j + i C i j
Here, ‘Ra’ and ‘La’ are the interval and length of absorbing region respectively. The size of the AR used in this FE model is 1.5 λMAX, where λMAX is the maximum wavelength for all modes existing in the plate in the studied frequency range. The full schematic of the 3D-FE model is shown in Figure 5 and Figure 6. According to this configuration, the schematics of the laboratory experiment are shown in Figure 7. Since the frequency of the incident Lamb wave mode is chosen below the A1 cut-off, λMAX is the wavelength of the S0 mode at the frequency of interest.
It is observed in the phase velocity dispersion curves in Figure 2 that the higher wave mode A1 starts to appear right after 120 kHz. Accordingly, the excitation frequency of 100 kHz is chosen to avoid the appearance of higher-order Lamb modes. At 100 kHz, the wavelengths of A0 and S0 modes are equal to 13.9 mm and 57.7 mm, respectively. Therefore, the size of the AR is considered equal to 87 mm (≈1.5 × 57.7) all around the four sides of the 3D-FE model.

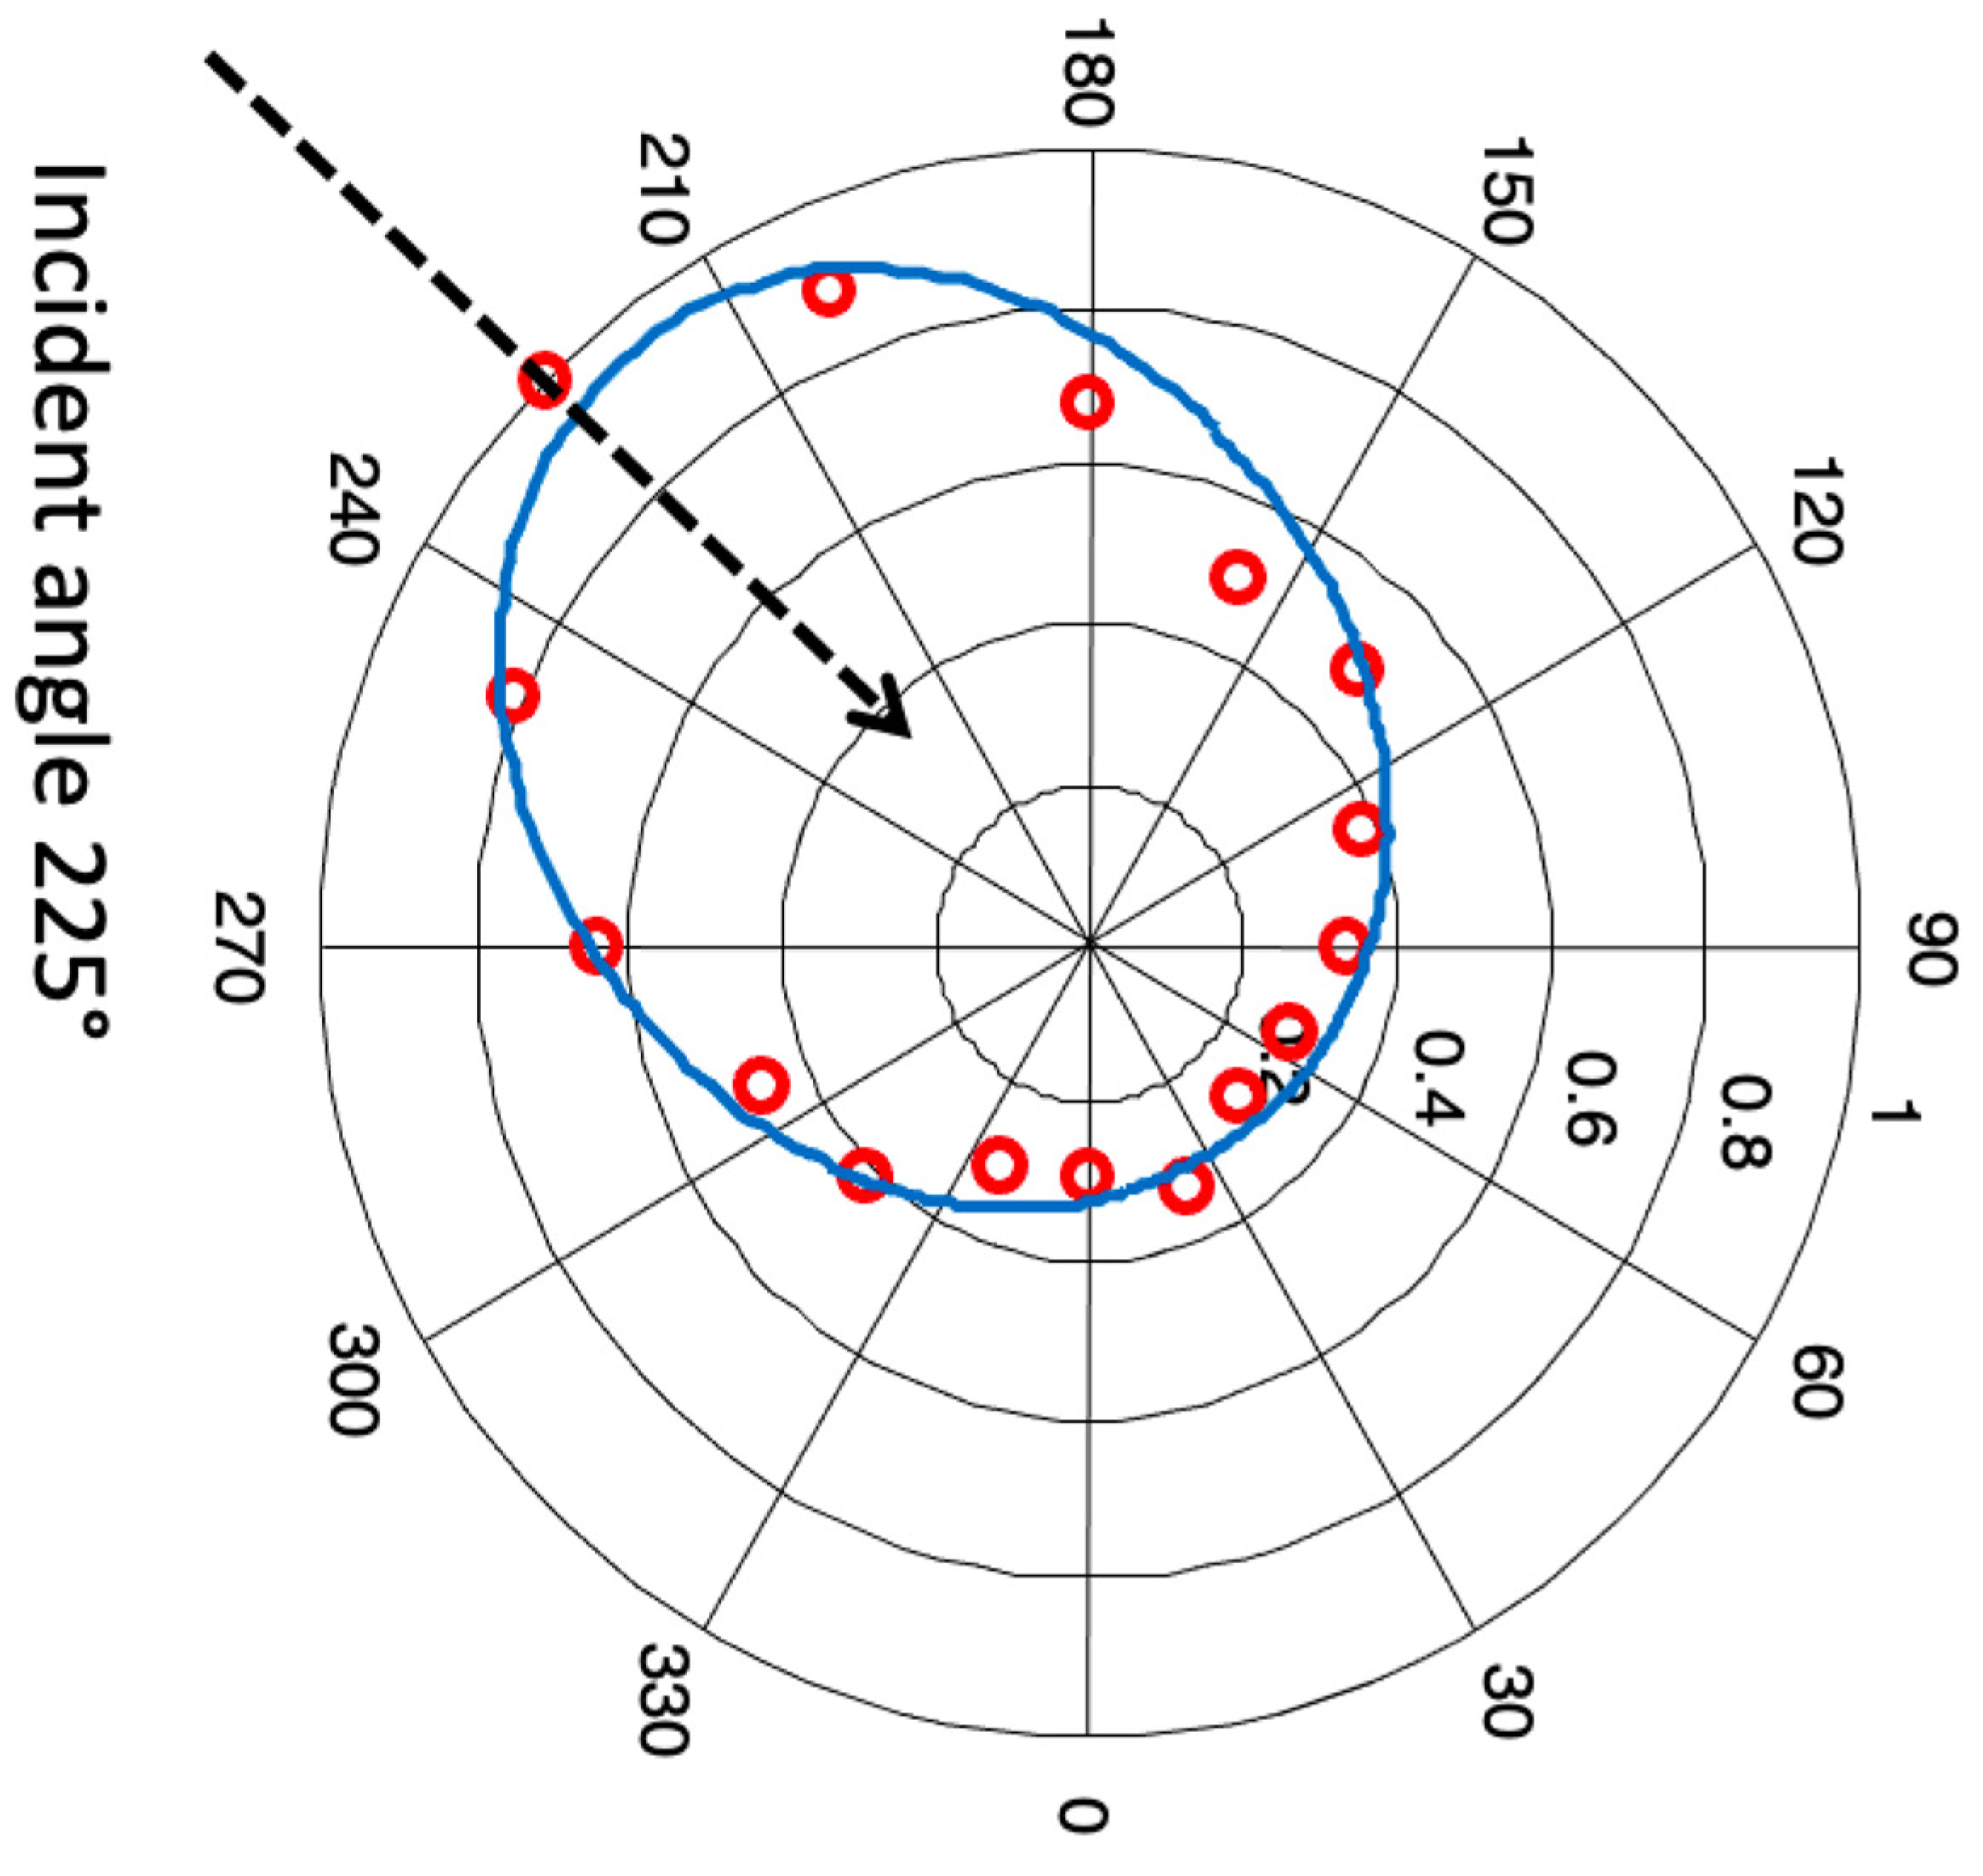
6. Interaction of A0 Mode with Impact Damage and Comparison between Numerical Predictions and Experiment

To compute the scattered displacement field of the incident A0 mode sent towards the impacted zone, two different 3D-FE models are developed. At first, a 3D-FE model, taken as a reference, consisting of an undamaged plate, is solved to compute the incident wave field corresponding to the A0 mode. The second 3D FE model, which takes into account the conical defect representing impact damage, is solved to compute the total wave field of the incident A0 mode. The incident field computed from the first model is then subtracted from the total wave field computed from the second model to obtain the complex scattered wave field of incident A0 mode. In both undamaged and damaged cases, the dimensions of 3D-FE models are equal to 300 mm × 300 mm × 6.2 mm. The excitation of the pure A0 mode is achieved by giving the unit normal stress at a single frequency (in out of phase manner) using two circular regions, with diameters equal to 13 mm, placed on the opposite sides of the plate and centered at points (110, 0, 110) and (110, 6.2, 110) as shown in Figure 6. The reference model contains 724,365 tetrahedral mesh elements with 3,132,252 degrees of freedom that makes at least four elements per wavelength along the thickness of the plate and at least four elements along the XZ plane insuring good convergence and accuracy of the FE solution. For the validation of the FE model with the experiment, the model is first solved for a Gaussian profile sinusoidal signal with seven cycles centered at a frequency of 100 kHz by inserting its respective complex Fourier amplitudes as normal stresses on both sides of the plate for 63 different frequencies running between 76 kHz and 123 kHz. After solving the FE model using a linear solver with Lagrange quadratic elements and applying Neumann boundary conditions, the excitation and reception of signals are performed using the inverse Fourier transform of the normal components of the displacement at (110, 6.2, 110) and (210, 6.2, 210), respectively. These two points are separated by a distance of 142 mm. The reconstructed signals of excitation and reception predicted by the FE model are shown in red in Figure 8. Some angular signals around the center at (150, 6.2, 150) are also reconstructed and are shown in Figure 9. The latter figure shows that the amplitude at 225° is the highest and that the ones corresponding to the symmetrical positions at (180° and 270°) and (0° and 90°) have lower amplitudes and are equivalent. Since our study only deals with the scattering of amplitude, all 3D-FE models are solved for a single excitation frequency of 100 kHz to save computation time and cost. The amplitude of the incident A0 mode, i.e., the normal component of the displacement vector ‘vinci’, is monitored at the mid plane (at y = 3.1 mm), where 360 positions around a circle centered at (150, 3.1, 150) with a radius equal to 20 mm are considered. The center position corresponding to excitation and the center of the monitoring circle causes an incident angle of 225° in such an arrangement of the sensors as shown earlier in Figure 6. The numerically computed normalized incident field in the absolute value (shown in solid line) is shown in Figure 10. In the second FE model (damaged case), impact damage is introduced as a right circular cone with a diameter of 30 mm and a depth of 5.2 mm eep, with 80% decayed material stiffness. The top tip of the conical geometry is situated at (150, 6.2, 150) and at a depth reaching 5.2 mm through the thickness of the plate. In the presence of impact damage, the 3D-FE model contains 794,937 tetrahedral mesh elements in total with 3,419,892 degrees of freedom. The maximum mesh element size inside and around the impact zone is set to 1 mm while the remaining area is set to be at least 4 mm per wavelength. The model is solved for the same incident frequency of 100 kHz using the same linear solver with Lagrange quadratic elements and applying Neumann boundary conditions. The total field (i.e., the normal component of the displacement vector ‘vtot’) from the 3D-FE model is monitored at the mid plane around the same circular path at 360 positions at a distance of 20 mm from the center of the damaged zone. The numerically calculated normalized total field in absolute value (shown in solid line) is shown in Figure 11. The amplitude of the scattered A0 wave ‘vscat’ around the impacted zone is calculated as the absolute difference of the complex magnitudes (vscat = |vtotvinc|) at each point between the reference and the damaged state for all 360 monitored points around the circle. The normalized absolute difference of the scattered A0 mode is shown in Figure 12.
The laboratory experimental setup (shown in Figure 7) for measuring the incident and total fields of the incident A0 mode includes the same Gaussian profile sinusoidal signal with seven cycles centered at a frequency of 100 kHz (the same as that used in the FE model) where excitation and reception are performed via two identical transducers (PanametricsTM V106). Acoustic field amplitudes are monitored at 32 different positions around the circle for intact and damaged plates. A LabviewTM code is programmed along with MatlabTM to store and process the experimental measurements. The transmitter is attached to the composite plate with the help of a thermal resin. It is very difficult to generate a pure A0 mode in the laboratory. Indeed, when a pulse is sent towards the transmitter to generate the A0 mode, a small portion of the S0 mode (shown inside the dotted circle in Figure 8) is also being excited. With S0 being three times faster than A0, one can easily choose the propagating distance to avoid any overlapping between the generated modes. Furthermore, the ratio of amplitudes between S0 to A0 is around 4%, which suggests neglecting the S0 contribution, in accordance with the literature [25]. Therefore, the received mode will be almost a pure A0 mode with negligible interference of the S0 mode. A comparison between the reconstructed signals from the FE model and the experimental measurements (shown in red color) for same distance of 142 mm is shown in Figure 8. Indeed, by considering 12% attenuation into the 3D-FE model, the simulated amplitudes are found to be in good agreement with the experimental amplitudes for the A0 mode. We also note a difference in simulated and experimental signals between ~225 µs and ~250 µs. The latter could be a consequence of the homogenization of the elastic properties corresponding to the different layers of the composite, which appears more clearly in the case of small wavelengths i.e., A0 mode. However, these minor discrepancies have a very limited effect on the estimation of the amplitude of the A0 mode as it can be observed in Figure 8. For the undamaged plate, the measured incident amplitudes (blue circles) are normalized and compared with the simulated normalized incident amplitudes (solid line) as shown in Figure 10. The latter shows that the scattered field remains symmetrical in terms of directivity and amplitude with respect to the direction 225°. For the damaged plate, the total displacement field is measured at the same 32 points to make the comparison possible. The normalized measured amplitude of the total field (blue circles) and simulated total field amplitudes (solid line) are shown in Figure 11. The directivity behavior of the measured total displacement fields is similar to simulations using the 3D-FE model. The A0 scattered wavefield clearly shows the impact-induced damage area where the amplitude in the damaged area is considerably higher than in the intact area. Furthermore, the A0 scattered wavefield is also direction dependent. The existing slight difference between simulated and measured total fields may be due to the considered geometrical and stiffness properties of the damaged zone in the 3D-FE model, which can be slightly different from the ones of the real impacted plate. However, one should note that the small discrepancy in the forward directions between simulated and experimental data has already been observed and was attributed to bonding considerations between the layers [14]. Nevertheless, the symmetry of the directivity along 45°–225° in measured total field amplitudes reinforces the hypothesis of a homogeneous distribution of the elastic properties as predicted numerically inside the conical damage. Furthermore, the scattered field is obtained by considering the absolute difference between the total and the incident wave fields. The numerically calculated normalized amplitude of scattered A0 is shown in Figure 12. It is noted that the maximum scattered amplitude is towards the 45° direction i.e., in the direction of the incident A0 mode. It is also found that there exist two positions near 30° and 60°, where the amplitude of the scattered A0 mode is very small as compared to the 45° direction. The scattered field is symmetric along the 225°–45° direction, which corresponds to the direction of the wave vector of the generated guided wave.

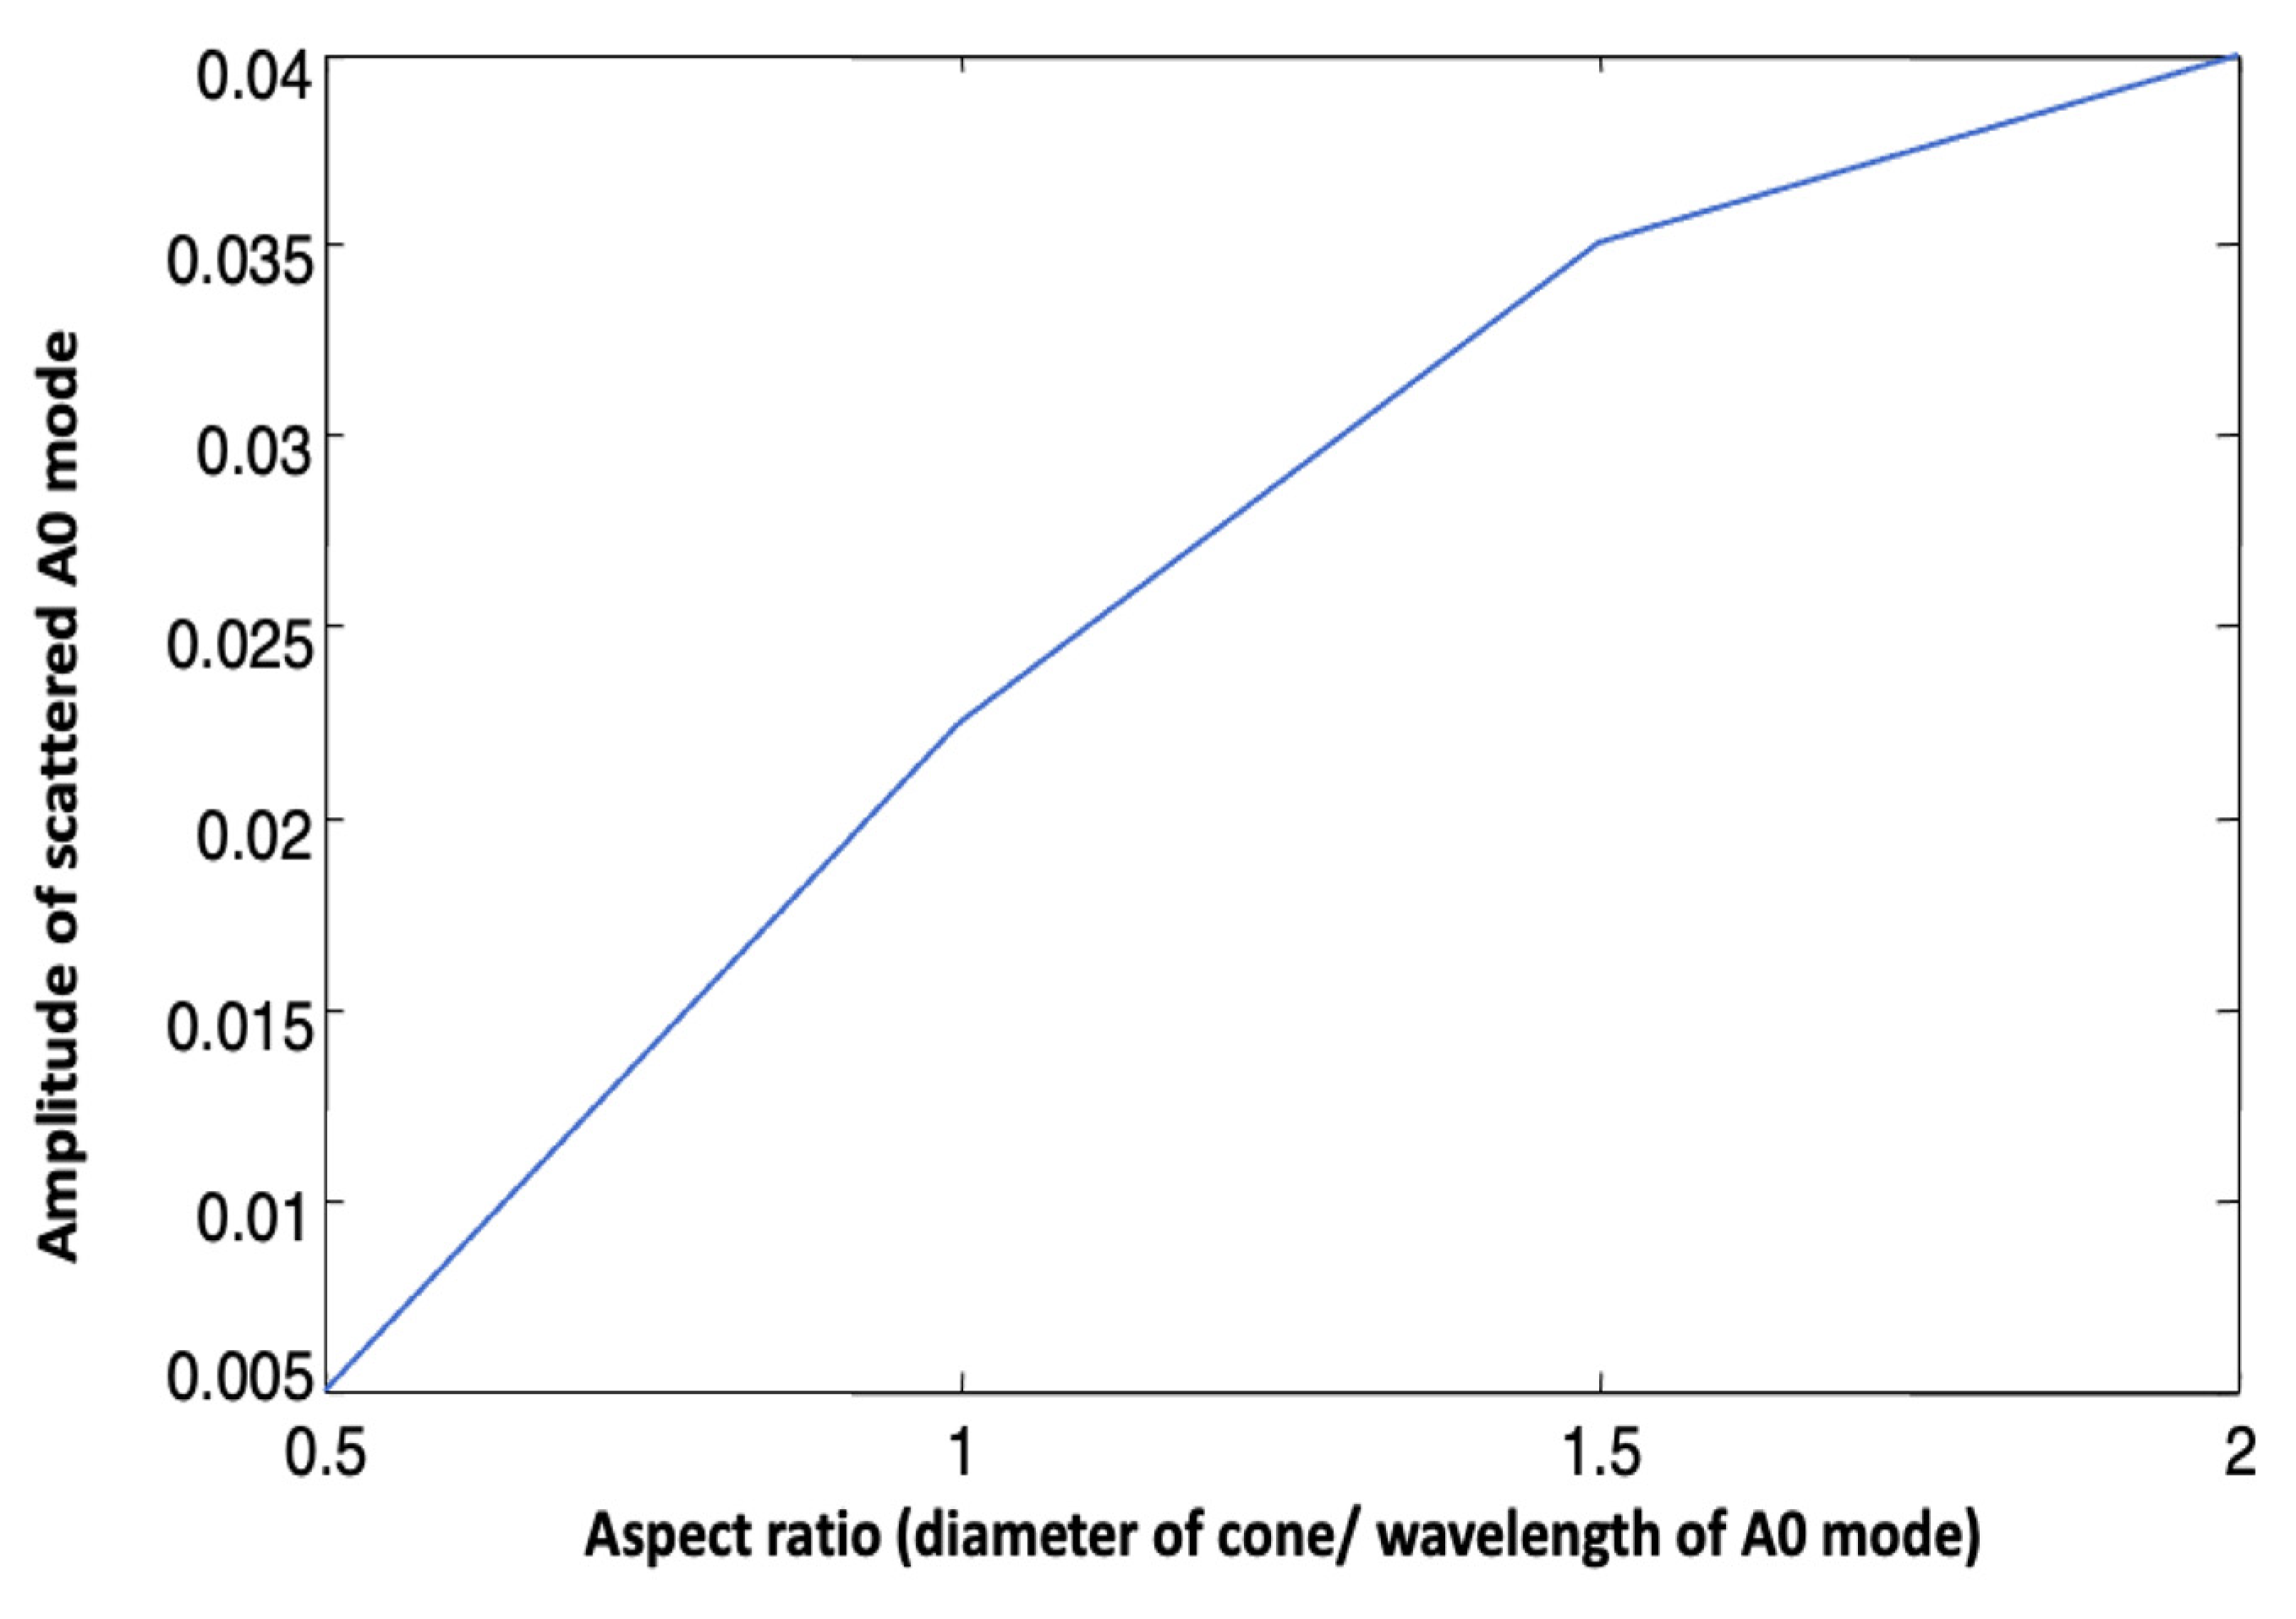
7. Influence of the Damage Depth and Size on the Scattering Directivity Pattern

This section deals with the numerical study to observe the effect of the geometrical size of conical damage on the scattered wave fields in the case of an incident A0 mode. For this purpose, two different studies have been performed. The first study considers the effect of the through-thickness variation (depth of the cone) on the scattered fields of the incident A0 mode while fixing the diameter at 30 mm in order to conform with the impact test presented earlier. Four different models with different depths of damaged zones equal to ¼, ½, ¾ and 1 of the total thickness, i.e., 1.55, 3.1, 4.65 and 6.2 mm, are considered in the 3D-FE models, respectively. The schematic of the different depths is shown in Figure 13a. The four different models are solved for the same incident A0 mode (100 kHz) using the same properties of the FE model as explained earlier in Section 5. The normalized scattered field corresponding to the A0 mode is shown in Figure 13b in the case of the abovementioned depths. In all four cases of through-thickness depths, it is observed that there is a negligible amplitude scattered between 120° and 330° angles towards the anticlockwise direction. For the first three cases of through-thickness depth equal to ¼, ½ and ¾, the maximum scattered amplitude is towards the 45° direction and the extent of the scattered field gets narrow for increasing through-thickness depths of the conical damage. It is also noted that with the increase in through-thickness depth, side lobes start to appear in the scattered displacement field amplitudes and increases with the increase in depth. In the case of all through-thickness depth i.e., for depth equal to 6.2 mm, the side lobes have more scattered amplitude towards 80° and 10° directions. In this case, the maximum scattered amplitude is not towards the 45° direction but is oriented toward the side lobe directions. In all four cases, the directivity diagrams are found to be almost symmetrical along the 225°– 45° direction due to the isotropic nature of the plate in the XZ plane (and symmetrical geometry of the damage). The variation of amplitude of the scattered A0 mode with through-thickness depths of the conical damaged zone in the direction of 45° is shown in Figure 14. The amplitude increases with the increase of depth until half the total through-thickness and then starts decreasing and decreases to the minimum value at all through-thickness depths. With this scattered field information for a fixed diameter of the damaged zone, one can gain an idea about the depth of the conical damage zone inside the composite plate. According to the literature, the micro-cracks due to impact damage (ex. matrix cracks) mainly contribute to the scattering of the wavefield in the damage region. The delamination reshapes the wavefield in the damaged and undamaged regions. In particular, it was found that the contribution of the delamination in the scattered wavefield is ~50% higher than the one corresponding to the matrix cracks [25].
In the second case, the effect of the aspect ratio (2 r/λ) on the scattered wave fields is studied, where r is the radius of the cone and λ is the wavelength of the A0 mode. The study is performed by taking a through-thickness depth equal to 5.2 mm. Four different 3D-FE models with aspect ratios equal to ½, 1, 3/2 and 2, respectively, have been solved. The schematic for different aspect ratios is shown in Figure 15a. The numerically calculated normalized scattered field for different aspect ratios is shown in Figure 15b. In all four cases, the maximum scattered amplitude of A0 mode is towards the 45° direction. It is observed that as the aspect ratio increases, the extent of scattered wave fields gets narrow in size. For an aspect ratio equal to ½ (shown in solid line), the angles of the minimum scattered amplitude are near ~120° and ~330°. For the case of an aspect ratio equal to 2, the angles of minimum scattered amplitudes are near ~20° and ~ 70°. Except for the aspect ratio of ½, the scattered field along the direction 120° towards 330° (in anticlockwise manner) is negligible. The size of the extent of the scattered field can give information about the size of the base of the conical defect. From the scattering directivity pattern, one can have an idea about the base size of the conical damage inside the composite plate, once the through-thickness depth is known. Finally, the variation of amplitude of the scattered A0 mode with respect to aspect ratios in the direction of 45° is shown in Figure 16. It is observed that with the increase in aspect ratio, the amplitude of scattered field also increases. In real experiments, it is naturally expected that the increase of the impact energy will simultaneously increase the depth and width of the damage area. According to the literature, as the damage area increases, the delamination and matrix crack contributions in the scattered wavefield will then increase with the same proportions in most directions. The contribution of the delamination is expected to be more important and the wavefield possesses a larger amplitude on the transmission side than in the reflection side [16,25,46].

8. Conclusions

In this paper, we have explored the possibility of modeling impact damages as a conical shape geometry with decayed stiffness properties in a homogeneous CFRC plate. This work is mainly motivated by the fact that scattering characteristics of Lamb waves in composites are more complicated than the scattering at defects in isotropic plates. The developed 3-dimensional finite element method allowed to determine the scattering pattern of an incident A0 Lamb wave in intact and impacted CFRC plates, where the excitation frequency was set below the A1 cut-off frequency. Besides, the numerically predicted scattered displacement fields were compared with the experimental measurements performed on CFRC plates with the same characteristics. A comparison between reconstructed signals from the FE model and experimental measurements allowed us to validate the model and to study the effect of different geometrical configurations (through-thickness depths and diameters of the base) of a conical damaged zone on the scattering diagrams. Results revealed that scattering directivity of the displacement field significantly depends on the depth and width of the conical damage created during the point-impact of the composite. Indeed, on the basis of the results, the scattering amplitude is maximum when the aspect ratio is beyond one and the depth of the impact damage is half the thickness of the composite. However, the detection of impact damage with a small aspect ratio and a relatively small depth (~0.3 or ~0.4) seems to be more difficult. The scattering physical insight at the impact-damaged area provided by the above-presented results can be used to optimize the monitoring of composite structures by improving the transducers’ location in connection with the involved Lamb mode(s). This work also showed that the study of backward scattering is not always possible. Indeed, results revealed that backward scattering is smaller in amplitude than the forward scattering and its amplitude is only important in the case of a small aspect ratio. Finally, we note that the post-impact damage study performed herein can be extended to include uncertainties related to the structural and mechanical properties of the composite. Indeed, the uncertainties we have taken into account are essentially related to the velocities (position and time of flight). Under the transversely isotropic condition, the optimized elastic constants as well as their uncertainties are determined by fitting the analytic group velocity dispersion curve with the experimental velocities. At the wavelength scale, the considered elastic constants include the average properties of the constituents of the composite as well as the defects therein such as micro-porosities, etc. This can affect the results obtained when the wave propagates in certain directions, especially those where the defects are most present. However, we note that taking uncertainties into account in the modeling is beyond the scope of this work. Indeed, the main objective of this contribution is to study the interaction of the A0 mode with a conical impact defect. Taking into account uncertainties is extremely expensive, computationally, in view of the large number of required analyses and requires the development of a specific study [46,47]. Indeed, the complex structure of composites and their manufacturing processes create different sources such as fiber waviness, ply wrinkling, machine tolerance, etc., which can be at the origin of uncertainty [48,49]. The statistical nature and distribution of imperfections in composites requires therefore the development of simulations, which are able to take into account the complexity of the material and perform calculations in reasonable times [50]. In that sense, Monte Carlo sampling methods are often used in different configurations aiming at reducing the calculation time while performing the uncertainty propagation analysis [47,51]. Other techniques based, for instance, on a metamodel approach [52,53] or a unified uncertain analysis approach [54] or else [55,56,57,58] can also be used. At present, there is still a need to develop an exact solution in the case of insufficient input data to determine the influence of uncertain elastic elements on the propagation of guided elastic waves, especially in the presence of damage in light of the work of Peng et al. based on the use of data-driven polynomial chaos expansion [59]. Indeed, a generalization and/or extension of our approach depends on such a development in order to perform reliable quantitative detection of damage created by impacts in isotropic and anisotropic composite structures with complex geometries.

Author Contributions

Formal analysis, M.B. and C.M.; Funding acquisition, M.B. and R.E.G.; Investigation, M.B. and C.M.; Methodology, D.S., M.B. and C.M.; Project administration, M.B. and R.E.G.; Software, D.S.; Supervision, M.B. and R.E.G.; Validation, D.S. and M.B.; Writing–original draft, D.S.; Writing–review & editing, M.B. All authors have read and agreed to the published version of the manuscript.

Funding

This work was supported by the project FUI Ecowingbox, France.

Institutional Review Board Statement

Not applicable.

Informed Consent Statement

Not applicable.

Acknowledgments

The authors thank Bertrand Lascoup and ESTACA Institute, Laval, France for the point impact experiments performed on the composite plates. This work was supported by the project FUI Ecowingbox, France.

Conflicts of Interest

The authors declare no conflict of interest.

References

  1. Forintos, N.; Czigany, T. Multifunctional application of carbon fiber reinforced polymer composites: Electrical properties of the reinforcing carbon fibers—A short review. Compos. Part B Eng. 2019, 162, 331–343. [Google Scholar] [CrossRef]
  2. Abbas, S.; Li, F.; Qiu, J. A Review on SHM Techniques and Current Challenges for Characteristic Investigation of Damage in Composite Material Components of Aviation Industry. Mater. Perform. Charact. 2018, 7, 224–258. [Google Scholar] [CrossRef]
  3. Bar-Cohen, Y.; Mal, A.; Lih, S.S.; Chang, Z. Composite materials stiffness determination and defects characterization using enhanced leaky Lamb dispersion data acquisition method. Proc. SPIE Nondestruct. Eval. Aging Aircr. Airpt. Aerosp. Hardw. III 1999, 3586, 250–255. [Google Scholar]
  4. Seale, M.D.; Madaras, E.I. Ultrasonic measurements of stiffness in thermal– mechanically fatigued IM7/5260 composites. J. Mater. Eng. Perform. 1999, 8, 429–436. [Google Scholar] [CrossRef]
  5. Basri, R.; Chiu, W. Numerical analysis on the interaction of guided Lamb waves with a local elastic stiffness reduction in quasi-isotropic composite plate structures. Compos. Struct. 2004, 66, 87–99. [Google Scholar] [CrossRef]
  6. Kundu, T.; Das, S.; Martin, S.A.; Jata, K.V. Locating point of impact in anisotropic fiber reinforced composite plates. Ultrasonics 2008, 48, 193–201. [Google Scholar] [CrossRef]
  7. Hajzargerbashi, T.; Kundu, T.; Bland, S. An improved algorithm for detecting point of impact in anisotropic inhomogeneous plates. Ultrasonics 2011, 51, 317–324. [Google Scholar] [CrossRef]
  8. Park, B.; Sohn, H.; Olson, S.E.; DeSimio, M.P.; Brown, K.S.; Derriso, M.M. Impact localization in complex structures using laser-based time reversal. Struct. Health Monit. 2012, 11, 577–588. [Google Scholar] [CrossRef]
  9. Fromme, P.; Rougé, C. Directivity of guided ultrasonic wave scattering at notches and cracks. J. Phys. Conf. Ser. 2011, 269, 012018. [Google Scholar] [CrossRef]
  10. Moreau, L.; Caleap, M.; Velichko, A.; Wilcox, P.D. Scattering of guided waves by flat-bottomed cavities with irregular shapes. Wave Motion 2012, 49, 375–387. [Google Scholar] [CrossRef]
  11. Moreau, L.; Caleap, M.; Velichko, A.; Wilcox, P.D. Scattering of guided waves by through-thickness cavities with irregular shapes. Wave Motion 2011, 48, 586–602. [Google Scholar] [CrossRef]
  12. Caminero, M.A.; García-Moreno, I.; Rodríguez, G.P.; Chacón, J.M. Internal damage evaluation of composite structures using phased array ultrasonic technique: Impact damage assessment in CFRP and 3D printed reinforced composites. Compos. Part B Eng. 2019, 165, 131–142. [Google Scholar] [CrossRef]
  13. Gama, B.A.; Gillespie, J.W. Finite element modeling of impact, damage evolution and penetration of thick-section composites. Int. J. Impact Eng. 2011, 38, 181–197. [Google Scholar] [CrossRef]
  14. Ng, C.-T.; Veidt, M.; Rose, L.; Wang, C.-H. Analytical and finite element prediction of Lamb wave scattering at delaminations in quasi-isotropic composite laminates. J. Sound Vib. 2012, 331, 4870–4883. [Google Scholar] [CrossRef] [Green Version]
  15. de Luca, A.; Perfetto, D.; de Fenza, A.; Petrone, G.; Caputo, F. Guided wave SHM system for damage detection in complex composite structure. Theor. Appl. Fract. Mech. 2020, 105, 102408. [Google Scholar] [CrossRef]
  16. Ng, C.-T.; Veidt, M. Scattering of the fundamental anti-symmetric Lamb wave at delaminations in composite laminates. J. Acoust. Soc. Am. 2011, 129, 1288. [Google Scholar] [CrossRef] [Green Version]
  17. Guo, N.; Cawley, P. The interaction of Lamb waves with delamination in composite laminates. J. Acoust. Soc. Am. 1993, 94, 2240–2246. [Google Scholar] [CrossRef]
  18. Hayashi, T.; Kawashima, K. Multiple reflections of Lamb waves at a delamination. Ultrasonics 2002, 40, 193–197. [Google Scholar] [CrossRef]
  19. Cegla, F.B.; Rohde, A.; Veidt, M. Analytical prediction and experimental measurement for mode conversion and scattering of plate waves at non-symmetric circular blind holes in isotropic plate. Wave Motion 2008, 45, 162–177. [Google Scholar] [CrossRef] [Green Version]
  20. Moreau, L.; Castaings, M. The use of an orthogonality relation for reducing the size of finite element models for 3D guided waves scatter- ing problems. Ultrasonics 2008, 48, 357–366. [Google Scholar] [CrossRef] [PubMed]
  21. Cantwell, W.; Morton, J. Impact perforation of carbon fiber reinforced plastic. Compos. Sci. Technol. 1990, 38, 119. [Google Scholar] [CrossRef]
  22. Mines, R.A.W.; Roach, A.M.; Jones, N. High velocity perforation behaviour or polymer composite laminates. Int. J. Impact Eng. 1999, 22, 561. [Google Scholar] [CrossRef]
  23. Mitrevski, T.; Marshall, I.H.; Thomson, R. The influence of impactor shape on the damage to composite laminates. Compos. Struct. 2006, 76, 116–122. [Google Scholar] [CrossRef]
  24. Liu, D. Impact induced delamination- A view of bending stiffness mismatching. J. Compos. Mater. 1988, 22, 674–792. [Google Scholar] [CrossRef]
  25. Zhang, B.; Sun, X.C.; Eaton, M.J.; Marks, R.; Clarke, A.; Featherston, C.A.; Kawashita, L.F.; Hallett, S.R. An integrated numerical model for investigating guided waves in impact-damaged composite laminates. Compos. Struct. 2017, 176, 945–960. [Google Scholar] [CrossRef] [Green Version]
  26. González, E.V.; Maimí, P.; Camanho, P.P.; Turon, A.; Mayugo, J.A. Simulation of drop- weight impact and compression after impact tests on composite laminates. Compos. Struct 2012, 94, 3364–3378. [Google Scholar] [CrossRef]
  27. Feng, D.; Aymerich, F. Finite element modelling of damage induced by low-velocity impact on composite laminates. Compos. Struct. 2014, 108, 161–171. [Google Scholar] [CrossRef]
  28. Sun, X.; Wisnom, M.; Hallett, S. Interaction of inter- and intralaminar damage in scaled quasi-static indentation tests: Part 2—Numerical simulation. Compos. Struct. 2016, 136, 727–742. [Google Scholar] [CrossRef] [Green Version]
  29. Ammari, H.; Zhang, H. SIAM. J. Math. Anal. 2017, 49, 3252. [Google Scholar]
  30. Leroy, V.; Strybulevych, A.; Page, J.H.; Scanlon, M.G. Influence of positional correlations on the propagation of waves in a complex medium with polydisperse resonant scatterers. Phys. Rev. E 2011, 83, 046605. [Google Scholar] [CrossRef] [Green Version]
  31. Sharma, G.S.; Skvortsov, A.; MacGillivray, I.; Kessissoglou, N. Sound scattering by a bubble metasurface. Phys. Rev. B 2020, 102, 214308. [Google Scholar] [CrossRef]
  32. Sharma, G.S.; Skvortsov, A.; MacGillivray, I.; Kessissoglou, N. On superscattering of sound waves by a lattice of disk-shaped cavities in a soft material. Appl. Phys. Lett. 2020, 116, 041602. [Google Scholar] [CrossRef]
  33. Singh, D.; El Guerjouma, R.; Bentahar, M. Interaction of Fundamental Lamb Modes with a Point Impact Damaged Zone in Composite Plates. In Proceedings of the Acoustics 2012 Nantes Conference, Nantes, France, 23–27 April 2012. [Google Scholar]
  34. Ke, W.; Castaings, M.; Bacon, C. 3D finite element simulations of an air-coupled ultrasonic NDT system. NDT E Int. 2009, 42, 524–533. [Google Scholar] [CrossRef]
  35. Deng, P.; Saito, O.; Okabe, Y.; Soejima, H. Simplified modeling method of impact damage for numerical simulation of T Lamb wave propagation in quasi-isotropic composite structures. Compos. Struct. 2020, 243, 112150. [Google Scholar] [CrossRef]
  36. Sjoblom, P.O.; Hartness, J.T.; Cordell, T.M. On low-velocity impact testing of composite materials. Compos. Mater. 1988, 22, 30–52. [Google Scholar] [CrossRef]
  37. Tan, K.T.; Watanabe, N.; Iwahori, Y. X-ray radiography and micro-computed tomography examination of damage characteristics in stitched composites subjected to impact loading. Compos. Part B Eng. 2011, 42, 874–884. [Google Scholar] [CrossRef]
  38. Lee, S.M.; Cheon, J.S.; Im, Y.T. Experimental and numerical study of the impact behavior of SMC plates. Compos. Struct. 1999, 47, 551–561. [Google Scholar] [CrossRef]
  39. Zhou, G.; Lloyd, J.C.; McGuirk, J.J. Experimental evaluation of geometric factors affecting damage mechanisms in carbon/epoxy plates. Compos. Part A Appl. S 2001, 32, 71. [Google Scholar] [CrossRef]
  40. Shyr, T.; Pan, Y. Impact resistance and damage characteristics of composite laminates. Compos. Struct. 2003, 62, 193. [Google Scholar] [CrossRef]
  41. Talreja, R.; Phan, N. Assessment of damage tolerance approaches for composite aircraft with focus on barely visible impact damage. Compos. Struct. 2019, 219, 1–7. [Google Scholar] [CrossRef]
  42. Castaings, M.; Singh, D.; Viot, P. Sizing of impact damages in composite materials using ultrasonic guided waves. NDT E Int. 2012, 46, 22–31. [Google Scholar] [CrossRef]
  43. COMSOL, User’s Guide. Version 3.5a by COMSOL AB 2008. Available online: http://www.comsol.com/ (accessed on 23 February 2012).
  44. Leckey, C.A.; Wheeler, K.R.; Hafiychuk, V.N.; Hafiychuk, H.; Timuçin, D.A. Simulation of guided-wave ultrasound propagation in composite laminates: Benchmark comparisons of numerical codes and experiment. Ultrasonics 2018, 84, 187–200. [Google Scholar] [CrossRef] [PubMed]
  45. Drozdz, M.; Moreau, L.; Castaings, M.; Lowe, M.; Cawley, P. Efficient Numerical Modelling of Absorbing Regions for Boundaries of Guided Waves Problems. In AIP Conference Proceedings; AIP Publishing: Melville, NY, USA, 2006; p. 126. [Google Scholar]
  46. Murat, B.I.S.; Khalili, P.; Fromme, P. Scattering of guided waves at delaminations in composite plates. J. Acoust. Soc. Am. 2016, 139, 3044–3052. [Google Scholar] [CrossRef]
  47. Richard, B.; Timothy, J.; Dodwell, R.T.; Haftka, K.N.H.; Kim, T.; Kynaston, S.; Scheichl, R. Uncertainty Quantification of Composite Structures with Defects using Multilevel Monte Carlo Simulations. In Proceedings of the 17th AIAA Non-Deterministic Approaches Conference, Kissimmee, FL, USA, 5–9 January 2015. [Google Scholar]
  48. Melchers, R.E. Structural Reliability Analysis and Prediction; Wiley: Hoboken, NJ, USA, 1999. [Google Scholar]
  49. Dodwell, T.; Butler, R.; Hunt, G. Out-of-plane ply wrinkling defects during consolidation over an external radius. Compos. Sci. Technol. 2014, 105, 151–159. [Google Scholar] [CrossRef] [Green Version]
  50. Rhead, A.T.; Dodwell, T.J.; Butler, R. The effect of tow gaps on compression after impact strength of robotically laminated structures. Comput. Mater. Contin. 2013, 35, 1–16. [Google Scholar]
  51. Li, Y.-W.; Elishakoff, I.; Starnes, J.H.; Bushnell, D. Effect of the thickness variation and initial imperfection on buckling of composite cylindrical shells: Asymptotic analysis and numerical results by BOSOR4 and PANDA2. Int. J. Solids Struct. 1997, 34, 3755–3767. [Google Scholar] [CrossRef]
  52. Chiachio, M.; Chiachio, J.; Rus, G. Reliability in composites—A selective review and survey of current development. Compos. Part B Eng. 2012, 43, 902–913. [Google Scholar] [CrossRef] [Green Version]
  53. Ghasemi, H.; Rafiee, R.; Zhuang, X.; Muthu, J.; Rabczuk, T. Uncertainties propagation in metamodel-based probabilistic op- timization of CNT/polymer composite structure using stochastic multi-scale modeling. Comput. Mater Sci. 2014, 85, 295–305. [Google Scholar] [CrossRef]
  54. Dey, S.; Mukhopadhyay, T.; Adhikari, S. Metamodel based high-fidelity stochastic analysis of composite laminates: A concise review with critical comparative assessment. Compos. Struct. 2017, 171, 227–250. [Google Scholar] [CrossRef] [Green Version]
  55. Conceição, A.C.; Hoffbauer, L.N. Reliability-based, design optimization and uncertainty quantification for optimal conditions of composite structures with non-linear behavior. Eng. Struct. 2017, 153, 479–490. [Google Scholar] [CrossRef]
  56. Dey, S.; Mukhopadhyay, T.; Sahu, S.; Li, G.; Rabitz, H.; Adhikari, S. Thermal uncertainty quantification in frequency responses of laminated composite plates. Compos. Part B Eng. 2015, 80, 186–197. [Google Scholar] [CrossRef] [Green Version]
  57. Das Neves Carneiro, G.; Antonio, C.C. A RBRDO approach based on structural robustness and imposed reliability level. Struct. Multidiscip. Optim. 2017, 57, 2411–2429. [Google Scholar] [CrossRef]
  58. Das Neves Carneiro, G.; Antonio, C.C. Robustness and reliability of composite struc- tures: Effects of different sources of uncertainty. Int. J. Mech. Mater Des. 2017, 15, 93–107. [Google Scholar] [CrossRef]
  59. Peng, X.; Li, D.; Wu, H.; Liu, Z.; Li, J.; Jiang, S.; Tan, J. Uncertainty analysis of composite laminated plate with data-driven T polynomial chaos expansion method under insufficient input data of uncertain parameters. Compos. Struct. 2019, 209, 625–633. [Google Scholar] [CrossRef]
Figure 1. Schematic for measuring group velocities of A0 and S0 Lamb wave modes.
Applsci 11 07276 g001
Figure 2. Optimized phase velocity dispersion curves corresponding to 6.2 mm-thick composite plate.
Applsci 11 07276 g002
Figure 3. Experiment setup for controlled impact damage of energy equal to 40 Joule.
Applsci 11 07276 g003
Figure 4. (a) A-Scan signals corresponding to the reflection of a longitudinal ultrasonic wave at the defect position of the impacted CFRC plate; (b) C- Scan image based on the A-scans performed at intact and damaged regions of the CFRC plate. The amplitude of the back-wall echo is strongly decreasing in the damaged area. The damage was found to be ~30 mm wide.
Applsci 11 07276 g004
Figure 5. Schematic of the 3D-finite element model.
Applsci 11 07276 g005
Figure 6. Schematic of the considered positions of excitation and reception in the model and experiments.
Applsci 11 07276 g006
Figure 7. Schematic of the experimental setup for measuring the out-of-plane amplitude of the A0 mode.
Applsci 11 07276 g007
Figure 8. Comparison between reconstructed signal from the FE model and experimental measurements for two positions 142 mm apart.
Applsci 11 07276 g008
Figure 9. Reconstructed signal from the FE model at some angular positions 20 mm away from the center of impact damage.
Applsci 11 07276 g009
Figure 10. Experimental measurements and numerical predictions of the incident A0 mode propagating in the intact CFRC plate.
Applsci 11 07276 g010
Figure 11. Experimental measurements (dashed) and numerical predictions (solid) of the total displacement field of A0 mode propagating in the impacted CFRC plate.
Applsci 11 07276 g011
Figure 12. Directivity pattern of the scattered field of the A0 mode deduced from total displacement fields on intact and damaged CFRC plates (See Figure 10 and Figure 11).
Applsci 11 07276 g012
Figure 13. Effect of the conical depths: (a) Schematics of four different through-thickness depths (1.65 mm: red, 3.1 mm: black, 4.65 mm: green and 6.2 mm: blue), (b) normalized scattered amplitudes A0 mode for different depths.
Applsci 11 07276 g013
Figure 14. Effect of the through thickness of the conical defect on the scattered A0 mode towards the 45° direction.
Applsci 11 07276 g014
Figure 15. Effect of aspect ratios (2 r/λ): (a) Schematics for four different aspect ratios (0.5: red, 1: green, 1.5: black, 2: blue), (b) normalized scattered amplitude of A0 mode.
Applsci 11 07276 g015
Figure 16. Variation of amplitude of scattered A0 mode with respect to aspect ratio (2 r/λ) towards 45° direction.
Applsci 11 07276 g016
Table 1. Homogenized elastic properties of the carbon fiber reinforced composite plate.
ρ (g/cm3)C11 (GPa)C22 (GPa)C33 (GPa)C12 (GPa)C13 (GPa)C23 (GPa)C44 (GPa)C55 (GPa)C66 (GPa)
1.55 ± 0.0552.4 ± 2%12.6 ± 2%52.4 ± 2%3.1 ± 2%17.8 ± 2%3.1 ± 2%3.7 ± 2%17.3 ± 2%3.7 ± 2%
Publisher’s Note: MDPI stays neutral with regard to jurisdictional claims in published maps and institutional affiliations.

