1. Introduction
Pesticide drift, a migration movement of pesticide from target area to any non-target area, has potential safety hazards for the surrounding environment, animals, plants, and people. These include: (1) human exposures during pesticide manipulation are a serious concern, which have an inevitable relationship to diverse acute and chronic illnesses [
1,
2], particularly for workers in neighboring areas and nearby residents; and, (2) this is especially dangerous if herbicides are sprayed and the treated fields are adjacent to sensitive crops [
3]. Over the past decades, fish poisoning deaths in ponds due to pesticide drift have occurred frequently. The above pesticide accidents have caused a lot of economic disputes and human health problems [
4,
5].
Pesticide application has been conducted by various types of spraying equipment. The backpack knapsack sprayers, including air-assisted sprayers and liquid pump sprayers, have a great risk of operator exposure [
6] and high run-offs [
7]. Self-propelled boom sprayers are equipped with several nozzles mounted linearly. They are suitable for application on vast land with high work efficiency [
8]. Developed countries such as the United States and Australia have been at the forefront of pesticide applications by manned fixed-wing aircraft. Although manned aircraft are equipped with advanced pesticide spraying technology, after decades of development there are still many limitations to them. The flight height is generally more than 5 m to ensure flight safety, which causes serious drift, especially when the wind speed is high in the field. The high cost of pilot training and the need for a dedicated airport make manned fixed-wing aircraft more expensive to operate. Unmanned aerial vehicle sprayers integrate many excellent characteristics of the above application technologies. UAVs overcome terrain difficulties by spraying above the crop without contact [
9]. Because of the UAV’s rotors, a vortex formed on the crop branches and leaves enhances the penetration ability of droplets through the crop canopy with greater inertial force [
10]. According to the report ‘global engineering frontier 2020′ released by the Chinese Academy of Engineering, the research on precise target application technology of plant protection includes UAVs as one of them. Subject to the report from the Association of Unmanned Vehicles Systems International, more than USD 80 billion from 2015 to 2025 could be created due to the legalization of commercial drones and 80% of that total could be contributed by agriculture drones [
11]. Although UAVs drift less than fixed-wing aircraft because of their low flight height and rotor advantages, spray drift is still a concern for scientists.
In order to reduce drift, researchers have conducted a variety of studies on the factors that influence droplet drift. The droplet size is one of the significant elements affecting the movement of the droplets. Droplets below 200 µm can significantly drift off-target when they are exposed to a crosswind of 5 km per hour [
12]. The properties of the spray liquid determined by type and dosage of adjuvants in the formulation affect the spray pattern for all categories of nozzles [
13], which occupies an important position in controlling the atomization process to optimize pesticide inputs and minimize the output of drifting contamination [
14]. Dombrowski and Johns studied the mechanisms of spray formation by a liquid sheet to be oscillating or perforated and explored how these were influenced by viscosity, surface tension, and density [
15,
16,
17]. Air-induction nozzles increase the droplet size by generating droplets with bubbles to achieve the purpose of reducing drift. Aijun et al. investigated the effects of 11 kinds of nozzles on droplet drift and results showed that the drift potential index of the IDK series was the lowest [
18]. Models, both empirical and mechanistic, have been developed for decades to predict the deposition and drift from aerial pesticide application [
19,
20,
21]. The ideal model for setting buffer zones and evaluating the off-target movement of droplets must take mechanical principles and physical phenomena into account, such as gravity, droplet evaporation, and air resistance.
The field tests, wind tunnel studies, and models are general methods to investigate spray drift. The study of droplet drift in the field can truly reflect the actual spray in the operating scene. Wang et al. evaluated the field drift potential of three different volume median diameters (100, 150, and 200 µm) produced by centrifugal nozzles of a commercial quadcopter exposed to different wind speeds [
8]. Wang et al. compared the drift potential of oil-powered UAVs and battery-powered UAVs with adjuvant products, the results showed that the drift risk of agricultural spraying could be significantly reduced by declining the number of fine droplets and changing the distribution pattern of droplet spectra [
22]. However, the field conditions, such as light intensity, wind direction, speed, humidity, and temperature, are complex, changeable, and uncontrollable. The wind tunnel test can simulate field operation and accurately control parameters [
23]. However, due to the limited space in the wind tunnel, previous studies generally spaced a single nozzle or a spray unit consisting of a small rotor and a nozzle at the top of the wind tunnel [
24,
25,
26,
27]. In order to facilitate the establishment of the model and obtain the convergence results of the model, some perturbation factors are often ignored, which affects the accuracy of the model.
Based on the analysis of the advantages and disadvantages of the above methods, it is expected to study the drift characteristics of droplets in the compound flow field of external airflow and the mutual perturbation between rotors while accurately controlling test conditions. Nevertheless, few current studies have taken into account the compound flow field, especially for multi-rotor UAVs, which occupy a large proportion in China. In this paper, to evaluate the drift under three wind speeds (2, 4, and 6 m/s) and four hydraulic pressures (2, 3, 4, and 5 bar), a drift test of a four-rotor UAV was conducted in the wind tunnel laboratory under strictly controlled test conditions. A UAV test platform was placed at the end of a direct-flow wind tunnel, and polytetrafluoroethylene (PTFE) wire was used to collect the droplets driven by the airflow from the wind tunnel and the disturbance of the rotor. The objective of these tests was to characterize the spray drift based on the strict and controllable test conditions in order to provide a guidance program to reduce pesticide drift in farmers’ actual operations.
2. Materials and Methods
2.1. Wind Tunnel Measurements
2.1.1. The Spray Drift Device
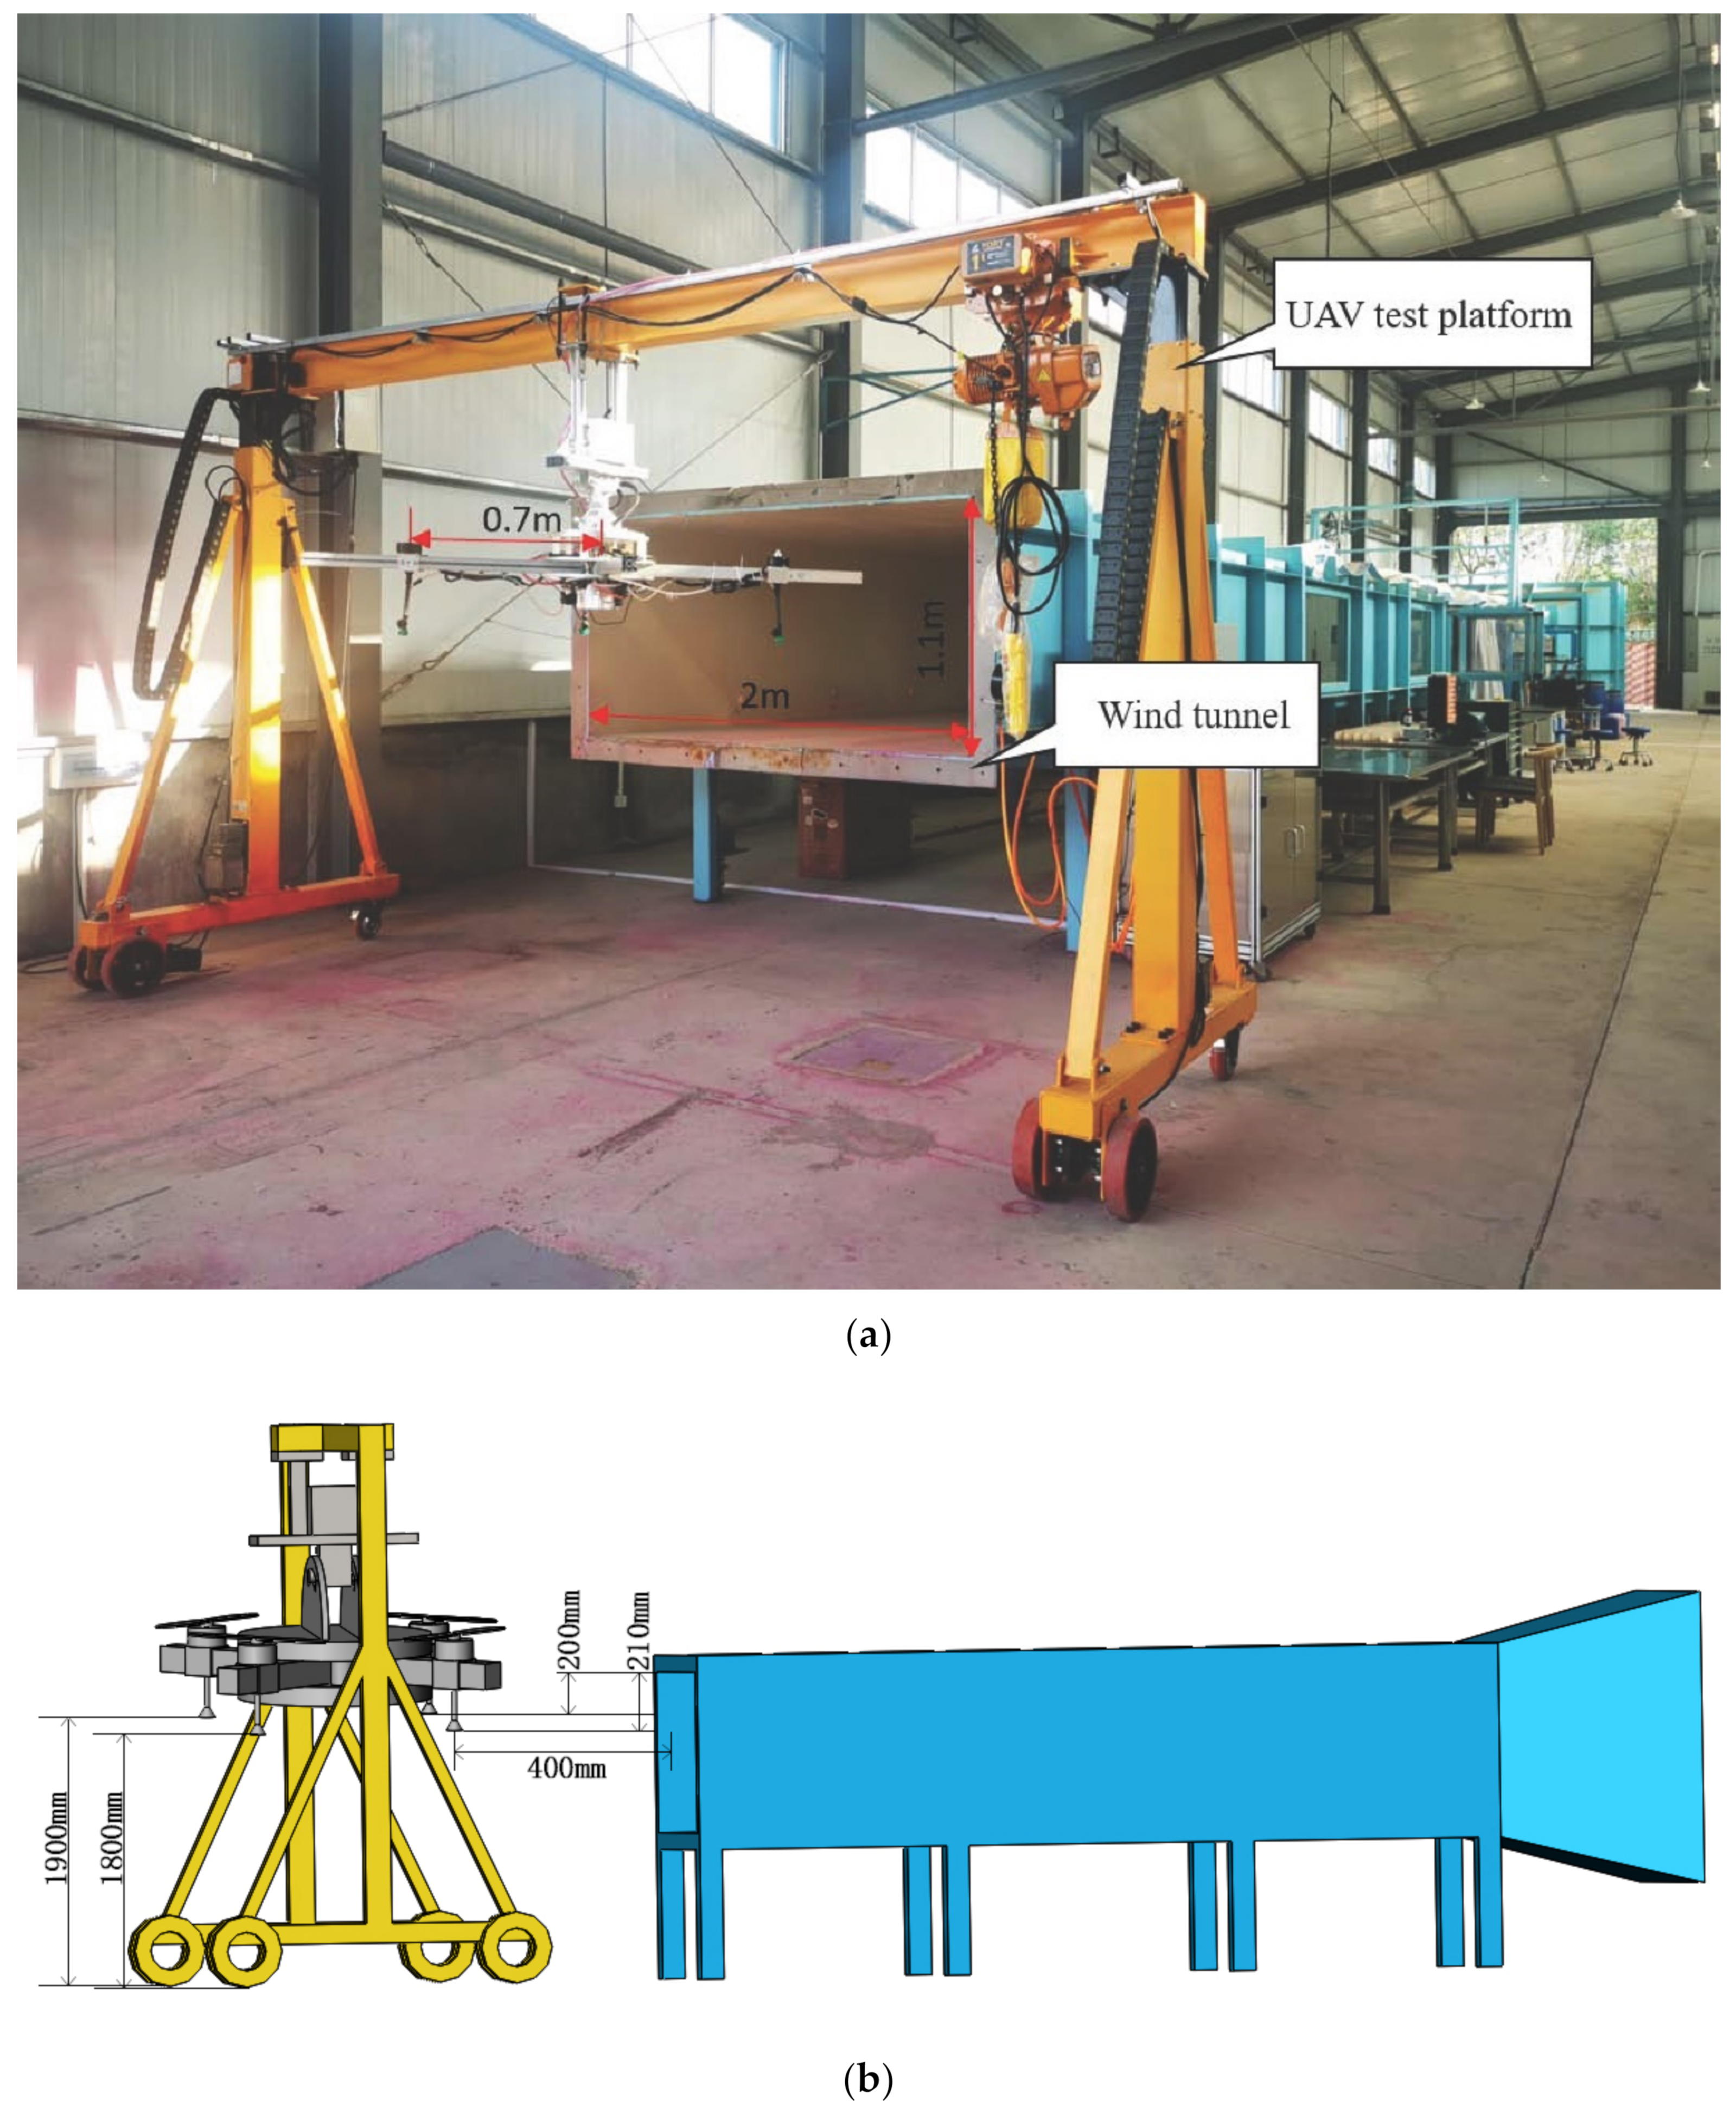
The wind tunnel could generate wind at 2–52 m/s airspeeds, which is located at the National Center for International Collaboration Research on Precision Agricultural Aviation Pesticide Spraying Technology (NPAAC) in South China Agricultural University (
Figure 1a,b). For the purpose of ensuring the safety test of the UAV and keeping the aircraft in a cross-wind environment, a test stand as the UAV platform was placed at the end of the DC wind tunnel whose cross-section size was 2.0 m × 1.1 m (width × height) (
Figure 1a). The distance between the nozzle nearest to the wind tunnel and the end face of the wind tunnel was 400 mm (
Figure 1b). The wind tunnel and the UAV test platform constituted the drift test unit which can produce the predetermined conditions. The combination of a hot wire anemometer and wind tunnel governor was to make the wind speed at the nozzles on the UAV test platform reach the expected wind speeds of 2, 4, and 6 m/s. For the flight parameters and spraying parameters of the aircraft, the following settings were carried out in this test: The arm length of the four-rotor model was 700 mm and the 36 × 12.8 inches (diameter × pitch) rotor was chosen. According to the flight attitude of the UAV during routine operation, an angle of 5 degrees for the windward angle of the UAV rotor along the vertical direction of the wind produced by the wind tunnel was set. Therefore, the rotation rate of the front rotors was 1800 rpm and that of the rear rotors was 2200 rpm based on a flight speed of 3–5 m/s. Four 110015VP fan nozzles (LICHENG Co., LTD, Ningbo, China) were installed directly under the rotors. The height of the nozzles from the ground was 1800–1900 mm due to the horizontal inclination of the aircraft. At the same time, the nozzles were vertically 200–210 mm away from the top of the wind tunnel to ensure that the nozzles were at the rated airflow with low turbulence (
Figure 1b). The spray system was supplied by a hydraulic pump with a pressure capacity of 10 bar, which provided 2, 3, 4, and 5 bar pressures for this test. Before the spraying application, all clean sampling lines were arranged by well-trained operators who wore new disposable nitrile gloves to avoid cross-contamination. Then, the rotors of the UAV test platform were activated. After the rotors rotated steadily, the liquid supply switch of the spray system was turned on and maintained for 10 s to prevent oversaturation of the sampling lines. All tests were repeated three times.
2.1.2. Droplet Size Measurement
The droplet sizes of the spray ejected from the nozzle at pressures of 2, 3, 4, and 5 bar were measured with five repetitions in the test section inside the wind tunnel. The nozzle was also 200 mm away from the top of the wind tunnel, which was consistent with the placement parameters of the nozzles installed on the drift test unit relative to the top of the wind tunnel. The DP-02 laser diffraction instrument (OMC instrument co. Ltd., Zhuhai, China) containing a data processing system, a signal acquisition device, and a collimated laser generator was used to measure the droplet size (
Figure 2). The laser diffraction instrument could measure droplet sizes ranging from 1 to 1500 µm. The collimated laser generator and signal acquisition device were located on both sides of the wind tunnel, and the distances from the nozzle were all 1 m. The laser beam was perpendicular to the liquid sheet and located on the central axis of the liquid sheet produced by the fan nozzle. The distance from the measuring position to the nozzle can influence the result of the droplets’ spectra. The fine droplets need more travel time in the laser beam than they do at their initial velocity because the air drag causes the velocity of fine droplets to decay rapidly at a short distance [
28]. The difference between the prolonged travel time of small droplets in the laser beam and the time of passing through the laser beam at its original velocity can lead to a smaller droplet size [
29]. To ensure complete break-up of the liquid sheet and to avoid deviation of the result due to the sudden decrease of the fine droplet speed, the droplet size was measured at a distance of 0.1 m from the nozzle through a large number of experimental verifications and observations. The spray liquid used to measure droplet size was consistent with that used in the drift test.
2.2. Spray Liquid
The use of pesticide solutions for droplet drift assessment is the most reliable method. However, the organic solvent is usually chosen to extract pesticide active ingredients from the samples in the laboratory, such as hexane [
30,
31,
32] and acetone [
33]. The extensive use of organic solvent, their waste disposal, and a high-frequency repetitions at the experimental site not only harms the environment but also has a health hazard for laboratory personnel. Rhodamine-B (Shanghai Aladdin Biochemical Technology Co., Ltd., Shanghai, China), a fluorescent tracer, as a safe, water-soluble, easy to measure, and moderately economical ideal surrogate, was used to assess the spray drift at a concentration of 5 g/L in each treatment. The OP-10 surfactant (Tianjin Kermel Chemical Reagent Co., Ltd., Tianjin, China) was added into the solution at a proportion of 1% to make the physical properties of the solution similar to that of the pesticide. Before pouring into the tank of the drift test unit, rhodamine-B, OP-10 surfactant, and ultrapure water were mixed at the ratio required above and fully stirred. Since the test lasted for a week and considering the instability of Rhodamine-B, the solution was reconfigured every test day.
2.3. Deployment of Spray Samplers
The tests were conducted in the wind tunnel laboratory, which was surrounded by walls. The area inside the walls was large enough. In order to reduce the interference of natural airflow on the droplet movement from the nozzles, the meteorological condition of breeze or no wind was chosen on the test day. In addition, the airflow was blocked by the wall, so that the natural airflow in the sampling area was very weak. The climatic conditions were monitored by a weather station, which displayed wind speeds of 0–0.2 m/s, temperatures of 20–23 °C, and a relative humidity of 64–70%.
The polytetrafluoroethylene (PTFE) line (φ = 2 mm) was used as a sampler to collect the ground and airborne drift in the sampling area according to the ISO 22,866 methodology [
34]. To prevent the concrete surface from disturbing the rotor wind and the wind from the wind tunnel, lawns were placed below the drift test unit and in the sampling area. At the same time, the length of each PTFE line was 1.8 m less than the width of the wind tunnel to allow that the entire PEFE line was within the rated flow of the wind tunnel. There were 10 PTFE lines in the ground deposition, and the two ends of each line were tied horizontally on the poles at specific locations 0.5 m above the ground. These poles were located in the downwind direction of the drift test unit, and the distances from the UAV test platform were 2, 3, 4, 5, 6, 8, 10, 15, 20, and 30 m (
Figure 3). In addition to collecting samples in the ground deposition area, two sets of sampling towers located at 2 m and 20 m from the UAV test platform were used to collect the airborne droplets. The PTFE lines hung between the two vertical towers were 0.5 m from the ground at 0.5 m intervals up to a height of 3 m at the 2 m location. The PTFE lines hung between the two vertical towers were 0.5 m, 1.5 m, and 3 m above the ground at the 20 m location (
Figure 3). After each treatment was finished, each PTFE line was separately placed into marked zip-lock bags, which were indicated with specific information that included experimental treatment and location. Each PTFE line was collected by a cordless drill supporting a polyethylene pipe onto which the PTFE line was roiled, referring to the method of Wang [
8]. This method not only solved the problem that PTFE lines were not easy to collect because they were difficult to fold, but also reduced the probability of contact between hands and the PTFE lines containing the data. All zip-lock bags from the treatment were immediately put into a refrigerator at a temperature of −20 °C.
2.4. Sample Processing
On each test day, collection of the spray drift was carried out during the daytime, and the PTFE lines collected were moved to the laboratory in the shortest possible time. Analysis of the fluorescence characteristics of the spray liquid containing Rhodamine-B was performed on an F-380 fluorescence spectrophotometer (Tianjin Gangdong Technology Co., Ltd., Tianjin, China). The excitation wavelength of 542 nm and emission wavelength of 579 nm was selected by scanning the spray liquid. Because there is a linear relationship between the concentration of the Rhodamine-B aqueous solution and the fluorescence intensity only at low concentrations, the volume of ultrapure water for elution should be determined according to the deposition amount at each sampling line. 40 mL of ultrapure water was injected into the zip-lock bags with a pipette to wash off the tracer on the PTFE line, which was collected when the UAV rotors were rotating. According to the test observation, the droplets sprayed from the nozzle may drift seriously if the UAV rotors did not rotate. Therefore, the volume of ultrapure water depended on the actual situation when processing the sampling lines obtained from the rotor non-rotating treatments. For full extraction, the bags were shaken and rubbed for almost 30 s. A 3 mL fraction of each extract was poured into a cuvette for analysis.
Five calibrated working solutions at the concentrations of 0.01, 0.1, 0.2, 0.5, and 1 mg/L were prepared by thinning a stock solution with ultrapure water. After a large number of comparative studies between solutions of known concentration and the linear response relationship (Y = 0.002158x − 0.541634, R
2 = 0.9998), the maximum and minimum detection limits for Rhodamine-B were 1 mg/L and 0.01 mg/L, respectively. Taking into account factors of the volume of the dilution solution, the concentration of Rhodamine-B in the spray solution, the spray time, the flow rate, the background (collector and dilution liquid), and the calibration line, the reading of the test solution on the fluorometer can be converted to the droplet deposition amount per unit length (µL/m) (Equation (1)).
where
is the drift deposition, µL;
is the fluorimeter reading of each sampling line;
is the fluorimeter reading of the blanks (collector and dilution water);
is the calibration factor, µg/L;
is the volume of dilution used to solute tracer from collector, L;
is the spray concentration, g/L;
is the collection area of the collector for capturing the spray drift. In this paper,
is regarded as 1, because the deposition of the entire sampling line is needed.
Lidong Cao’s research on the exposure of pesticide applicators showed that the recovery rates of different concentrations of dyes were diverse [
6]. For the recovery of Rhodamine-B from sampling lines to be studied, clean PTFE lines were spiked with four appropriate volumes of Rhodamine-B solution in order to reach the concentrations of 0.05, 0.15, 0.35, and 0.75 mg/L when 40 mL of ultrapure water was injected into bags. The extraction and fluorescence analysis methods followed those described for the drift test. For the four concentration levels, the recovery rates and relative standard deviations (supplied in parentheses) were 87.38% (7.53%), 95.26% (3.91%), 100.12% (3.09%), and 83.69% (5.27%), respectively. The fluorimeter readings were corrected based on the recovery rates of the calibration solution interval.
2.5. Data Analysis
The Dv
0.1, Dv
0.25, Dv
0.5, Dv
0.75 and Dv
0.9 of the droplet volume diameters were used to express the droplets size of spray. These parameters are defined as the droplet diameters corresponding when the volume of droplets accumulated from small to large are equal to 10%, 25%, 50%, 75%, and 90% of the total volume detected, respectively. The relative size range (
Δs), providing the range of the droplet size is relative to the volume median diameter (Dv
0.5), was used to express the degree of droplet size divergence (Equation (2)). The probability integral distribution function of the droplet size (
PDFN) was used to describe the number distribution of the droplet size increment intervals in the entire size range (Equation (3)). The diameter increment was 50 in the droplet size analysis.
where,
is the droplet number of each size increment interval;
N is the total number of droplets collected.
The total drift and each area drift of each treatment were integrated into the deposition collected from all sampling lines in each corresponding area (Equation (4)).
where
is the deposition amount in the integral interval, µL;
is the deposition amount collected from each sampler, µL; a is the bottom of the interval and b is the top of the interval. For the entire sample area, a is 2 and b is 30.
The drift ratio was calculated as a percentage of the deposition amount in one area to the total spray drift in the same treatment. The deposition ratio, a dimensionless parameter, was defined as the rate of the total drift at the current pressure to that at the reference pressure of 2 bar in the drift area and indicated the effect of pressure on the drift.
4. Discussion
Previous research that has compared the drift control technologies have done so without the rotor wind field or with a small rotor unit in a wind tunnel laboratory and concluded that the wind speed [
36], the physical properties of the pesticide [
37], nozzle [
26], and operation parameters [
38] have a significant effect on the spray drift. However, in practice, these conclusions, mainly applicable to ground equipment, cannot directly guide the operation of the UAVs, because they were separated from an important factor of the rotor wind field. A finding of particular interest in our study is that the rotor wind field played a remarkable role in reducing drift. Although the spray liquid was still collected from the sampling lines above the rotors fixed on the 2-m spray tower, the downwind field of the rotors also suppressed the droplet drift, even at a relatively high wind speed. This conclusion is very useful for reducing drift in terms of controlling the trajectory of the droplets. However, previous studies on the influence of the aircraft flow field on drift are mostly focused on fixed-wing aircraft [
39]. Compared with the wind tunnel test, the field test using the UAV as the pesticide spraying equipment not only gets rid of the space restriction but also the field environment is in line with the actual work scene, so the research results are more authentic. Yet the field results are difficult to reproduce due to the lack of strict control of the experimental conditions because of the rapid changes to the field environment. Our research is an innovation, which introduces UAVs into the wind tunnel laboratory and realizes the combination of wind tunnel and field research advantages.
In the field test, the drift obtained from the UAVs flying at a certain speed must be different from that obtained from the UAVs with a fixed position, continuously spraying for 10 s to ensure sufficient liquid collection on the sampling lines. The drift in this test, in which a pitch angle of 5 degrees was set according to the flight attitude during the actual operation, can be equivalent to that of the field test based on the functional relationship of speed, time, and distance. In addition, many of the regulations relating to spray drift issued by research institutions, such as the Local Environmental Risk Assessment for Pesticides in the UK [
40], has relied on the wind tunnel evaluation system. The reliable data used to guide the operation can be obtained through small-scale tests under strictly controlled test conditions. The investigations of the relationship between field data and the wind tunnel [
40] and the computer-based drift model [
41] have been reported recently, but there is difficulty identifying the changing data sets. How to represent the ‘real world’ is a challenging task, because of the uncontrollable and irregular test conditions which may have a great impact on the drift. Coupled with the UAVs rotor factor, the study of the relationship between wind tunnel measurement and field measurement of the UAVs still has a long way to go. Therefore, this research provides an effective solution for this subject.
Our results suggest that droplet size distribution may significantly affect spray drift, as mentioned by Bergeron [
12]. In this study, relative to the flow rate ratio, the deposition ratios at pressures of 3, 4, and 5 bar were elevated for the three wind speeds. This provided evidence that the pesticide drift results from the combined effect of droplet size and wind speed. The volume median diameter of the droplets usually used to describe the droplet size characteristics is not enough to discuss the substantial information of an entire spray, either globally or within some subarea. The approach containing two or more different parameters related to droplet size should be encouraged to be adopted to represent a full and reasonably accurate description of the spray. There are limitations to this study. First, the droplet velocity was not analyzed because it is difficult to measure. However, the velocity of fine droplets decays faster to their final velocity within a very short distance than that of coarser droplets, which means that their time residing in the air is different and then affects the spray drift. Second, in all test treatments, there was a delay when the liquid pump was turned on, which can likely be attributed to the total spray volume.
Currently, the uniformity of ground deposition of the UAVs spraying is much lower than that of traditional plant protection machinery [
7], because of the operation mode of the UAVs. Since fruit trees are mostly planted in mountainous areas, UAVs are expected to be a solution to the problem of mechanized operation [
42]. Therefore, the improvement of the spray system attracts a large number of researchers to increase the uniformity and penetration of droplets, while ignoring whether it will produce greater drift. In our study, droplet drift is the result of the mechanical performance of droplets in a dynamically changing flow field. Aiming at reducing pesticide drift, the studies of field experiments, wind tunnel tests, and computer-based models are all necessary. Our ultimate goal is to be able to adjust operating strategies based on the drift model and realistic conditions to minimize pesticide drift.
5. Conclusions
In this paper, the droplet size of a hydraulic nozzle used to test the spray drift on plant protection in a UAV was measured at different pressures (2, 3, 4, and 5 bar). The Rhodamine-B and the PTFE line were used to measure the droplet drift driven by a wind tunnel with different wind speeds (2, 4, and 6 m/s) and rotors of a four-rotor UAV at different liquid pressures (2, 3, 4, and 5 bar). The drift generally descended resulting from an increase in the downwind distance from the UAV test platform. Faster wind speed and higher pressure can lead to more drift. What is more, the deposition ratios were all higher than the flow ratios at three wind speeds after the pressure adjustment. For the 2-m drift tower, the airborne drift mainly deposited below 1.5 m was similar to the ground drift law, and the largest drift was collected from a height of 2.5 m sampling lines for the drift above the rotors. The drift collected from the 20-m drift tower was very small. For most samples within eight meters of the drift area, the drift with the rotor motor off was more than an order of magnitude higher than that with the rotor motor on at the pressure of 3 bar. The drift collected at the farthest location of 30 m with the rotor off was the same order of magnitude as the maximum deposition collected in the drift area with the rotor motor on. Further work is needed to analyze the effects of other factors, such as pesticide adjuvant, nozzle type, rotor speed, etc., on the downwind drift, so as to establish a model containing as many factors as possible that account for different weights. In addition, much variability in real-field conditions should be quantified as a probability function, and included in the models to improve its accuracy.


