1. Introduction
Reliable and continuous monitoring of the vital functions of newborn infants is of the utmost importance in a hospital. In Neonatal Intensive Care Units (NICU), the infants need special attention. The standard vital sign monitoring consists of measuring the heart rate (HR), peripheral oxygen saturation (SpO2), breathing rate (BR), blood pressure and temperature.
HR and BR can be measured with ECG electrodes. However, in a NICU the use of them is typically avoided unless there is some particular heart problem, because the many wires can impede kangaroo care and cause stress to the infant [
1], the single-use disposable adhesive electrodes are costly, and they might even cause skin damage to preterm infants. A pulse oximeter, wrapped around an infant’s ankle or wrist, is used to measure pulse rate (PR) and SpO
2, but it does not measure BR. Though pulse oximeters do not use adhesive contact, they can also cause permanent skin damage to very premature infants. Current methods of repeated, non-invasive blood pressure measurement and continuous skin temperature monitoring require direct contact with the body as well. Therefore, there is an established need for the development of non-contact vital sign monitoring devices in hospitals as well as for homecare use. This is a burgeoning field.
Newborn infants are often active–including spontaneous kicking with legs, stretching the arms, and twisting the body. Cot mattresses with an embedded pressure sensor array can provide breath signal. However, they are highly sensitive to different motions and the position changes of the infant, and are also prone to false apnea alarms. Radar systems have been developed for PR and BR estimation [
2,
3]. These devices use the Doppler-effect to measure the movements of the skin to pick up respiratory and pulse frequency components. However, motion-sensitivity is yet again an unsolved problem, as motion can induce interference creating artifacts in the radar signal. Thermal imaging has been used to estimate BR from the temperature changes around the nose [
4], but it requires the measurement accuracy to be in the millikelvin range in a heated incubator environment making the realization of this technology expensive.
With the advance of algorithmic frameworks and the decreasing cost of CMOS RGB video cameras and embedded computing, the research field of videostream-based vital sign measurement is expanding ever faster.
Remote photoplethysmography (rPPG) measures the vascular volume changes in a non-contact way. The blood volume in the living tissue increases and decreases according to the beat phases of the heart. It causes tiny changes in light absorption and scattering, creating a periodic variation in color and brightness of the skin that is not perceptible to the naked eye, but regular cameras are able to record it, enabling the estimation of pulse rate.
Most often the estimation of breathing rate is based solely on observing the inspiratory and expiratory movement of the chest.
In the paper, we propose algorithms for a motion tolerant, continuous non-contact, single camera infant vital sign monitoring system using an ensemble of machine learning architectures. The system can be a good complementary solution for infant monitoring in hospitals and in homecare in those situations where contact solutions are not practical (i.e., for continuous, long-term monitoring).
In summary, our work makes a three-fold contribution:
We designed a new method for non-contact pulse-rate monitoring of newborn infants, with comparable or better performance compared to methods that are currently considered state of the art, and proposed a new temporal augmentation technique–called frequency augmentation–for better generalization of the neural network in the whole pulse range.
We designed a new method for non-contact respiration monitoring of newborn infants, with a performance comparable or better to the methods that are currently considered state-of-the-art, such as [
5].
To enable true continuous monitoring, we developed a classification block to identify scenarios that need to be handled differently. Static object detection and dynamic event analysis provide information on an infant’s presence, activity, and care or intervention events, moreover image quality and possible errors.
In the second section, we lay down the basics and current state of research and development in remote vital sign measurement of adults and infants by introducing related works. Then, we describe our methodology for classification, pulse and respiration extraction, the proposed algorithms, and the system. Afterward, we present our gathered database and the achieved results on it. In the discussion, we compare performances of the proposed algorithms on our data set with the implementations of other, previously proposed remote vital sign monitoring algorithms. Finally, we conclude our results.
The parents of all involved infants gave written approval for the usage of the video and other medical data for this scientific research.
2. Related Works
Various algorithms exist to remotely measure vital signs. Earlier methods used classical techniques for pulse and breath rates extraction: blind source separation [
6,
7], color space analysis [
8] or ballistocardiographic methods [
9] for pulse signal extraction, and
Optical Flow [
10,
11] or
Euler Motion Magnification [
12] for respiration signal extraction, and Fourier analysis for rate value estimation [
13,
14]). However, these extractors are very sensitive to motion artifacts, due to the lack of image interpretation.
Most recent studies employ either mixed [
15,
16,
17] or purely neural network solutions [
18,
19,
20,
21] for these tasks to increase motion-robustness and overall performance.
Deep-learning-based heart-rate measurement methods were reviewed by [
22]. It also compares their performance on the UBFC-RPPG dataset. The first end-to-end convolutional neural network (CNN) was proposed by Chen et al. named DeepPhys [
21] which uses an attention mechanism: it consists of two connected streams, the attention stream–whose input is a single frame and is responsible for region of interest (RoI) selection–and the motion stream–whose input is the normalized frame difference and is responsible for physiological signal extraction. Just recently, Zhan et al. analyzed this network [
23] and concluded that it learns the wavelength-dependent characteristics of blood absorption color variation to extract physiological signals–as classical algorithms do–, and that the choice and parameters (e.g., phase, spectral content) of the reference-signal may be more crucial than anticipated–i.e., the network learns and performs better if the label is well selected, prepared and aligned.
Spetlík et al. developed two separate convolutional networks [
20], one for extracting pulse signal from video and the other for estimating pulse rate from the previously extracted signal–with the application of a signal-to-noise ratio (SNR)-based loss function.
A 3D-network named PhysNet was introduced by Yu et al. [
19] which exploits not only spatial but spatio-temporal features. This network is completely end-to-end—there are no pre-processing steps—its input is a sequence of images and the output is the corresponding pulse signal.
However, most of the published results were developed for or trained on adults. Neonates have a weaker pulse and the variation of periodicity in their pulse and—especially—in their breathing rate is much higher. Parents and clinical staff often interact with the infants at the NICU. This includes the routine and non-routine medical interventions, manual vital sign checks, changing diapers or blankets, feeding and caressing, which makes the continuous camera-based vital sign monitoring of neonates challenging.
Up to recent years, only classical algorithms have been used for video-based infant monitoring-these are summarized here briefly. Camera-based non-contact estimation of pulse rate in the neonatal care unit was first reported in 2012 [
24]. In this work, seven infants were monitored for only 30 s with a web camera 20 cm away from the face and with special illumination. In another study [
25], video camera recordings were conducted of 19 infants. The camera was placed on a tripod at approximately 1 m from the infant and the face region was recorded for up to 5 min. RoI was manually selected and pulse rate was estimated from Fast Fourier Transform (FFT) analysis of the green channel. In 13 of 19 neonates it was possible to derive PR estimates for 90% of the time. These studies were conducted on brief video recordings with ideal conditions (e.g., controlled illumination, resting patient). However, it is essential to analyze the feasibility of the method in a long-term and uncontrolled scenario, in a real hospital or home environment under normal lighting conditions–and most importantly, without affecting patient care. With this in mind, Villarroel et al. [
26] directed their study, which contains the analysis of around 25 h’ long “valid camera data”. The video recording is labeled as “valid camera data” outside the following occurrences: (1) regular interaction between the clinical staff and the baby; (2) clinical interventions; (3) baby taken out of the incubator to be held by the mother (“kangaroo care”). In addition to PR and BR, the relative changes in SpO2 were also measured. The authors concluded that it is possible to monitor PR, BR and SpO2 continuously in the neonatal care unit, with an accuracy which is clinically useful. However, they also reported that even during stable periods (“valid camera data”) some phenomena prevented the accurate estimation of the vital signs, namely: (i) major changes in lightning conditions (turning on/off the lights, blocking sunlight from the window next to incubator); (ii) variations in the baby’s activity pattern (heavy subject motion); (iii) lack of visible skin area (the neonate is covered by a sheet). These factors reduced the time for which they could accurately estimate vital sign values from 24.9 to 20.1 h. For the remaining part, they could estimate PR, to be more specific: the root-mean-square error (RMSE) between their estimate and the ECG-derived value was less than 5 beats-per-minute (BPM). The average RMSE on this selected part was 3.95 BPM.
The previous methods were not motion-robust and worked only in the daytime (when visible light is present), therefore M. van Gastel et al. developed a system [
27] that functions in near darkness (using custom near infra-red (NIR) illumination and monochrome cameras with filters) and uses modern motions-robust core rPPG algorithm, namely the PBV [
28]. The focus of this study was to compare systems with 2 or 3 wavelengths and to compare different body parts (face and upper torso) for signal extraction (with manually selected and tracked RoI). To this end, the authors created a dataset with 7 different subjects and a total duration of 134 min. They demonstrated the feasibility of non-contact cardiac monitoring of neonates in NIR and that the upper torso also contains valuable pulse information. Furthermore, the authors reported that accurate results were not only obtained for scenarios without motion but also for common milder movements of neonates–such as wriggling, turning and respiration induced motion. However, in the proposed system RoI selection is manual and long-term RoI tracking is not stable (and is itself a challenge, i.e., not suitable for continuous monitoring).
Considering all these results and facts, the application of deep neural networks (DNN) on neonate monitoring is promising, as it can solve all common tasks/issues (e.g., RoI selection, tracking, motion compensation) internally, in an end-to-end fashion and might perform better in motion scenarios (because it can handle non-linear relationships [
21]). Furthermore, in classical approaches, facial regions of the infants were generally selected as RoI, although skin-pulsatility is only slightly lower in the upper torso region [
27]–which is therefore not used. In contrast, deep CNNs are capable of learning sophisticated weighted RoI (attention) maps and “track” them precisely, frame-by-frame, with great stability. Such an approach was proposed in [
29,
30], where it was used for skin segmentation and patient detection. In our algorithms, we introduced a scene-understanding step which, on the one hand finds ROI for respiratory signal extraction focusing especially on the torso and, on the other hand, it distinguishes between various scenarios such as empty incubator, extensive motion, clinical intervention, and unacceptable image quality, etc. as in [
31] which is an independent parallel work. In that study, the authors proposed non-contact algorithms for estimating heart rate and respiration rate from preterm infants in an unconstrained and challenging hospital environment. The process involved the extraction of cardiac- and respiratory-signals from the video camera data via deep learning algorithms and the development of robust techniques for the estimation of vital signs. The proposed multi-task deep learning algorithms performed three tasks that provided essential information for the automatic extraction of vital signs in a hospital environment: (1) the detection of the patient in the video frame, (2) the automated segmentation of skin areas, (3) and the detection of time periods during which clinical interventions were performed by the attending hospital staff.
An automated pipeline of respiration estimation in NICU was introduced by [
5]. They compared the traditional optical flow-based respiration signal extraction to the solution based on DeepFlow which is an algorithm for motion matrix estimation proposed by [
32]. This is an optical flow extended by a descriptor matching algorithm that builds upon a multi-stage architecture with interleaving convolutions and max pooling-a construction akin to deep convolutional networks. In the referred comparison, the DeepFlow-based solution outperformed the traditional OpticalFlow-based solution evaluated on their dataset which contains records from the infant’s whole body with the camera facing from the head down to the feet.
3. Methodology
We employ multiple different classical methods and neural networks for real-time classification, to log activities, find regions of interest and to estimate pulse rate and breathing rate, and extract various additional pieces of information, such as in motion activity monitoring and different nursing activities. First, we separated the different detection tasks and developed a solution for them. At the top level, the scenario is recognized by applying statistical methods and a neural network. In this way, we can interpret the scene and provide high-level warnings and control for the lower-level vital sign extractions. In parallel, the respiration and heart signal extraction and rate calculation are performed by two separate networks. Finally, a long duration statistical evaluation is done, collecting information from the different algorithmic components.
In the following subsections the main algorithmic components are described. These are the (i) the Top-Level Classification block, (ii) the Pulse Calculator Block and (iii) the Respiration Calculator Block.
3.1. Top-Level Classification Block
This block provides continuous monitoring of the incubator and identifies the current care status and infant activity. The input of the block is the videostream, while the output is (i) a decision on whether to run the Respiration Calculator Block and Pulse Calculator Block, (ii) bounding box (RoI) of the infant if present, and finally (iii) the videostream is passed to both calculator blocks. Statistics can also be logged based on the 14 features the block extracts.
Two basic analysis types are combined in this block:
Static object detection and
Dynamic feature extraction (
Figure 1). The static object recognition is performed every 3 s, while the dynamic event analysis is evaluated over an overlapping moving window of 6 s, also every 3 s. The choice of the time window length is the result of a grid search hyperparameter optimization.
At the static object detection task, the following image contents are identified by YOLO-v3 object detector [
33]: the body of the infant (head and torso), the presence of parents (gloveless hands), the presence of medical staff (blue gloves), the presence of nursing bottles (feeding the baby). We have selected YOLO-V3 for object detection, because it is one of the fast state-of-the-art networks which has the required accuracy and can be trained with relatively few samples. The YOLO-v3 returns relative coordinates of the object candidates and confidence values as well; however, the latter are only used in the decision-making process and passed to the LSTM.
The extracted dynamic properties are low level features of the video, such as camera noise, average brightness, and periodic motions.
The outputs of the two analysis types are fused with a recurrent network. The combined result leads to the classification of the status, which is used to enable the respiration and pulse-rate networks by excluding the time periods when their results cannot be calculate with high confidence due to extensive motion, caring, or lack of infant. Naturally, the status information can also be logged with the rates and activity pattern of the infant. This provides a meaningful statistics for the supervising doctor of the department.
3.1.1. Feature Extraction and Object Detection
The Top-Level Classification Block has the following output categories:
Baby is present and respiration-like signal is detected.
Baby is present showing intensive motion, interpreted as random and frequent self-motion.
Caring or other intervention happens.
No motion or minimal motion can be found in the incubator, but the baby is detected.
The baby is not detected in the scene, empty incubator.
Multiple subcategories collecting unacceptable camera image quality and possible errors: low light conditions, blurry view, camera image is saturated, consecutive frames do not differ from each other.
The classification uses a set of features extracted from the resized input stream. The input RGB frame size is , the frames are resized by linear interpolation and converted to grayscale format and collected into a stack of size, where , are the width and height, and is the number of frames, which corresponds to 6 s at 20 frame-per-seconds. We originally tested about 30 features, and found 14 with the largest information content (). The selected features belong to four groups:
Intra-frame statistics. Mean value of the image brightness and mean value of the standard deviation of each frame in the stack:
where
is the
ith grayscale frame of
size,
is the HSV brightness of the
ith RGB frame,
N is the number of frames in the stack, the vinculum denotes the mean value of all the pixels (i.e., spatial average) and
is the (spatial) standard deviation operator.
Inter-frame statistics. Difference is calculated for each frame pair and their absolute value is averaged:
In addition, dense optical flow is calculated for each consecutive frame using the Horn–Schunck method [
10]. We tested multiple methods and selected this one, because it accurately finds larger displacements (like moving limbs), and can still follow smaller movements (like chest or back). The magnitude of the optical flow is averaged for each frame pair in the frame stack, providing the next feature value
.
Statistics of individual pixel history. In this group simple statistics are calculated for each pixel separately as 1D vectors along the time dimension. The first such feature is the maximum of the sample (temporal) standard deviation (
) of the pixel vectors:
where
are the coordinates of the pixels in a frame.
The next two features (
) are the minimum and maximum value of the one-sample
Kolmogorov–Smirnov test [
34] of the pixel series. This test quantifies how the individual pixel value probability distribution differs from the Gaussian null-distribution through the time window of the stack.
To express the different rate periodic motions in the scene, two
frequency domain ratios are calculated as well. For each pixel vector
i, an
N length DFT is calculated resulting in
the power spectrum.
characterizes the mean value of the low frequency energy component (Equation (
5)) from 5 to 40 Hz discounting the near DC components.
is the mean value of the signal-to-noise ratio of the breath frequency band of 40–120 BPM over the high frequency noise in the 120–200 BPM span (Equation (6)). The choice of the frequency bands originates in the physiologically relevant range (40–120 BPM) and out-of-band frequencies. According to the measurements, the upper motion energy band is flat and mostly composed of the data acquisition and instrumental noise, while the lower band is related to the movements of the infants.
Static object analysis. A YOLO-v3 network is applied to the individual frames. The detection task determines the sought object types and their location. Our solution is primarily used for detecting the infants. Besides, other typical objects are recognized such as hands, arms and caring artifacts. The presence of such classes in the frame are concatenated to the aforementioned features, resulting in a 13-dimensional vector. Note that the output of this detector (more precisely the bounding box for the baby) is reused in the pulse network.
3.1.2. Classification Network
The normalized feature vectors are processed by a recurrent network which has sequential input and classification type output. The network (
Figure 2), contains two layers of fully connected (FC) cells with ReLU activation function, a stateful LSTM cell [
35] and a skip connection of a FC+ReLU concatenated before the last fully connected cells, terminating with a SoftMax function. To smooth the output and filter out spikes that have no physiological importance, temporal average pooling is used before the final classification output is generated.
3.2. Pulse Calculator Block
The Pulse Calculator Block first extracts a wave-like pulse signal from the videostream, then estimates the pulse rate using two neural networks. The block receives (i) the decision from the Classification Block on whether to run, (ii) the bounding box (RoI) of the infant and (iii) the videostream as inputs. Its output is the pulse rate.
The pulse network is responsible for the pulse signal waveform extraction from the video. We have adapted two state-of-the-art neural networks: the DeepPhys [
21] and the PhysNet [
19]. Although DeepPhys learned more quickly than PhysNet, we chose PhysNet because it could be further trained with pulse-rate reference and our database has more of this kind of data. For PhysNet a stack of images serve as the input and its output is a signal segment (e.g., 128 samples long) which enables us to train it with a signal correlation-based loss function (negative Pearson correlation loss (NegPea) [
19]) or even with pulse-rate values using Negative Signal-to-Noise Ratio loss (NegSNR) [
20], while the output of DeepPhys is only one sample point. Therefore, it can be trained with basic point distance objectives only, such as Mean Absolute Error (MAE) or Mean Squared Error (MSE).
The input of PhysNet is 128 stacked frames of resolution 128 × 128. For better performance the infant’s torso and head is cropped from the original 500 × 500 image using the result of the YOLO-v3 detector and then downscaled to 128 × 128 using area average interpolation. The 128 × 128 × 128 configuration was selected by taking account of the experiments of [
19] where several kinds of configuration were examined and 128 long configuration gave the best results.
Rather than simply estimating the pulse rate from the signal with the maximum frequency component, we achieved better results with the application of our rate estimator network, called RateEstNet. The input of the rate estimator network is the output of the signal extractor network. It is a one-dimensional fully convolutional network with an architecture resembling the network of Špetlík et al. [
20].
Network Architecture
The PhysNet variant with the best performance from the work of Yu et al. [
19] was chosen, namely: PhysNet128-3DCNN-ED, where 128 denotes the time depth of the network input (128 frames); 3D denotes that it is a 3-dimensional fully convolutional neural network; and ED denotes that an encoder-decoder part is applied (in time domain). This network architecture is illustrated in
Figure 3.
After each convolutional layer, batchnorm and ELU are applied. The spatio-temporal kernels (Depth, Height, Width) have a size of . The number of the input channels is 3 (128 stacked RGB frames) which is increased to 32 and then to 64. The channel number remains 64 until the last convolution which outputs 1 channel–it functions as a channel averager. In the encoder part the time dimension is squeezed to a quarter and is stretched back to its original size in the decoder part. The output is a vector containing the 1-dimensional pulse signal. The total number of trainable parameters is 866,689.
The
RateEstNet network is also a fully convolutional network, but in this case one-dimensional. It consists of 8 convolutional layers with a kernel size of 17. Dropout is applied before each convolution, and a batchnorm and ELU activation function follow it. The channel number of the input is 1 (as it is a 1-dimensional pulse signal). With the first convolution it is increased to 32, then doubled in every consecutive layer until the channel number reaches 256. Then it is decreased in the same way to 32. After the 3rd and 8th convolutional layer a max pool layer is inserted with a kernel size of 5 and a stride of 2. Before the final average pool–that outputs the estimated pulse rate–the output channels of the last (8th) convolutional layer are weight-averaged using another convolution with a kernel size, stride and output channel of 1. The total number of trainable parameters is 1,482,467. The graphical illustration of the network is shown in
Figure 4.
3.3. Respiration Calculator Block
The Respiration Calculator Block first finds the torso of the infant, then extracts a wave-like breathing signal from the videostream of the torso, and calculates the breathing rate (BR). The inputs of the block is (i) the decision from the Classification Block on whether to run, and (ii) the videostream. Its output is the breathing rate. The block can be divided into 4 parts:
ROI Detector is a UNET [
36], which is applied to segment the torso, because this part of the image carries the most information related to respiration. Moreover, in this way, we can eliminate the disturbing motion components of the limbs. The result is the torso mask (a probability mask), in which the torso pixels are close to 1, while the other pixels are close to zero (
Figure 5). This map is one of the inputs to the Respiration Extractor. We have selected UNET for torso segmentation, because it is a relatively simple and fast state-of-the-art network which has the required accuracy and can be trained with relatively few samples for these kinds of simple tasks.
The
Respiration Extractor generates the respiration signal waveform from the video. As a first step, it calculates a motion map from each consecutive image pairs using Farneback’s dense optical flow algorithm [
37]. We found this optical flow calculation method particularly efficient here because it was able to precisely follow the tiny movements of the back and the chest. The motion map was then multiplied with the torso mask. The respiration signal value is calculated from the weighted motion map for each frame. We also tried other methods for motion matrix calculation such as DeepFlow which was proposed by [
5] and described by [
32]. In
Section 6 we provide a comparison between our and [
5]’s results considering breathing rates. During our work, we also designed and tested a CNN structure for this task with an architecture inspired by PhysNet. However, its performance did not exceed the performance of dense optical flow on our data set. Moreover, its computational burden was significantly larger, therefore we decided not to use it.
Respiration Signal Masking uses the decisions of the Top-Level Classification Block to enable or disable the breathing rate calculation from the respiration signal waveform. In this way, the BR calculation is enabled, when the calculation is considered to be reliable, which means: the infant is visible, respiration-like motion is detected, no caring, neither nursing, nor intensive motion is going on (ECG-based BR measurement is also unreliable in these cases due to intensive body motion. Moreover, ECG measures false values in these cases without detecting that the measurement is disturbed, therefore it corrupts the BR statistics in the reports.). Please note that the BR is a critical indicator of apnea i.e., the cessation of breath. Apnea happens only in the quiet periods, when there are no body or limb movements of the infant. In these periods, the respiration monitoring subsystem is activated and performs the measurement accurately because there are no other disturbing movements in the scene. Therefore, it can be used to generate alarm signal in the case of apnea.
The
Rate Calculator is the end node of the respiration algorithm which provides the numerical BR in respiration per minute (RPM). The output of Respiration Extractor is filtered with a band-pass filter (20–120RPM) and masked in time as described in the previous paragraph. Then, it is packed into 200 long vectors. For rate (breath frequency) calculation, FFT appears a good solution. However, the respiration of infants can change suddenly both in amplitude and frequency, which misleads the FFT. Therefore, it is a common approach to use rate calculation methods based on peak detection [
5,
31]. We have implemented a rate calculation method which is based on peak detection, and similar to the ones used in [
31,
38]. This algorithm (called
CalcRate) starts with the inversion of the signal and an adaptive thresholding step, where the threshold level is the local mean value of the input signal. In this way, we obtain a binary signal, where the value 1 represents the respirations (the positive peaks), and the starting of the respirations are indicated with the rising edges. In the last step, those respirations, which are closer than 0.3 s are merged, and the rate is calculated by averaging the time intervals between the peaks and converting the result into a frequency value. The process is shown in
Figure 6.
As we mentioned earlier, the calculated BR values can be used to generate alarm signal in apnea situations. In these cases, we can use a 10-s and a 120-s long version of calculation window simultaneously, in real time. The former is used to recognize apnea situations and respond quickly if it is necessary.
4. Dataset
Due to the lack of a public annotated database of video-based incubator monitoring, for the training of our neural networks and for validation and evaluation purposes, we built our own database. Data were collected in the NICU of the I
st Dept. of Pediatrics and, II. Dept. of Obstetrics and Gynecology, Semmelweis University, Budapest, Hungary. The population demographics of the participants can be seen in
Table 1.
Videos of infants were recorded using a single Basler acA2040-55uc RGB camera with a resolution of 500 × 500 pixels at 20 frames per second. Reference data for respiration and pulse, including the waveforms and the calculated rates, were provided by the vital sign monitoring systems of the hospital, from the Philips IntelliVue MP20/MP50 models with standard interface card and custom software interface. No dedicated light source was used. The storage of the videos and reference data is done in raw format both to avoid compression artifacts and to make the offline test environment identical to the online one.
The video recording was done from several different camera-angles (at least 4 distinct) and with different optics (aperture and zoom) to increase generality and avoid overfitting. This enables transferring an algorithm trained with our database to another incubator or to apply it in homecare.
A software tool was developed for the annotation and structuring of the recordings. This annotation tool loads the acquired data into our database in an automated manner, based on the time of recording, video length and settings. After that, the footages is annotated manually. These tags describe the scenario, the availability of the reference data, the image quality and the existence of the proper illumination. There are tags for intensive baby movements, care, blurred image, phototherapy device is on, saturated image, empty incubator, low luminance level, dislocated camera, missing reference etc.
The database contains 96 h of annotated data. For the pulse estimation neural network, we handpicked a 4-h-long training set, a 1-h-long validation set and a 15-h-long test set, which all contain a balanced portfolio of the different scenarios. Participants split among the sets in a disjunct manner with at least 2 participants in each to maintain generalization and independence.
Our algorithms were developed for neonatal vital sign monitoring. Therefore, they had to be prepared for recognizing specific life-threatening situations such as apnea or extreme vital sign figures. On the one hand, fortunately, these kinds of situations occur rarely. Therefore, the lack of such events in our database motivated us to synthetize video events with low/high respiration and pulse rates and even missing vital signs. This can be considered to be a kind of frequency augmentation. For pulse-rate training, validation and test purposes, we re-sampled the video in time in each dataset. For respiration evaluation purposes, we skipped or inserted frames between two breaths. The inserted frames were the multiplication of the last real frame from the video. However, to avoid the bit-level changeless periods, we have added real camera noise and real NICU lighting changes. The pixel-wise AC components were acquired from image sequences of stationary, empty incubators. The resulting AC components were superposed on different images in the following way:
where
x,
y represents pixel location in the generated (
G) frame and empty incubator frame (
E), respectively. The DC component (
)–which is the mean intensity of the given pixel–was subtracted from a sequence of images and superposed on static scenarios (
S), where
i represents the current frame in the sequence. The static scenario is a single image with an infant present in the incubator. In this way, we were able to model subtleties such as varying shadows and pixel-level camera noise hardly visible to the human eye, although strongly affecting a computer vision system, especially a neural network in the training period.
5. Results
The accuracy and the execution times of the three algorithmic blocks are evaluated in this section.
The second and the third blocks are responsible for the pulse and breathing rate calculation. Due to the lack of a public database of newborns, evaluation and comparison had to be done on our database. Therefore, we picked two recently published state-of-the-art algorithms [
5,
19] and implemented them. In this way, we could do a fair comparison, because the evaluation of the methods was done exactly on the same data.
5.1. Top-Level Classification Block
A 12-h-long video set of the clinical trial was selected for system-wide top-level classifier evaluation. The protocol for the selection was to cover all available classes with as many possible transitions between them as the recordings allowed, all different camera-angles, and different infants. In total, this set contained approx. 5.5 h quiet and visible baby, 1.5 h of extensive motion, 3 h of care periods, 1.5 h empty incubator and half an hour various degraded image quality sequences (such as dark or saturated view, UV lamp treatment). During model validation and optimization, 5-fold cross-validation is used. Under these conditions, the Top-Level Classifier architecture provided
sensitivity (true positive rate),
specificity (true negative rate) and
F1 score (harmonic mean of precision and sensitivity) in the formerly listed main event classes (
Figure 7).
Dynamic and static analysis provide complementary information about the scene, e.g., respiration-like waveform is detected, and the infant is visible. As a result, we found that the combination of analysis (see
Figure 8) greatly enhanced the precision of the system, resulting in accurate detection of the infants’ movements on one hand, and indicator items of care/cure in the incubator on the other hand.
The execution time of feature extraction is in the range of 150–190 ms, object detection by YOLOv3 detector is 740–850 ms, classification network inference is 5–10 ms, all executed once in every 3 s. These values are measured on a i5 processor-powered, conservative setup, using a single processor with no GPU acceleration enabled, with the implications that such a system could run on relatively low-end computers or even on embedded systems.
5.2. Pulse Calculator Block
For the training and testing of the network, the 2 different large datasets were used which are summarized in
Table 2. Only a short video segment was available with pulse signal waveform reference, which was used for pre-training the PhysNet [
19] network with NegPeaLoss (using heavy augmentations). Then, we further trained it on a 5-h-long dataset (#2) with pulse-rate reference using SNRLoss, defined as follows:
where
is the power spectrum of the output signal,
u is the reference binary template function containing 1 or 0 for each
f frequency. The summing is performed over the pulse range, from 80 BPM to 250 BPM. The precise definition for
u is the following:
where
is the reference pulse rate and
is the acceptance value chosen to be 6 BPM. Please note that the power spectrum calculation consists of differentiable steps, therefore it works well with the back-propagation algorithm, and so can be used for training the neural network.
The rate estimator network (RateEstNet) was trained together with the pre-trained PhysNet on training set #2 with Mean Absolute Error (MEA, also known as L1) loss function.
Because we had a limited amount of data compared to the number of parameters of the networks, we used regularization and generalization techniques such as dropout and augmentations. We introduced a novel augmentation method for periodic time series signals, namely the frequency augmentation. This is done by resampling in time (using linear interpolation) a shorter or longer input video back to 128 samples length and changing the reference accordingly. With frequency augmentation we can imitate pulse rates in the whole range from 80 BPM to 250 BPM. Consequently, we can create a training set with uniform pulse-rate distribution. Thus, the network will not be biased towards the mean pulse-rate value. General image augmentations were also applied such as horizontal and vertical flip or the manipulation of image brightness and saturation. These methods were used to avoid overfitting and achieve good generalization.
Evaluation was done on a 15-h-long (#1) test dataset. It is considered to be challenging because it contains unfiltered continuous monitoring with heavy motion and low illumination level parts. There is even a 1 h segment where the head of the baby is covered with sheet (
Figure 9).
The results of different methods can be seen in
Table 3, as evaluated on the test set #1 (
Table 2). Different metrics were computed to quantify the performance of the networks: (1) MEA–Mean Absolute Error between reference and pulse-rate estimate; (2) RMSE–Root Mean Squared Error between reference and pulse-rate estimate; (3) R–Pearson correlation coefficient of the reference and estimated pulse rate in time.
In the case of PhysNet-SNR (first row in
Table 3) the network output is a signal, and the pulse rate is estimated from it via frequency analysis. First the pulse signal was filtered using a 6th order band-pass Butterworth filter with 80 BPM and 250 BPM cutoff frequencies. Then, a Fourier transform is applied on a sliding window of length 512 samples with a stride of 1 s. A Hamming window is also used on the sliding window, before the Fourier transform to avoid spectral leakage. The maximum power spectrum component is chosen to be the estimated pulse rate.
The RateEstNet network is “fused” and trained together with PhysNet. The results of the standalone PhysNet and the results with the addition of RateEstNet are depicted in
Figure 10 and the Bland–Altman plot of RateEstNet can be seen in
Figure 11. From the latter, we can see that there is no significant systematic error (as the mean is close to zero) between the reference and RateEstNet method.
From
Table 3. it is clear that using the RateEstNet network (the second row in
Table 3) after PhysNet is beneficial in estimating pulse rate according to the metrics corresponding to the whole test dataset. On the other hand, –as one can observe in
Figure 10. –at specific parts in our test set, the performance of especially PhysNet is severely degraded: from around 6th to 8th h where the head of the neonate was covered with a sheet and from 12th to 13th h where illumination level was low (see snapshots in
Figure 9). Therefore, we also calculated the metrics when omitting these parts shown in the bottom two lines of
Table 3. In this way, the performance was very similar, suggesting that the fusion of PhysNet and RateEstNet could better handle the challenging segments while the performance was almost the same outside of them.
In the evaluation, we used the rate values provided by Philips IntelliVue as reference. There is a difference in the parameters of the filtering used by Philips and the parameters of the filter used in our algorithm. Moreover, there would be differences in other parameters, thresholds too. Therefore, we cannot obtain a perfect match between the pulse rates and the reference. There are smaller slips between the reference values and the calculated rates, consequently we obtain lower correlation values in the third column. If we used average filtering in the comparison, the correlation values increased over 0.8 and RMSE values were halved.
In addition, the effect of frequency augmentation was inspected. The model was better able to handle extreme cases (when pulse rate was lower or higher than average) and resulted in better overall performance when frequency augmentation was applied during training, see a comparison in
Figure 12.
The evaluation time of a 6.4 s video segment is approximately 10 s for the PhysNet network and 0.01 s for the rate estimator network (RateEstNet) on a CPU. We also tested the inference time of the networks on an NVIDIA Jetson Nano embedded system (which has a 28-core Maxwell GPU) to prove that the networks are capable of real-time estimation on a relatively low-price hardware. The running time of the ensemble of PhysNet and RateEstNet is approximately 2 s for a 6.4 s video input, which verifies the ability of the networks to function in real time.
5.3. Respiration Calculator Block
We could not use the same dataset for respiration that we used for pulse because the ECG recordings were used far less than the pulse oximeter, therefore we had less referenced data. As a result, we created another dataset from our database, where pulse and respiration references were both recorded. For the evaluation we used 2 h of raw data with respiration reference recorded about 3 independent babies.
The performance of the respiration network was evaluated on two levels. First, the respiration signal provided by the impedance of the ECG electrodes was compared to the respiration signal calculated by the Respiration Extractor. Though both signals reflect the movement of the chest during the respiration, their representation is different, therefore we cannot expect a perfect match. Moreover, they react to body/limb motion in different ways. The comparison of the curves is illustrated in
Figure 13. The statistical evaluation of the two signals can be expressed in MAE (0.5494) and RMSE (0.6768) that can be measured between the signals.
The second level of evaluation was on the rate level. The graphical comparison of our solution to the reference is shown in
Figure 14. As can be seen, the calculated rates follow the reference, and the differences are mostly where there are extreme rate changes or extreme values occurring. During these periods, there is typically some disturbance which misleads either the reference or the visual methods (or both).
The statistical evaluation of the calculated breath rates is shown in
Table 4. Here we show the statistics for the entire data set (upper rows) and for some quiet periods (lower rows). The evaluation of rates was performed using 120 s long moving average window on the rates for the fair comparison. This length was used in [
5] whom we compared our results with, see
Table 4. We also provide Bland–Altman (
Figure 15) plot of breathing rates calculated by the classical method which provided better results.
We statistically evaluated the contribution of the ROI Detector as well. As is shown in
Table 5, the torso detection reduced the MAE. However, UNET increases performance most significantly in situations when limb movement occurs, so it has a smaller effect on the overall MAE and RMSE.
An advantage of our algorithm is that we can use a 10-s and a 120-s long calculation window simultaneously in real time, the former to recognize apnea situations and respond quickly if it is necessary. The authors in [
5] used only a 120-s window, and though it smooths the peaks (hence reducing RMSE), it can respond only slowly to an apnea situation.
As we can see in
Table 4, the type of peak detection method also has a big effect on the result. This phenomenon is caused by the fact that the extracted respiration signal usually contains special artifacts which are identified as valid peaks by findpeaks, because they are in the valid frequency range and not filtered out by the horizontal threshold.
The evaluation time of a 10 s (200-frame-long) video segment is 1120 ms without the ROI Detector (as the latter is not executed for every frame). This can be divided into two parts: the running time of the Respiration Extractor (720 ms) and Rate Calculator Head (400 ms). As we use the CalcRate rather than the Rate Calculator Head, the total execution time is only 720 ms on a PC (CPU: Intel(R) Xeon(R) CPU @ 2.20GHz, CPU family-6).
6. Discussion
In the previous section, we showed the accuracy of our methods. In this section, we compare our algorithms with state-of-the-art methods from the literature. The Top-Level Classification block is compared with [
31] mostly at feature level. However, the pulse and breathing rate calculation blocks are compared at performance level. In these cases, we have implemented two state-of-the-art published methods [
5,
19] and fed them with our datasets. In this way, we could do a fair comparison, because the evaluation of the methods was done on exactly the same data sets.
The Top-Level Classification Block detects the presence of the infant and its activity with high confidence. However, higher misclassification rates can be found between classes i, ii, and iii (
Figure 7). This confusion is a consequence of the manual, and therefore slightly subjective annotating process, as it is not always possible to define explicitly the boundaries of categories (e.g., whether an infant is moving slightly or significantly). The confusion between care and other classes is identified as a result of the interpretation of the manual tagging policy (similarly to [
31]). The human annotators marked care periods as uninterrupted, couple of minutes long time-windows, which sometimes included shorter periods of empty incubator or situations when there were temporarily no adult hands in the incubator. These short periods are detected correctly by the algorithm, hence causing error in the evaluation. We did not include the apnea detection (class iv.) to this evaluation, because here we used only real data, and we do not have real measurement data for apnea situations in our data base at the time of the manuscript preparation. As a comparison to the latest similar role system, our classification methodology gives not only quality assessment as [
31], but provides distinction of several typical motion types, broader artifact detection capabilities and intervention types with similar or higher f-score [
39] and lower computational effort.
The state-of-the-art MAE score of pulse rate is around 6 BPM measured in adults [
19] (i.e., on the MAHANOB-HCI publicly available data set [
40]). We applied the PhysNet [
19] network on our data set comprised of premature-infant subjects with similar results (see
Table 3 bottom part)–indicating that similar performance can be achieved in the case of infants despite the fact that their pulse is weaker and faster. This can be (partly) attributed to the fact that not only their head but their torso also holds valuable pulse information which is used by the neural network. We fused and trained PhysNet together with our RateEstNet network (PhysNet + RateEstNet in
Table 3) which resulted in better overall performance compared to PhysNet. In ideal conditions their performance was very similar indicating that our method is more robust to environmental factors.
The performance of the Respiration Calculator Block was compared with [
5] in which the authors investigated specifically the respiration estimation of premature infants in NICU from videos. In that work, the authors applied the DeepFlow [
32] method for motion matrix calculation and used Principal Component Analysis (PCA) to find the strongest motion component.
We implemented the described algorithm using an open source OpenCV [
41] implementation of DeepFlow and scikit-learn for PCA. We calculated the rates for our data sets and compared them to our results. As shown in
Table 4, our algorithms performed better on both of our data sets. Compared to the statistical figures the authors reached on their data set [
5] the results on our data set here are poorer. The reason is that our data set is more challenging because the infants in our data set are older (33 vs. 29 weeks gestational age) and larger (2022 g vs. 1555 g), therefore they are more active, hence the videos contain more movement, which generates a noisier motion matrix even in the calm periods.
The presented algorithms were trained and evaluated on the participant set typical of the Hungarian population. So, the population of the participants contains only Caucasian and Roma infants. Therefore, it is not guaranteed that the presented algorithms would provide satisfying results in the case of infants with darker skin. It is harder to see the pulse on darker skin. So, the performance of the “pulse calculator block” is likely to be lower in this case. The applied dataset should be extended to adapt the presented algorithms to the case of darker skinned infants.
7. Conclusions
Algorithms for a single-camera-based premature-infant monitoring system was built and tested on videos recorded in a NICU. Beyond the standard pulse and breathing rate monitoring, the algorithms can measure the activity of the infants and can make logs of the nurse/parent activity as well. Our algorithms can operate and provide meaningful data continuously, using our Top-Level Classification Block, even when there is intensive infant movement happening or care is being performed in the incubator.
A deep-learning-based solution was introduced for pulse detection, which was trained directly on pulse-rate data with SNRLoss objective function, rather than pulse curves. For respiration monitoring, a new heterogeneous algorithm was proposed. The system can operate with a single-color camera in daylight and can function in darkness with a near-infrared illumination.
Frequency augmentation and video manipulation techniques were introduced to synthesize data for rare events such as very high/low pulse rate or apnea. Thus, we could train our networks to accurately handle such infrequent but very important situations and achieve better generalization.
We achieved results regarding pulse rate similar to the ones measured for adults [
19] implying that similar performance can be achieved in the case of infants even though their pulse is weaker and faster.
Our respiration RMSE values are larger than the ones published in [
5]. However, the authors of that paper used videos of younger, therefore less active infants and they used a dedicated camera for the respiration, placed in an optimal location for respiration monitoring, but unsuitable for pulse monitoring. When the two algorithms were compared on the same data sets our algorithm performed better.
The execution times of the algorithms show the feasibility of the real-time application of our system on a relatively low-price PC or an embedded system with a GPU.
Author Contributions
Conceptualization, Á.N., P.F., I.J., D.T., M.S. (Máté Siket), M.S. (Miklós Szabó), J.V. and Á.Z.; methodology, software, validation and formal analysis, Á.N., P.F., I.J., D.T., M.S.; investigation, Á.N., I.J., M.S.; resources, M.S. (Miklós Szabó), J.V.; data curation, P.F., I.J.; writing—original draft preparation, Á.N., P.F., I.J., D.T., M.S. (Máté Siket), Á.Z.; writing—review and editing, Á.N., I.J., Á.Z.; visualization, Á.N., P.F., D.T., I.J.; supervision and project administration, P.F., Á.Z. All authors have read and agreed to the published version of the manuscript.
Funding
This research was funded by the Hungarian grant NKFIH-1019658 and the Ministry of Innovation and Technology NRDI Office, Hungary within the framework of the Artificial Intelligence National Laboratory Program.
Institutional Review Board Statement
Ethical review and approval were waived for this study due to its non-invasive and non-contact manner, and because it did not influence patient comfort or care. Written informed consent was obtained from parents to use the anonimised visual records for study purposes. Informed consent documents are stored as part of patient documentation. The study was lead by the head of the Division of Neonatology, Semmelweis University.
Informed Consent Statement
Written informed consent was obtained from all subjects involved in the study.
Data Availability Statement
Restrictions apply to the availability of these data. Data was obtained from the participants given consent and are available from the authors only with the permission of the participants.
Conflicts of Interest
The authors declare no conflict of interest.
References
- Bonner, O.; Beardsall, K.; Crilly, N.; Lasenby, J. ‘There were more wires than him’: The potential for wireless patient monitoring in neonatal intensive care. BMJ Innov. 2017, 3, 12–18. [Google Scholar] [CrossRef] [Green Version]
- Marchionni, P.; Scalise, L.; Ercoli, I.; Tomasini, E. An optical measurement method for the simultaneous assessment of respiration and heart rates in preterm infants. Rev. Sci. Instrum. 2013, 84, 121705. [Google Scholar] [CrossRef]
- Rahman, T.; Adams, A.T.; Ravichandran, R.V.; Zhang, M.; Patel, S.N.; Kientz, J.A.; Choudhury, T. Dopplesleep: A contactless unobtrusive sleep sensing system using short-range doppler radar. In Proceedings of the 2015 ACM International Joint Conference on Pervasive and Ubiquitous Computing, Osaka, Japan, 9 September 2015; pp. 39–50. [Google Scholar]
- Pereira, C.B.; Heimann, K.; Venema, B.; Blazek, V.; Czaplik, M.; Leonhardt, S. Estimation of respiratory rate from thermal videos of preterm infants. In Proceedings of the 2017 39th Annual International Conference of the IEEE Engineering in Medicine and Biology Society (EMBC), Jeju, Korea, 11–15 July 2017; pp. 3818–3821. [Google Scholar]
- Sun, Y.; Wang, W.; Long, X.; Meftah, M.; Tan, T.; Shan, C.; Aarts, R.M. Respiration monitoring for premature neonates in NICU. Appl. Sci. 2019, 9, 5246. [Google Scholar] [CrossRef] [Green Version]
- Lewandowska, M.; Rumiński, J.; Kocejko, T.; Nowak, J. Measuring pulse rate with a webcam—A non-contact method for evaluating cardiac activity. In Proceedings of the 2011 federated conference on computer science and information systems (FedCSIS), Szczecin, Poland, 18–21 September 2011; pp. 405–410. [Google Scholar]
- Poh, M.Z.; McDuff, D.J.; Picard, R.W. Advancements in noncontact, multiparameter physiological measurements using a webcam. IEEE Trans. Biomed. Eng. 2010, 58, 7–11. [Google Scholar] [CrossRef] [Green Version]
- Wang, W.; Den Brinker, A.C.; Stuijk, S.; De Haan, G. Algorithmic principles of remote PPG. IEEE Trans. Biomed. Eng. 2016, 64, 1479–1491. [Google Scholar] [CrossRef] [Green Version]
- Lee, H.; Cho, A.; Lee, S.; Whang, M. Vision-Based Measurement of Heart Rate from Ballistocardiographic Head Movements Using Unsupervised Clustering. Sensors 2019, 19, 3263. [Google Scholar] [CrossRef] [Green Version]
- Horn, B.K.; Schunck, B.G. Determining optical flow. Artif. Intell. 1981, 17, 185–203. [Google Scholar] [CrossRef] [Green Version]
- Janssen, R.; Wang, W.; Moço, A.; De Haan, G. Video-based respiration monitoring with automatic region of interest detection. Physiol. Meas. 2015, 37, 100. [Google Scholar] [CrossRef] [Green Version]
- Alinovi, D.; Ferrari, G.; Pisani, F.; Raheli, R. Respiratory rate monitoring by video processing using local motion magnification. In Proceedings of the 2018 26th European Signal Processing Conference (EUSIPCO), Rome, Italy, 3–7 September 2018; pp. 1780–1784. [Google Scholar]
- De Chazal, P.; Fox, N.; O’HARE, E.; Heneghan, C.; Zaffaroni, A.; Boyle, P.; Smith, S.; O’CONNELL, C.; McNicholas, W.T. Sleep/wake measurement using a non-contact biomotion sensor. J. Sleep Res. 2011, 20, 356–366. [Google Scholar] [CrossRef] [PubMed]
- Wang, W.; Den Brinker, A.C.; De Haan, G. Full video pulse extraction. Biomed. Opt. Express 2018, 9, 3898–3914. [Google Scholar] [CrossRef] [PubMed] [Green Version]
- Niu, X.; Han, H.; Shan, S.; Chen, X. SynRhythm: Learning a Deep Heart Rate Estimator from General to Specific. In Proceedings of the 2018 24th International Conference on Pattern Recognition (ICPR), Beijing, China, 20–24 August 2018; pp. 3580–3585. [Google Scholar]
- Song, R.; Zhang, S.; Li, C.; Zhang, Y.; Cheng, J.; Chen, X. Heart Rate Estimation from Facial Videos Using a Spatiotemporal Representation with Convolutional Neural Networks. IEEE Trans. Instrum. Meas. 2020, 69, 7411–7421. [Google Scholar] [CrossRef]
- Hsu, G.S.; Ambikapathi, A.; Chen, M.S. Deep learning with time-frequency representation for pulse estimation from facial videos. In Proceedings of the 2017 IEEE International Joint Conference on Biometrics (IJCB), Denver, CO, USA, 1–4 October 2017; pp. 383–389. [Google Scholar]
- Gibson, K.; Al-Naji, A.; Fleet, J.; Steen, M.; Esterman, A.; Chahl, J.; Huynh, J.; Morris, S. Non-contact heart and respiratory rate monitoring of preterm infants based on a computer vision system: A method comparison study. Pediatr. Res. 2019, 86, 738–741. [Google Scholar] [CrossRef] [PubMed]
- Yu, Z.; Li, X.; Zhao, G. Remote Photoplethysmograph Signal Measurement from Facial Videos Using Spatio-Temporal Networks. arXiv 2019, arXiv:1905.02419. [Google Scholar]
- Špetlík, R.; Franc, V.; Matas, J. Visual heart rate estimation with convolutional neural network. In Proceedings of the British Machine Vision Conference, Newcastle, UK, 3–6 September 2018; pp. 3–6. [Google Scholar]
- Chen, W.; McDuff, D. Deepphys: Video-based physiological measurement using convolutional attention networks. In Proceedings of the European Conference on Computer Vision (ECCV), Munich, Germany, 10 September 2018; pp. 349–365. [Google Scholar]
- Ni, A.; Azarang, A.; Kehtarnavaz, N. A Review of Deep Learning-Based Contactless Heart Rate Measurement Methods. Sensors 2021, 21, 3719. [Google Scholar] [CrossRef]
- Zhan, Q.; Wang, W.; De Haan, G. Analysis of CNN-based remote-PPG to understand limitations and sensitivities. Biomed. Opt. Express 2020, 11, 1268–1283. [Google Scholar] [CrossRef] [PubMed]
- Scalise, L.; Bernacchia, N.; Ercoli, I.; Marchionni, P. Heart rate measurement in neonatal patients using a webcamera. In Proceedings of the 2012 IEEE International Symposium on Medical Measurements and Applications Proceedings, Budapest, Hungary, 18–19 May 2012; pp. 1–4. [Google Scholar]
- Aarts, L.A.; Jeanne, V.; Cleary, J.P.; Lieber, C.; Nelson, J.S.; Oetomo, S.B.; Verkruysse, W. Non-contact heart rate monitoring utilizing camera photoplethysmography in the neonatal intensive care unit—A pilot study. Early Hum. Dev. 2013, 89, 943–948. [Google Scholar] [CrossRef] [PubMed]
- Villarroel, M.; Guazzi, A.; Jorge, J.; Davis, S.; Watkinson, P.; Green, G.; Shenvi, A.; McCormick, K.; Tarassenko, L. Continuous non-contact vital sign monitoring in neonatal intensive care unit. Healthc. Technol. Lett. 2014, 1, 87–91. [Google Scholar] [CrossRef] [Green Version]
- Van Gastel, M.; Balmaekers, B.; Oetomo, S.B.; Verkruysse, W. Near-continuous non-contact cardiac pulse monitoring in a neonatal intensive care unit in near darkness. Optical Diagnostics and Sensing XVIII: Toward Point-of-Care Diagnostics. Int. Soc. Opt. Photonics 2018, 10501, 1050114. [Google Scholar]
- De Haan, G.; Van Leest, A. Improved motion robustness of remote-PPG by using the blood volume pulse signature. Physiol. Meas. 2014, 35, 1913. [Google Scholar] [CrossRef] [PubMed]
- Chaichulee, S.; Villarroel, M.; Jorge, J.; Arteta, C.; Green, G.; McCormick, K.; Zisserman, A.; Tarassenko, L. Multi-Task Convolutional Neural Network for Patient Detection and Skin Segmentation in Continuous Non-Contact Vital Sign Monitoring. In Proceedings of the 2017 12th IEEE International Conference on Automatic Face Gesture Recognition (FG 2017), Washington, DC, USA, 30 May–3 June 2017; pp. 266–272. [Google Scholar] [CrossRef]
- Chaichulee, S.; Villarroel, M.; Jorge, J.; Arteta, C.; McCormick, K.; Zisserman, A.; Tarassenko, L. Cardio-respiratory signal extraction from video camera data for continuous non-contact vital sign monitoring using deep learning. Physiol. Meas. 2019, 40, 115001. [Google Scholar] [CrossRef] [Green Version]
- Villarroel, M.; Chaichulee, S.; Jorge, J.; Davis, S.; Green, G.; Arteta, C.; Zisserman, A.; McCormick, K.; Watkinson, P.; Tarassenko, L. Non-contact physiological monitoring of preterm infants in the Neonatal Intensive Care Unit. NPJ Digit. Med. 2019, 2, 1–18. [Google Scholar] [CrossRef] [PubMed] [Green Version]
- Weinzaepfel, P.; Revaud, J.; Harchaoui, Z.; Schmid, C. DeepFlow: Large Displacement Optical Flow with Deep Matching. In Proceedings of the 2013 IEEE International Conference on Computer Vision, Sydney, NSW, Australia, 1–8 December 2013; pp. 1385–1392. [Google Scholar] [CrossRef] [Green Version]
- Redmon, J.; Farhadi, A. Yolov3: An incremental improvement. arXiv 2018, arXiv:1804.02767. [Google Scholar]
- Marsaglia, G.; Tsang, W.W.; Wang, J. Evaluating Kolmogorov’s distribution. J. Stat. Softw. 2003, 8, 1–4. [Google Scholar] [CrossRef]
- Hochreiter, S.; Schmidhuber, J. Long Short-term Memory. Neural Comput. 1997, 9, 1735–1780. [Google Scholar] [CrossRef] [PubMed]
- Ronneberger, O.; Fischer, P.; Brox, T. U-Net: Convolutional Networks for Biomedical Image Segmentation. arXiv 2015, arXiv:1505.04597. [Google Scholar]
- Farnebäck, G. Two-Frame Motion Estimation Based on Polynomial Expansion. In Image Analysis; Bigun, J., Gustavsson, T., Eds.; Springer: Berlin/Heidelberg, Germany, 2003; pp. 363–370. [Google Scholar]
- Lu, W.; Nystrom, M.; Parikh, P.; Fooshee, D.; Hubenschmidt, J.; Bradley, J.; Low, D. A semi-automatic method for peak and valley detection in free-breathing respiratory waveforms. Med. Phys. 2006, 33, 3634–3636. [Google Scholar] [CrossRef]
- Singh, H.; Kusuda, S.; McAdams, R.M.; Gupta, S.; Kalra, J.; Kaur, R.; Das, R.; Anand, S.; Kumar Pandey, A.; Cho, S.J.; et al. Machine Learning-Based Automatic Classification of Video Recorded Neonatal Manipulations and Associated Physiological Parameters: A Feasibility Study. Children 2021, 8, 1. [Google Scholar] [CrossRef] [PubMed]
- Soleymani, M.; Lichtenauer, J.; Pun, T.; Pantic, M. A multimodal database for affect recognition and implicit tagging. IEEE Trans. Affect. Comput. 2011, 3, 42–55. [Google Scholar] [CrossRef] [Green Version]
- OpenCV—Optical Flow Algorithms: CreateOptFlow_DeepFlow(). Available online: http://docs.opencv.org/4.5.3/d2/d84/group__optflow.html (accessed on 1 March 2021).
Figure 1.
Information flow between the different algorithmic components. From the Videostream input 14 features are extracted via Dynamic feature extraction and Static object detection. The concatenated feature vector is processed by the Classification network, which outputs categories and a decision whether to run Respiration Calculator Block and Pulse Calculator Block. The former runs based on this decision and receives the videostream. UNET segments images, while Respiration Extractor outputs the wave-like respiration signal and CalcRate calculates the breathing rate. The Pulse Calculator Block runs based on the decision, receives the videostream and the bound box of the infant, if detected. Pulse net uses its attention mechanism, outputs the wave-like pulse signal and RateEstNet calculates the pulse rate. Alarm signals (e.g., apnea) and additional statistics can be extracted from the classification and the numerical results.
Figure 2.
The figure on the left illustrates the collected frame stack size. The central one shows the extracted feature vectors resulting from dynamic and static object analysis. The concatenated vector contains the following 13 features: mean value of image brightness (Equation (
1)) and mean value of standard deviation of each frame in the stack (Equation (2)), the average of the absolute value of the difference for each frame pair (Equation (
3)), magnitude of dense optical flow averaged for each frame pair in the stack, the maximum of sample (temporal) standard deviation of pixel vectors (Equation (
4)), the minimum and maximum value of the one-sample Kolmogorov–Smirnov test of the pixel series, the mean value of the low frequency energy component (Equation (
5)), the mean value of the signal-to-noise ratio separated based on frequency range (Equation (6)), and 4 YOLO-v3 detected classes (infant, hand, arm, caring artifacts). The data flow is shown upper right, and the architecture of the classification network lower right.
![Applsci 11 07215 g002]()
Figure 3.
Illustration of the convolutional and average pool layers of the PhysNet architecture. The input is 128 stacked frames. Orange color denotes the convolutional, blue the deconvolutional (transposed convolutional) and red the average pool layers. At the bottom of each layer the time depth is shown and after the layer-blocks the spatial resolution. The output is the corresponding pulse signal.
Figure 4.
Illustration of the effect of RateEstNet on the input. The temporal resolution (D) marked at the top and the number of channels (C) in the middle.
Figure 4.
Illustration of the effect of RateEstNet on the input. The temporal resolution (D) marked at the top and the number of channels (C) in the middle.
Figure 5.
This figure represents how the UNET-based ROI detector finds the torso of the newborn baby. Middle images show the predicted masks. Right images represent the masked inputs.
Figure 5.
This figure represents how the UNET-based ROI detector finds the torso of the newborn baby. Middle images show the predicted masks. Right images represent the masked inputs.
Figure 6.
Operation method of the classical rate calculation (CalcRate). The BR is calculated by 1/(Mdi/20)·60 where Mdi is the mean of d distances between the rising edges of actual peaks.
Figure 6.
Operation method of the classical rate calculation (CalcRate). The BR is calculated by 1/(Mdi/20)·60 where Mdi is the mean of d distances between the rising edges of actual peaks.
Figure 7.
Confusion matrix of the main categories in a representative 12 h set.
Figure 7.
Confusion matrix of the main categories in a representative 12 h set.
Figure 8.
Static analysis: object detection examples, which are used in the top-level classifier to separate and identify excessive motion, caring, empty incubator, etc. categories during operation. The ROI of neonates is passed to the pulse network.
Figure 8.
Static analysis: object detection examples, which are used in the top-level classifier to separate and identify excessive motion, caring, empty incubator, etc. categories during operation. The ROI of neonates is passed to the pulse network.
Figure 9.
Frames from our challenging test dataset (#1 in
Table 2). Conditions depicted from left to right: Heavy motion-twisting the body, swinging arm, covered baby, normal and low light conditions.
Figure 9.
Frames from our challenging test dataset (#1 in
Table 2). Conditions depicted from left to right: Heavy motion-twisting the body, swinging arm, covered baby, normal and low light conditions.
Figure 10.
Illustration of model estimates and reference of pulse rates. At the bottom the whole 15-h-long test dataset is plotted. Above that two selected 2-h-long segments are enlarged. Finally, at the top a half-an-hour-long segment is shown. From the bottom plot we can see that the estimation is the worst from 6.5 to 8 h. The explanation for this is that in this part the head of the neonate is covered with sheet, therefore only a small skin area is visible.
Figure 11.
The Bland–Altman plot of results of Physnet+RateEstNet and reference values.
Figure 11.
The Bland–Altman plot of results of Physnet+RateEstNet and reference values.
Figure 12.
The estimated pulse rates from the output signal of PhysNet model–in the case of classical image augmentation and additional frequency augmentation–and the corresponding reference pulse-rate values on a selected time segment. The training of the model benefits significantly from frequency augmentation.
Figure 13.
Comparison of the calculated respiration signal to the reference. Due to body motion and the applied filters in both the reference calculation and the introduced method, the phase of the signals changes, but the number of the peaks are well kept, resulting in MAE: 0.5494, RMSE: 0.6768.
Figure 13.
Comparison of the calculated respiration signal to the reference. Due to body motion and the applied filters in both the reference calculation and the introduced method, the phase of the signals changes, but the number of the peaks are well kept, resulting in MAE: 0.5494, RMSE: 0.6768.
Figure 14.
Comparison of the reference breathing rate and the breathing rates calculated by the Respiration Calculator Block. Every point is related to a 10-s-long input window of frames.
Figure 14.
Comparison of the reference breathing rate and the breathing rates calculated by the Respiration Calculator Block. Every point is related to a 10-s-long input window of frames.
Figure 15.
The Bland–Altman plot calculated for the error of OpticalFlow + CalcRate.
Figure 15.
The Bland–Altman plot calculated for the error of OpticalFlow + CalcRate.
Table 1.
Population Demographics.
Table 1.
Population Demographics.
| Subject | 1 | 2 | 3 | 4 | 5 | 6 | 7 |
|---|
| Recording time (hours) | 96.7 | 5.5 | 39.4 | 27.4 | 51 | 105.5 | 50.1 |
| Gender | F | M | M | F | F | M | F |
| Gestational age (weeks) | 32 | 32 + 3 | 31 + 4 | 35 + 4 | 39 | 32 | 33 |
| Birth weight (g) | 2020 | 1840 | 1850 | 1870 | 3150 | 2120 | 2080 |
| Postnatal age (days) | 4 | 4 | 10 | 8 | 4 | 7 | 2 |
| Actual weight (g) | 1900 | 1850 | 1680 | 1820 | 2905 | 2040 | 1960 |
| Length (cm) | 46 | 44 | - | 45 | 57 | 45 | 44 |
| Head circumference (cm) | 32 | 29.5 | - | 32 | 34 | 30 | 32 |
| Respiratory support | no | no | no | no | no | no | no |
| Pharmacological cardiovascular support | no | no | no | no | no | no | no |
| Any drugs * | no | no | no | no | yes | no | no |
| Fitzpatrick scale | 2 | 3 | 2 | 2 | 2 | 2 | 2 |
Table 2.
The training (#2), validation (#3), and test (#1) datasets used for the pulse network.
Table 2.
The training (#2), validation (#3), and test (#1) datasets used for the pulse network.
| Number (#) | Length | Available References |
|---|
| 1 | 15 h | pulse rate, |
| 2 | 4 h | pulse rate, |
| 3 | 1 h | pulse rate, |
Table 3.
Calculated metrics for PhysNet (first row) and for the ensemble of PhysNet and RateEstNet (second row) regarding the whole test set.
Italic and blue colored typeface denote our method (Physnet + RateEstNet). At the bottom, the results are shown when omitting parts from the test set where the head of the infant was covered or the illumination level was low (i.e., from 6th to 8th h and from 12th to 13th h, see
Figure 10).
| Arch | MAE [BPM] | RMSE [BPM] | R |
|---|
| PhysNet-SNR | 8.61 | 14.37 | 0.48 |
| PhysNet + | | | |
| RateEstNet | 7.08 | 9.87 | 0.57 |
| Omitting parts: | | | |
| PhysNet-SNR | 6.03 | 9.84 | 0.626 |
| PhysNet + | | | |
| RateEstNet | 6.19 | 8.65 | 0.630 |
Table 4.
Statistical evaluation of the respiration-rates generated by classical (CalcRate) and the DeepFlow-based algorithms. The second and the third rows (DeepFLow) show the results provided by the implementation of the algorithm proposed by [
5]. The bottom four lines show the results for some quiet periods when there were moderate limb motions only. The evaluation was performed using moving average where we employed a sliding window of 120 s, the same time window as in the method we compare to [
5].
Italic and blue colored typeface denote our method (CalcRate). We applied two kinds of peak detector in the evaluation of the result of the DeepFlow-based algorithm. FindPeaks is a peak detector provided by SciPy, while diffRate is developed by us and based on the detection of points where the curve is crossing the zero line. As we can see, the type of peak detection method has a big effect on the result.
| Arch | MAE | RMSE |
|---|
| CalcRate | 5.080 RPM | 6.618 RPM |
| DeepFLow + findPeaks | 14.196 RPM | 17.122 RPM |
| DeepFLow + diffRate | 5.848 RPM | 7.553 RPM |
| On a typical calm period: | | |
| CalcRate | 2.231 RPM | 2.672 RPM |
| DeepFLow + findPeaks | 10.008 RPM | 12.334 RPM |
| DeepFLow + diffRate | 3.474 RPM | 4.676 RPM |
Table 5.
Statistical evaluation of the ROI detector.
Table 5.
Statistical evaluation of the ROI detector.
| ROI Detector | Signal Extraction | Rate-Calc-Method | MAE |
|---|
| UNET | OpticalFlow | calcRate | 4.817 RPM |
| None | OpticalFlow | calcRate | 5.153 RPM |
| Publisher’s Note: MDPI stays neutral with regard to jurisdictional claims in published maps and institutional affiliations. |
© 2021 by the authors. Licensee MDPI, Basel, Switzerland. This article is an open access article distributed under the terms and conditions of the Creative Commons Attribution (CC BY) license (https://creativecommons.org/licenses/by/4.0/).


 ,
, 


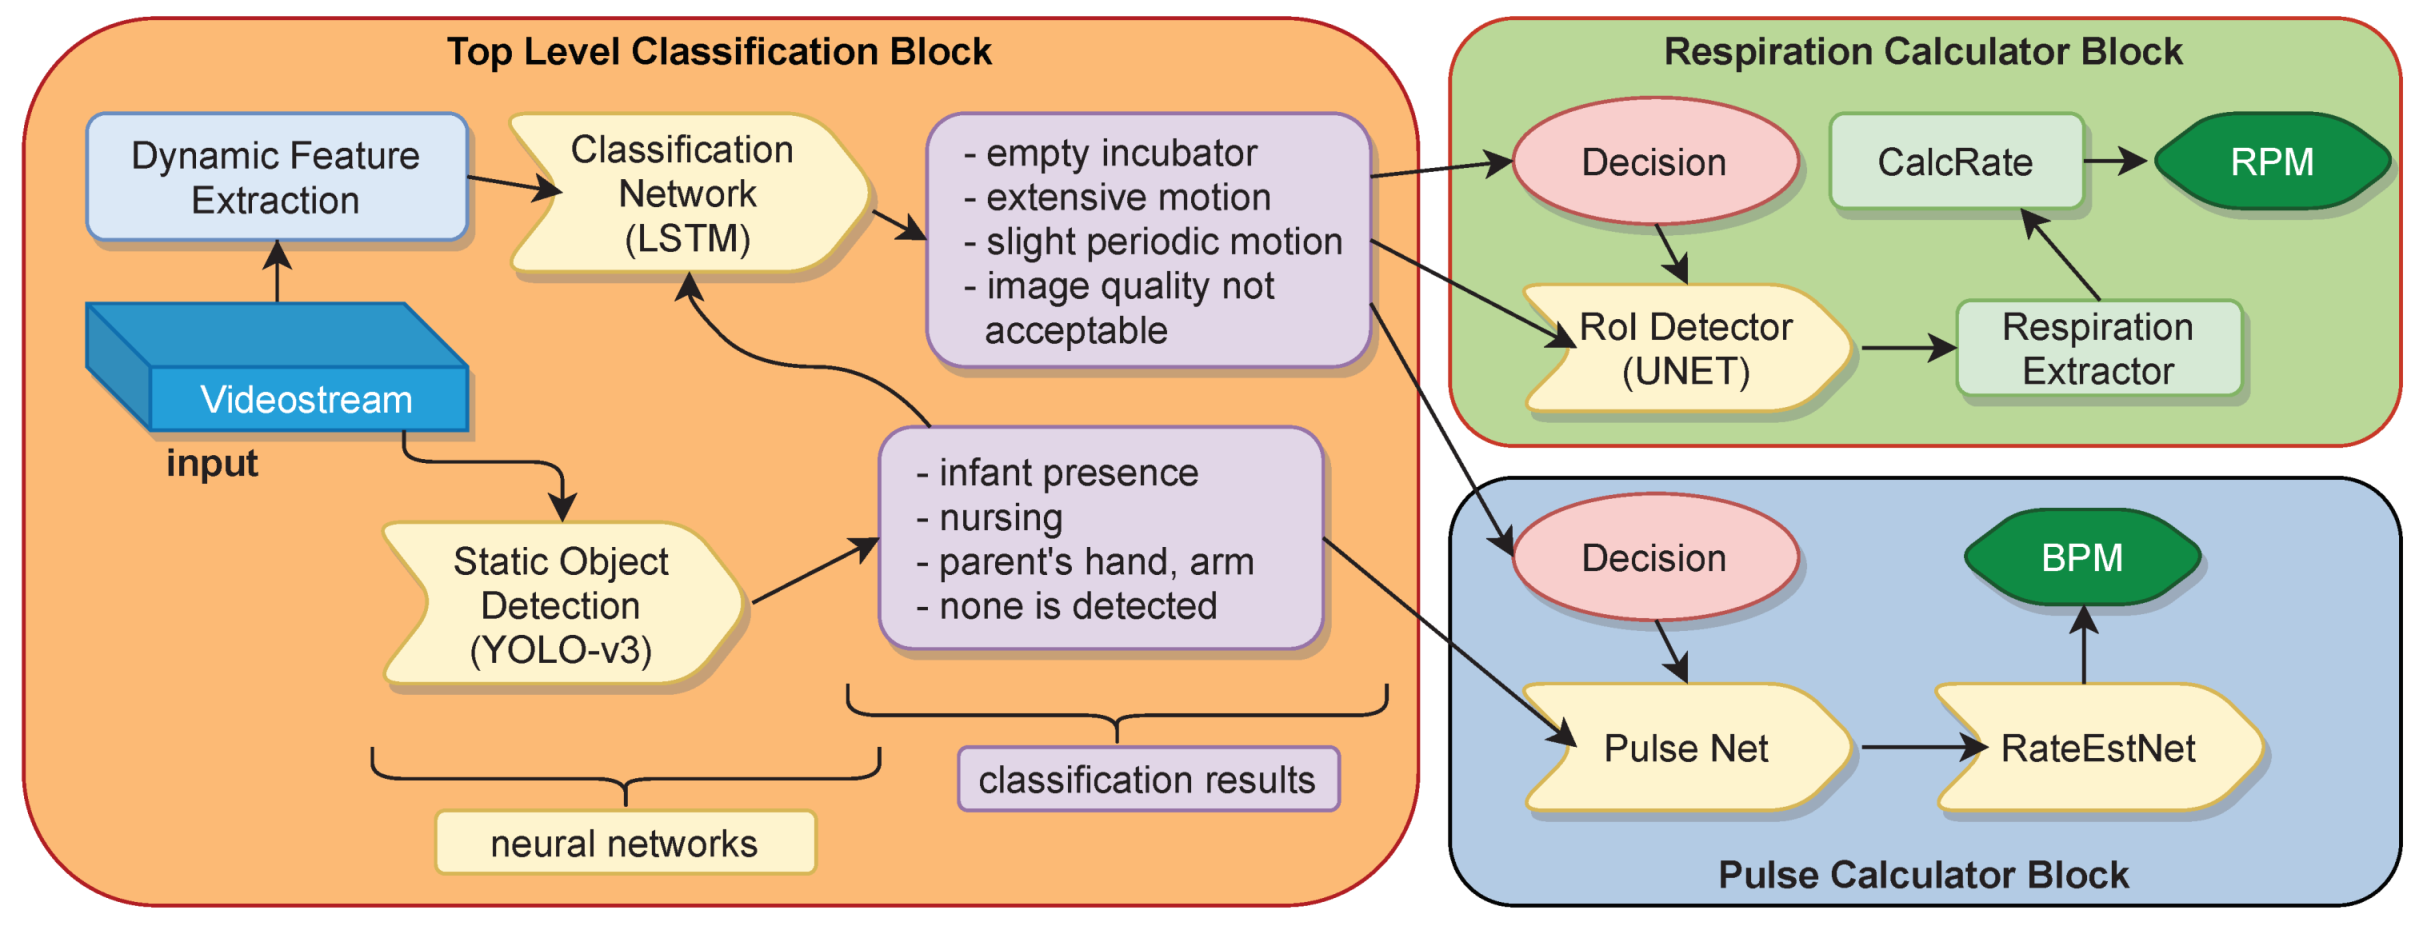
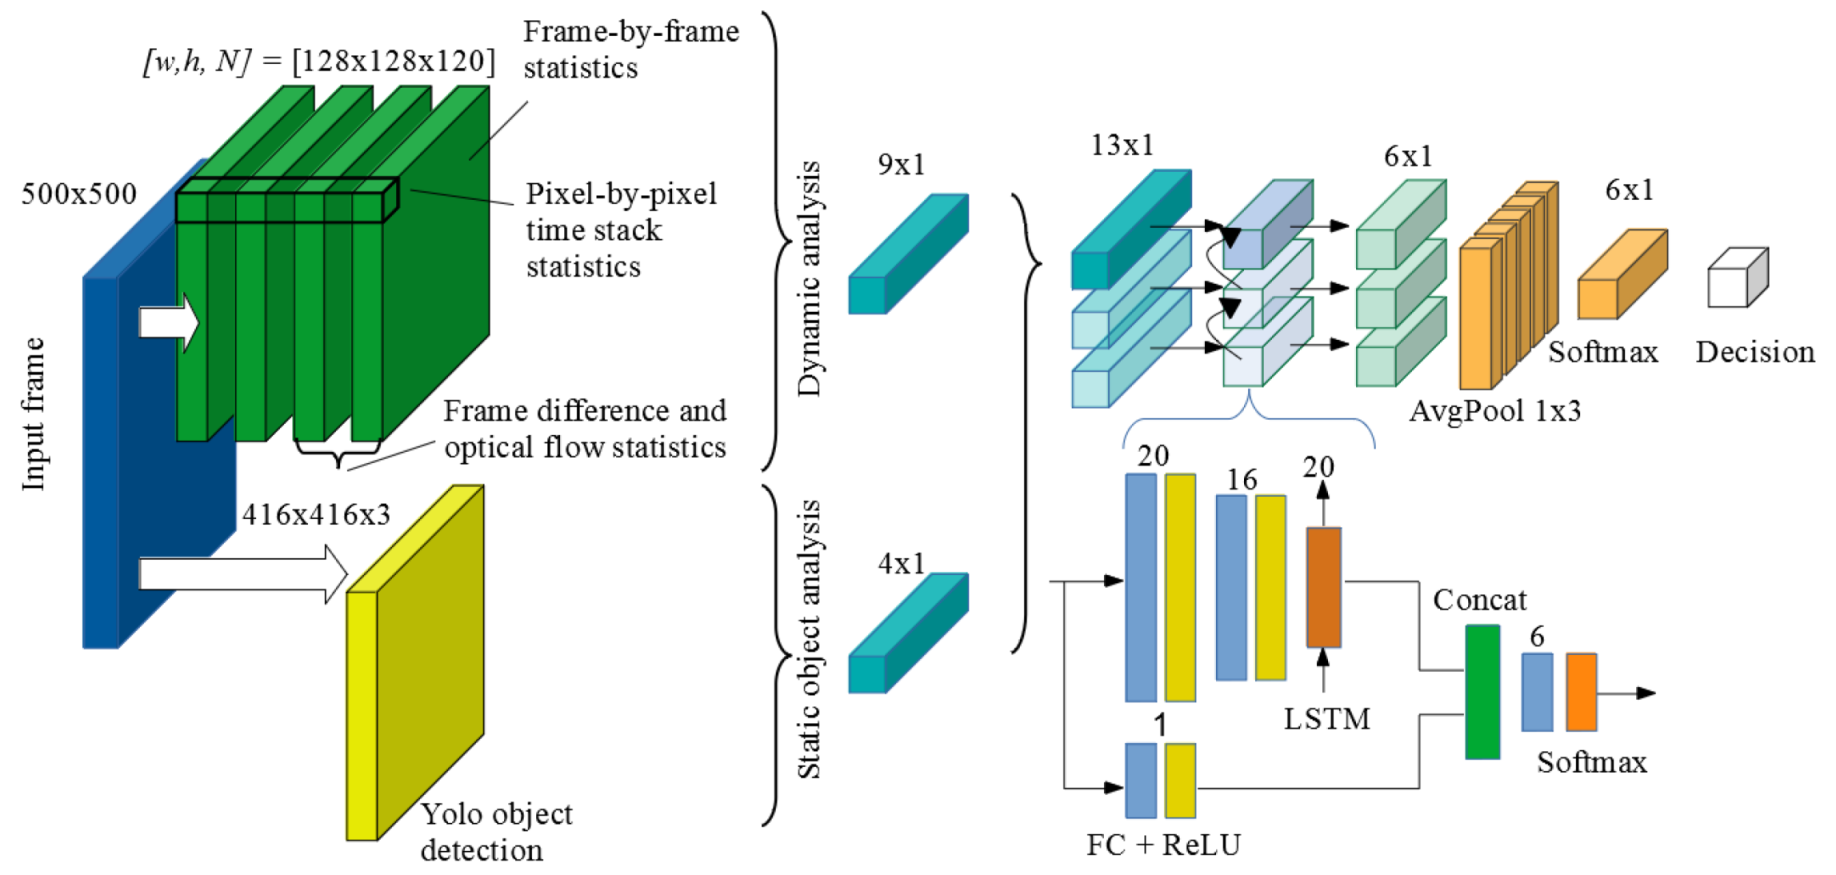
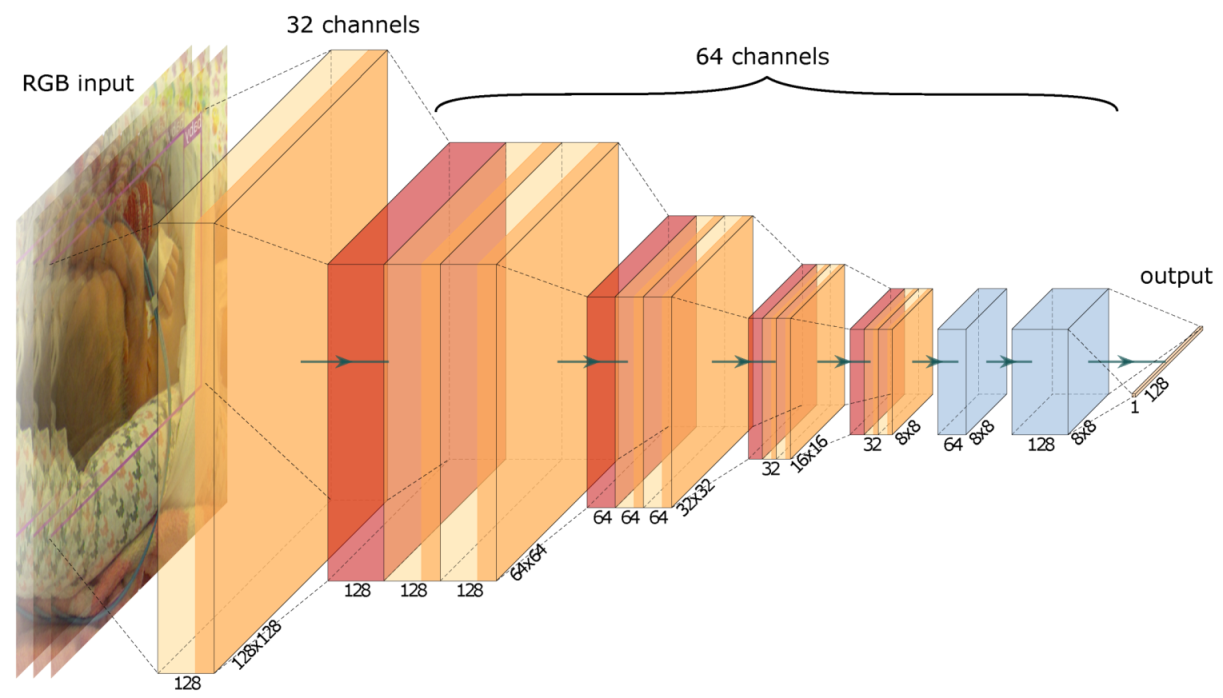
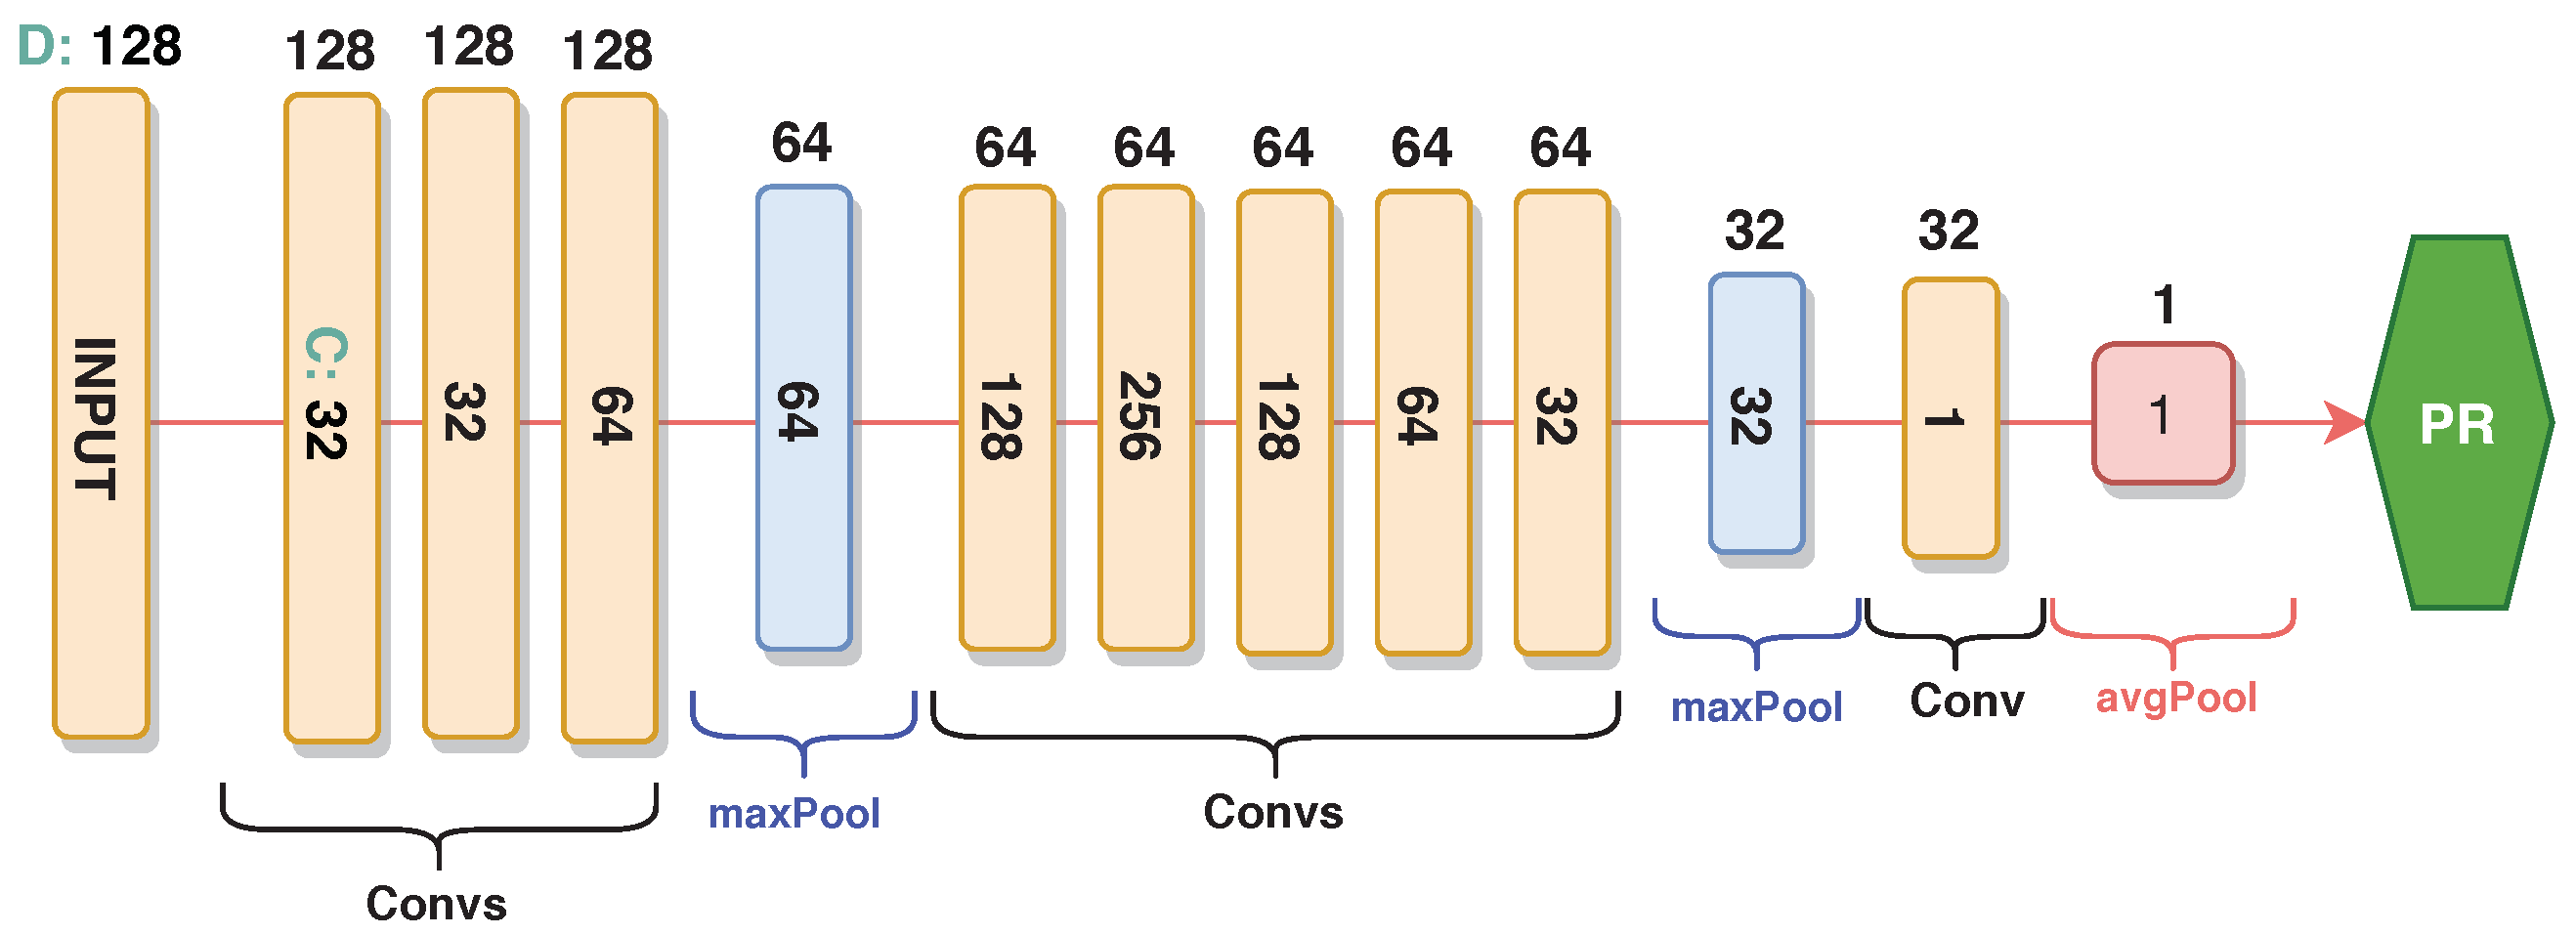
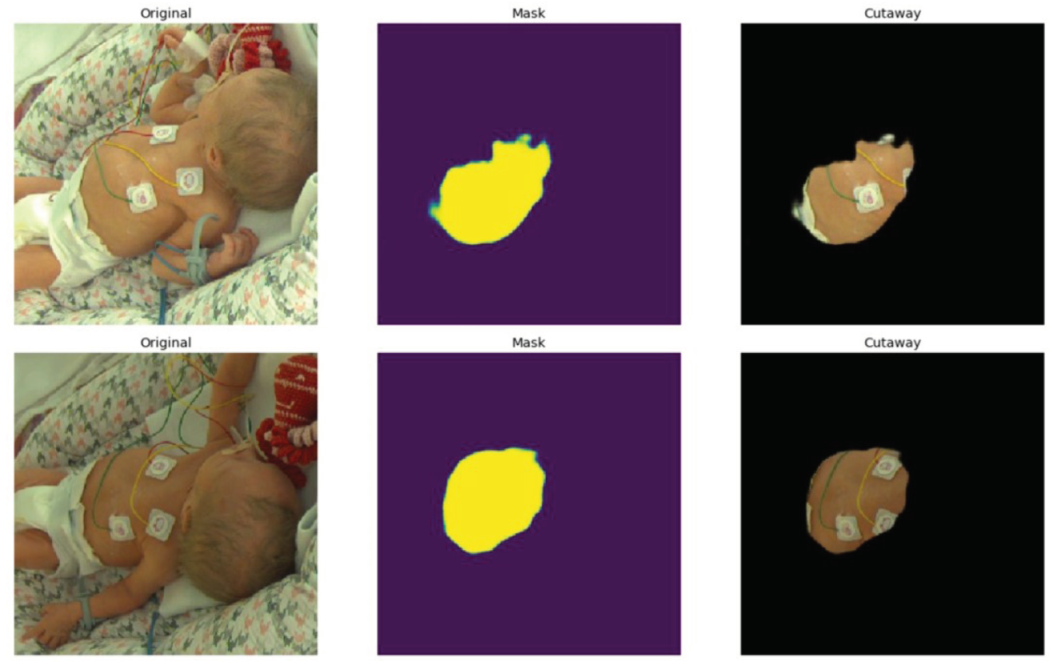
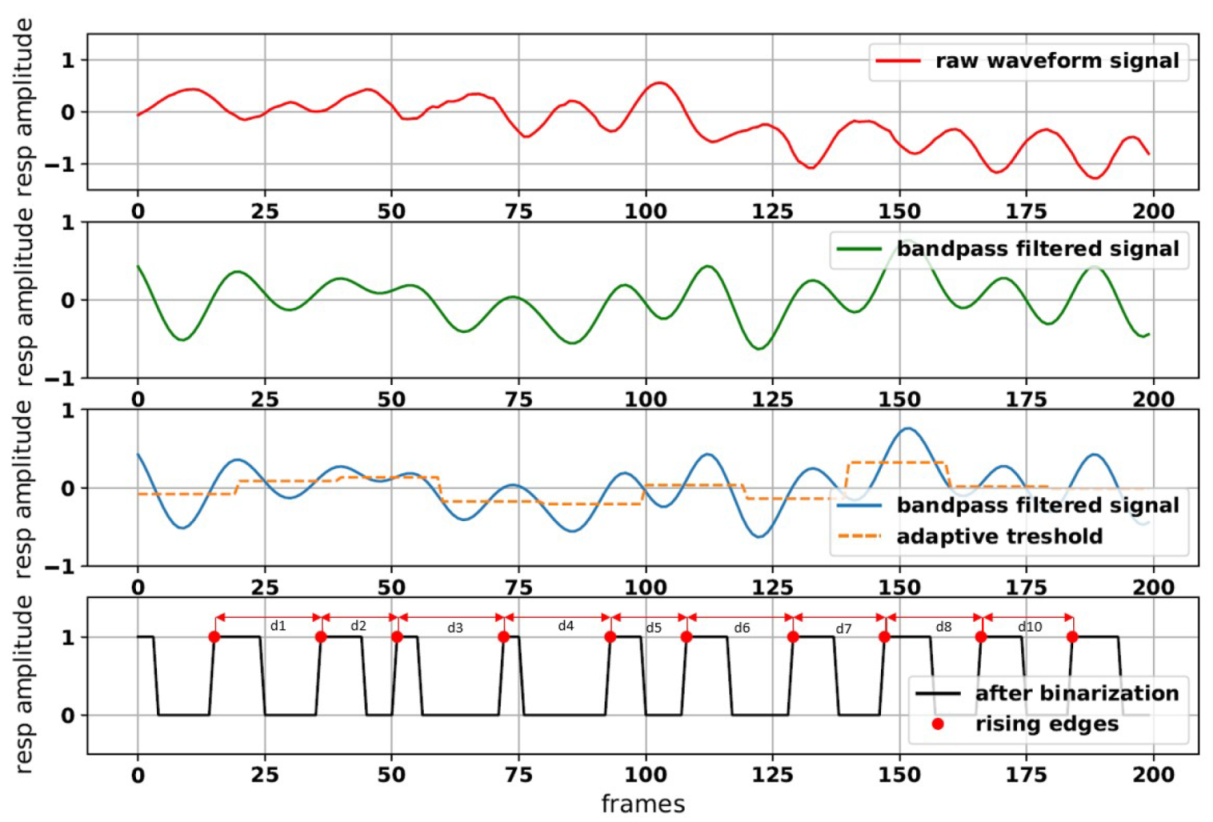
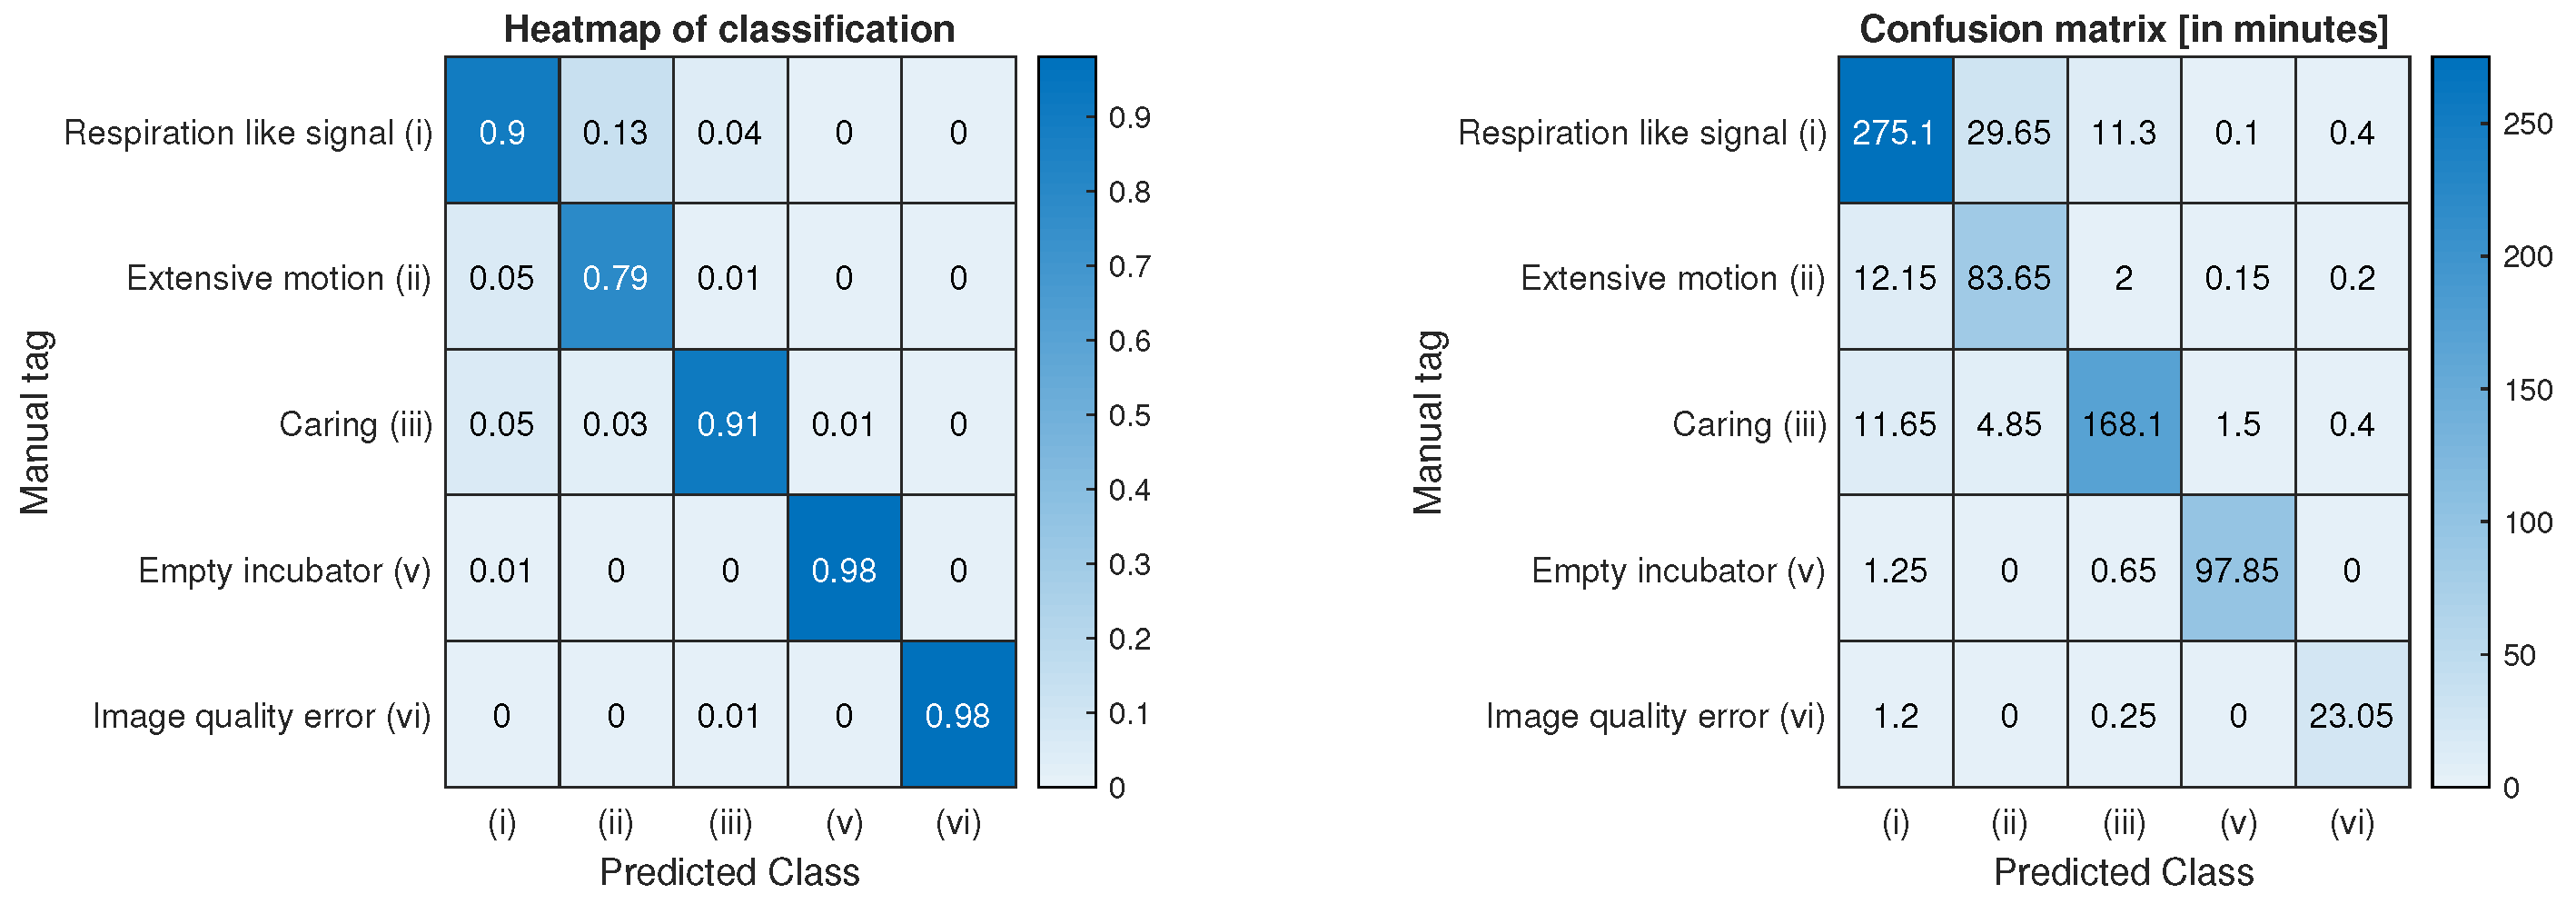
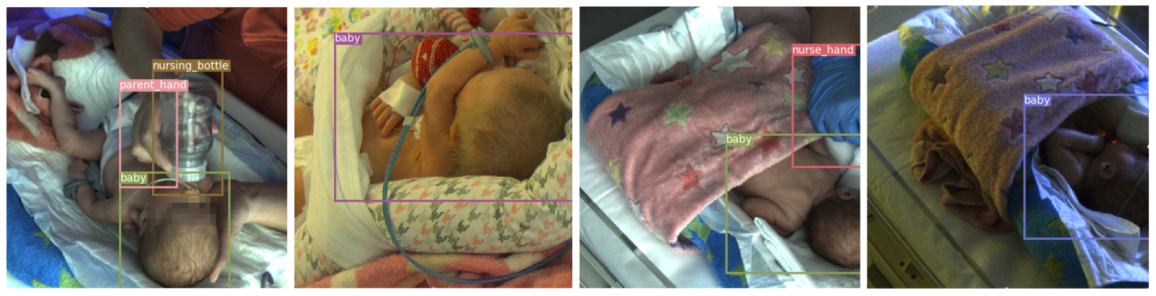
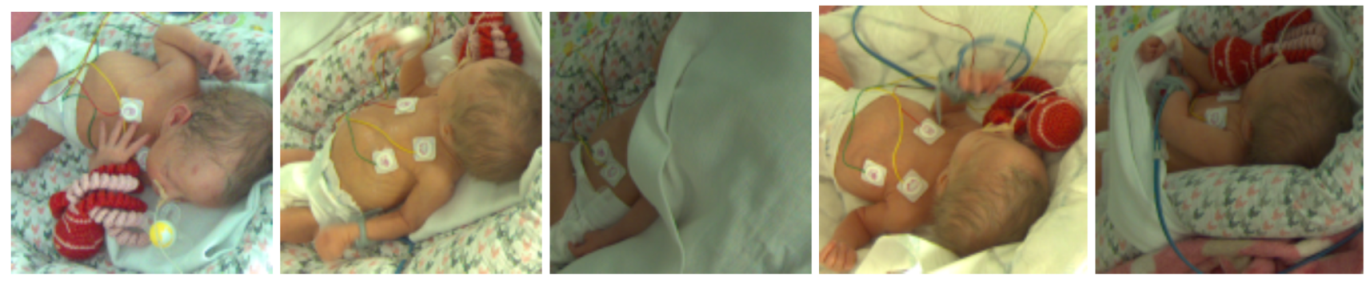
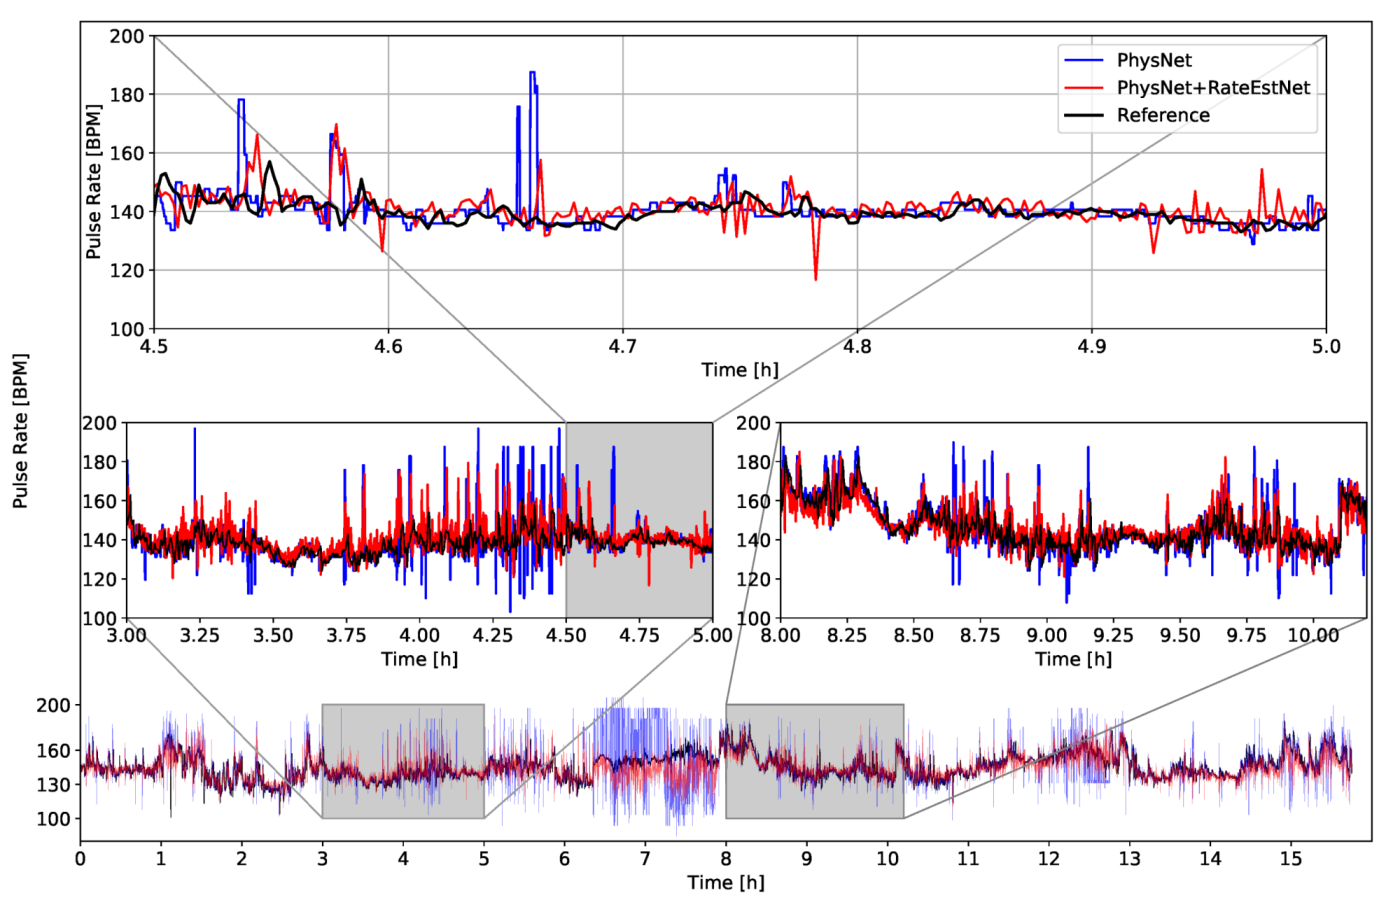
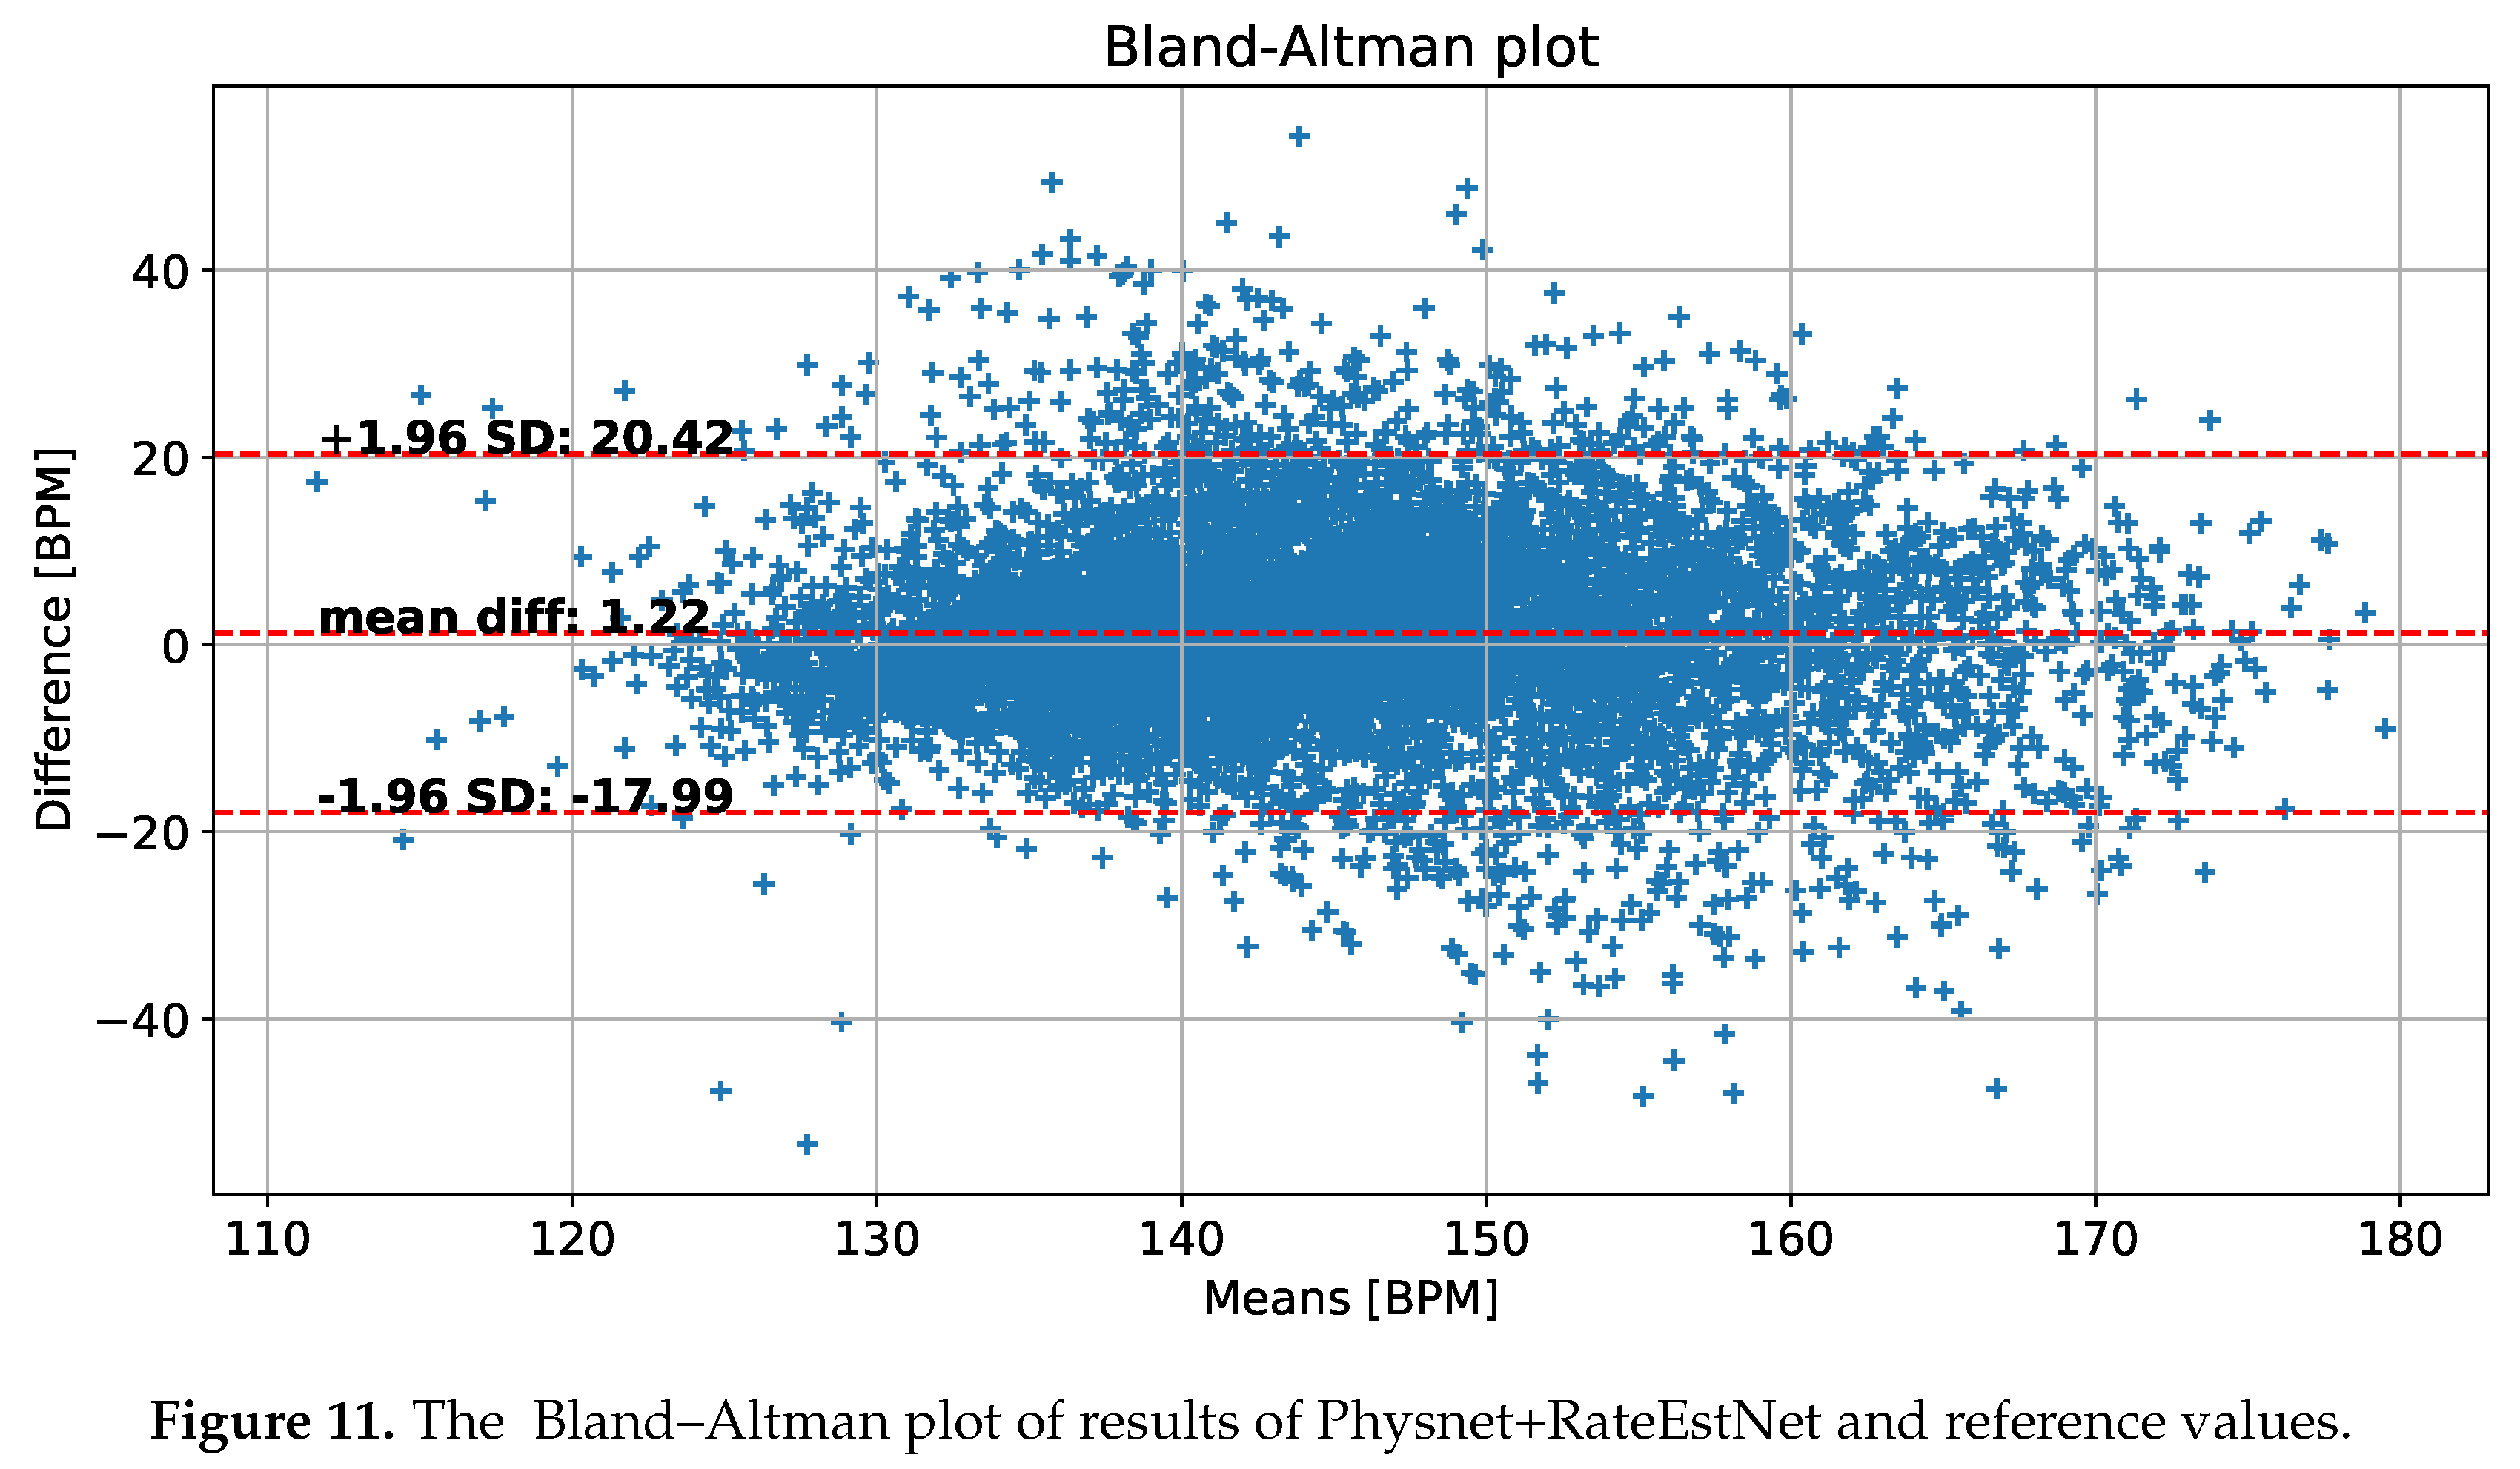
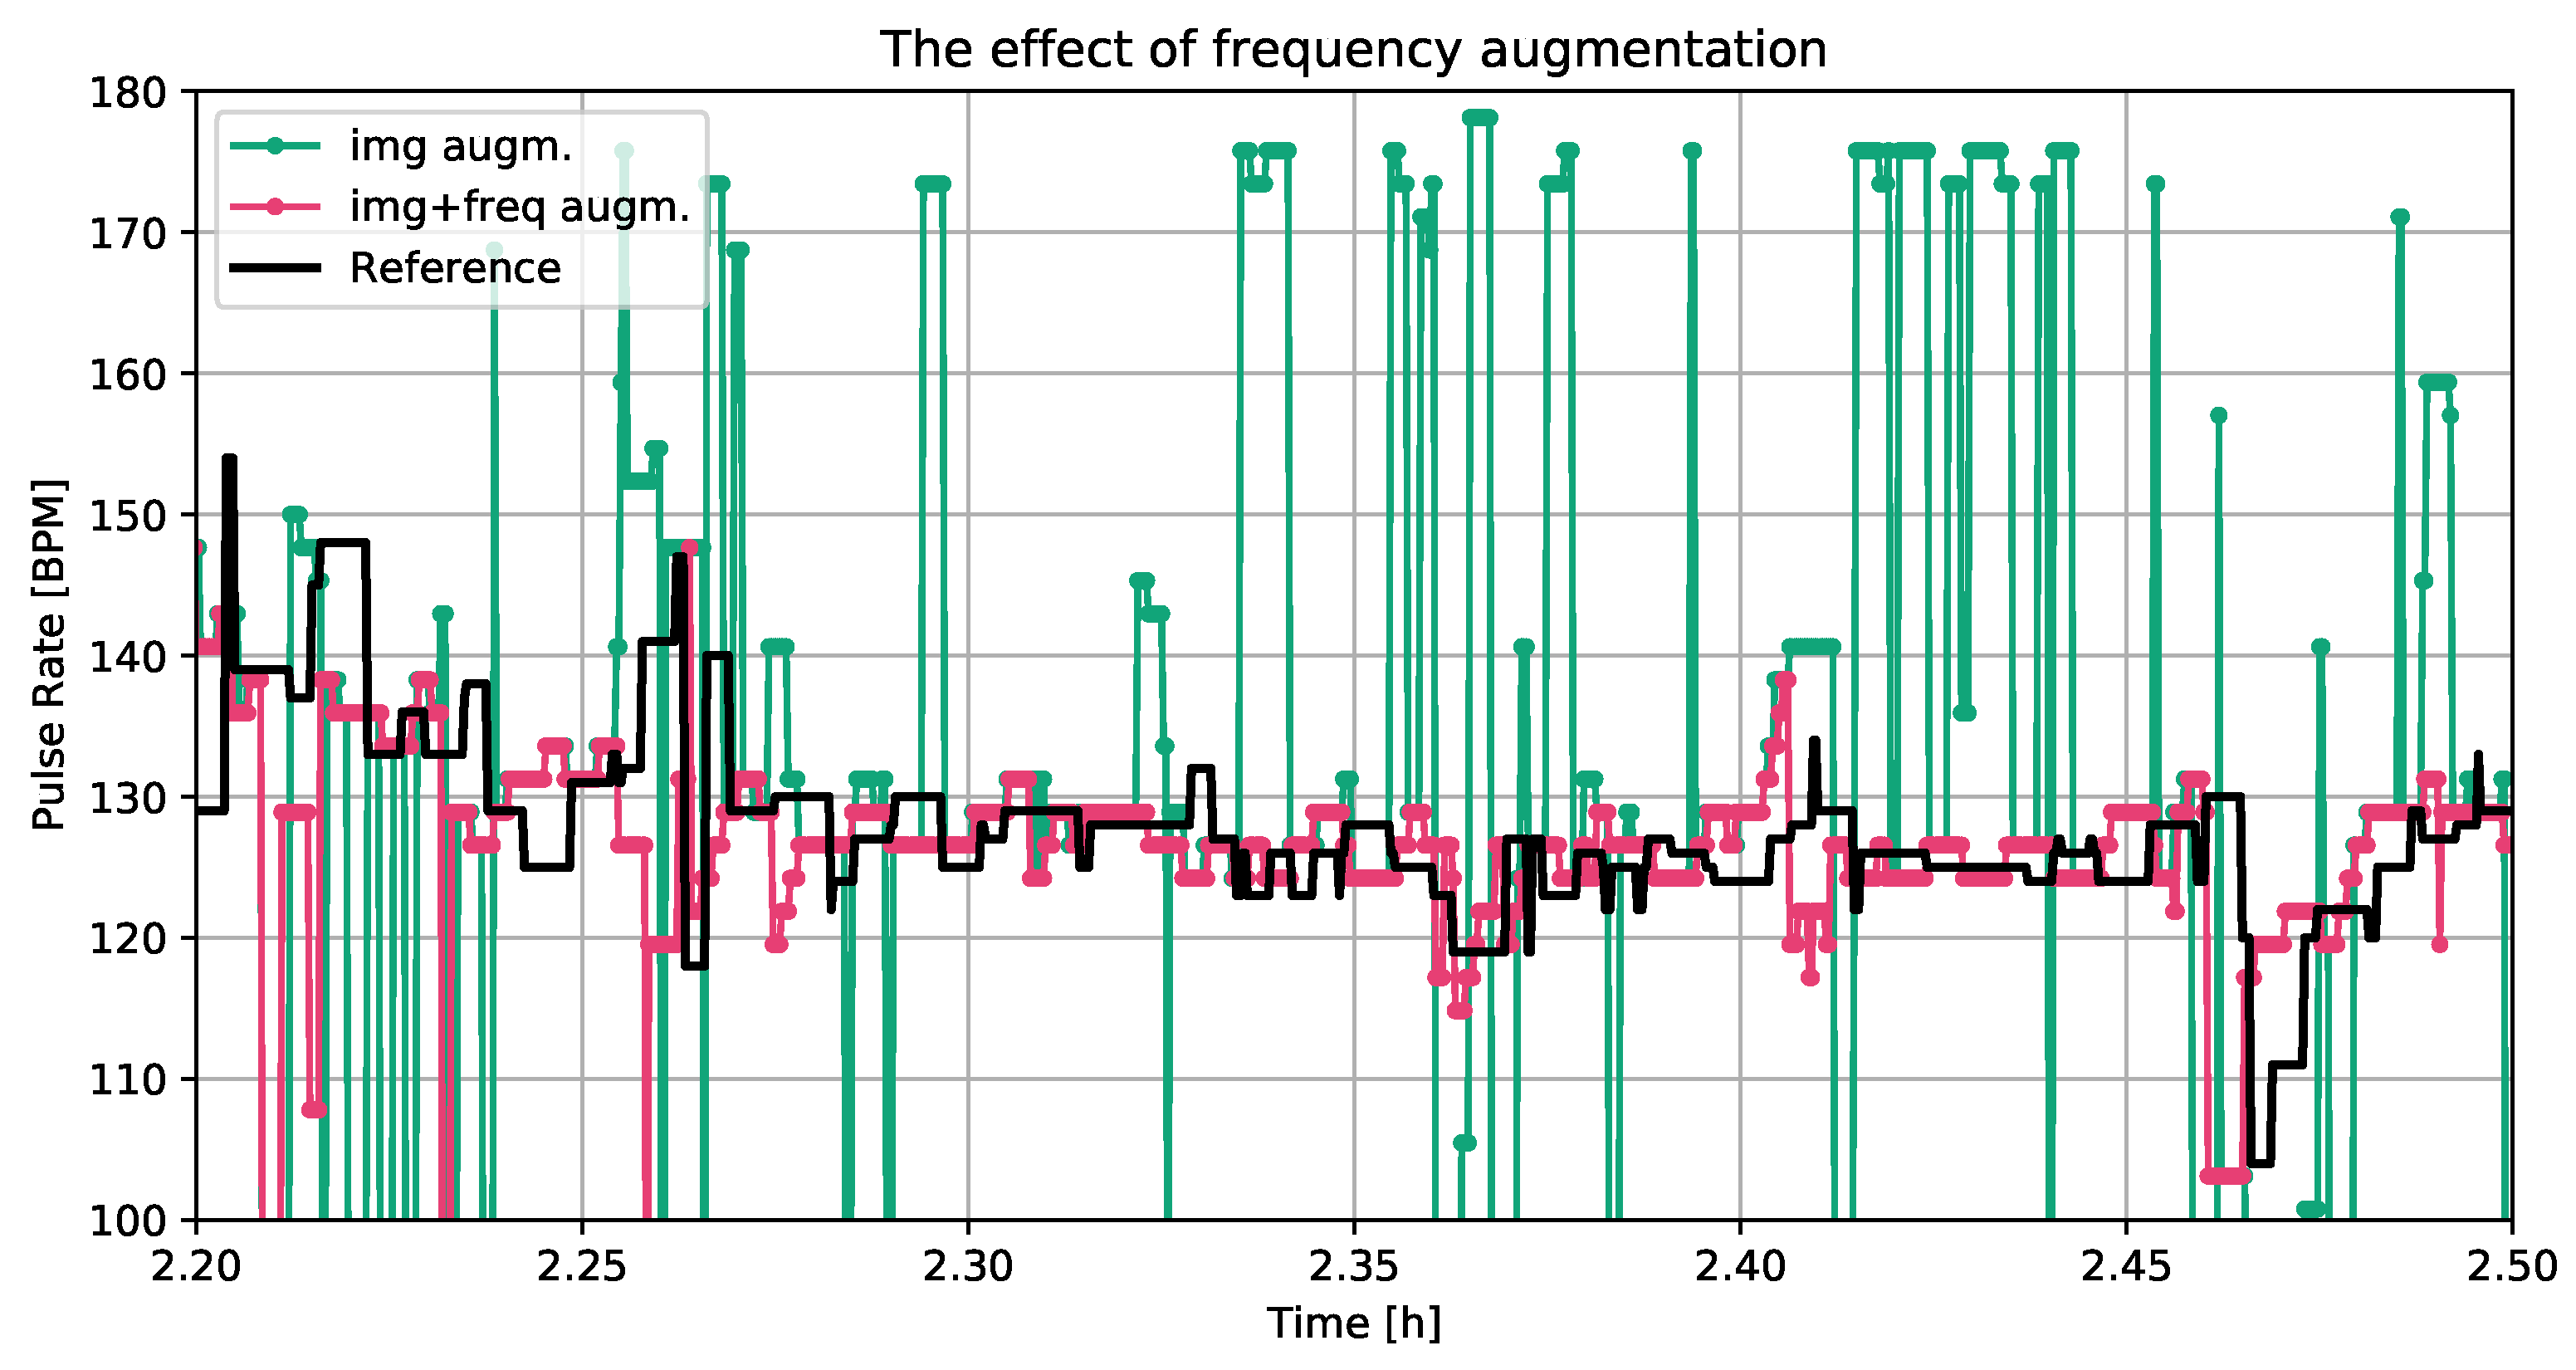
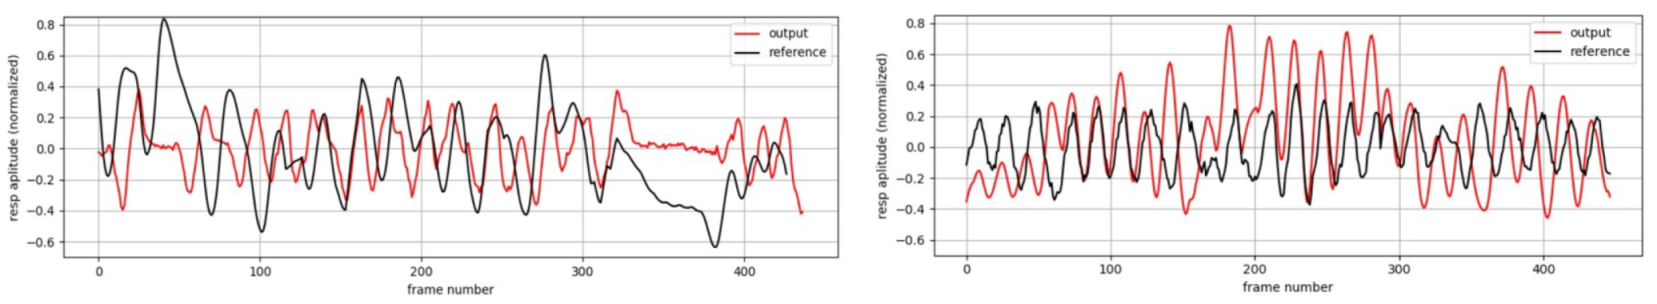
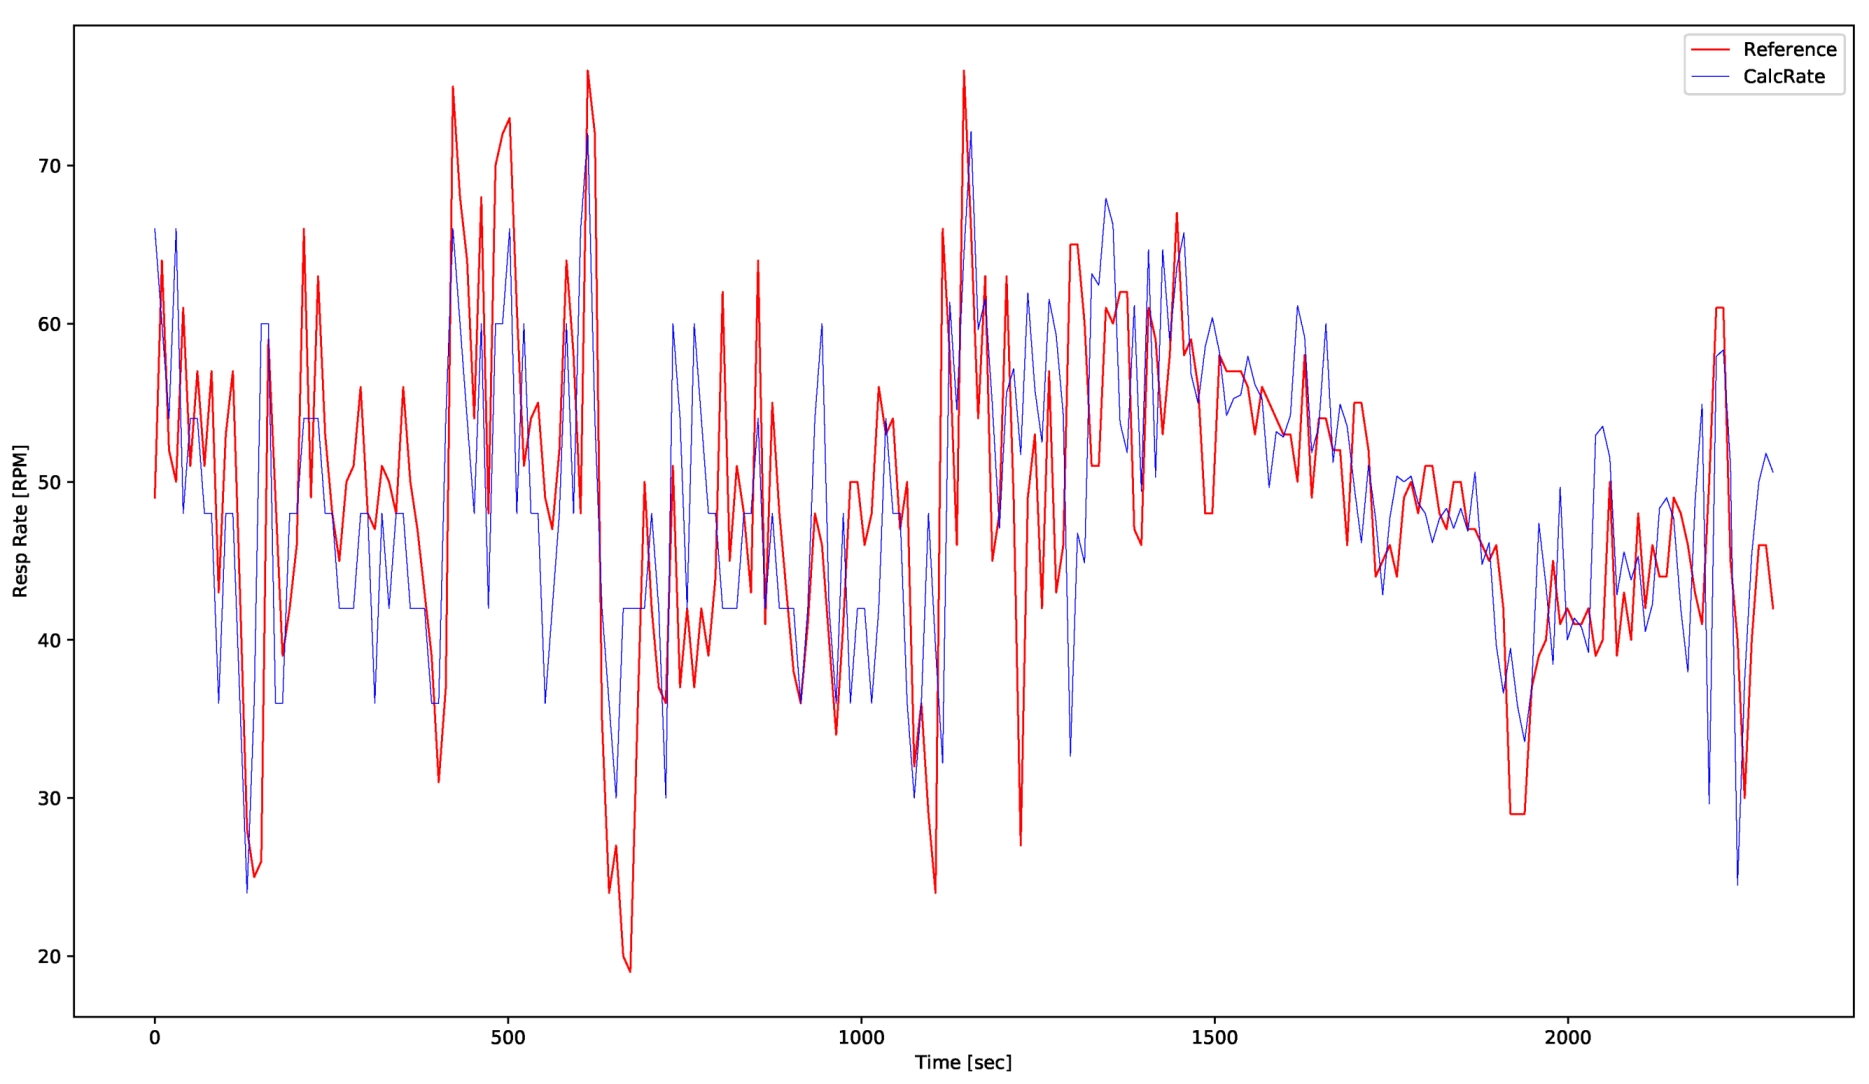
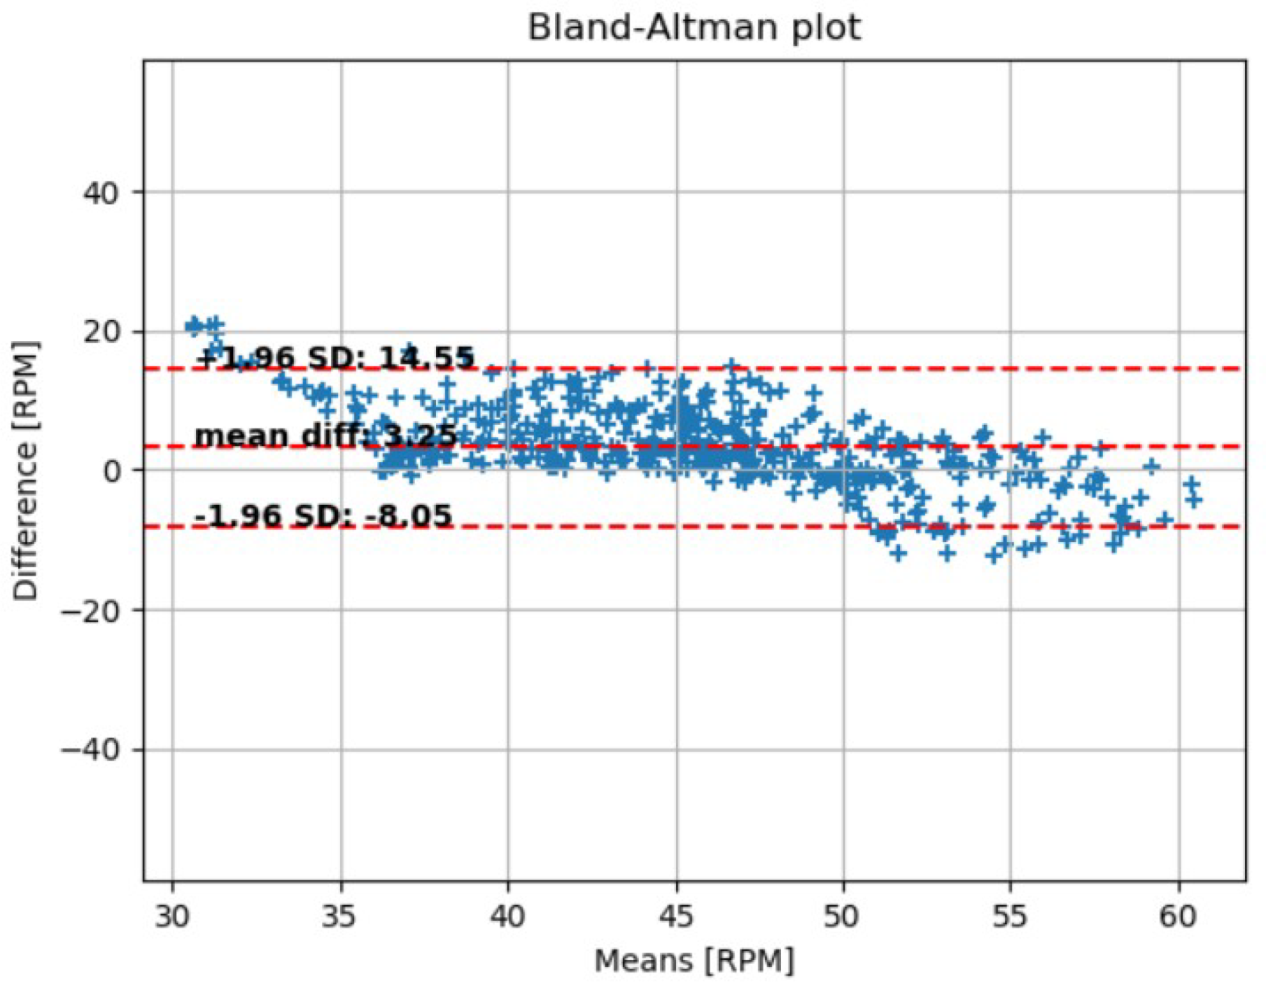