Article

The Effect of Different Organic Foliar Fertilization on Physiological and Chemical Characters in Hop (Humulus lupulus L., cv Cascade) Leaves and Cones

1
Department of Food and Drug, University of Parma, 43121 Parma, Italy
2
Department of Agricultural and Food Sciences, University of Bologna, 40126 Bologna, Italy
3
National Research Council, Institute of BioEconomy (IBE), via Madonna del Piano, 10, 50019 Sesto Fiorentino, Italy
4
Porto Conte Ricerche S.r.l., 07041 Alghero, Italy
*
Author to whom correspondence should be addressed.
Appl. Sci. 2021, 11(15), 6778; https://doi.org/10.3390/app11156778
Submission received: 16 June 2021 / Revised: 15 July 2021 / Accepted: 21 July 2021 / Published: 23 July 2021
(This article belongs to the Special Issue Frontier Research in Hop)

Abstract

:
Background: Hop cultivation requires an abundant quantity of nutrients to reach higher cone yield and quality. The aim of this work was the evaluation of different fertilization plans to obtain an improvement in product quality. Methods: Foliar analysis, anatomical analysis through the use of light microscope and SEM; physiological measurements through atLEAF, Handy PEA and spectrophotometry, were carried out to determine chlorophyll content, carotenoids and photosynthetic efficiency in two periods (t1, t2) for four experimental treatments and a Control (Treat 1, Treat 2, Treat 3, Treat 4, Untreat). Leaf texture (texture analyzer), color (colorimeter), DPPH activity (spectrophotometer), bitter acid content (HPLC-UV) and essential oil yields (steam distillation) and cone yields were measured. Results: Treat 2 showed the best performance: (i) in leaves, in terms of texture, chlorophyll content and color; (ii) in cones, with 6.98% of alpha acids, 1.78% of oil yield and 3.55 kg of fresh cones per plants. Conclusion: The fertilization plans caused alteration in micro and macro elements content in hop leaves and in the composition of hop cones. In our conditions, the best fertilization plan, in terms of cone productivity and quality, was Treat 2, highlighting the value of a customized organic foliar fertilization plan for hop cultivation.

1. Introduction

Hop, Humulus lupulus L., is a dioecious species whose female flowers are used as aromatizing and flavoring agents in beers, but also in traditional medicine due to the presence of peculiar bioactive compounds. Hop cultivation is intensive and plants perform a rapid growth in spring [1,2], which necessitates an increasing uptake of nutrients. Nitrogen (N) is one of the most important macro-nutrients necessary for unconstrained growth of the hop plants. It can influence plant yield, quality and health. Moreover, this nutrient has an important role in fruit size, flavor and composition [3,4]. Nonetheless, excess N increases the incidence of foliar and fruit diseases [5,6]. In hop plants, N in spring is normally supplied ranging from 150 to 225 kg ha−1 [7], in dependence of organic matter content in soil [8]. In hop plants, as in other crops, nitrogen fertilization could also have an impact on the occurrence of pests and diseases, promoting their growth [9,10,11].
Another important macro-nutrient involved in the primary metabolism of plants is phosphorus (P). P participated in particular in photosynthesis and various enzymatic activities; it is necessary for the formation of vitamins and reserve substances, and it has an active role against pests and diseases [12,13,14]. P requirement in hop is modest, estimated in 7.5–9 kg ha−1 of P2O5 [2].
Another key nutrient for hop growth is potassium (K). In plants, K has a fundamental role in osmotic pressure control, turgor adjustment, control of membrane polarization and protein biosynthesis [15]. From different studies [16,17,18], it appears that the use of K significantly reduces the occurrence of pests and diseases. In hops, fertilization requirement of K (in K2O) varies from 80 to 138 kg ha−1. Also macro-nutrients, micro-nutrients such as boron (B), calcium (Ca), magnesium (Mg), manganese (Mn), iron (Fe) and zinc (Zn) are fundamental for the healthy growth of hops. The deficiency of these nutrients determines chlorosis, and since they are involved in cone formation, plant metabolism and accumulation of secondary metabolites, they play a fundamental role in the final quality of hop production [1].
There are different methods to supply the required nutrients to plants; the traditional ways are based on manuring and chemical fertilization that, however, have environmental costs in terms of soil and groundwater leaching. Compared to this, a more environmentally friendly method of nutrient supply is foliar fertilization. In fact, spraying nutrients on leaves reduces the nutrient quantities required, determining a more efficient fertilizer management and a more efficient plant uptake, while avoiding soil leaching [19]. This method allows nutrients to be apportioned to plants in the exact moment they are required, increasing absorption speed and giving a fast plant response [19,20]. However, it is important to determine the right quantity of fertilizers to be used, in order to avoid damage to leaves and preserve the soil and environment. Hop, as a susceptible crop with scarce resistance to fungi and pests in many varieties, usually requires the use of both pesticides and mineral fertilizers during its cultivation. The use of organic manure and foliar fertilization for hop cultivation could reduce its environmental impact, and enhance soil fertility and biodiversity, which are, on the other hand, damaged by the intensive use of mineral fertilizers and pesticides [21,22].
With this premise, the aim of this study was the development and optimization of organic fertilization in hop cultivation, in order to obtain better yield and cone quality, but also to minimize the impact on the environment through foliar fertilization spraying. In this study, we will focus on the differences (compositional, anatomical and physiological) in hop plants treated with four different fertilization plans. All treatments were based on organic fertilizers, whose effects were assessed through leaf chemical analysis, chlorophyll activity, leaf anatomy, antioxidant power, as well as yield and quality of cones in terms of bitter acids and essential oils.

2. Materials and Methods

2.1. Chemicals and Solvents

Dichloromethane (CH2Cl2) and anhydrous sodium sulfate were purchased from Sigma-Aldrich (Milan, Italy). Toluene was purchased from Carlo Erba (Milan, Italy). Ultra-pure water was in-house produced by using a Milli-Q-System (Millipore, Bedford, MA, USA). Methanol (HPLC grade) was purchased from Sigma-Aldrich. Bitter acids mixture standard (international calibration extract, ICE-3) was from Labor Veritas Co. (Zürich, Switzerland). The standard mixture contained α-acids with 13.88% of cohumulone and 30.76% of n-humulone + adhumulone, and β-acids with 13.44% of colupulone and 10.84% of n-lupulone + adlupulone. Xanthohumol from hop (Humulus lupulus L.)  ≥ 96% HPLC-grade standard was purchased from Sigma-Aldrich. Trolox (6-hydroxy-2,5,7,8-tetramethylchroman-2-carboxylic acid), DPPH (2,2-diphenyl-1-picrylhydrazyl free radical) and acetone, were purchased from Sigma-Aldrich, St. Louis.

2.2. Experimental Design

Experiments were carried out during the 2018/2019 season, in the farm “Azienda Agricola Ludovico Lucchi”, located in Campogalliano (Emilia-Romagna Region, Italy; 44°42′19.9″ N 10°50′26.1″ E) on the hop plants of the cultivar Cascade. Hop plants grow on a loamy clay soil, with good nutritional properties (soil analysis in Supplementary Materials Figure S1). During the growth season, 4 organic fertilizer plans (Treat 1, Treat 2, Treat 3 and Treat 4) with soluble fertilizers kindly provided by Caprara S.r.l. (Italy) were tested. For each fertilization plan, different combinations of nutrients were applied utilizing an atomizer machine (foliar treatments) (Table 1). The experimental plan involved two periods of foliar treatment (t1 and t2), the first from the emission of lateral shoots to the start of blooming (t1), and the second, from the 50% of blooming to complete blooming (t2). For each period, three foliar treatments, one per week, were carried out (Table 1). Non-treated plants were also included as a control (Untreat). For every treatment, three independent replicates were used, and every replicate consisted in 150 plants (one hop row). Each block (three replicates) was separated from other treatments by five rows of untreated plants. Plant spacing was 1.2 × 3 m between plants and between the rows, respectively.

2.3. Leaf Sampling

The first leaf samplings were performed at the start of blooming (27 June 2019), and the second leaf samplings were taken at end blooming (22 July 2019). For each replicate, 150 leaves were sampled (one for plant). The collected leaves were then homogenized and used for the analysis. Leaves were collected with the same exposure and from 1.5 to 2 m high.
In September hop cones were harvested (13 September 2019) and were immediately dried by the farmer at 50 °C for 8 h. After drying, 1 kg of sample for each replicate, were vacuum stored at −20 °C. Moreover, cone yield per plant and per row was measured.

2.4. Leaf Analysis

Determination of Macro- and Micro-Elements of Hop Leaves

Total macro- and micro-element contents in hop leaves were submitted to sample digestion/mineralization in a microwave oven (Milestone, Sorisole, Bergamo, Italy) with 4:1 HNO3 (65% v/v):H2O2 (30% v/v), followed by ICP-OES (inductively coupled plasma-optical emission spectrometry) of the resulting liquid, using a Spectro Arcos instrument (Ametek, Berwin, PA, USA). The operating conditions were: 1300 W RF power, 15 L min−1 plasma flow, 2.0 L min−1 auxiliary flow, 0.8 L min−1 nebulizer flow, 1.5 mL min−1 sample uptake rate. Axial view in the range 160–780 nm was used for element determination, while 2-point background correction and three replicates were used to measure the analytical signal. The emission intensities were obtained for the most sensitive lines free of spectral interference. The calibration standards were prepared by diluting the stock multi-elemental standard solution (1000 mg L−1) in 0.5% (v/v) nitric acid. The calibration curves for all the studied elements were in the range of 0.01 to 1.0 mg L−1. The BCR no. 60 certified reference material, which consists of dried, ground and homogenized Lagarosiphon major at given element concentrations, was used as standard for plant element concentrations. Three replicates allowed us to validate the element recovery obtained with the above described procedure vs. the element concentrations of the BCR no. 60 reference material.
Elemental C and N analysis was performed through flash combustion (1000 °C), using a CHNS-O analyser (Flash 2000, Thermo-Fisher, Waltham, MA, USA) with helium as carrier gas. The CO2 and N2 resulting from combustion were separated in a gas-chromatographic column, and were assessed by means of a thermal conductivity detector.

2.5. Anatomical Analysis of Leaves by Light Microscopy

The leaf samples were fixed in FAA solution (formalin: acetic acid: 60% ethanol solution, 2:1:17 v/v) [23]. After two weeks, they were dehydrated with gradual alcohol concentrations and included in paraffin. The resulting blocks were sectioned at 8 μm thickness (transversal cuts) with a semi-thin Leitz 1512 microtome (Leitz, Wetzlar, Germany). The sections were stained with a toluidine blue (TBO) solution [23] to evaluate the structural characteristics after each treatment. The sections were observed under a Leica DM 4000 optical microscope equipped with a digital camera Leica DMC 2900 (Leica Imaging Systems Ltd., Wetzlar, Germania).

2.6. Anatomical Analysis of Leaves by Scanning Electronic Microscopy (SEM)

After the fixing procedure, the samples were dehydrated with gradual acetone concentrations. After this procedure, the critical point dryer CPD-030 (Bal-Tec AG, Balzers, Liechtenstein) was used for sample drying. Leaf samples were mounted on aluminum sample-holder stubs, sputtered with silver (Emitech K575X, Emitech Ltd., Ashford, UK) and examined using a GAIA 3 Tescan electron microscope at 20 kV. The parameters evaluated were: polar (PD), equatorial (ED) diameter, and density of the stomata (number of stomata per square mm), stomatal functionality (ratio PD/ED); glandular trichome density (number of glandular trichomes per square mm), non-glandular trichome density (number of non-glandular trichomes per square mm). All of the counts were performed on three leaves on a defined area of 1 cm2 on the basal central part of the adaxial side of leaf for non-glandular trichomes, and of the abaxial side of leaf for glandular trichomes and for stomata.

2.7. Chlorophyll Determination

Chlorophyll content was determined using different methods, in order to better observe the effect of the different fertilization treatments on leaf functionality in all faceting.

2.7.1. Determination of Chlorophyll by atLEAF Measurements

The chlorophyll content of the leaves was measured and recorded using an atLEAF+ chlorophyll meter (FT Green LCC, Wilmington, DE, USA). The measurements were collected at the same time of the day (12.00 h) for each sampling time, on 24 randomized plants for each row in the field, on 72 leaves value per treatment. The measurements were collected on blade tissue, avoiding unhealthy and discolored leaves and the midribs.

2.7.2. Chlorophyll Fluorescence Measurements

Chlorophyll fluorescence measurements were performed on intact leaves in the two sampling times. Field measurements were carried out at the same time of day (full light, 12.00 h) at ambient temperature immediately after dark adaptation using a Plant Efficiency Analyzer, Handy PEA (Hansatech Instruments, King’s Lynn, UK). The right dark period duration and the different analysis parameters were evaluated with different measurements made every 5 min of darkness, from 0 to 30 min. The right time of darkness was evaluated to be 20 min. To identify the right light intensity, seven different light intensities were evaluated from 500 µmol m−2 s−1 to 3500 µmol m−2 s−1. The optimal was individuated when Fv/Fm was stable, at 2500 µmol m−2 s−1. The gain parameter was set at 0.5.
First, fully expanded leaves were dark adapted for 20 min using a leaf clip (Hansatech Instrument, King’s Lynn, England). The chlorophyll fluorescence parameters were measured immediately, according to the following setting: pre-illumination: 0.1 s, illumination: 1 s, number of flashes: 1 and intensity: 2500 µmol m−2 s−1.

2.7.3. Determination of Chlorophyll a, b and Carotenoids

The samples were collected and frozen in liquid nitrogen and stored at −80 °C until the analysis. The analysis was carried out using 100 mg of fresh tissue. The plant leaf sample was homogenized with tissue homogenizer ultra turrax with 10 mL of 80% Acetone (v/v). Homogenized sample mixtures were centrifuged at 5000× g for 10 min at 4 °C. The solution mixture was analyzed for chlorophyll-a, chlorophyll-b and carotenoid content by a UV-visible spectrophotometer (Perkin Elmer Inc. Waltham, MA). The quantification of chlorophyll-a, chlorophyll-b, and carotenoids was performed according to the method of Dere and collaborators [24].

2.8. Leaf Color Determination

Color determination was carried out using a Minolta Colorimeter (CM 2600d, Minolta Co., Osaka, Japan) equipped with a standard illuminant D65. The assessments were carried out on the surface of five different hop leaves. L* (lightness, black = 0, white = 100), a* (redness > 0, greenness < 0), b* (yellowness, b* > 0, blue < 0), C (chroma or saturation, 0 at the center of the color sphere) and Hue° (Hue angle or tone, red = 0°, yellow = 90°, green = 180°, blue = 270°) were quantified on each sample using a 10° position of the standard observer. Ten samples of each treatment at each sampling time were analyzed [25].

2.9. Dry Weight

The moisture content (g/100 g) of leaves and cones samples was evaluated by means of a gravimetric technique following the official method (AOAC, 2002) [26].

2.10. Leaves Texture Determination

The texture of all treatments (Untreat, Treat 1, Treat 2, Treat 3, Treat 4) for each time (t1 and t2) were immediately analyzed by a texture profile analysis (TPA) test using a TA.XT2i Texture Analyzer equipped with a 3 mm diameter cylindrical aluminium probe by means of a single compression with a speed of 1 mm/s up to the complete penetration of the sample.
The following parameters were determined from the force vs. time curves: first peak force (FP1 given in Newtons (N)), which indicates the resistance opposed by external cell layers to needle penetration; maximum puncture force (Fmax given in N), which indicates the resistance opposed by the pulp to needle penetration; and area under the force/time curve (area given in N*s), which represents the total work carried out by the needle probe to penetrate the sample. The parameters were quantified using the application software provided (Texture Exponent for Windows, version 6.1 10.0). Ten samples of each treatment at each time of sampling were analyzed [27].

2.11. DPPH Free Radical Scavenging Activity Test

The hop leaves were homogenized through mortar with liquid nitrogen, and stored at −80 °C until the analysis. Antioxidant molecules were extracted following the methodology used by Paciulli and collaborators [28].
TEAC value (Trolox equivalent antioxidant capacity; mM Trolox/100 g) of samples was obtained from the calibration curve calculated measuring the absorbance at 517 nm of Trolox ((±)-6-hydroxy-2,5,7,8-tetramethylchromane-2-carboxylic acid) methanolic solutions at different concentrations [28]. Analyses were performed in triplicate.

2.12. Hop Cones Analysis

2.12.1. Hop Cone Growth Rate

Cone measurements took place in the 7th growth stage of the BBCH scale [29]. The first measurements were made at the beginning of the cone formation; the last measurements corresponded to the end of cone growth. Cone samples were measured in width and length with a gauge, directly in the field, on plants.

2.12.2. Hop Cone Yields

Cones from 45 plants per treatment were picked with the farmer picking machines and weighted with electronic balance. Then, the average yields per plant were calculated.

2.12.3. Bitter Acids Extraction

Bitter acids were extracted from 0.5 g of dried cones in 20 mL of methanol in a flask and homogenized with an Ultra Turrax mixer (IKA®, T18 Basic) twice for 20 s, to avoid sample overheating [30]. Extracts were stirred for 3 h at room temperature in the dark to prevent degradation and photo-oxidation. Subsequently the extracts were centrifuged at 1800× g at 20 °C for 20 min. Supernatant was then transferred to a volumetric flask (50 mL). The exhausted matrix was re-extracted with methanol (15 mL), centrifuged as earlier and the supernatant was pooled with the first extract; the volumetric flask was then filled to the final volume with methanol. After filtration through 0.45 μm polytetrafluoroethylene (PTFE) filter, the sample (10 μL) was analyzed by high-performance liquid chromatography with ultraviolet detection (HPLC-UV) [31].

2.12.4. High-Performance Liquid Chromatography with Ultraviolet (HPLC-UV) Analysis

The HPLC system was equipped with a pump, on-line vacuum degasser, auto-sampler, Peltier column oven, UV–Vis detector (Perkin Elmer Series 200) and autosampler (Perkin Elmer series 220). The chromatographic data was analyzed using a Perkin Elmer Total Chrome workstation (version 6.3.1.). HPLC was equipped with Luna C18:2 column (5 µm, 100 A, 250 mm × 4.6 mm) (Phenomenex®, Castel Maggiore, Bologna, Italy). Solvent A (water (H2O) + 0.1% ortophosphoric acid (H3PO4) and solvent B (methanol (CH3OH) + 0.1% H3PO4) were used for the mobile phase. Chromatographic conditions were set as follows: the flow rate was 1.5 mL min−1 in isocratic, the column temperature was set at 30 °C; the injection volume was 10 μL; the analysis was performed using eluent A 5% and eluent B 95% for 15 min. Chromatograms were acquired at 314 nm. Three injections from three independent extractions were performed for each sample. For the quantification of α- and β- acids, a calibration curve was obtained from dilution of ICE-3 standard, according to the official method (Analytica-EBC, method 7.7).

2.12.5. Essential Oil Extraction

Essential oils were extracted by steam distillation with a Clevenger apparatus for 4 h [32].

2.13. Statistical Analysis

All data obtained were evaluated by the XLSTAT software (Addinsoft SARL, Long Island City, NY, USA). The collected data were analyzed for mean and standard deviation (SD) and also by using univariate analysis of variance (ANOVA). One-way ANOVA was carried out by applying Tukey’s post hoc test (p ≤ 0.05) to separate levels of significant traits.

3. Results and Discussions

3.1. Determination of Macro- and Micro-Elements of Hop Leaves

Macro elements data outlined a statistical difference at the ANOVA between the values of two fertilization times for each studied element (Table 2).
In general N decreases from t1 (35.55 g/kg on average) to t2 (33.13 g/kg on average). This result is due to the N translocation from different plant organs to the cones [2]. The lower N quantity was found in Treat 1 (in both times), which represents the treatment with the least N supplied. N shows the highest leaf concentration in Treat 2 (Table 2), reflecting the N content in fertilization plans (Table 1); Untreat is unexpectedly quite high, despite having received no N (Table 2). Also P content in leaves shows differences between the two fertilization periods. P in t1 reaches the highest amount in Treat 4, even if P was not applied, while in t2, P presence was in accordance with the fertilization plan, with the highest amount in Treat 3 which corresponds to the highest amount of phosphorous (P2O5) applied (Table 1). In the same period, Untreat leaves show the lowest P content. K shows differences only between the two fertilization periods, with a slight decrease between t1 and t2. Mg is involved in the enhancing of crop production [33], and shows an increase in leaf content between the two fertilization periods, as a result of increased Mg amount. The Mg content shows the highest level in Treat 3 in t1, and Treat 4 in t2, but these results do not reflect the Mg contents of the fertilization plan. Calcium is not present in any treatment; nevertheless, Untreat in t2 has the highest Ca content. This difference is probably due to an altered response for the absorption of Ca due to the interaction with the other elements; it is well known that some elements can promote or inhibit the absorption of others, as in the case of an excess of P that inhibits the absorption of elements like Zn, Cu, Mn and Ca [34,35]. Sulphur shows significant differences only at t1 (Table 2). In this case, the leaves of Treat 4 show the highest values, while the lowest values are found in Treat 1.
Also, the microelements leaf content shows differentiation between the two sampling periods (t1 and t2) (Table 3). The elements that show the largest variations is Zn, followed by Mn and Fe. As they are involved in cone formation, the translocation of these microelements from leaves to cones is a likely hypothesis [2]. The opposite trend may be observed for B, which might be due to a greater B intake in the second period, especially in Treat 4, that shows the highest leaf B concentration (Table 3).

3.2. Anatomical Analysis of Leaves by Light Microscopy

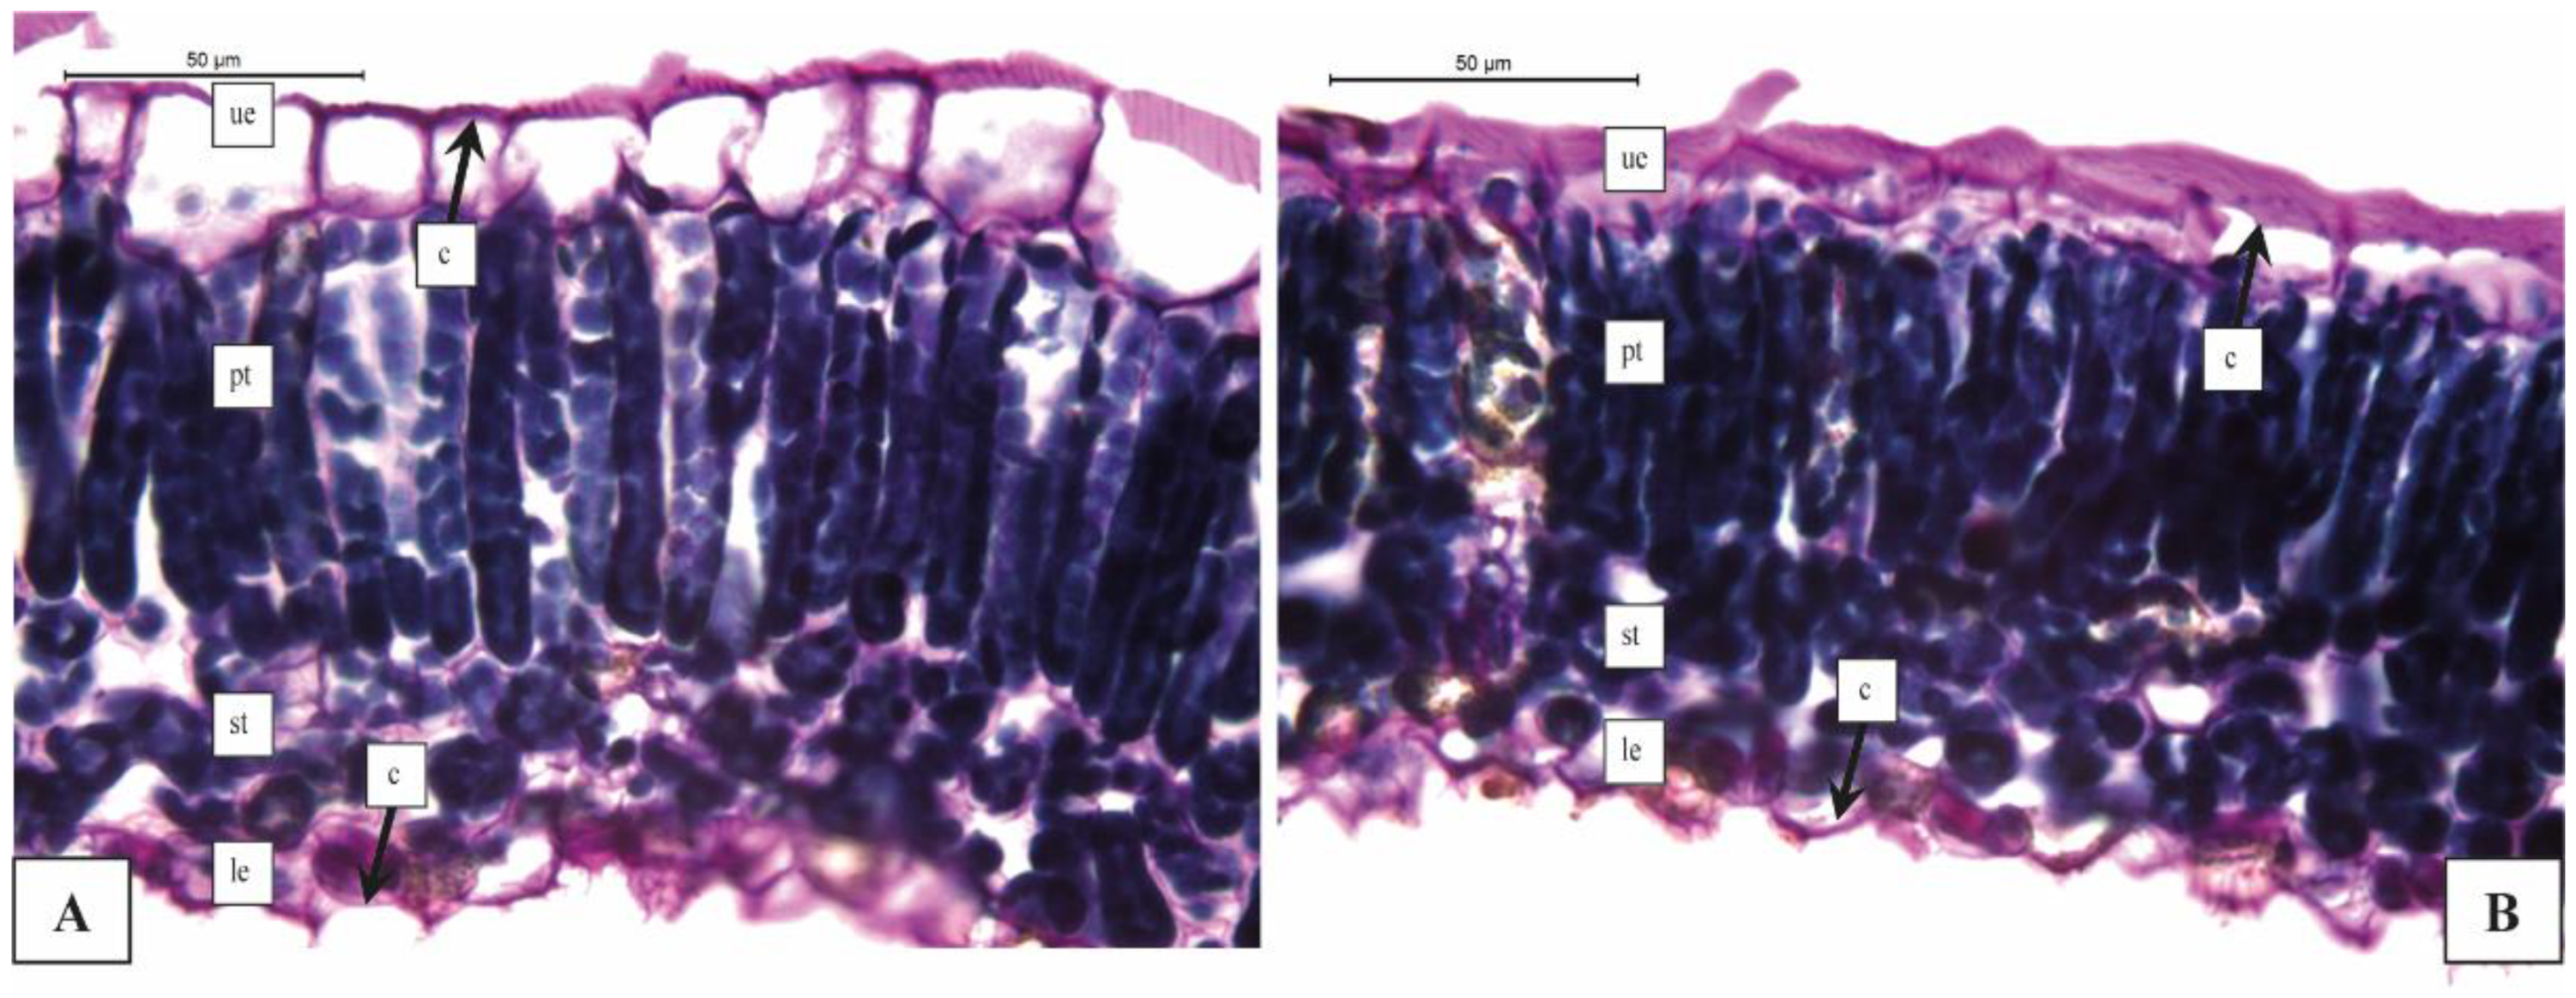
The transverse section of Untreat leaves shows a large central vein and a thin leaf mesophyll (125.05 ± 2.62 μm) (Figure 1A). The central vein consists of a large cribro-vascular bundle immersed in a parenchyma and surrounded, in the adaxial and abaxial part, by a collenchyma tissue. The foliar mesophyll appears to be made up of 2–3 layers of palisade tissue cells with an average thickness of 75.54 ± 6.21 μm (Figure 1A). The spongy tissue is on average 23.28 ± 1.36 μm thick (Figure 1B). The palisade tissue represents about 70%, while the spongy mesophyll is about 25% of the entire mesophyll/leaf blade. The upper epidermis is generally made up of large cells with a longitudinal diameter of 32.68 ± 1.41 μm and a transverse diameter of 15.48 ± 0.99 μm; these cells then appear elongated longitudinally. The thickness of the cuticle in the upper epidermis is 2.47 ± 0.61 μm (Figure 1A). The cells of the lower epidermis are smaller than those of the upper epidermis: their average longitudinal diameter is 11.28 ± 0.98 μm, while the transverse one is 12.03 ± 1.02 μm. These cells then appear isodiametric (Figure 1A). The thickness of the lower epidermis cuticle is 2.43 ± 0.61 μm.
To better understand the effect of foliar treatments in leaf anatomical parameters, data are summarized in Table 4. The two sampling times (t1 and t2) did not show any differences from a structural point of view, and for this reason the data averages of the two times are shown in Table 4.
The results show significant differences for some leaf anatomical features. The leaves of the Treat 2 showed a significant increase in cuticle, of both the upper and lower epidermis (Figure 1B; Table 4). In tomato, some authors [36] indicate that the concentration of foliar N affects the thickness of the epidermal cuticle. It appears quite established that high concentrations of N lead to a decrease in the cuticle thickness; peach trees treated with different concentrations of N have produced fruits with different cuticle thickness [5], and thinner if N concentration was high.
In our study organic nitrogen has positive effects on increasing the cuticle thickness. Furthermore, the percentage of palisade tissue was also found to be significantly lower in Treat 2. Treat 2 is characterized by a low input of K in exchange for a high input of organic N (Table 1). Hu et al. [37] indicated that, in Brassica napus L., the major difference in leaf anatomical structure with reference to K treatments was that palisade tissue thickness was reduced with increased K supply, and spongy tissue cell size and tissue thickness were equally reduced under the K120 vs. K60 and K0 treatments (Table 4). In our study on hop, it results that a high input of N and low input of K lead to reduced growth of the palisade tissue.

3.3. Anatomical Analysis of Leaves by Electronic Microscopy (SEM)

Leaf stomata were observed in the different treated samples (Figure 2a,b).At the first period of treatments (t1) the stomatal density of Untreat and Treat 1 exhibited no statistical difference with a respective 671.64 and 689.55 stomata per mm2 (Figure 2a), while Treat 3 showed the greatest value (794.03 stomata per mm2; Figure 2b) (Table 5). At the second period (t2), again Untreat and Treat 1 showed no statistically significant difference (674.6 and 710.45 stomata per mm2), Treat 2 displayed an increase of stomata (728.36 stomata per mm2), while Treat 3 and Treat 4 recorded lower values (662.69 and 567.16 stomata per mm2, respectively) in comparison with Untreat (Table 5). Comparing the treatments at t1 and t2, it can be observed that while Untreat remains substantially unchanged, Treat 1 shows a slight increase in stomatal density, while all the other treatments (Treat 2, Treat 3 and Treat 4) show a decrease in the number of stomata per unit area (Table 5). Regarding stomata diameters, higher values were measured in Untreat (19.4 μm), Treat 4 (19.9 μm) and Treat 3 (19.7 μm) at t1, and in Treat 2 (18.5 μm) and Treat 4 (18.7 μm) at t2 (Table 5). At t1, Treat 3 showed higher PD/ED (1.97), while at t2 all treatments recorded a lower ratio compared to Untreat (Table 5).
Two types of glandular trichomes were identified on hop leaves [38]: large peltate-type known as lupulin glands, found on the abaxial side (Figure 2c), and stalked capitate glands, called also bulbous trichomes, which are much smaller, fewer in number, and consist of a stalk and four head cells, occurring on both adaxial and abaxial surfaces, located mostly along the vessels, but rarely present on the lamina (Figure 2d black arrow). Since the latter trichomes are present in small numbers, only lupulin glands were considered in this study. At t1 all treatments showed no statistical differences with Untreat (Table 5). At t2, while Untreat remained unchanged, all treatments underwent a decrease in the density of glandular trichomes (Table 5). Two types of non-glandular hair are present on hop leaf: the predominantly cystolith-containing hairs are generally restricted to the adaxial leaf surfaces and contain calcium carbonate crystals (Figure 2e,f), as already described by Dayanandan and Kaufman [39]; the second is the longer and rarer type of slender trichomes present only on the midribs and major veins of the abaxial leaf surfaces (Figure 2d black triangle). Since the cystoliths are more abundant and uniformly distributed, only this type was considered in this investigation. At t1, Treat 3 had the same density of Untreat, in practice (12.85 and 12.7 hairs per mm2, respectively), while Treat 1, Treat 2 and Treat 4 outlined a small decrease (Table 4). At t2, Treat 2 and Treat 3 showed no statistical differences with Untreat, while Treat 1 and Treat 4 recorded the respective highest (16.84 hairs per mm2) and lowest density (7.68 hairs per mm2).
The polar and equatorial diameter ratio (PD/ED) is associated with guard cell shape and is an important stomata feature. A higher ratio is correlated with an elliptic shape, characteristic of more functional stomata. Conversely, a rounded shape (smaller PD/ED) is associated with lower stomata functionality [40]. Thus, in this study, in the first period, Treat 3 recorded the best results in terms of increased number of stomata and their functionality (PD/ED ratio), while in the second period all treatments showed a worse stomata functionality, compared to Untreat.
The non-glandular trichomes analysed are hairs containing cystoliths. The cystoliths (Figure 2d,e) are intracellular mineralized inclusions present in the leaf of some Angiosperm families (Urticaceae, Moraceae, Ulmaceae, Cucurbitaceae and Acanthaceae). They consist mostly of calcium carbonate but a small amount of magnesium is also present [41], which probably helps to stabilize the amorphous calcium carbonate [42]. The high density of hairs containing cystoliths in Treat 1 at time t2 could be a consequence of the higher dose of Mg provided in this treatment; analogously, the lower Mg value in Treat 4 might be explained by the absence of this element.

3.4. Chlorophyll Determination

Chlorophyll content, is used as an indirect way to assess plant productivity and vegetative production [43,44,45]. The measurement of chlorophyll was used to determine plant stress but also to determine plant nitrogen status [44].

3.4.1. Chlorophyll Rates on at LEAF Measurements

The atLEAF chlorophyll measurements showed statistically significant differences between the two studied periods (t1 and t2), with the highest values reached in t2 (average index in t2 49.8 versus 48.4 in t1) (data not shown). The increase in the measured chlorophyll content in t2 is assumed to be caused by the rising requirements of photosynthesis products during flowering and strobiles formation. In the comparison of treatments, the lowest chlorophyll value was found in Treat 1 in t1 (45.05 atLeaf index) and Treat 1 and Treat 3 in t1 and t2 in t1 (47.78 and 47.06 atLeaf index in t2) (Figure 3A). The highest chlorophyll value was found, instead, in the two periods in Treat 2 (51.26 and 53.84 atLeaf index). Treat 2 was the treatment with the highest amount of nitrogen supplied, while Treat 1 was the treatment with the lowest (Table 1); an increase in chlorophyll content due to nitrogen fertilization was observed in different studies [44,45], in particular, Coria–Cayupan and collaborators [46] in a study on lettuce; the researchers also observed an important increase of chlorophyll content when plants were fertilized with a mix of elements used by plants in chlorophyll biosynthesis (Mn, Mg, Cu, Zn and Ca), and it is well known that Mn contributes to chloroplast structure.

3.4.2. Chlorophyll Fluorescence Measurements

From the results obtained using the HandyPea fluorometer, it is possible to observe the photosynthetic efficiency (Figure 3B). The only significant differences were observed at t1 in Treat 2, which showed a lower photosynthetic efficiency, thus demonstrating the importance of microelements. In fact, Treat 2 was the only treatment (together with Untreat) where microelements were not supplied. Treat 2 denoted an interesting behavior: since Zn is involved in the photosynthetic capacity [47], and in the first step Treat 2 did not comprise Zn (Table 1), the effect at t1 was the lower photosynthetic efficiency when compared to the other treatments; in the second step, Zn was added to Treat 2, thus causing an increase in photosynthetic capacity to the levels of other treatments at t2.

3.4.3. Chlorophyll Quantification with Spectrophotometer

The spectrophotometer analysis in t1, for Untreat, Treat 2 and Treat 3 showed the highest amount of chlorophyll A content; instead in t2 no significant differences were highlighted (Figure 3C,D). Chlorophyll B showed the highest value in Treat 2 in the first period (t1), when Treat 4 and Treat 1 had the lowest value (Figure 3C). In t2, instead, a different trend is shown: Untreat and Treat 2 have the higher ChB values (Figure 3C). Carotenoid content did not show significant differences in t1; in t2, instead, Treat 1, Treat 3 and Treat 4 showed higher amounts than Untreat and Treat 2 (Figure 3D). The carotenoid content tended to decrease during the vegetative period [45].
Fe fertilization also increases chlorophyll concentration in plants [48], but in our study the treatment with the highest Fe concentration (Table 1) did not correspond to the treatment with the highest chlorophyll accumulation, showing in this case a non-dominant role of Fe on hop chlorophyll content.

3.5. Color Determination

Leaf color is related to chlorophyll and carotenoid content and resulted, especially in the first period, to be influenced by the applied treatments (Figure 4A,B). The highest green color at t1 was observed in Treat 2 (a* values of 3.36), where also ChA and ChB were present in higher amounts. Instead, at t2 color values did not show any more significant differences for the a* and b* parameters. The only significant differences at t2 were related to brightness, with Treat 2 showing the highest L value.

3.6. Dry Weight

The dry weight of leaves in t1 showed the highest level for Treat 1 and Treat 2 (Figure 5); instead in t2, later in the growth season, Untreat showed the highest solid fraction. The data of t2 is in partial accordance with Gutíerrez-Rodríguez et al. [49], who observed in spinach an increment in the leaf mass yield but a reduction in leaf dry weight when spinach was treated with the highest amount of N (250 ppm).

3.7. Leaf Texture Determination

The highest value of texture (Figure 6), was in t1 (1.59 N versus 1.48 N in t2) (data not shown), suggesting that fully developed but younger leaves possess more resistant tissue than those in the second stage of fertilization. Among treatments, Treat 2 showed the hardest leaves, with 1.81 Newton (N) in t1 and 1.70 N in t2. This result confirms what was observed by the leaf anatomical analysis (Figure 3C,D) indicating a consistent increase in cuticle thickness in Treat 2 (Table 4), already at t1.

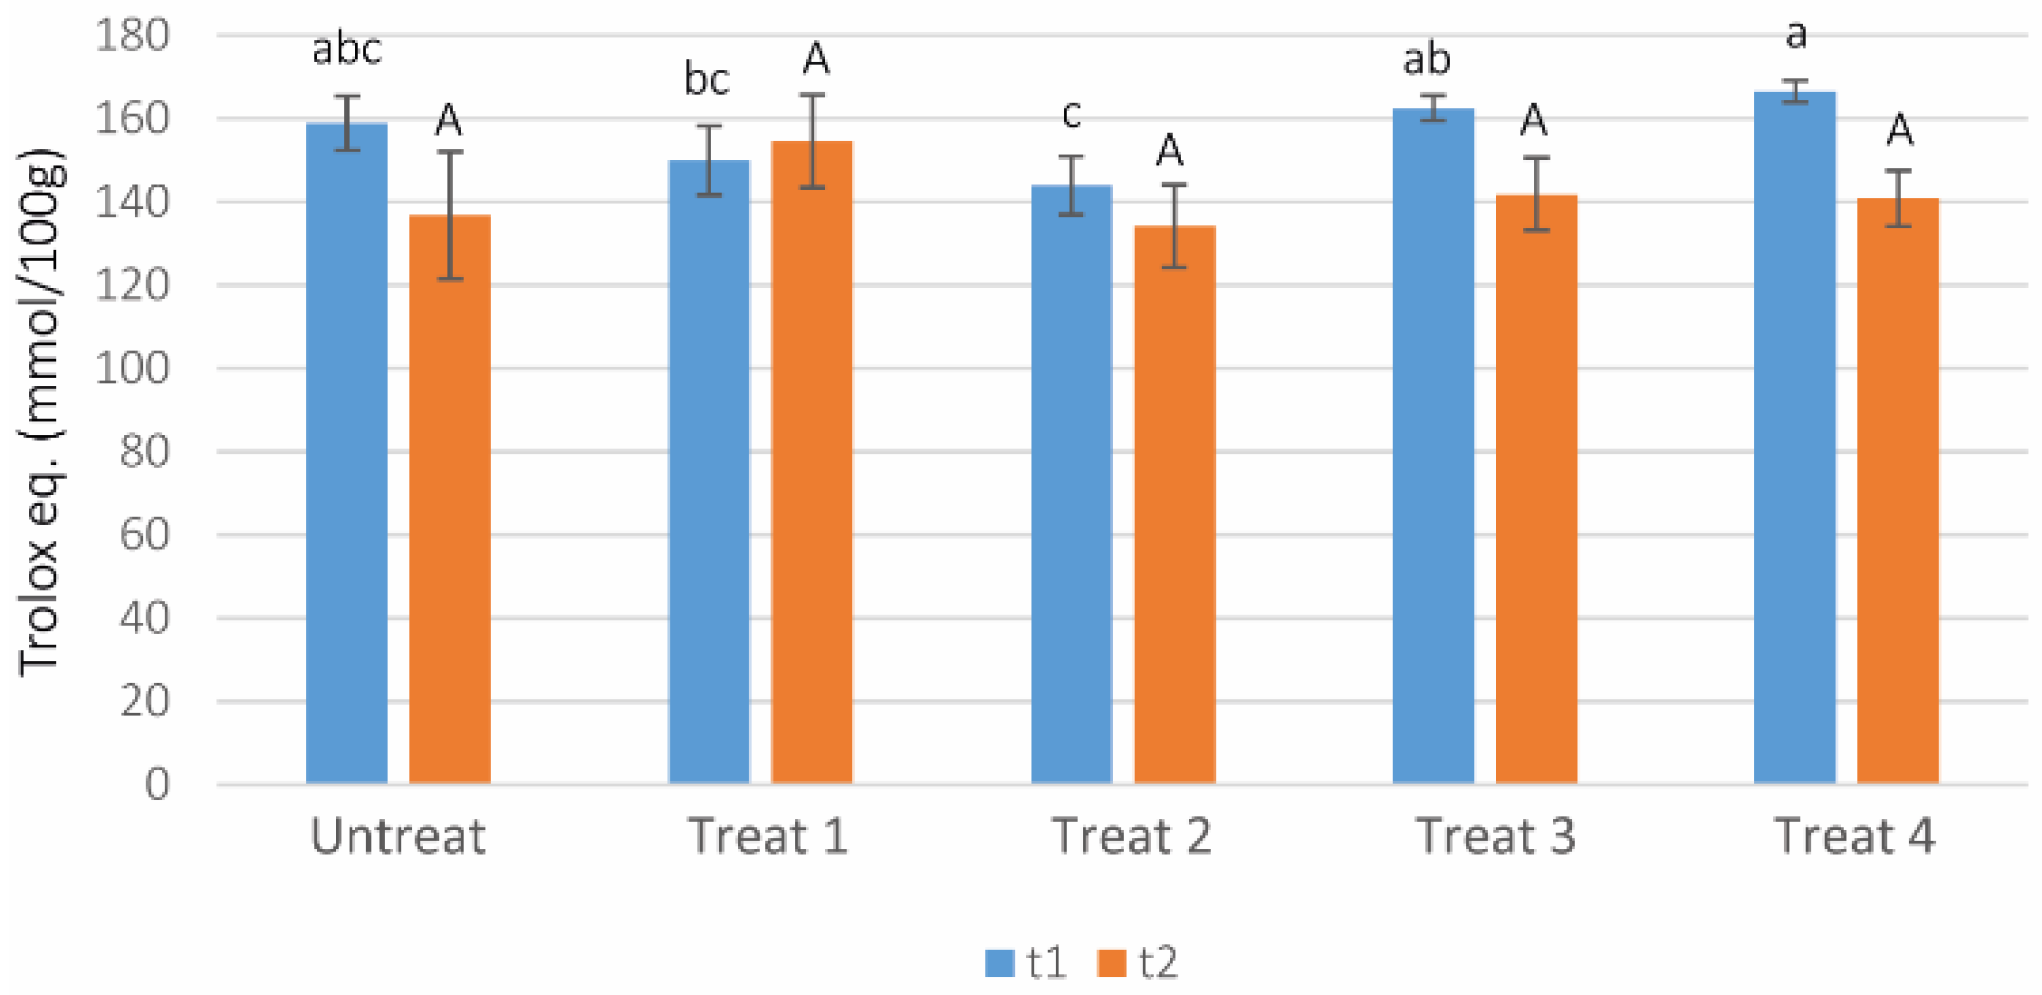
3.8. DPPH Free Radical Scavenging Activity Test

In t1, Treat 3 e Treat 4 showed the highest amount of radical scavenging activities with 162.54 and 166.51 Trolox equivalent respectively (Figure 7); their difference with the other treatments was the higher presence of K, Fe and Zn in these two treatments (Table 1); thus, probably the increase of radical scavenging activity was promoted by one or all the microelements, especially Fe, supplied to the plants. In the second part of the study, at t2, the radical scavenging activity decreased (except for Treat 1) with no significant differences among the treatments (Figure 7), despite a higher activity registered in Treat 1, which in t2 was differentiated from the other treatments for the a higher Mg supply. In t2, only Treat 2 contained Zn and Fe (in lower quantity compared to Treat 3 and Treat 4 in t1), but no K, and the results indicate either a lower impact of this elements on antioxidant activity in t2, or that the quantities involved are not sufficient to increase this activity. In the literature, the studies on the effects of fertilization on free radical scavenging activity are more frequently related to the nitrogen fertilization: Coria-Cayupán et al. [46], in a study on lettuce, observed the low antioxidant activities in leaves in the presence of urea and mineral nitrogen fertilization, in comparison with other fertilization treatments. In another study on marigold under different organic foliar fertilizations, free radical scavenging activities were higher in the treatments that implied less nitrogen quantity, and lower in the treatments richer in nitrogen [50]. Nonetheless, these studies do not help to elucidate the results that we obtained, because in the first period the high radical scavenging activity was observed in the treatments with high N content.

3.9. Hop Cone Analysis

Different aspects of cone quality were considered for the evaluation of the effect of different fertilization plans. In particular, cone yields, bitter acids content and essential oil content were observed.

3.9.1. Hop Cone Growth Rate

From hop cone growth rate (Figure S2), it was possible to observe the growth trend of cones treated with the different fertilization plans. At the beginning, there was an homogenous growth of all cones, in the different treatments. Then, there was diversification in the growing trend, a split occurring after July 22. Untreat showed a constant growth, and on 9 August, it was the treatment showing the highest growth rate. In the same period, Treat 3 and Treat 1 showed the slowest trend in cones growing. The other treatments showed a similar trend in growing, arriving at a comparable result at final measurements (September 3). Transversal growth showed similar trend for all treatments except for Untreat that followed a different curve; however at the end of the growing time, all treatments showed similar results with no statistical differences observed. It is interesting to note that Untreat curve followed a different growth tendency, showing higher values than the other treatments, until the beginning of August. The result mirror the phenological observation find explanation the phenological observation; Untreat cones in fact ripened earlier than the other treatments, at least 10 days before.

3.9.2. Hop Cone Yield

The cone yield per plant exhibits important differences among treatments. Treat 3 revealed the poorest yield performance, with 2.20 kg of fresh cones per plant (Table 6); Treat 2 instead, exhibited the best yield, staging a 1.35 kg per plant (i.e., +61%) yield increase over Treat 3. Hop yield seems to be related not only to N fertilization, that characterizes Treat 2, Treat 3 and Treat 4 at t1 (Table 1), but also to K, that was higher in Treat 2 and Treat 4 in t1, and finally, to the use of microelements at t2 (Treat 2). In trees, usually K and P promote fruit yields and quality [51]. From our study it does not appear clearly that some nutrients were in excess, and might have affected hop yield. However, it may not be excluded that high quantities of P and K in t2 (i.e., T3) could have reduced or inhibited cone production, or inhibited the intake of Zn or other microelements that are involved in cone formation. Moreover, Treat 4, characterized by enhanced content in Fe, Zn, Cu, had a higher cone yield than Treat 1, Treat 3 and Untreat, thus confirming in this case the contribution of Fe and Zn to cone growth [2].

3.9.3. HPLC-UV Analysis and Essential Oil

In Table 7 the best performance in alpha and beta acid production (6.98% of alpha acids and 6.37% beta acids) is shown for Treat 2, the treatment with the highest amount of N supplied (Table 1); the lowest quantity of alpha acids was registered for Treat 4 and Untreat (5.08% and 4.32%) (Table 7), that are the treatments with the lowest amounts of N supplied. This data was not in accordance with the study of Iskra et al. [7], who observed a reduction of alpha acids with the increase of nitrogen. Their data can be explained by the fact that in their study [7] N was supplied directly in soil through irrigation four times during the growing season, thus giving an excess quantity of nitrogen that caused a reduction of alpha acid synthesis, probably in favor of the vegetative (and cone) growth as explained by Neve [1]. In our study, in Treat 2 that reached the highest alpha acid production (6.98%), N was given only in the first part of the experiment, when plants were in the vegetative stage and not yet in the reproductive stage. The second step of fertilization (t2) of Treat 2, instead, contained the highest amount of Mn, Fe, Cu and B, which determined the highest productivity, as was shown in a study by Milosta and Regilevich [52]. Untreat showed the lowest content of bitter acids, thus demonstrating the importance of fertilization for an optimal production.
The essential oil yield was highest in Treat 2, with 1.78%, and the lowest in Untreat (1.07%) (Table 7). Treat 2 was the treatment in which microelements were added only in t2 (Table 1). This result showed that the introduction of micro-elements in the fertilization plan is important, especially in the second part of hop growth, since they are likely involved in the biosynthesis of the essential oils. In a study on the effect of foliar fertilization on thyme [53], it was observed a positive influence of P on essential oil yield; this result is not supported by our study, because P was given to plants only in t2, in Treat 1 and Treat 3; instead, Treat 2 was the only treatment that did not involve P in the fertilization plan. This means, that hop essential oil production is likely to be more influenced by several microelements.

4. Conclusions

From the micro- and macro-elements point of view, most results appear to be related to the fertilizer used, and from the leaf analysis it was possible to observe the incidence of time and fertilization plans on all element quantities. The anatomical measurements showed differences in leaf structure and glandular trichome density and shape, as well as the presence of cystoliths that could influence leaf functionality. The physiological measurements show us the effect of the different fertilization plans on chlorophyll, carotenoids and photosynthetic activity, as well as differences in color and texture. The texture of leaves appears to be related to plant health and productivity, hence the higher force for leaf rupture was needed for Treat 2 leaves. Concluding, all the tested treatments showed differences in the various characters studied, from chlorophyll content to cone production, to bitter acid content. This study allowed us to determine the most useful combination of elements for hop cultivation in a loamy clay soil, rich in mineral substances. In this case, Treat 2 was the treatment that showed the best results in terms of hop cone yields, but also in bitter acids and essential oil content. This study demonstrated that soluble organic fertilizers supplied with foliar treatments during hop growth could achieve good results in terms of cone quality and quantity, and proved the importance of customizing the fertilization plan in view of the agronomic requirements.
Further studies are necessary to deepen our knowledge of hop reproductive physiology, determining the effect of the different fertilization schemes on the secondary metabolism of aromatic substances present in hop essential oils.

Supplementary Materials

The following are available online at https://www.mdpi.com/article/10.3390/app11156778/s1, Figure S1: soil analysis; Figure S2: Longitudinal (Long) and transversal (Trasv) growth of the hop cones sampled in the different data acquisition time.

Author Contributions

M.R. (Margherita Rodolfi) contributed project development, performed the chemical analysis, statistical analysis and interpreted the results and contribute to the first and final draft of the manuscript. L.B. performed the leaf analysis, statistical analysis and interpreted the results. C.G. performed the anatomical analysis of leaves with SEM microscope, the statistical analysis and interpreted the results. M.R. (Massimiliano Rinaldi) performed the physical analysis, and interpreted the results. A.F. contribute to manuscript writing. L.P. contribute to the final draft of the paper. R.C. performed the physical analysis on field and analyzed the results, D.B. contributed to the sample preparation. R.P. contributed to the anatomical analysis and the samples preparation. T.G. planned the project concept and performed the anatomical analysis of leaves by light microscope, the statistical analysis and results interpretation. All authors have read and agreed to the published version of the manuscript.

Funding

This research received no external funding.

Acknowledgments

A special thanks to Caprara S.r.l. in the person of Claudio Montanari for kindly supplying the fertilizers used in the experiment. We would like to thank the farmers, the Lucchi brothers (Ludovico and Eugenio), for their commitment throughout the project.

Conflicts of Interest

The authors declare no conflict of interest.

References

  1. Neve, R.A. Hops; Chapman and Hall: London, UK, 1991. [Google Scholar]
  2. Gingrich, G.; Hart, J.; Christensen, N. Hops; Oregon State University, Extension Service: Corvallis, OR, USA, 1994. [Google Scholar]
  3. Sete, P.B.; Comin, J.J.; Ciotta, M.N.; Salume, J.A.; Thewes, F.; Brackmann, A.; Toselli, M.; Nava, G.; Rozane, D.E.; Loss, A.; et al. Nitrogen Fertilization Affects Yield and Fruit Quality in Pear. Sci. Hortic. (Amsterdam) 2019, 258, 108782. [Google Scholar] [CrossRef]
  4. Morais, M.C.; Aires, A.; Barreales, D.; Rodrigues, M.Â.; Ribeiro, A.C.; Gonçalves, B.; Silva, A.P. Combined Soil and Foliar Nitrogen Fertilization Effects on Rainfed Almond Tree Performance; Springer: Berlin/Heidelberg, Germany, 2020; Volume 20, pp. 2552–2565. [Google Scholar] [CrossRef]
  5. Daane, K.M.; Johnson, R.S.; Michailides, T.J.; Crisosto, C.H.; Dlott, J.W.; Ramirez, H.T.; Yokota, G.Y.; Morgan, D.P. Excess Nitrogen Raises Nectarine Susceptibility to Disease and Insects. Calif. Agric. 1995, 49, 13–18. [Google Scholar] [CrossRef] [Green Version]
  6. Peng, S.; Buresh, R.J.; Huang, J.; Zhong, X.; Zou, Y.; Yang, J.; Wang, G.; Liu, Y.; Hu, R.; Tang, Q.; et al. Improving Nitrogen Fertilization in Rice by Site-Specific N Management. A Review. Agron. Sustain. Dev. 2010, 30, 649–656. [Google Scholar] [CrossRef]
  7. Iskra, A.E.; Lafontaine, S.R.; Trippe, K.M.; Massie, S.T.; Phillips, C.L.; Twomey, M.C.; Shellhammer, T.H.; Gent, D.H. Influence of Nitrogen Fertility Practices on Hop Cone Quality. J. Am. Soc. Brew. Chem. 2019, 77, 199–209. [Google Scholar] [CrossRef]
  8. Cochran, D.; Senske, A. Evaluating the Effects of Nitrogen Fertilization on Hop Yield; Iowa State University Research and Demonstration Farms Progress Reports; Iowa State University: Ames, IA, USA, 2019; Volume 2018. [Google Scholar]
  9. Gent, D.H.; Sirrine, J.R.; Darby, H.M.; O’Neal, S.D.; Walsh, D.B. Nutrient management and imbalances. In Field Guide for Integrated Pest Management in Hops, 3rd ed.; Hop Industry Plant Protection Committee: Pullman, WA, USA, 2015; pp. 98–100. [Google Scholar]
  10. Oerke, E.-C.; Schönbeck, F. Effect of Nitrogen and Powdery Mildew on the Yield Formation of Two Winter Barley Cultivars. J. Phytopathol. 1990, 130, 89–104. [Google Scholar] [CrossRef]
  11. Veromann, E.; Toome, M.; Kännaste, A.; Kaasik, R.; Copolovici, L.; Flink, J.; Kovács, G.; Narits, L.; Luik, A.; Niinemets, Ü. Effects of Nitrogen Fertilization on Insect Pests, Their Parasitoids, Plant Diseases and Volatile Organic Compounds in Brassica Napus. Crop. Prot 2013, 43, 79–88. [Google Scholar] [CrossRef]
  12. Chen, Y.; Opit, G.; Williams, K.A. Twospotted Spider Mite Population Level, Distribution, and Damage on Ivy Geranium in Response to Different Nitrogen and Phosphorus Fertilization Regimes Evaluation of the Suitability and Optimal Use of Post-Harvest Storage Technologies for Maize Farmers in Nigeria View Project Phosphine Resistance Management in Stored-Product Insects View Project. Artic. J. Econ. Entomol. 2008. [Google Scholar] [CrossRef]
  13. Rogério, F.; da Silva, T.R.B.; dos Santos, J.I.; Poletine, J.P. Phosphorus Fertilization Influences Grain Yield and Oil Content in Crambe. Ind. Crops Prod. 2013, 41, 266–268. [Google Scholar] [CrossRef]
  14. Lipecki, J.; Berbec, S. Soil Management in Perennial Crops: Orchards and Hop Gardens. Soil Tillage Res. 1997, 43, 169–184. [Google Scholar] [CrossRef]
  15. Chen, Y.-F.; Wang, Y.; Wu, W.-H. Membrane Transporters for Nitrogen, Phosphate and Potassium Uptake in Plants. J. Integr. Plant Biol. 2008, 50, 835–848. [Google Scholar] [CrossRef] [PubMed]
  16. Perrenoud, S. Potassium and Plant Health; International Potash Institute: Bern, Germany, 1977. [Google Scholar]
  17. Barker, A.V.; Pilbeam, D.J. Handbook of Plant Nutrition; Handbook of Plant Nutritioneds; CRC Press: Boca Raton, FL, USA, 2015. [Google Scholar]
  18. Ahmad, Z.; Anjum, S.; Waraich, E.A.; Ayub, M.A.; Ahmad, T.; Tariq, R.M.S.; Ahmad, R.; Iqbal, M.A. Growth, Physiology, and Biochemical Activities of Plant Responses with Foliar Potassium Application under Drought Stress—A Review. J. Plant Nutr. 2018, 41, 1734–1743. [Google Scholar] [CrossRef]
  19. Onofrei, V.; Burducea, M.; Lobiuc, A.; Teliban, G.C.; Ranghiuc, G.; Robu, T. Influence of Organic Foliar Fertilization on Antioxidant Activity and Content of Polyphenols in Ocimum Basilicum L. Acta Pol. Pharm. 2017, 74, 611–615. [Google Scholar] [PubMed]
  20. Pinciroli, M.; Domínguez-Perles, R.; Abellán, Á.; Bultel-Poncé, V.; Durand, T.; Galano, J.M.; Ferreres, F.; Gil-Izquierdo, A. Statement of Foliar Fertilization Impact on Yield, Composition, and Oxidative Biomarkers in Rice. J. Agric. Food Chem. 2019, 67, 597–605. [Google Scholar] [CrossRef] [Green Version]
  21. Mäder, P.; Fliessbach, A.; Dubois, D.; Gunst, L.; Fried, P.; Niggli, U. Soil Fertility and Biodiversity in Organic Farming. Science 2002, 296, 1694–1697. [Google Scholar] [CrossRef] [Green Version]
  22. De Keukeleire, J.; Janssens, I.; Heyerick, A.; Ghekiere, G.; Cambie, J.; Roldán-Ruiz, I.; Van Bockstaele, E.; De Keukeleire, D. Relevance of Organic Farming and Effect of Climatological Conditions on the Formation of α-Acids, β-Acids, Desmethylxanthohumol, and Xanthohumol in Hop (Humulus Lupulus L.). J. Agric. Food Chem. 2007, 55, 61–66. [Google Scholar] [CrossRef]
  23. Ruzin, S.E. Plant Microtechnique and Microscopy; Oxford University Press: New York, NY, USA, 1999; Volume 198. [Google Scholar]
  24. Dere, Ş.; Güneş, T.; Sivaci, R. Spectrophotometric Determination of Chlorophyll-A, B and Total Carotenoid Contents of Some Algae Species Using Different Solvents. Sci. Technol. Res. Counc. Turk. 1998, 22, 13–18. [Google Scholar]
  25. Rinaldi, M.; Littardi, P.; Ganino, T.; Cocconi, E.; Barbanti, D.; Rodolfi, M.; Chiavaro, E. Impact of Ohmic Heating and High Pressure Processing on Qualitative Attributes of Ohmic Treated Peach Cubes in Syrup. Foods 2020, 9, 1093. [Google Scholar] [CrossRef]
  26. AOAC International. Guidelines for Dietary Supplements and Botanicals–PART I AOAC Guidelines for Single-Laboratory Validation of Chemical Methods for Dietary Supplements and Botanicals; AOAC Official Methods of Analysis; AOAC International: Rockville, MD, USA, 2013. [Google Scholar]
  27. Paciulli, M.; Ganino, T.; Meza, I.G.M.; Rinaldi, M.; Rodolfi, M.; Morbarigazzi, M.; Chiavaro, E. High Pressure and Thermal Processing on the Quality of Zucchini Slices. Eur. Food Res. Technol. 2021, 247, 475–484. [Google Scholar] [CrossRef]
  28. Paciulli, M.; Gabriela, I.; Meza, M.; Rinaldi, M.; Ganino, T.; Pugliese, A.; Rodolfi, M.; Barbanti, D.; Morbarigazzi, M.; Chiavaro, E. Improved Physicochemical and Structural Properties of Blueberries by High Hydrostatic Pressure Processing. Foods 2019, 8, 272. [Google Scholar] [CrossRef] [PubMed] [Green Version]
  29. Feller, C. The BBCH System to Coding the Phenological Growth Stages of Plants-History and Publications. J. Kult. 2009, 61, 41–52. [Google Scholar] [CrossRef]
  30. Mongelli, A.; Rodolfi, M.; Ganino, T.; Marieschi, M.; Dall’Asta, C.; Bruni, R. Italian Hop Germplasm: Characterization of Wild Humulus Lupulus L. Genotypes from Northern Italy by Means of Phytochemical, Morphological Traits and Multivariate Data Analysis. Ind. Crops Prod. 2015, 70, 16–27. [Google Scholar] [CrossRef]
  31. Rodolfi, M.; Chiancone, B.; Liberatore, C.M.; Fabbri, A.; Cirlini, M.; Ganino, T. Changes in Chemical Profile of Cascade Hop Cones According to the Growing Area. J. Sci. Food Agric. 2019, 99, 6011–6019. [Google Scholar] [CrossRef] [PubMed]
  32. Mongelli, A.; Rodolfi, M.; Ganino, T.; Marieschi, M.; Caligiani, A.; Dall’Asta, C.; Bruni, R. Are Humulus Lupulus L. Ecotypes and Cultivars Suitable for the Cultivation of Aromatic Hop in Italy? A Phytochemical Approach. Ind. Crops Prod. 2016, 83, 693–700. [Google Scholar] [CrossRef]
  33. Wang, Z.; Hassan, M.U.; Nadeem, F.; Wu, L.; Zhang, F.; Li, X. Magnesium Fertilization Improves Crop Yield in Most Production Systems: A Meta-Analysis. Front. Plant Sci. 2020, 10, 1727. [Google Scholar] [CrossRef] [PubMed] [Green Version]
  34. Murphy, L.S.; Ellis, R., Jr.; Adriano, D.C. Phosphorus-Micronutrient Interaction Effects on Crop Production. J. Plant Nutr. 1981, 3, 593–613. [Google Scholar] [CrossRef]
  35. Jakobsen, S.T. Interaction between Plant Nutrients Iv. Interaction between Calcium and Phosphate. Acta Agric. Scand. Sect. B Soil Plant Sci. 1993, 43, 6–10. [Google Scholar] [CrossRef]
  36. Jauset, A.M.; Sarasúa, M.J.; Avilla, J.; Albajes, R. Effect of Nitrogen Fertilization Level Applied to Tomato on the Greenhouse Whitefly. Crop. Prot. 2000, 19, 255–261. [Google Scholar] [CrossRef]
  37. Hu, W.; Lu, Z.; Meng, F.; Li, X.; Cong, R.; Ren, T.; Sharkey, T.D.; Lu, J. The Reduction in Leaf Area Precedes That in Photosynthesis under Potassium Deficiency: The Importance of Leaf Anatomy. New Phytol. 2020, 227, 1749–1763. [Google Scholar] [CrossRef]
  38. Sugiyama, R.; Oda, H.; Kurosaki, F. Two Distinct Phases of Glandular Trichome Development in Hop (Humulus Lupulus L.). Plant Biotechnol. 2006, 23, 493–496. [Google Scholar] [CrossRef] [Green Version]
  39. Dayanandan, P.K. Trichomes of Cannabis Sativa L. (Cannabaceae). Am. J. Bot. 1976, 63, 578–591. [Google Scholar] [CrossRef] [Green Version]
  40. Castro, E.D.; Pereira, F.J.; Paiva, R. Histologia Vegetal: Estrutura e Função de Órgãos Vegetativos; Lavras UFLA, Ed.; Lavras UFLA: Lavras, Brazil, 2009. [Google Scholar]
  41. Setoguchi, H.; Okazaki, M.; Suga, S. Calcification in Higher Plants with Special Reference to Cystoliths. In Origin, Evolution, and Modern Aspects of Biomineralization in Plants and Animals; Springer US: New York, NY, USA, 1989; pp. 409–418. [Google Scholar]
  42. Gal, A.; Hirsch, A.; Siegel, S.; Li, C.; Aichmayer, B.; Politi, Y.; Fratzl, P.; Weiner, S.; Addadi, L. Plant Cystoliths: A Complex Functional Biocomposite of Four Distinct Silica and Amorphous Calcium Carbonate Phases. Chem. A Eur. J. 2012, 18, 10262–10270. [Google Scholar] [CrossRef]
  43. Bojović, B.; Stojanović, A. Chlorophyll and Carotenoid Content in Wheat Cultivars as a Function of Mineral Nutrition. Arch. Biol. Sci. 2005, 57, 283–290. [Google Scholar] [CrossRef]
  44. Cendrero-Mateo, M.P.; Moran, M.S.; Papuga, S.A.; Thorp, K.R.; Alonso, L.; Moreno, J.; Ponce-Campos, G.; Rascher, U.; Wang, G. Plant Chlorophyll Fluorescence: Active and Passive Measurements at Canopy and Leaf Scales with Different Nitrogen Treatments. J. Exp. Bot. 2016, 67, 275–286. [Google Scholar] [CrossRef] [Green Version]
  45. Dellero, Y.; Jossier, M.; Bouchereau, A.; Hodges, M.; Leport, L. Leaf Phenological Stages of Winter Oilseed Rape (Brassica Napus L.) Have Conserved Photosynthetic Efficiencies but Contrasted Intrinsic Water Use Efficiencies. Front. Plant Sci. 2021, 12, 12. [Google Scholar] [CrossRef] [PubMed]
  46. Coria-Cayupán, Y.S.; De Pinto, M.I.S.; Nazareno, M.A. Variations in Bioactive Substance Contents and Crop Yields of Lettuce (Lactuca Sativa L.) Cultivated in Soils with Different Fertilization Treatments. J. Agric. Food Chem. 2009, 57, 10122–10129. [Google Scholar] [CrossRef] [PubMed]
  47. Yadav, A.; Kanwar, J.; Dubey, R.; Upadhyay, M. Effect of Foliar Application of Urea, Zinc Sulphate and Borax on Flowering, Fruiting and Yield of Acid Lime (Citrus Aurantifolia Swingle) Vari. Kagzi Lime under Malwa Plateau Conditions. J. Pharmacogn. Phytochem. 2020, 9, 483–485. [Google Scholar]
  48. Fernández, V.; Del Río, V.; Pumariño, L.; Igartua, E.; Abadía, J.; Abadía, A. Foliar Fertilization of Peach (Prunus Persica L.) Batsch) with Different Iron Formulations: Effects on Re-Greening, Iron Concentration and Mineral Composition in Treated and Untreated Leaf Surfaces. Sci. Hortic. (Amsterdam) 2008, 117, 241–248. [Google Scholar] [CrossRef] [Green Version]
  49. Errez-Rodríguez, E.G.; Lieth, H.J.; Jernstedt, J.A.; Labavitch, J.M.; Suslow, T.V.; Cantwell, M.I. Texture, Composition and Anatomy of Spinach Leaves in Relation to Nitrogen Fertilization. J. Sci. Food Agric. 2013, 93, 227–237. [Google Scholar] [CrossRef] [PubMed]
  50. Onofrei, V.; Teliban, G.C.; Burducea, M.; Lobiuc, A.; Sandu, C.B.; Tocai, M.; Robu, T. 2017 Organic Foliar Fertilization Increases Polyphenol Content of Calendula Officinalis L. Ind. Crops Prod. 2017, 109, 509–513. [Google Scholar] [CrossRef]
  51. Grant, C.A.; Flaten, D.N.; Tomasiewicz, D.J.; Sheppard, S.C. The Importance of Early Season Phosphorus Nutrition. Can. J. Plant Sci. 2001, 81, 211–224. [Google Scholar] [CrossRef]
  52. Milosta, G.M.; Regilevich, A.A. Dependence of Hop (Humulus Sp.) Productivity on Boric, Cupric and Zinc Microfertilizers. In Proceedings of the Sel’skoe Khozyajstvo-Problemy i Perspektivy: Sbornik Nauchnykh Trudov v Dvukh Tomakh, Minsk, Belarus; 2007. Available online: https://agris.fao.org/agris-search/search.do?recordID=BY2008000320 (accessed on 16 June 2021).
  53. Pavela, R.; Žabka, M.; Vrchotová, N.; Tříska, J. Effect of Foliar Nutrition on the Essential Oil Yield of Thyme (Thymus Vulgaris L.). Ind. Crops Prod. 2018, 112, 762–765. [Google Scholar] [CrossRef]
Figure 1. Transversal section of hop leaf cv. Cascade stained with PAS-Amido Black. (A) Untreat; (B) Treat 2. Legends: ue = upper epidermis; pt = palisade tissue; sp = spongy tissue; le = lower epidermis; c = cuticle thickness.
Applsci 11 06778 g001
Figure 2. Scanning electron micrographs of hop leaves: (a) stomata of untreated leaf in t1; (b) stomata of Treat 3 leaf in t1; (c) lupulin gland, a large peltate glandular trichome; (d) stalked capitate glands (black arrow) and slender non glandular trichome (black triangle), both on the midrib; (e) cystolith-containing hairs; (f) a section of leaf where is evident the intracellular mineralized inclusion at the base of the trichome (cystolith).
Applsci 11 06778 g002
Figure 3. Measurements of chlorophyll contents using different instrumentation. (A) Chlorophyll measured with atLeaf; (B) measurements of photosynthetic efficiency using HandyPea photometer; (C,D) Measurements of chlorophyll a (ChlA)and b (ChlB) and carotenoids (Car) in t1 (C) and t2 (D) by spectrophotometer. Different letters indicate statistical differences at p < 0.05 with Tukey’s test; lowercase letters are used for t1 results and capital letters are used for t2 results.
Applsci 11 06778 g003
Figure 4. Color parameters of leaves in (A) t1 and (B) t2. Different letters indicate statistical differences at p < 0.05 with Tukey’s test.
Applsci 11 06778 g004
Figure 5. Percent of dry weight in hop leaves in each treatment at the two times (t1 and t2). Different letters indicate significant differences (p < 0.05). Lowercase letters are used for t1 results, and capital letters are used for t2 results.
Applsci 11 06778 g005
Figure 6. Leaf hardness in each treatment at two times (t1 and t2). Different letters indicate significant differences (p < 0.05). Lowercase letter are used for t1 results and capital letter are used for t2 results.
Applsci 11 06778 g006
Figure 7. Total antioxidant capacity of hop leaf samples in each treatment at the two times (t1 and t2). Means followed by different capital or lowercase letters significantly differ (p < 0.05) among the samples at the same time. Lowercase letters are used for t1 results, and capital letters are used for t2 results.
Applsci 11 06778 g007
Table 1. Total macro and microelements (g/ha) included in each nutrient mixture per period and treatment. For each period (t1 and t2), three treatments were carried out.
PeriodTreatmentN org.P2O5K2OMg ChelZn SolubZn ChelMn SolubMn ChelFe SolubFe Chel.Cu SolubCu ChelB SolubMo Solub
t1Treat 130-570-45451201201201204545153
Treat 216.230-570-----------
Treat 316.080-16.770-2121--1.9501.950----
Treat 416.080-16.200-66661201202.0702.0704545153
t2Treat 1-1.1251.500360--------1515
Treat 2---27045451201201201204545153
Treat 3-3.6002.400180----------
Treat 4--570---------330-
Table 2. Macro- and meso-elements composition of leaves at the two sampling dates. In column and for each period, different letters indicate significant differences (p < 0.05).
TimeTN (g/kg)P (g/kg)K (g/kg)Mg (g/kg)Ca (g/kg)S (g/kg)
t1Treat 129.78 ± 2.05 c1.41 ± 0.07 b8.00 ± 0.07 a3.56 ± 0.15 b22.67 ± 5.07 a1.48 ± 0.13 c
Treat 239.58 ± 2.34 a1.44 ± 0.01 b7.93 ± 0.08 a4.80 ± 0.37 ab28.40 ± 1.53 a2.08 ± 0.20 b
Treat 333.62 ± 2.16 bc1.60 ± 0.07 ab7.90 ± 0.25 a6.60 ± 1.21 a30.13 ± 2.50 a1.91 ± 0.18 b
Treat 436.84 ± 3.32 ab1.78 ± 0.16 a7.95 ± 0.01 a6.25 ± 1.32 ab30.45 ± 5.60 a2.67 ± 0.24 a
Untreat37.91 ± 2.56 ab1.39 ± 0.16 b7.93 ± 0.05 a5.42 ± 0.83 ab33.36 ± 5.06 a1.90 ± 0.12 bc
t2Treat 127.55 ± 1.39 b1.70 ± 0.21 b7.45 ± 0.25 a5.72 ± 1.22 b30.96 ± 5.24 b2.03 ± 0.14 a
Treat 235.14 ± 0.86 a1.50 ± 0.01 b7.20 ± 0.29 a7.89 ± 0.96 ab39.84 ± 4.80 ab2.31 ± 0.17 a
Treat 334.00 ± 2.06 a2.06 ± 0.06 a7.35 ± 0.33 a7.46 ± 0.38 ab37.36 ± 0.94 ab2.12 ± 0.18 a
Treat 433.81 ± 0.74 a1.69 ± 0.08 b6.88 ± 0.39 a9.07 ± 0.99 a42.61 ± 4.08 ab2.36 ± 0.19 a
Untreat35.17 ± 1.62 a1.41 ± 0.07 b6.76 ± 0.09 a9.7 ± 0.12 a45.44 ± 3.60 a2.15 ± 0.16 a
Table 3. Micro- elements composition at the two sampling date. In column and for each period, different letters indicate significant differences (p < 0.05).
TimeTreatmentBZnFeMn
t1Treat 165.04 ± 4.66 b113.17 ± 22.51 c218.27 ± 25.44 a60.61 ± 10.45 a
Treat 266.96 ± 5.03 b137.92 ± 18.02 bc151.31 ± 17.70 bc43.65 ± 1.72 a
Treat 377.01 ± 6.70 b173.47 ± 19.22 b129.20 ± 3.15 c40.40 ± 2.40 a
Treat 4112.80 ± 5.80 a246.08 ± 23.11 a186.69 ± 14.69 ab54.48 ± 5.446 a
Untreat79.23 ± 11.84 b124.69 ± b5.17 c114.51 ± 2.77 c32.27 ± 1.33 a
t2Treat 1116.45 ± 4.34 ab49.31 ± 9.55 bc145.87 ± 11.23 a58.93 ± 11.11 b
Treat 2106.24 ± 5.30 b70.88 ± 3.28 a142.05 ± 13.62 a93.97 ± 9.62 a
Treat 3107.15 ± 8.21 b65.49 ± 8.92 ab118.00 ± 10.33 b39.49 ± 7.33 b
Treat 4130.56 ± 4.65 a76.77 ± 7.03 a143.87 ± 5.00 a45.04 ± 10.99 b
Untreat106.56 ± 7.24 b45.79 ± 4.70 c98.96 ± 3.64 b48.45 ± 5.02 b
Table 4. Anatomical characteristics of hop leaves for each fertilizer plan. In rows, different letters indicate statistical differences at p < 005 with Tukey’s test.
UntreatTreat 1Treat 2Treat 3Treat 4
Upper epidermis cuticle thickness (μm) 2.47 ± 0.61 c2.26 ± 0.97 c7.46 ± 1.08 a3.90 ± 0.59 b4.71 ± 0.90 b
Longitudinal diameter of upper epidermis cells (μm)32.68 ± 1.41 a32.75 ± 1.61 a21.16 ± 0.81 c26.82 ± 1.77 b27.22 ± 0.62 b
Transversal diameter of upper epidermis cells (μm)15.48 ± 0.99 a15.61 ± 0.70 a17.61 ± 0.78 a16.81 ± 0.48 a14.05 ± 0.41 b
% Palisade tissue76.44 ± 2.02 a77.15 ± 3.45 a59.36 ± 2.14 c67.82 ± 2.58 b72.42 ± 4.54 ab
% Spongy tissue23.55 ± 1.87 c22.85 ± 2.01 c40.63 ± 1.98 a32.18 ± 3.24 b27.58 ± 3.57 bc
Longitudinal diameter of lower epidermis cells (μm)11.28 ± 0.98 b15.32 ± 2.62 a15.85 ± 1.81 a12.30 ± 1.12 b14.40 ± 1.21 ab
Transversal diameter of lower epidermis cells (μm)12.03 ± 1.02 a12.28 ± 1.01 a11.82 ± 0.88 a10.27 ± 1.06 a10.22 ± 1.11 a
Lower epidermal cuticle thickness (μm)2.43 ± 0.61 b2.39 ± 0.48 b6.81 ± 0.89 a2.05 ± 0.41 b2.31 ± 0.91 b
Table 5. Characteristics of hop foliar features after each treatment at each time. In column and for each parameter, different letters indicate significant differences (p < 0.05).
Time UntreatTreat 1Treat 2Treat 3Treat 4
t1SD (number/mm2) 671.64 ± 40 b689.55 ± 33 b776.12 ± 35 ab794.03 ± 35 a719.4 ± 31 ab
PD (μm) 19.4 ± 1.6 a17.7 ± 2.2 b18.4 ± 1.7 ab19.7 ± 2.1 a19.9 ± 1.6 a
ED (μm) 11.2 ± 1.0 ab10.3 ± 1.3 c10.6 ± 1.2 bc10.0 ± 0.8 c11.8 ± 1 a
Ratio PD/ED 1.74 ± 0.23 b1.75 ± 0.31 b1.76 ± 0.27 ab1.97 ± 0.18 a1.69 ± 0.18 b
TD (number mm2) 2.0 ± 0.22 a2.27 ± 0.20 a1.93 ± 0.10 a2.06 ± 0.17 a1.93 ± 0.10 a
NTD (number mm2)12.7 ± 0.81 a10.04 ± 0.63 b10.04 ± 0.42 b12.85 ± 0.51 a8.86 ± 0.75 b
t2SD (number/mm2) 674.63 ± 32.5 ab710.45 ± 29.7 ab728.36 ± 27.5 a662.69 ± 32.5 b567.16 ± 23 c
PD (μm) 18.1 ± 2.6 ab16.4 ± 2.3 b18.5 ± 2.6 a17.7 ± 2.0 ab18.7 ± 1.8 a
ED (μm) 9.52 ± 1.2 b9.32 ± 1.3 b10.6 ± 1.4 a10.9 ± 1.2 a11.4 ± 1.0 a
Ratio PD/ED 1.93 ± 0.38 a1.78 ± 0.32 ab1.77 ± 0.35 ab1.66 ± 0.30 b1.65 ± 0.22 b
TD (number mm2) 1.98 ± 0.15 a1.67 ± 0.12 ab1.36 ± 0.20 b1.64 ± 0.16 b1.32 ± 0.25 b
NTD (number mm2) 10.63 ± 0.55 b16.84 ± 0.69 a10.87 ± 0.87 b10.93 ± 0.71 b7.68 ± 0.43 c
Abbreviations: SD: Stomatal Density; PD: Stomatal Polar Diameter; ED: Stomatal Equatorial Diameter; TD Glandular Trichomes Density; NTD: Non-Glandular Trichomes density.
Table 6. Fresh cone yield in the different fertilization treatments. Values followed by the same letter indicate no significant differences (p < 0.05).
TreatmentFresh Weight
(Kg/Plant)
Treat 12.48 ± 0.482 b
Treat 23.55 ± 0.323 a
Treat 32.20 ± 0.404 b
Treat 43.03 ± 0.112 ab
Untreat2.42 ± 0.275 b
Table 7. Bitter acids (α- and β-acids) contents (% w/w) on dry weight, cohumulone (COH) % on the total of alpha acids, and essential oil yield % v/w. Values followed by the same letter indicate no significant difference (p < 0.05).
Treatmentα-Acids %β-Acids %COH %Ess. Oil Yield %
Treat 15.83 ± 0.38 b4.92 ± 0.52 b26.74 ± 0.50 a1.43 ± 0.06 b
Treat 26.98 ± 0.31 a6.37 ± 0.11 a26.77 ± 0.12 a1.78 ± 0.09 a
Treat 35.84 ± 0.64 b5.30 ± 0.18 b26.14 ± 0.42 a1.46 ± 0.17 b
Treat 45.08 ± 0.06 bc5.05 ± 0.16 b26.17 ± 0.38 a1.34 ± 0.06 b
Untreat4.32 ± 0.27 c5.33 ± 0.24 b26.19 ± 0.53 a1.07 ± 0.07 c
Publisher’s Note: MDPI stays neutral with regard to jurisdictional claims in published maps and institutional affiliations.

