Article

Method for Calculating of Lightning Impact Level on Overhead Transmission Line

by
Anton Vladimirovich Burtsev
* and
Vasily Nikolaevich Selivanov
Energetics Research Centre-Branch of the Federal Research Centre–Kola Science Centre of the Russian Academy of Sciences, Fersmana 14, 184209 Apatity, Russia
*
Author to whom correspondence should be addressed.
Appl. Sci. 2021, 11(14), 6609; https://doi.org/10.3390/app11146609
Submission received: 9 June 2021 / Revised: 13 July 2021 / Accepted: 15 July 2021 / Published: 19 July 2021
(This article belongs to the Topic Power Distribution Systems)

Abstract

:

Featured Application

This study can be applied in the energy industry to calculate the lightning impact level of overhead lines.

Abstract

This paper proposes a simple method for calculating the lightning impact level on overhead transmission power lines, taking into account its entire length. The method uses lightning historical data and the geographic coordinates of power line towers. It is based on calculating the distances between both arrays of lightning and of towers. The method has been tested on overhead lines in the Murmansk region of the Russian Federation and can be applied to any overhead line if a lightning dataset in the overhead line area is available. This study is useful for electric power suppliers because it provides valuable information about the most lightning-prone sections of overhead power lines. The method can also be beneficial to people selecting the optimal route (least amount of lightning strikes) for power transmission lines based on lightning density.

1. Introduction

Stability of power supply to the consumer requires increasing the resistance of power lines to the effects of lightning overvoltages. Many climatic conditions must be taken into account, including lightning intensity, when calculating the parameters of power lines. At present, in Russia, the assessment of the lightning impact level on power lines is regulated by the document “The Electrical Installation Rules” [1]. It presents lightning density maps built more than 30 years ago based on visual observations of lightning and thunder. At the same time, in world practice, accurate maps of lightning density and thunderstorm days are used for a long time, as obtained by the instrumental method. In [2], the authors use lightning data obtained by ground-based lightning detection instruments denoted CIGRE-500 and CGR3 and by NASA satellite-based instruments denoted OTD and LIS. Studies [3,4] were carried out using a network operated by Météorage, which consists of Lightning Location and Protection type sensors that use the Direction Finder method to locate lightning. For example, Mäkelä et al. [5] proposed to determine the number of discharges per day in 20 × 20 km cells, which corresponds approximately to the human observing area for visual observations of lightning and thunder and to the area of a typical thunderstorm. Nevertheless, Russian researchers also analyze lightning activity using modern methods. Vaisala LS8000 network deployed in the North Caucasus is used to track thunderstorms [6]. A study of thunderstorm activity in Yakutia used the World Wide Lightning Location Network [7]. When lightning was detected over the southeastern territory of Western Siberia, a Boltek LD-250 single-point lightning detector was used [8]. However, “The Electrical Installation Rules,” which is the main regulatory document in the field of electrical installations, unfortunately, is not updated in accordance with the lightning data obtained.
In some cases, a buffer area or corridor is used to calculate the impacts of lightning on overhead transmission lines (OHTLs). Usually, the width of the corridor ranges from a few hundred meters to a few kilometers. For example, in [9], a map plot was obtained with a corridor of 9 km on each side of the line. It notes that lightning discharges beyond this distance no longer affect OHTL. There it is also suggested that the chosen corridor width corresponds to the margin of error from the lightning detection system (LDS) while providing the data, which seems a too large value for the LDS. The constructed corridor also uses square cells, visually larger than 20 km × 20 km. In [10], a method of constructing a lightning density map along the overhead line route during long-term lightning registration is proposed. The study area is divided into 5 km × 5 km cells, the size of which is conditioned by the accumulation of a sufficient number of discharges (100–150) in the cell over a five-year observation period. To determine the lightning density in the OHTL area, grid cells crossing the overhead line route and located near the route at a distance of less than 1/5 of the length of the grid cell side are used.
As a rule, in various calculations for power lines, the ground flash density Ng is used. For example, [11] gives an overview of techniques to estimate flash incidence to a line over ground.
All these studies using the strokes’ densities provide approximate information about the expected impact on the power line, but they do not provide information about the flash incidence of specific sections and towers of the power line. For example, different cell sizes from 5 km to more than 20 km are used, while the span between the transmission towers of high voltage class overhead lines usually reaches only a few hundred meters; or uncoordinated distances are used to determine the buffer distance. At the same time, information about lightning strikes along the entire length of power lines is required for electrical lineman of energy companies and utility companies in order to identify sections that require special control [12]. Thus, there is currently no simple tool to assess the level of lightning impact on OHTLs along their entire length.
Despite the importance of lightning density maps for estimating lightning incidence to power lines in general, we wish to devise a measure of the average annual lightning impact intensity along the entire length of the overhead line, taking into account the lightning discharges that actually occurred over a long period. To do this, the study used raw data from the LDS and the coordinates of the transmission towers.
The purpose of this work is to show a simple method for assessing the lightning’s impact on overhead power lines along their entire length, using lightning historical data in recent years, by the example of the Murmansk region of the Russian Federation. The method shows the importance of the buffer area for assessing the level of lightning impact on a power line along its full length. The proposed method has been tested on 200 OHTLs located at the territory of the Kola Peninsula of the Arctic Zone of the Russian Federation. The majority of overhead lines have the most frequently affected areas identified.

2. Materials and Methods

2.1. Math Function

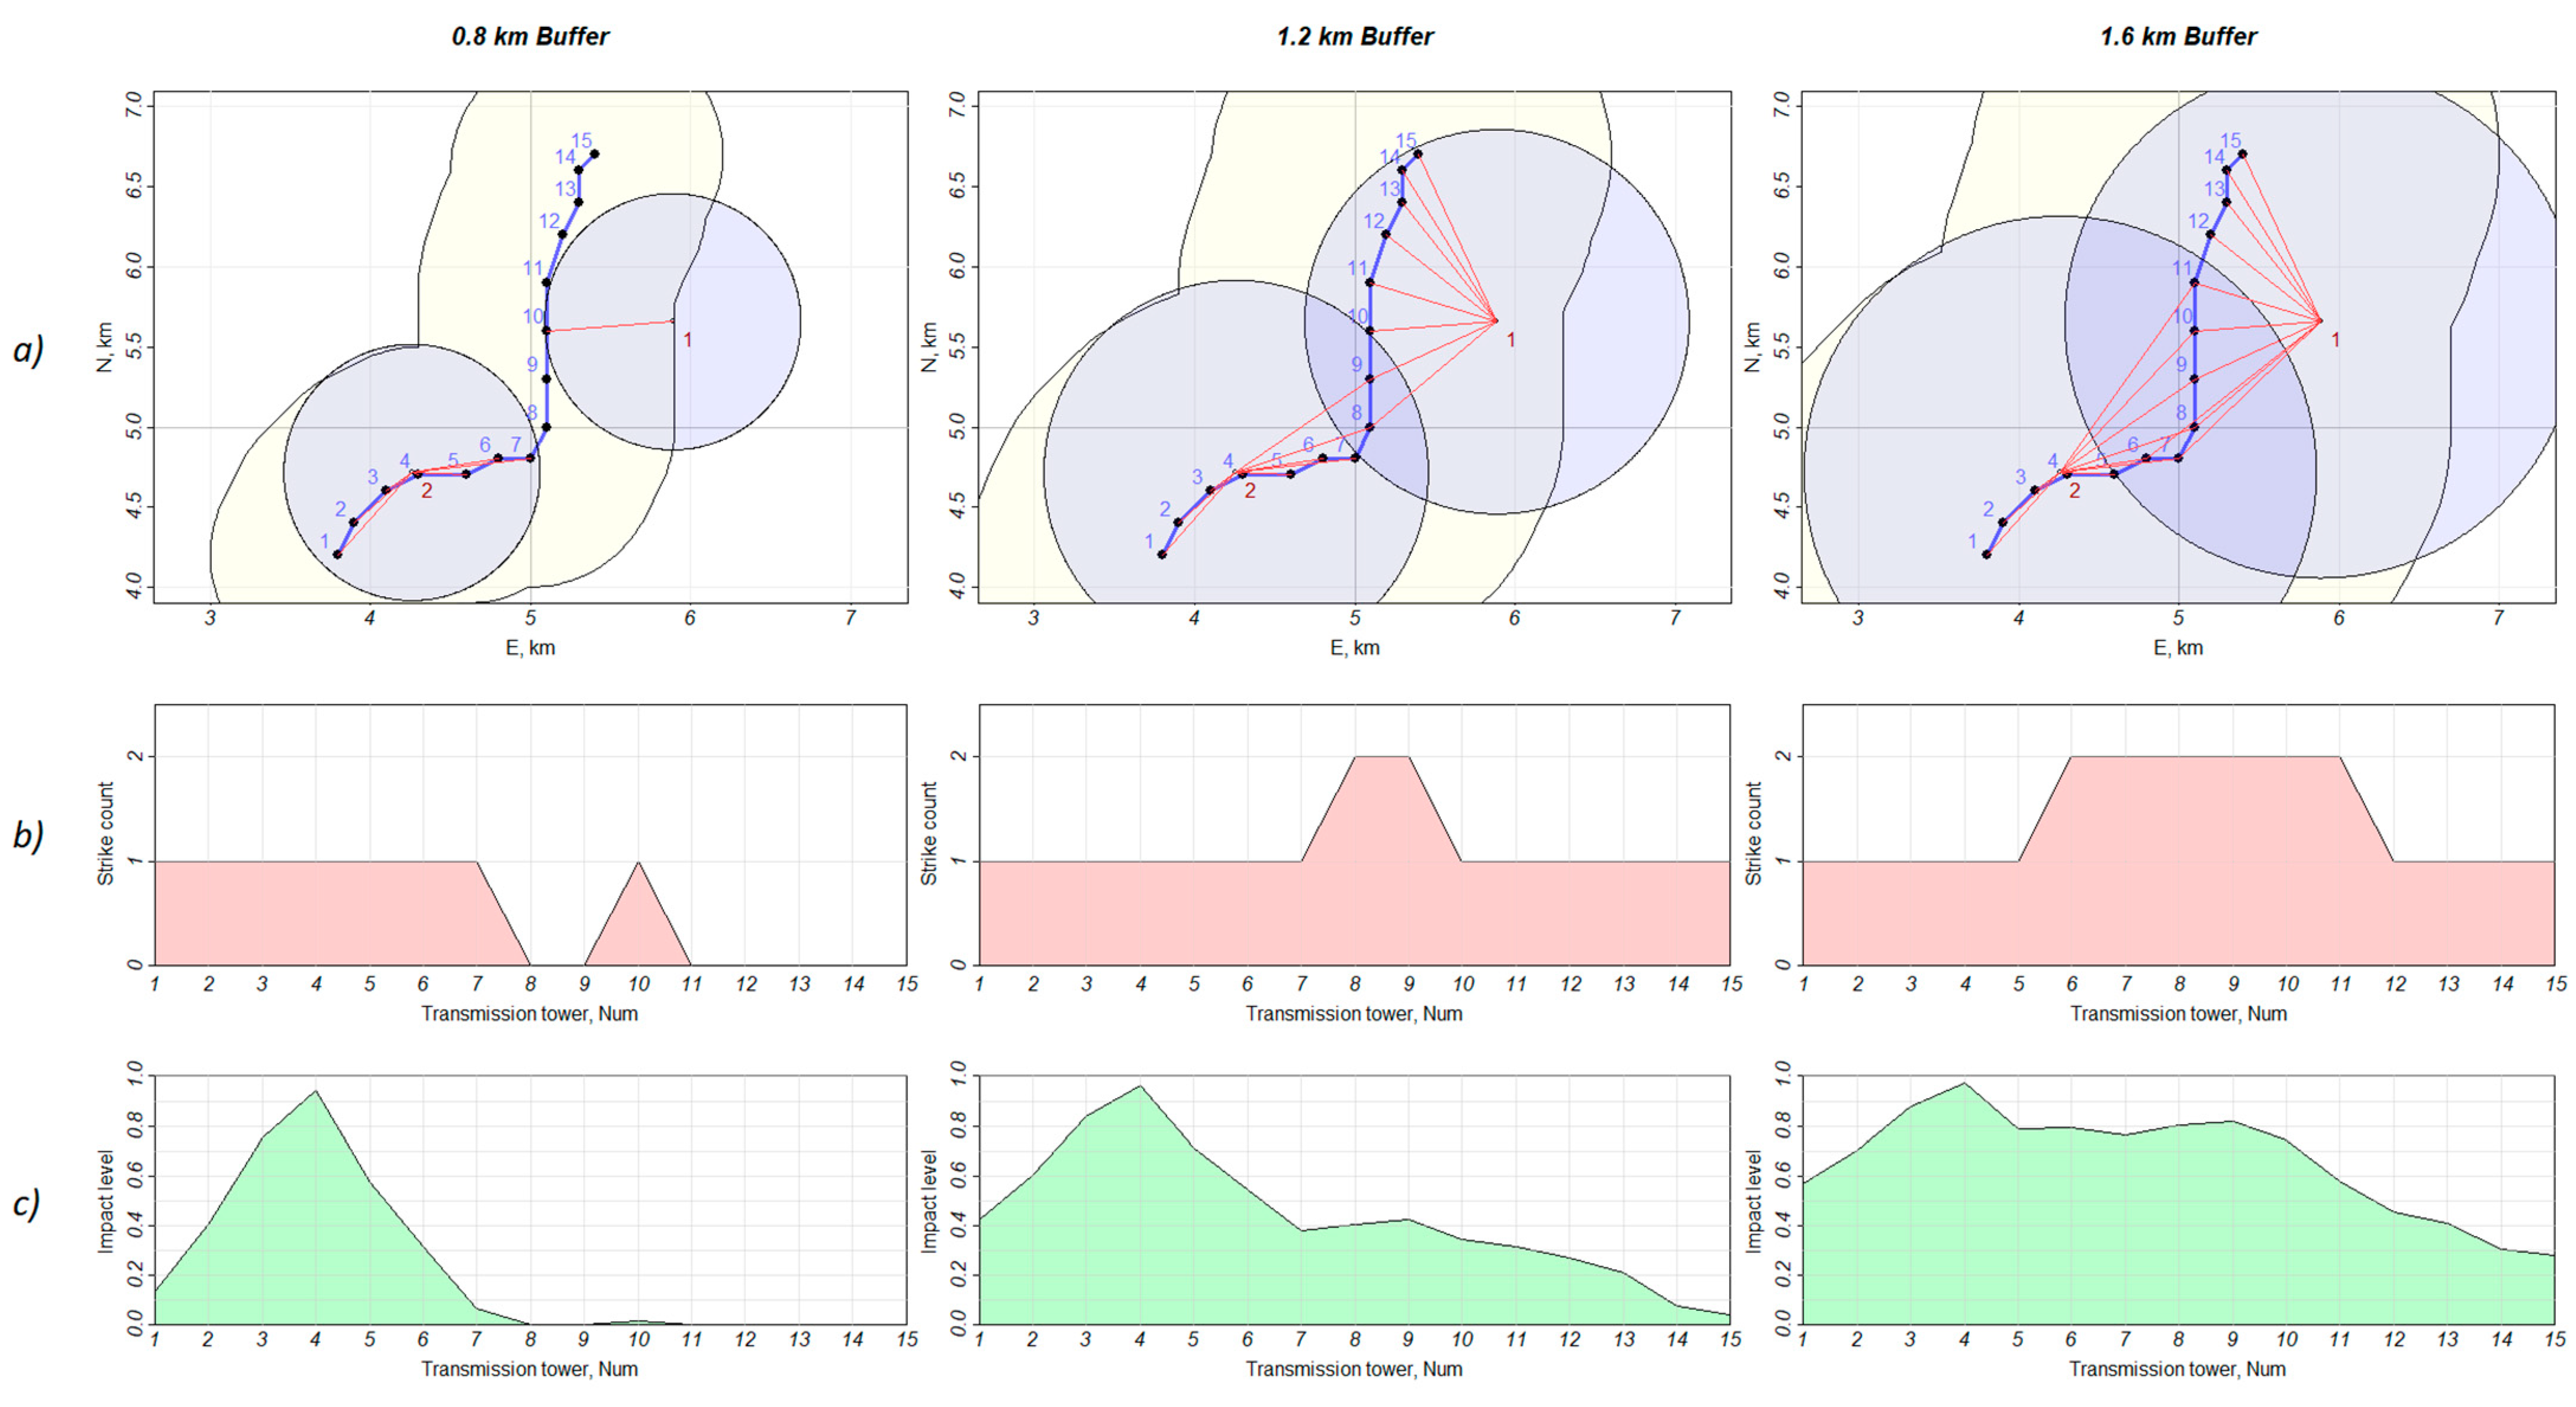
We first present the mathematical function used for the estimation of lightning impacts intensity on all OHTL supports. Under the intensity of the lightning’s effect on the support, we will take the value equal to one if it directly hit the support and decreasing to zero as the lightning approaches the boundary of the power line buffer. In this case, the lightning radius is equal to the buffer radius. The input data for this function are: first, the geographic coordinates of lightning in the studied area during the specified time interval; second, the geographic coordinates of all towers of the studied power line; finally, the buffer size for this line. Logically, the larger the buffer, the more lightning it will contain, and the greater the impact will be accounted for by the power line.
Let D be a matrix of distances between all flashes and all power line towers. For general n-dimensional Euclidean distance, we can exploit Equation (1) [13]:
D 2 ( p l ,   s t ) = ( p l s t ) T ( p l s t ) = p l T p l + s t T s t 2 p l T s t ,
where pl and st are the support and the lightning vectors, respectively, and plT is the transpose operation. The resulting matrix D contains the number of rows corresponding to the number of flashes and the number of columns corresponding to the number of towers.
The next step is to calculate the matrix E. This is the difference between the buffer size b and the distance matrix D:
E = b D .
Next, all matrix E elements less than zero are taken as having no effect on the transmission line tower. Let us equate these values to zero:
E [ E < 0 ] = 0 .
The final step is to obtain the lightning intensity vector e by summing the rows of the matrix E. Let us take the impact of lightning as one. Hence, we divide the rows of matrix E by the buffer size b. The length of this vector will be equal to the number of transmission line towers:
e = i = 1 t ( E ( i , ) b ) ,
where t is the number of power line towers. To obtain the annual average value, the vector e should be divided by the number of thunderstorm observations years.

2.2. Study Area

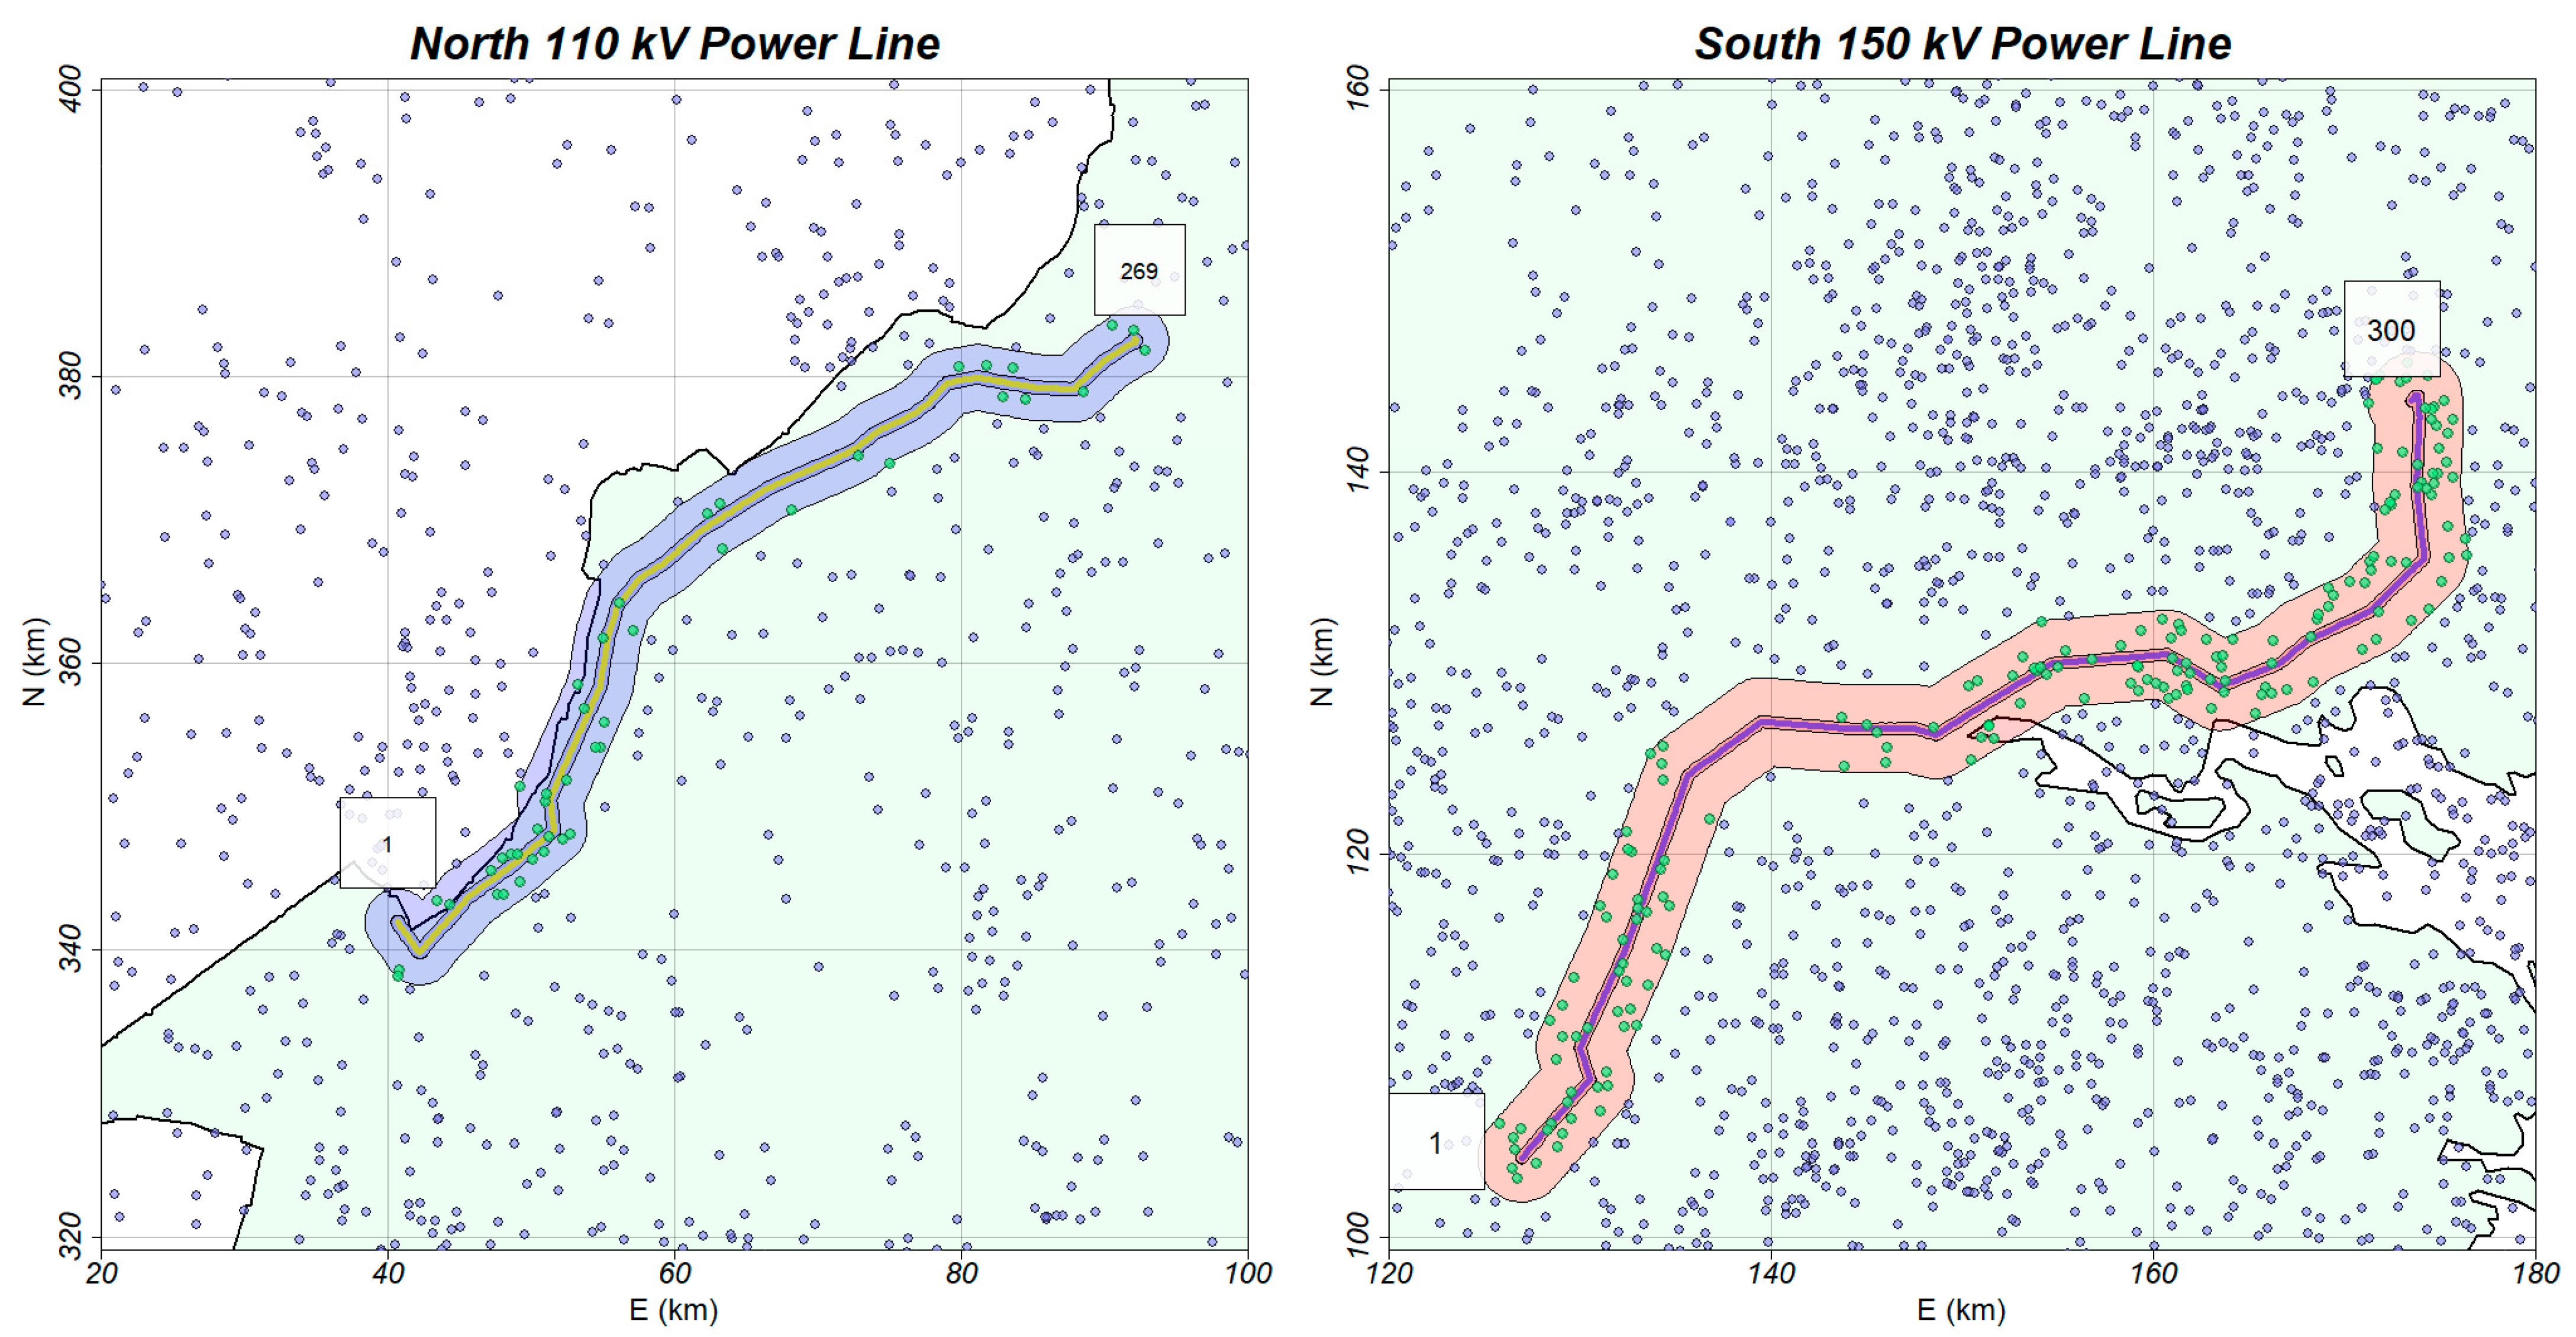
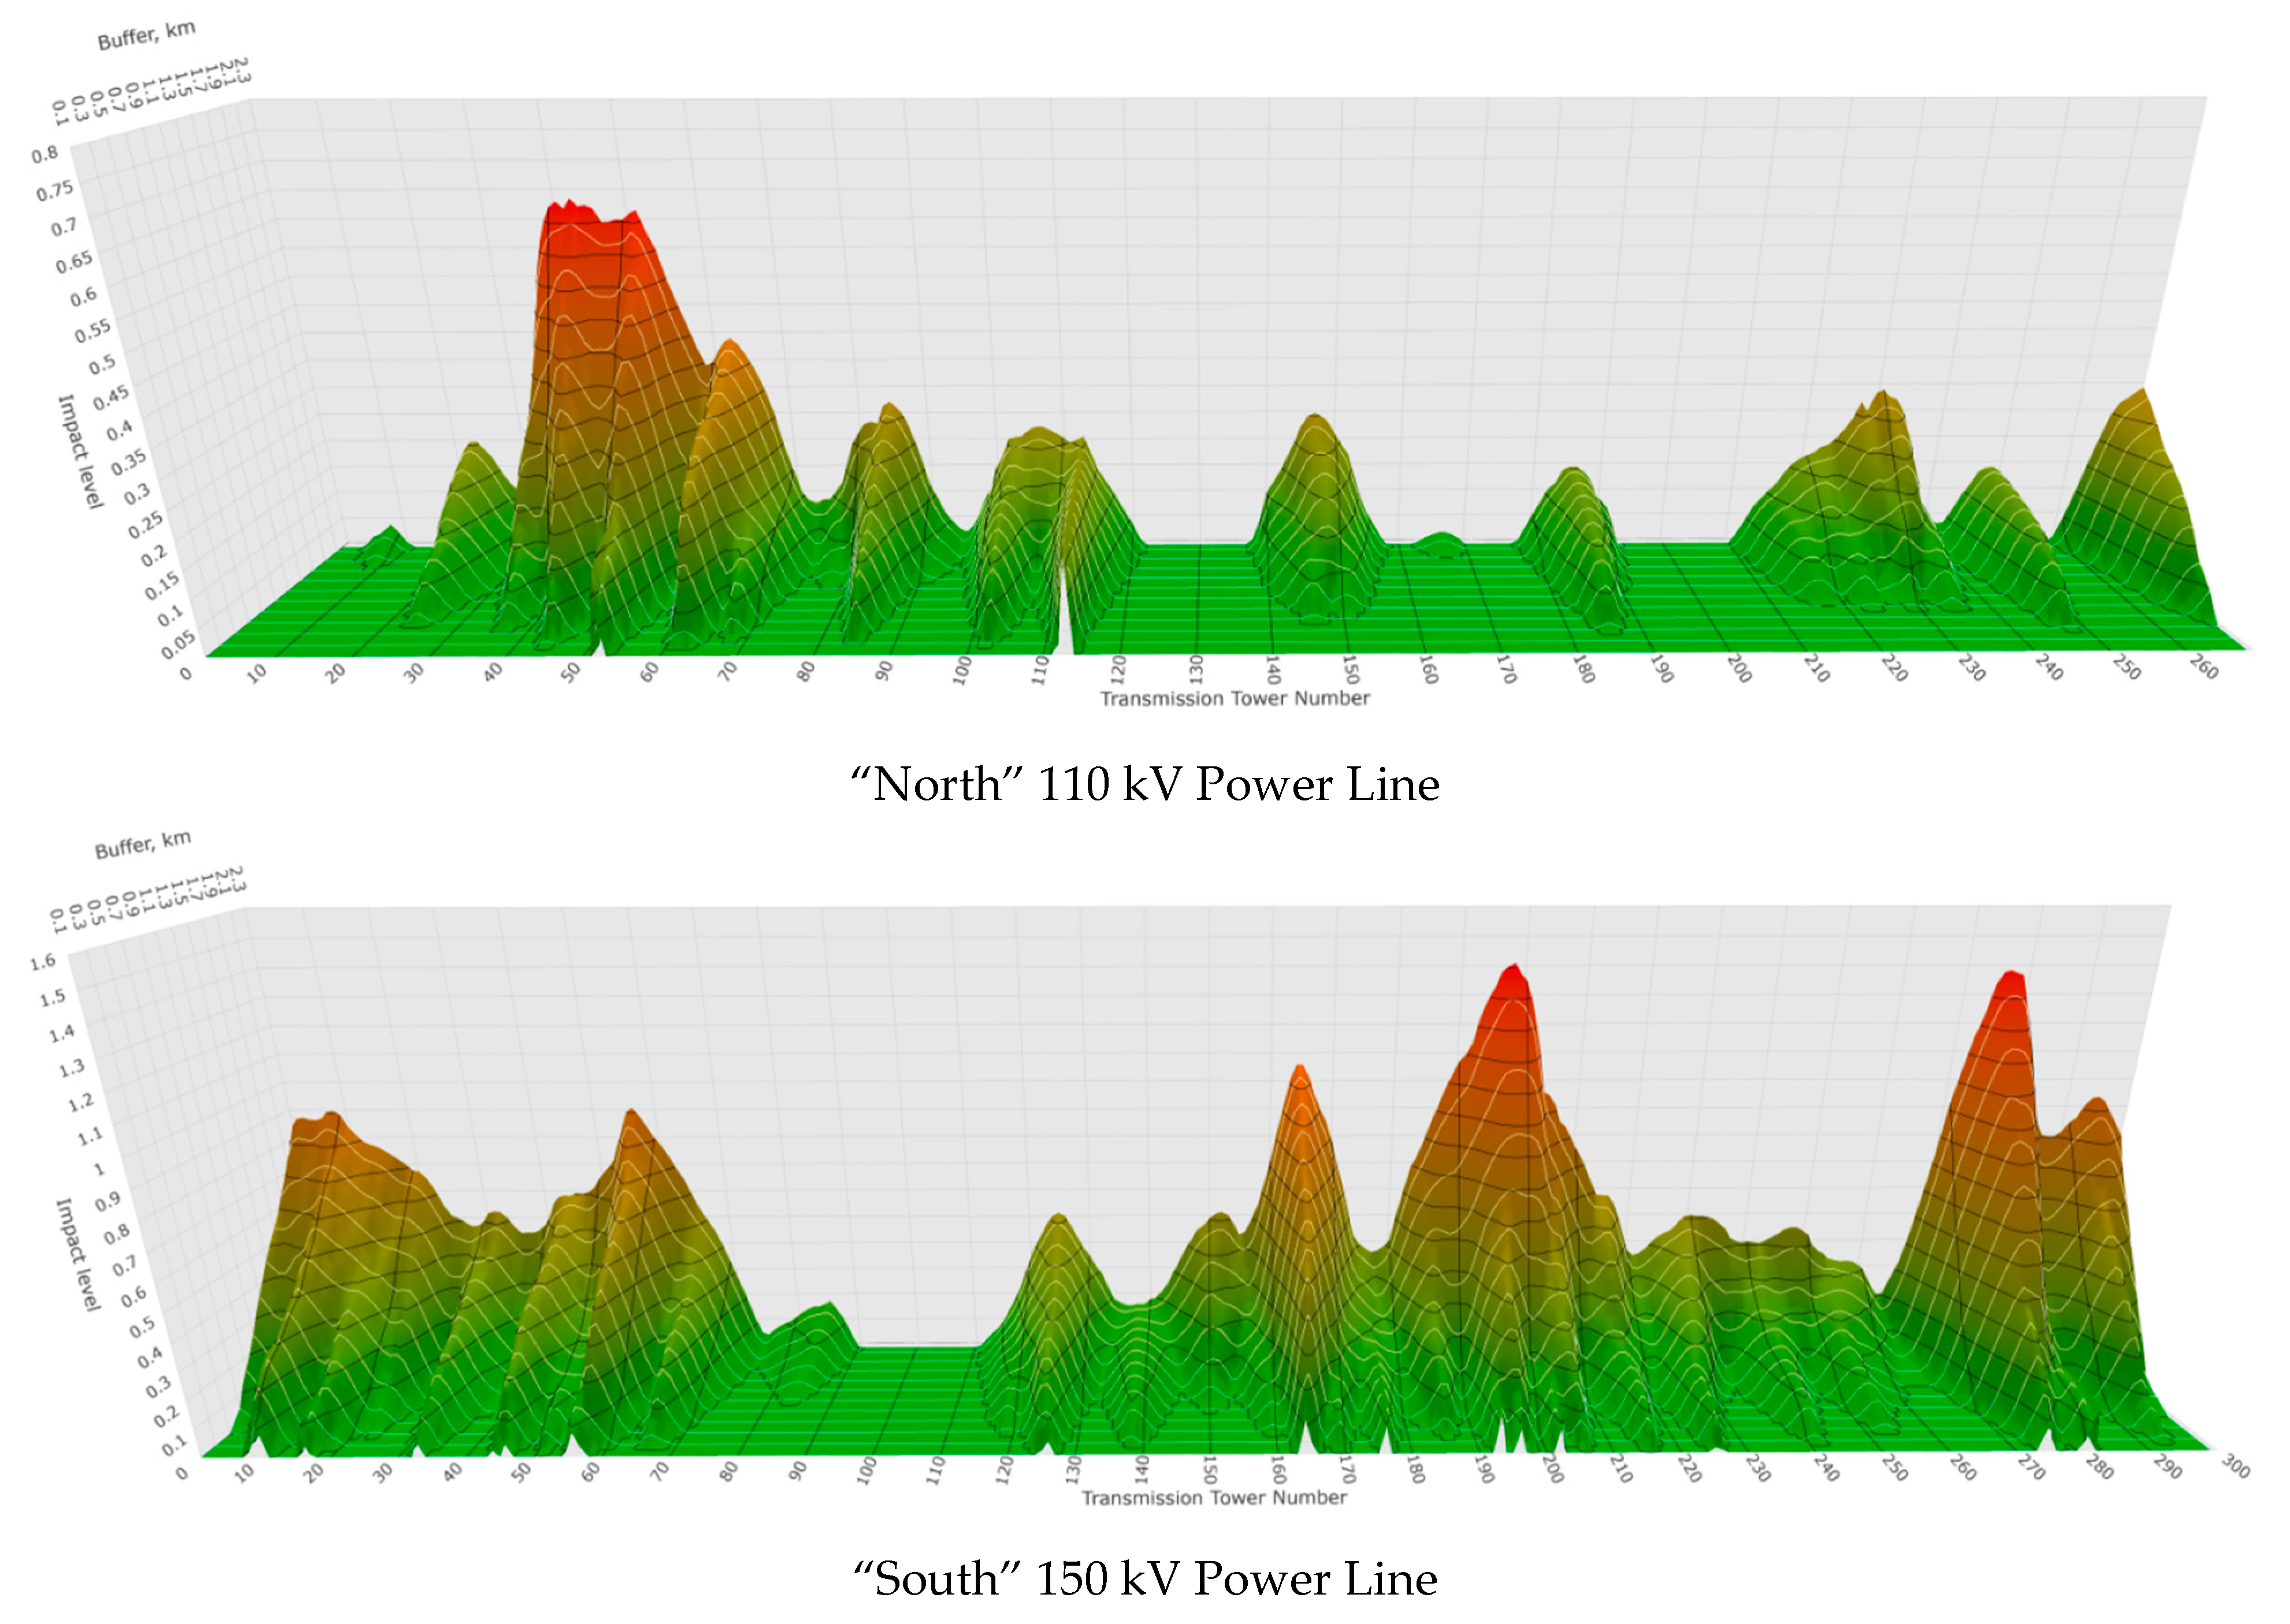
Let us apply the proposed method to some OHTLs of the Murmansk region of the Russian Federation. There are more than 270 lines with voltage classes 35, 110, 150 and 330 kV in this region. The Murmansk region is located in the northwestern part of Russia and has borders with Finland and Norway. The region is part of the Arctic zone of the Russian Federation and has a moderately cold climate with sufficiently low thunderstorm activity in the north and medium thunderstorm activity in the south. Therefore, two overhead lines were chosen to demonstrate the method: one of them is located in the north of the region, and the other is located in the south of the region.
Lightning analysis in the Murmansk region was performed with the Blitzortung lightning detection network (LDN) [14]. This region was chosen due to its location in the Blitzortung LDN zone of reliable lightning detection, unlike other regions of the Russian Federation. There are more than 25 detectors within a 500 km radius. Additionally, we choose this LDN because we have easy access to the data and because we are participants in this project. The Blitzortung Network has been in operation since 2008, but reliable data for the Murmansk region has only been available since 2015, which is a limitation of thunderstorm research in that region using this LDN. Therefore, this work will use lightning data for the last five-year period from 2016 to 2020. The data set consists of 41,656 flashes to the ground between January 2016 and December 2020. Other research limitations when using Blitzortung network data are the detection of lightning into the ground only and the unavailability of lightning current information.
To have an overview of thunderstorms in the studied region, the corresponding maps were constructed according to the methodology proposed in [5]. To construct a gridded dataset of ground flash density, the Murmansk region is divided into grids of 20 km × 20 km cells. We have also converted the lightning and power lines data from the original World Geodetic System geographical coordinate system (WGS84) into the kilometer-based Universal Transverse Mercator (UTM) system to provide easier analysis of the data into the 20 km × 20 km squares.

2.3. Power Lines Data Set

A set of transmission lines data was obtained from the electric power suppliers of the Murmansk region. The data set consists of 200 complete transmission lines of different voltage classes. Note that these data represent service information, so in this paper, some data from this set will be presented in an unidentified form and without precise georeferencing. Nevertheless, even the information presented in this form will allow us to demonstrate a method for evaluating the lightning intensity on power lines along their entire length.

2.4. Processing Environment

The method and results described in this paper are part of a project to simulate the states of the Kola power system and to inform about flash incidence to power lines over the ground in real-time. Calculations were performed in the R programming language using the “sf” and “plotly” libraries.

3. Results

We present the principle of the method on an abstract model of power lines with a random set of lightning (Section 3.1). Then we test the method on some power lines of the Murmansk region (Section 3.2).

3.1. Detailed Method Description

Let the transmission line model consist of 15 towers, the distance between which does not exceed 300 m. The coordinates of the towers are given in Table 1.
Randomly place several lightning strikes in the power line area. Let, for illustration, have two flashes with coordinates x1 = 5.887, y1 = 5.658 and x2 = 4.258, y2 = 4.717. Let us assume that one flash near a power line tower and a second flash near a buffer boundary, the initial size of which is 0.8 km (Figure 1, left column). Using Equation (1), we obtain the distance matrix D:
D = ( 2.546 2.352 2.077 0.691 0.478 0.197         1.854 1.150 0.045 2.288   )
Then, for b = 0.8 km, we carry out the calculation by Equation (2) and get:
E = b D = ( 1.746 1.552 1.277 0.109 0.322 0.603         1.054 0.350 0.755 1.488   )
According to Equation (3), zeroize the negative values of the matrix E:
E [ E < 0 ] = 0 y i e l d s E = ( 0 0 0 0.109 0.322 0.603         0 0 0.755 0   )
At the final step, by Equation (4), we obtain the desired influence vector e:
e = i = 1 15 ( E ( i , ) 0.8 ) = = ( 0.137 ,   0.402 ,   0.754 ,   0.944 ,   0.572 ,   0.315 ,   0.067 ,   0 ,   0 ,   0.014 ,   0 ,   0 ,   0 ,   0 ,   0 ) .
As the buffer increases to 1.2 km and then to 1.6 km, each flash will be counted by more towers but with different intensities due to different distances from the towers. The graphical representation of the vector e for the 0.8 km, 1.2 km and 1.6 km buffers is shown in the bottom row of Figure 1.

3.2. Testing the Method on Real Power Lines

A study of the method on real overhead lines is important, primarily for power suppliers. Moreover, it is necessary to quickly obtain knowledge of the most lightning-affected sections of power lines. In some cases, the method can also be beneficial to people selecting the optimal route (least amount of lightning strikes) for power transmission lines based on lightning density [15].
To test the method on real regional overhead lines, you need to prepare the initial data. These include the coordinates of overhead line towers, coordinates of lightning strikes, and the range of power line buffer. If everything is simple enough with the coordinates, the buffer size must be calculated. In this work, the OHTLs buffer is chosen within the LDN error limit. This error can be estimated from the maximum deviation span (MDS) parameter of each flash. Figure 2 shows a histogram of the MDS parameter distribution.
Understanding that the propagation of radio waves in the atmosphere is more complex than in the vacuum depends on many parameters, such as wavelength, source power and others, for simplicity, we take the speed of radio waves as the speed of light propagation through a vacuum. We transform the MDS parameter into the lightning strike radius Rl:
R l = M D S · c 2
where c is the speed of light in vacuum, equal to 299,792,458 m/s.
Table 2 shows a summary of the transformed MDS parameter Rl from a dataset containing 41,656 lightning strikes to the study area.
The mean and median values are almost equal and are about 1350 m. Recent Blitzortung LDN accuracy studies in Japan [16] showed similar results with a value of about 1400 m, so we will accept the lightning data set as valid. Therefore, for our calculations, we take the size of the overhead line buffer zone to be approximately equal to the range of the MDS parameter from Table 2: from 100 to 2300 m.
We will construct a map of the average annual ground flash density according to the technique [5] and show selected power lines on it (Figure 3).
Over the 5-year period from 2016 to 2020, 44 and 175 lightning strikes entered the buffer zones (R = 2300 m) of “North” and “South” power lines, respectively. The main concentration of lightning is located in the first half and at the end of the “North” OHTL. In the “South” OHTL, the main concentration of lightning is located in the second half and the first quarter. The distribution of these flashes is shown in Figure 4.
The intensity vectors of the average annual lightning impact e, obtained for the buffer area in the range from 0.1 to 2.3 km of each of the power lines, can be displayed as a 3D surface. Such imaging is sufficient to identify the most frequently affected sections of power lines. Sections with the highest intensity correspond to areas with the highest lightning concentration. The vectors e for the “North” line and “South” line are shown in Figure 5.

4. Discussion

Let us try to estimate a possible range of the buffer area of the selected power lines according to the models of estimate flash incidence to a line overground (Anderson [17], Mousa and Srivastava [18], Rizk [19], Eriksson [20]). Now, all models of the estimated flash incidence to a power line are based on Ground Flash Density Ng. Only some coefficients in structurally similar equations are different:
N l = N g 10 · ( b + D · h x ) · L 100
where Nl is the number of strokes to a line; Ng is ground flash density, 1 km−2 year−1; b is the overhead ground wire separation distance, m; D and x are empirical parameters given in Table 3; h is the height of the power line tower or average conductor height for various cases, m; L is the line length, km.
If you use “The Electrical Installation Rules” to estimate, then 
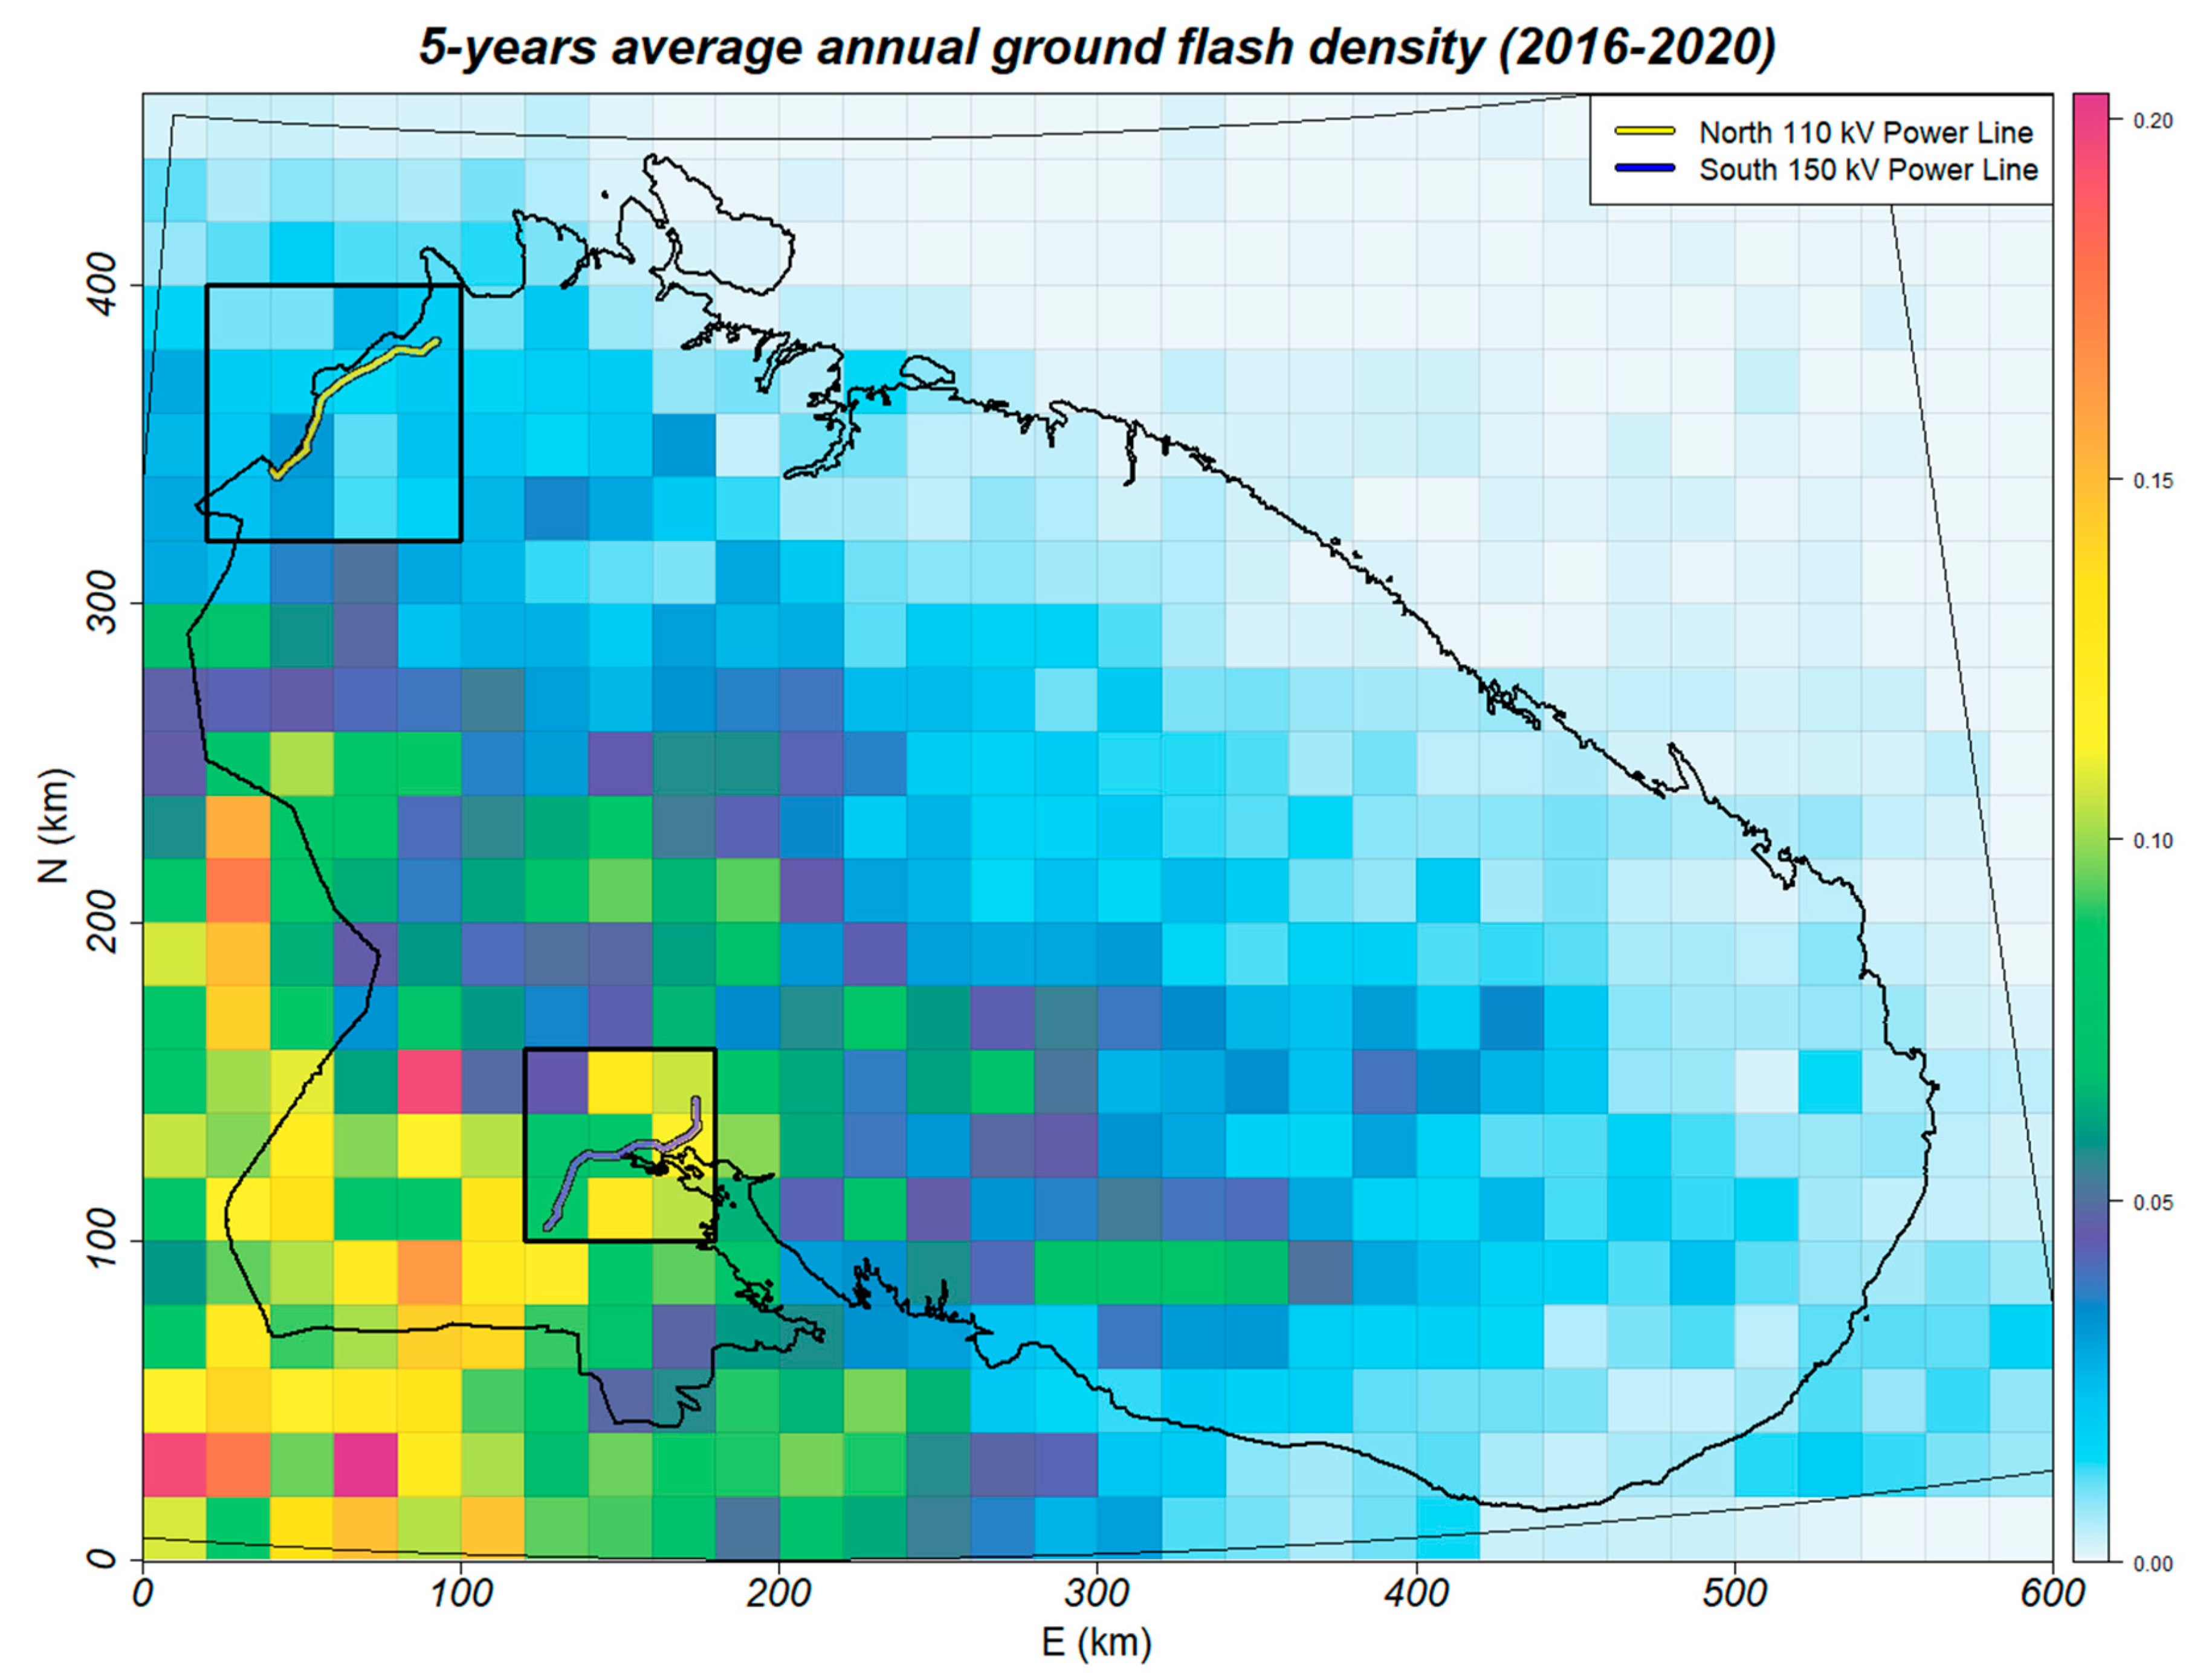
Ng depends on the number of thunderstorm hours, which for “North” power lines has a vague value of “less than 10” and for “South” power lines a little more specific “10 to 20”. However, a map of lightning density in the Murmansk region for the last 5 years has already been drawn (Figure 3), so it would be logical to use it. Using a map based on cells with a defined area, you need to divide the overhead line into sections lying in each of these cells. Then for each site, you need to calculate and summarize the results. The results of the estimated flash incidence to a power line according to the aforementioned models are shown in Table 4.
On average, over the last 5 years, the actual number of strikes to the “North” overhead line obtained with these models corresponds to a buffer area range of 350 to 400 m. For the “South” overhead line under the same conditions, the buffer area range is 200 to 310 m. Therefore, the predictive model should be used with caution, as it is assumed that in an ideal model, the widths of the overhead line corridors should be approximately equal. Each of the mentioned models is based on the average annual lightning density per one km2, which is almost impossible to predict, and only statistical historical data are used. In this context, the problem of the northern regions, including the Murmansk region, is the rarity of thunderstorms. For example, a single thunderstorm of 3–4 h duration can leave a strong trace on the annual average lightning density map for several years, while in areas with high thunderstorm intensity, such phenomena are smoothed out or completely absent. One such case can be seen in the 5-years map in Figure 3, where a thunderstorm that occurred on 7 June 2019 from 20:00 to 23:59 UTC was permanently stored in cells n ∈ (80, 100) and E ∈ (280, 360).
In addition, it would be interesting to apply the method to overhead lines located in southern latitudes with high thunderstorm intensity. However, it was only possible to obtain a set of OHTL data for the Murmansk region. In general, the openness and availability of data to engineers and scientists around the world can spur the qualitative development of electrical systems. The authors of the article [21] urge electricity suppliers to openly publish data about electric grids because an important factor to evaluate the different possible scenarios is energy system modelling.
At the same time, a great deal of information about power lines and substations can be obtained from public sources, for example, Open Infrastructure Map [22]. Nevertheless, the information about Russia’s power lines in this source is highly fragmented and insufficient for research.

5. Conclusions

A simple method of assessing the intensity of lightning impacts on power lines along their entire length has been proposed. The most important parameter in this evaluation is the size of the power line buffer. The input data for the method are the coordinates of both the lightning in the region and the power lines towers. The application of this method on real power lines will make it possible to find out the most affected sections, which is very important information for power suppliers and service organizations.

Author Contributions

Conceptualization, A.V.B. and V.N.S.; methodology, A.V.B.; software, A.V.B.; validation, A.V.B. and V.N.S.; formal analysis, A.V.B.; investigation, A.V.B.; resources, V.N.S.; data curation, V.N.S.; writing—original draft preparation, A.V.B.; writing—review and editing, V.N.S.; visualization, A.V.B.; supervision, V.N.S.; project administration, V.N.S. All authors have read and agreed to the published version of the manuscript.

Funding

This research received no external funding.

Institutional Review Board Statement

Not applicable.

Informed Consent Statement

Not applicable.

Data Availability Statement

Restrictions apply to the availability of these data. Data was obtained from PJSC “IDGC of the North-West” and are available from the authors with the permission of PJSC “IDGC of the North-West”.

Conflicts of Interest

The authors declare no conflict of interest.

Abbreviations

OHTLOverhead Transmission Line
LDSLightning Detection System
LDNLightning Detection Network
WGS84World Geodetic System
UTMUniversal Transverse Mercator
MDSMaximum Deviation Span
UTCCoordinated Universal Time

References

  1. Electrical Installation Code, 7th ed.; Russian Federation: Siberian University Publisher: Novosibirsk, Russia, 2007; p. 512. (In Russian)
  2. Kuleshov, Y.; Mackerras, D.; Darveniza, M. Spatial distribution and frequency of lightning activity and lightning flash density maps for Australia. J. Geophys. Res. Atmos. 2006, 111, 14. [Google Scholar] [CrossRef] [Green Version]
  3. Soriano, L.R.; de Pablo, F.; Diez, E.G. Cloud-to-ground lightning activity in the Iberian Peninsula: 1992–1994. J. Geophys. Res. Atmos. 2001, 106, 11891–11901. [Google Scholar] [CrossRef] [Green Version]
  4. Soula, S.; Seity, Y.; Feral, L.; Sauvageot, H. Cloud-to-ground lightning activity in hail-bearing storms. J. Geophys. Res. Atmos. 2004, 109, 13. [Google Scholar] [CrossRef]
  5. Makela, A.; Rossi, P.; Schultz, D.M. The Daily Cloud-to-Ground Lightning Flash Density in the Contiguous United States and Finland. Mon. Weather. Rev. 2011, 139, 1323–1337. [Google Scholar] [CrossRef] [Green Version]
  6. Adzhieva, A.H.; Kulieva, D.D. Characteristics of storm activity and parameters of lightning discharges in the territory of the South of the European part of Russia. Izv. Atmos. Ocean. Phys. 2018, 54, 437–445. [Google Scholar] [CrossRef]
  7. Kozlov, V.I.; Mullayarov, V.A.; Karimov, R.R. The spatial distribution of the lightning in the east of Russia on remote sensing data. Curr. Probl. Remote Sens. Earth Space 2011, 8, 257–262. [Google Scholar]
  8. Konstantinova, D.A.; Gorbatenko, V.P. Lightning registration results over the southeastern territory of western Siberia. Proc. High. Educ. Inst. Phys. 2011, 54, 156–162. [Google Scholar]
  9. Rawi, I.M.; Kadir, M.Z.A.A.; Azis, N. Lightning study and experience on the first 500 kV transmission line arrester in Malaysia. In Proceedings of the 2014 International Conference on Lightning Protection (ICLP), Shanghai, China, 11–18 October 2014. [Google Scholar]
  10. Bochkovskiy, B.B.; Merzlyakov, A.S. Evaluation of the thunderstorm intensity. Unified Grid Energy 2012, 3, 30–35. [Google Scholar]
  11. Whitehead, J.T.; Chisholm, W.A.; Anderson, J.G.; Clayton, R.; Elahi, H.; Eriksson, A.J.; Grzybowski, S.; Hileman, A.R.; Janischewskyj, W.; Longo, V.J.; et al. Estimating lightning performance of transmission line 2—Updates to analytical models. IEEE Trans. Power Deliv. 1993, 8, 1254–1267. [Google Scholar] [CrossRef]
  12. Golubev, M.Y.; Zorin, G.A. Using electrical network schematic map together with GPS-monitoring and lightning detection software to solve the problems of operational dispatcher control in the electric power industry. In Proceedings of the Dispatching and Control in the Electric Power Industry, Kazan, Russia, 1–3 November 2017; pp. 366–371. [Google Scholar]
  13. Abdi, H. Linear Algebra for Neural Networks. Int. Encycl. Soc. Behav. Sci. 2001. [Google Scholar] [CrossRef]
  14. Wanke, E.; Andersen, R.; Volgnandt, T. World-Wide Low-Cost Community-Based Time-of-Arrival Lightning Detection and Lightning Location Network. Available online: http://www.blitzortung.org (accessed on 1 June 2021).
  15. Li, Y.F.; Yang, Q.; Sima, W.X.; Li, J.Q.; Yuan, T. Optimization of Transmission-Line Route Based on Lightning Incidence Reported by the Lightning Location System. IEEE Trans. Power Deliv. 2013, 28, 1460–1468. [Google Scholar] [CrossRef]
  16. Narita, T.; Wanke, E.; Sato, M.; Sakanoi, T.; Kumada, A.; Kamogawa, M.; Hirohiko, I.; Harada, S.; Kameda, T.; Tsuchiya, F.; et al. A study of lightning location system (Blitz) based on VLF sferics. In Proceedings of the 2018 34th International Conference on Lightning Protection (ICLP), Rzeszow, Poland, 2–7 September 2018; pp. 1–7. [Google Scholar]
  17. Anderson, J.G. Lightning Performance of Transmission Lines. In Transmission Line Reference Book 345 kV and Above; LaForest, J.J., Ed.; Electric Power Research Institute: Palo Alto, CA, USA, 1982. [Google Scholar]
  18. Mousa, A.M.; Srivastava, K.D. Modelling of power lines in lightning incidence calculations. IEEE Trans. Power Deliv. 1990, 5, 303–310. [Google Scholar] [CrossRef]
  19. Rizk, F.A.M. Modeling of transmission line exposure to direct lightning strokes. IEEE Trans. Power Deliv. 1990, 5, 1983–1997. [Google Scholar] [CrossRef] [Green Version]
  20. Eriksson, A.J. The Incidence of Lightning Strikes to Power Lines. IEEE Trans. Power Deliv. 1987, 2, 859–870. [Google Scholar] [CrossRef]
  21. Medjroubi, W.; Mueller, U.P.; Scharf, M.; Matke, C.; Kleinhans, D. Open Data in Power Grid Modelling: New Approaches Towards Transparent Grid Models. Energy Rep. 2017, 3, 14–21. [Google Scholar] [CrossRef]
  22. Garrett, R. Open Infrastructure Map—A View of the World’s Infrastructure Based on Data from OpenStreetMap. Available online: https://openinframap.org/ (accessed on 1 June 2021).
Figure 1. The (a) row shows the location of power lines and lightning strikes on the ground. The plots in the (b) row show the total number of lightning strikes that affect each tower. The plots in the (c) row show the desired impact level on the power lines according to the proposed method.
Applsci 11 06609 g001
Figure 2. The MDS parameter distribution.
Applsci 11 06609 g002
Figure 3. A map of the average annual ground flash density of the Murmansk region for 5 years (2016–2020). The map shows the “North” OHTL (from above, 110 kV, 269 towers, 75 km length) and the “South” OHTL (from below, 150 kV, 300 towers, 74.6 km length).
Applsci 11 06609 g003
Figure 4. The distribution of flashes near the transmission line and inside its buffer area. The “North” power line is shown on the left, and the “South” power line is shown on the right. The first and last supports of the overhead line are also marked on the map.
Applsci 11 06609 g004
Figure 5. The average annual lightning impact intensity on the “North” and “South” overhead transmission lines. Note the different magnitude of the impact level.
Applsci 11 06609 g005
Table 1. The coordinates of the towers.
123456789101112131415
x, km3.83.94.14.34.64.85.05.15.15.15.15.25.35.35.4
y, km4.24.44.64.74.74.84.85.05.35.65.96.26.46.66.7
Table 2. A summary of the Rl parameter in meters.
Min1st QuMedianMean3rd QuMax
125.51006.71347.91350.41707.92248.3
Table 3. D and x parameters from Equation (10) for different models.
ModelDx
Anderson [17]41.09
Rizk [19]380.45
Eriksson [20]280.6
Mousa and Srivastava [18]45.20.32
Table 4. The estimated flash incidence to a power line according to different models.
ModelNorth Power LineSouth Power Line
Anderson [17]0.8213.706
Rizk [19]1.1704.594
Eriksson [20]1.3455.456
Mousa and Srivastava [18]0.9463.613
Publisher’s Note: MDPI stays neutral with regard to jurisdictional claims in published maps and institutional affiliations.

