Article

Digital Twin Modeling of a Solar Car Based on the Hybrid Model Method with Data-Driven and Mechanistic

Laboratory of Low Emission Vehicle, Beijing Institute of Technology, Beijing 100081, China
*
Author to whom correspondence should be addressed.
Appl. Sci. 2021, 11(14), 6399; https://doi.org/10.3390/app11146399
Submission received: 2 June 2021 / Revised: 7 July 2021 / Accepted: 7 July 2021 / Published: 11 July 2021
(This article belongs to the Topic New Frontiers in Industry 4.0)

Abstract

:

Featured Application

This technology is expected to be used in energy management of new energy vehicles.

Abstract

Solar cars are energy-sensitive and affected by many factors. In order to achieve optimal energy management of solar cars, it is necessary to comprehensively characterize the energy flow of vehicular components. To model these components which are hard to formulate, this study stimulates a solar car with the digital twin (DT) technology to accurately characterize energy. Based on the hybrid modeling approach combining mechanistic and data-driven technologies, the DT model of a solar car is established with a designed cloud platform server based on Transmission Control Protocol (TCP) to realize data interaction between physical and virtual entities. The DT model is further modified by the offline optimization data of drive motors, and the energy consumption is evaluated with the DT system in the real-world experiment. Specifically, the energy consumption error between the experiment and simulation is less than 5.17%, which suggests that the established DT model can accurately stimulate energy consumption. Generally, this study lays the foundation for subsequent performance optimization research.

1. Introduction

Vehicles nowadays have become an indispensable means of transportation for people; however, emissions of traditional fuel vehicles accelerate global warming, which urges nations around the world to develop new energy vehicles. Solar cars, as a kind of new energy vehicle, not only have the advantages of pure electric vehicles with zero emissions, but also can use on-board solar cells to truly realize green travel [1]. However, at the current stage, the energy utilization rate of solar energy is low, and solar cars only exist in laboratory research. Kohei et al. [2] detailed the process of developing and manufacturing a solar car as a final project. Suita et al. [3] described the drive performance of the solar car and proposed a maximum power tracking algorithm, and then presented a motor comparison method based on energy consumption, travel speed optimization, and total travelling distance. Ustun et al. [4] proposed an energy management method for solar vehicles and validated it on a racing car of the Istanbul University of Technology Solar Team. Vinnichenko et al. [5] proposed the optimization of the solar vehicle shape to cool down the photovoltaic modules to increase power generation in addition to reducing air resistance. Mambou et al. [6] of the University of Johannesburg Solar Team designed and validated a dedicated tracking and monitoring system for the solar car based on the team’s participation in the 2014 South African Solar Car Challenge and analyzed the interference and immunity of WIFI wireless communication along the race route. A machine learning-based solar radiation forecasting system was proposed by the University of Michigan Solar Team and IBM Watson Research Center [7] and performed well in the WSC 2015 and 2016 North American Solar Car Challenge.
Although some progress has been made in the development of solar cars recently, there are still many problems, such as inaccurate energy estimation especially under complex and variable road environments. With the above problems, it is hard to accurately describe the solar energy acquisition and utilization, since all energy consumption of the components can only be tested offline at the current stage, a process which contains large errors. With the development of new generation information technologies such as cloud computing, Internet of Things, and big data, digital twin (DT) has emerged. This technology creates virtual models of physical entities digitally, simulates the behavior of physical entities in the real environment with the help of data, and adds or extends new capabilities to physical entities by means of virtual–real connection feedback, data fusion analysis, and iterative optimization of decisions. Therefore, the utilization of DT can effectively online fit solar cars and greatly reduce the investment in human, material and financial resources, etc.
The first step of DT is to create high-fidelity virtual models, which is also one of the main challenges of DT as it requires realistic reproduction of geometry, properties, behaviors, and rules of physical entities [8]. These models should not only be consistent with the physical entity in terms of geometric structure but should also be able to simulate the spatiotemporal state, behavior, and functionality of the physical entity [9,10]. Mukherjee et al. [11] performed a DT of a 3D printer to reduce the number of trial-and-error tests, which shortens the time between design and production, and Kousi et al. [12] proposed a production system in infrastructure of DT models before providing an industrial case study of an automotive front axle assembly. Matulis et al. [13] presented a case study of creating and training a DT of a robotic arm as a virtual space created using Unity for artificial intelligence training, and Vachalek et al. [14] performed a simulation based on a Siemens application called Plant Simulation (PS), a simulation tool for DT of factory production lines. Mohammadi et al. [15] introduced a DT of a smart city paradigm that improves insight into the technical interactions of urban human-machine infrastructures. However, most of these mentioned simulation approaches suffer from poor flexibility and complex configurations. In fact, the DT often contains multiple subsystems, and it is difficult to build accurate mechanistic models for complex physical systems. In contrast, a data-driven approach uses historical and real-time operational data of the system to update, revise, connect, and supplement the numerical model [16], fusing system mechanics and operational data to better evaluate the system dynamically in real time [17,18,19].
In the field of automotive manufacturing, research targeting DT is also evolving [20,21]. Peng et al. [22,23] proposed a health metric estimation method based on the DT for condition monitoring of power electronic converters, demonstrating the application of Buck DC-DC converters. A digital copy of the experimental prototype was built, which included the power stage, sampling circuit and closed-loop controller. Li et al. [24] proposed a cloud BMS to build a DT of the battery system that could ensure continuous and accurate monitoring of the battery state, but it did not give a specific DT model. Ramachandran et al. [25], for a similar purpose, used equivalent battery circuit modeling and real-time RLS updates to construct a DT that provides accurate insights into battery charge estimation and conditions for the BMS. Krishnan et al. [26] developed health monitoring and prognostics for PMSM by creating an intelligent digital twin (i-DT) in MATLAB / Simulink. Next, a remote health monitoring and diagnostic center (RHMPC) was developed to remotely monitor motor performance through cloud communication from EV service providers. Ezhilarasu et al. [27] presented how DT can be integrated with integrated vehicle health management (IVHM) for condition-based maintenance (CBM) of vehicles to provide targeted components and systems of vehicles with customized maintenance plans. Magargle et al. [28] created a simulation-based DT model combined with an integrated model of the braking system to support thermal monitoring and predictive maintenance of the vehicle braking system. Zakrajsek et al. [29] performed health inspection of vehicle tire subsystems based on DT. Jain et al. [30] created a DT of a complete photovoltaic energy conversion unit (PVECU), including PV energy, source-level power converters, and controllers, which is capable of effectively troubleshooting complex systems without the need for physical analysis. To a large extent, these studies have contributed to the penetration of DT in the field of smart vehicles, but they have mostly focused on the component level, illustrating the characteristics of a particular subsystem of the vehicle, and research on DT for the whole vehicle is very limited. However, the study of the whole vehicle is much more meaningful because it fully considers the interactions between the subsystems, which is more comprehensive and realistic. Therefore, the knowledge gap of such research exists in the following aspects: (1) simulation modeling methods are mostly inflexible and error-prone with complex configurations; (2) DT model lacks data-driven real-time updates and parallel operation with entities; (3) there is a lack of research on the characteristics of the whole vehicle.
In summary, DT breaks through the limitations of previous simulation techniques in the design phase and local applications [31] to achieve multi-physical field coupling and data linkage between virtual and physical entities to improve simulation accuracy. In the face of complex systems and multivariable environments, DT can reflect the entity system information more comprehensively, accurately and in real time [32,33]. The purpose and novelties of this paper are as follows:
  • In this paper, the energy consumption and operation of each component of the solar car are significantly stimulated with the DT technology, and then a mature architecture of the whole vehicle energy consumption is established accordingly.
  • A new DT framework based on a hybrid modeling approach coupled with SVM techniques is proposed to address the solar car energy consumption problem. This framework can effectively combine mechanistic and data-driven modeling to improve the accuracy of DT systems.
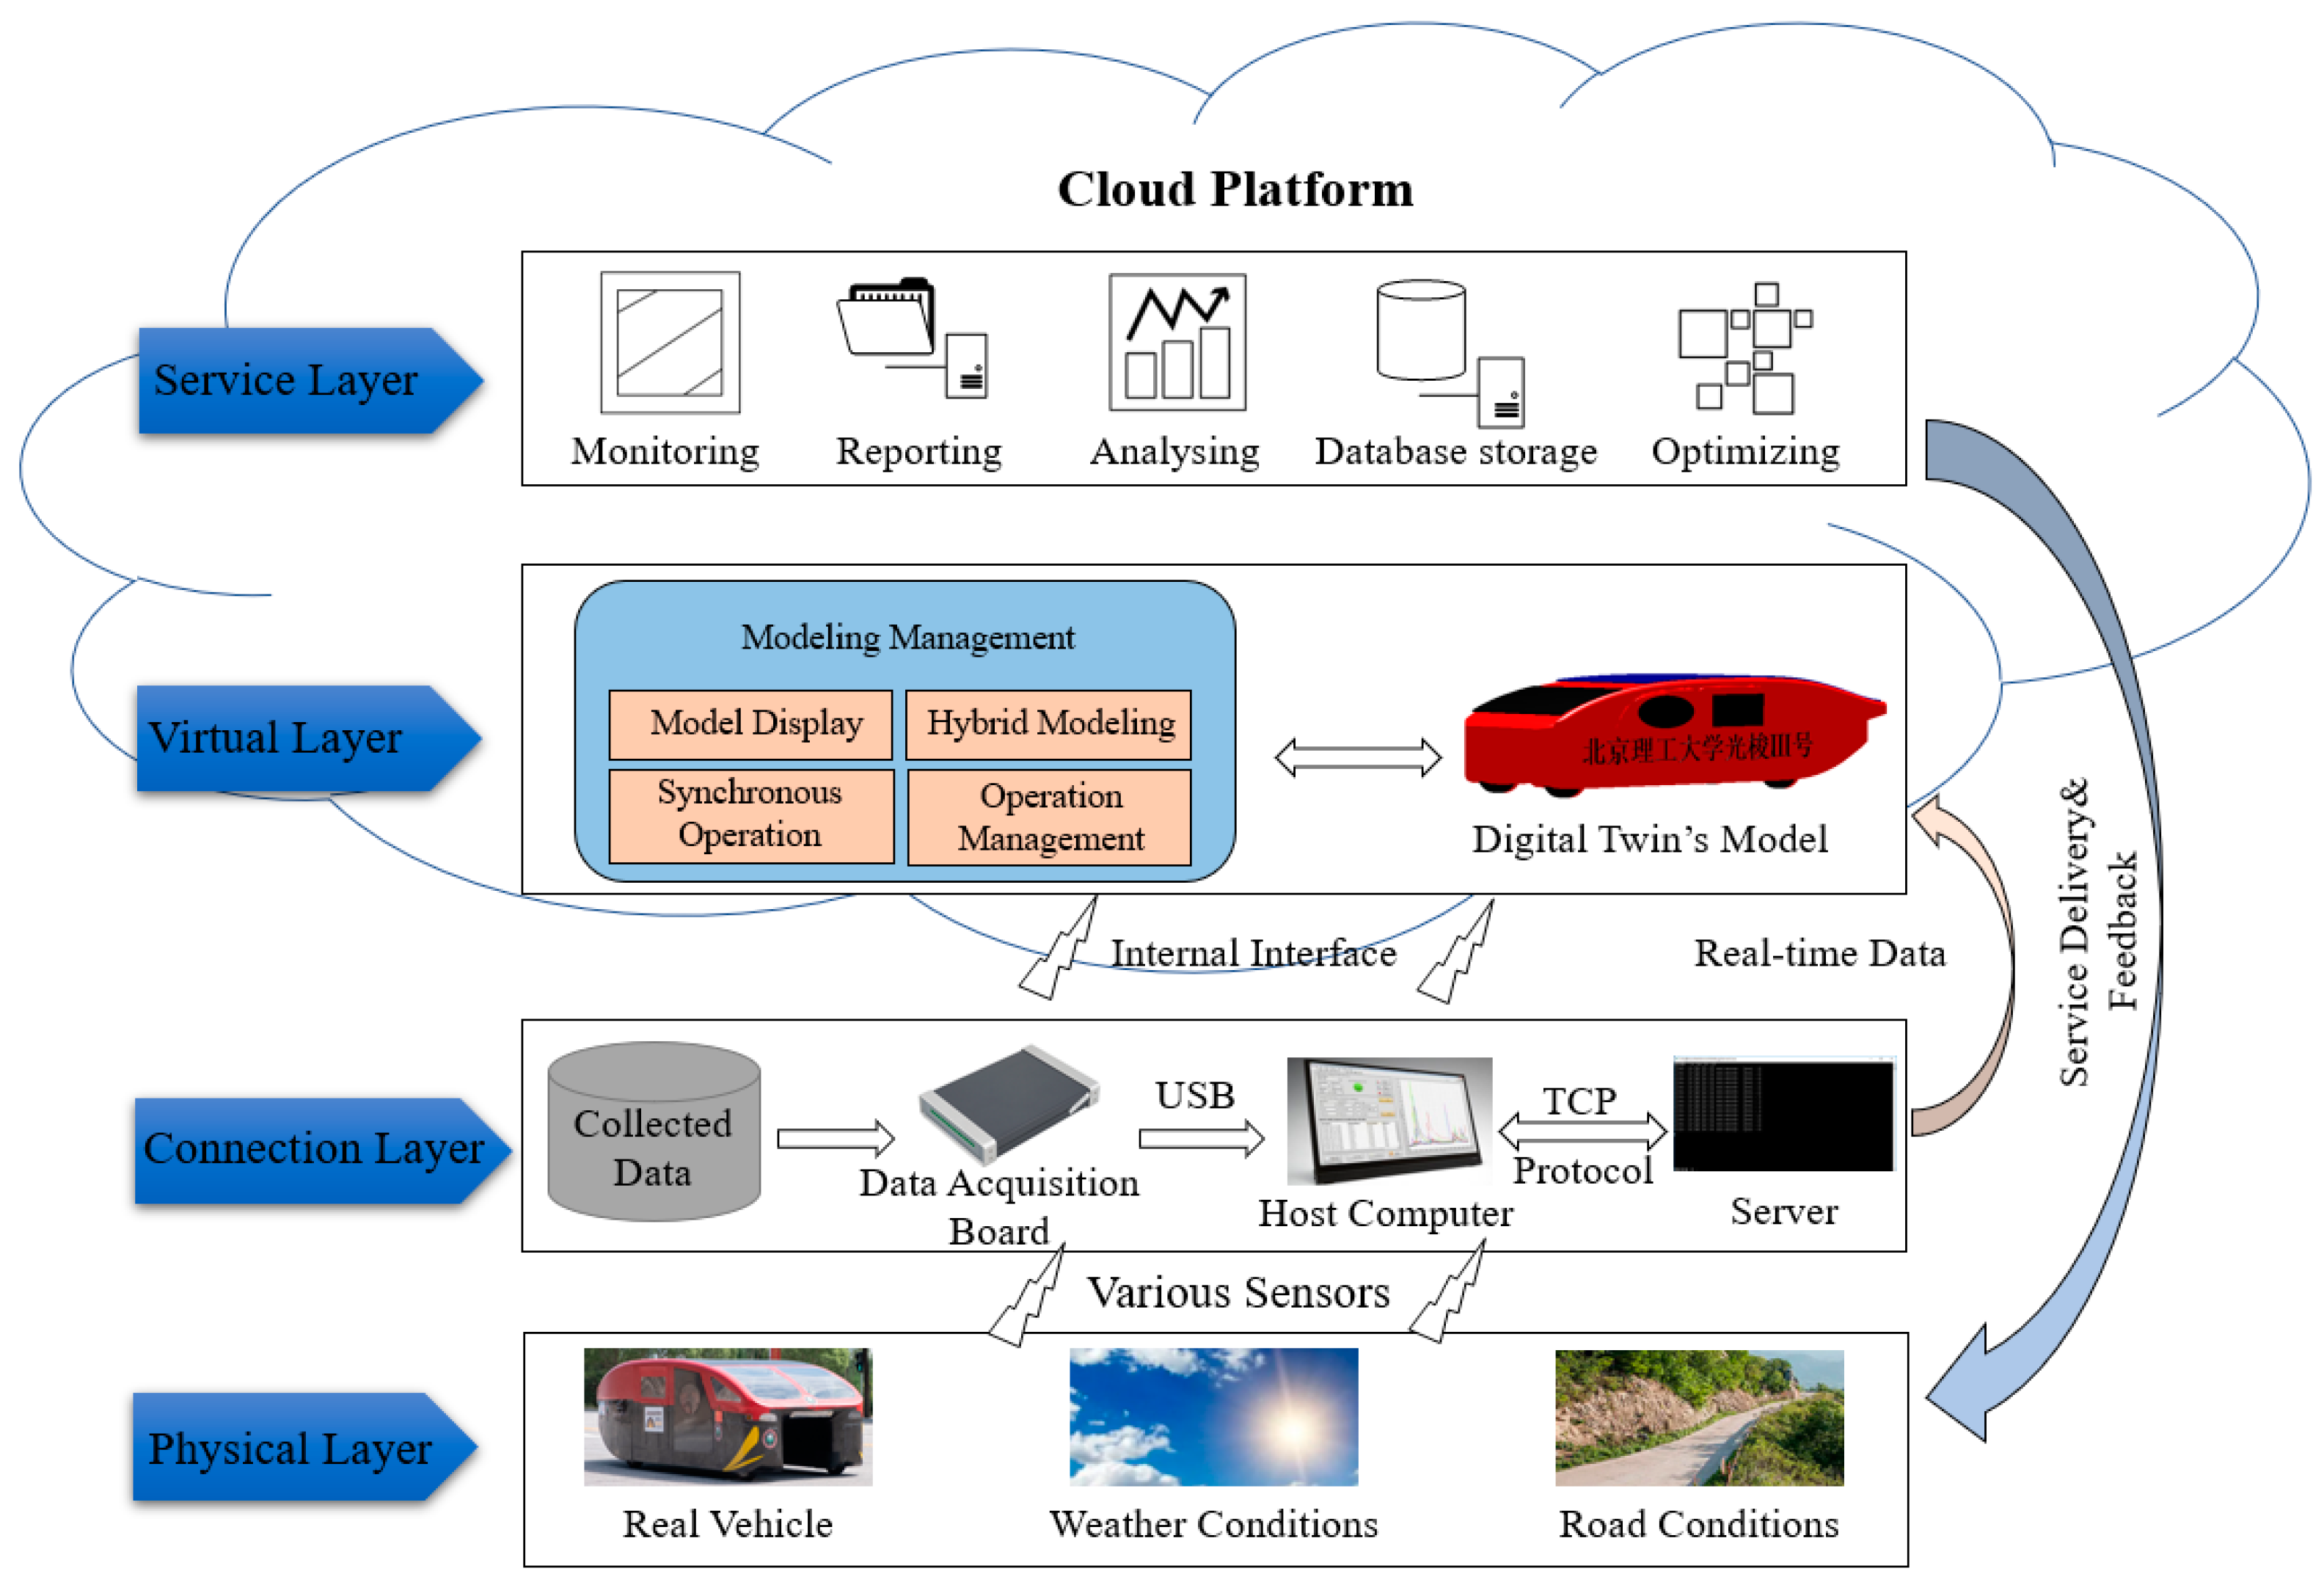
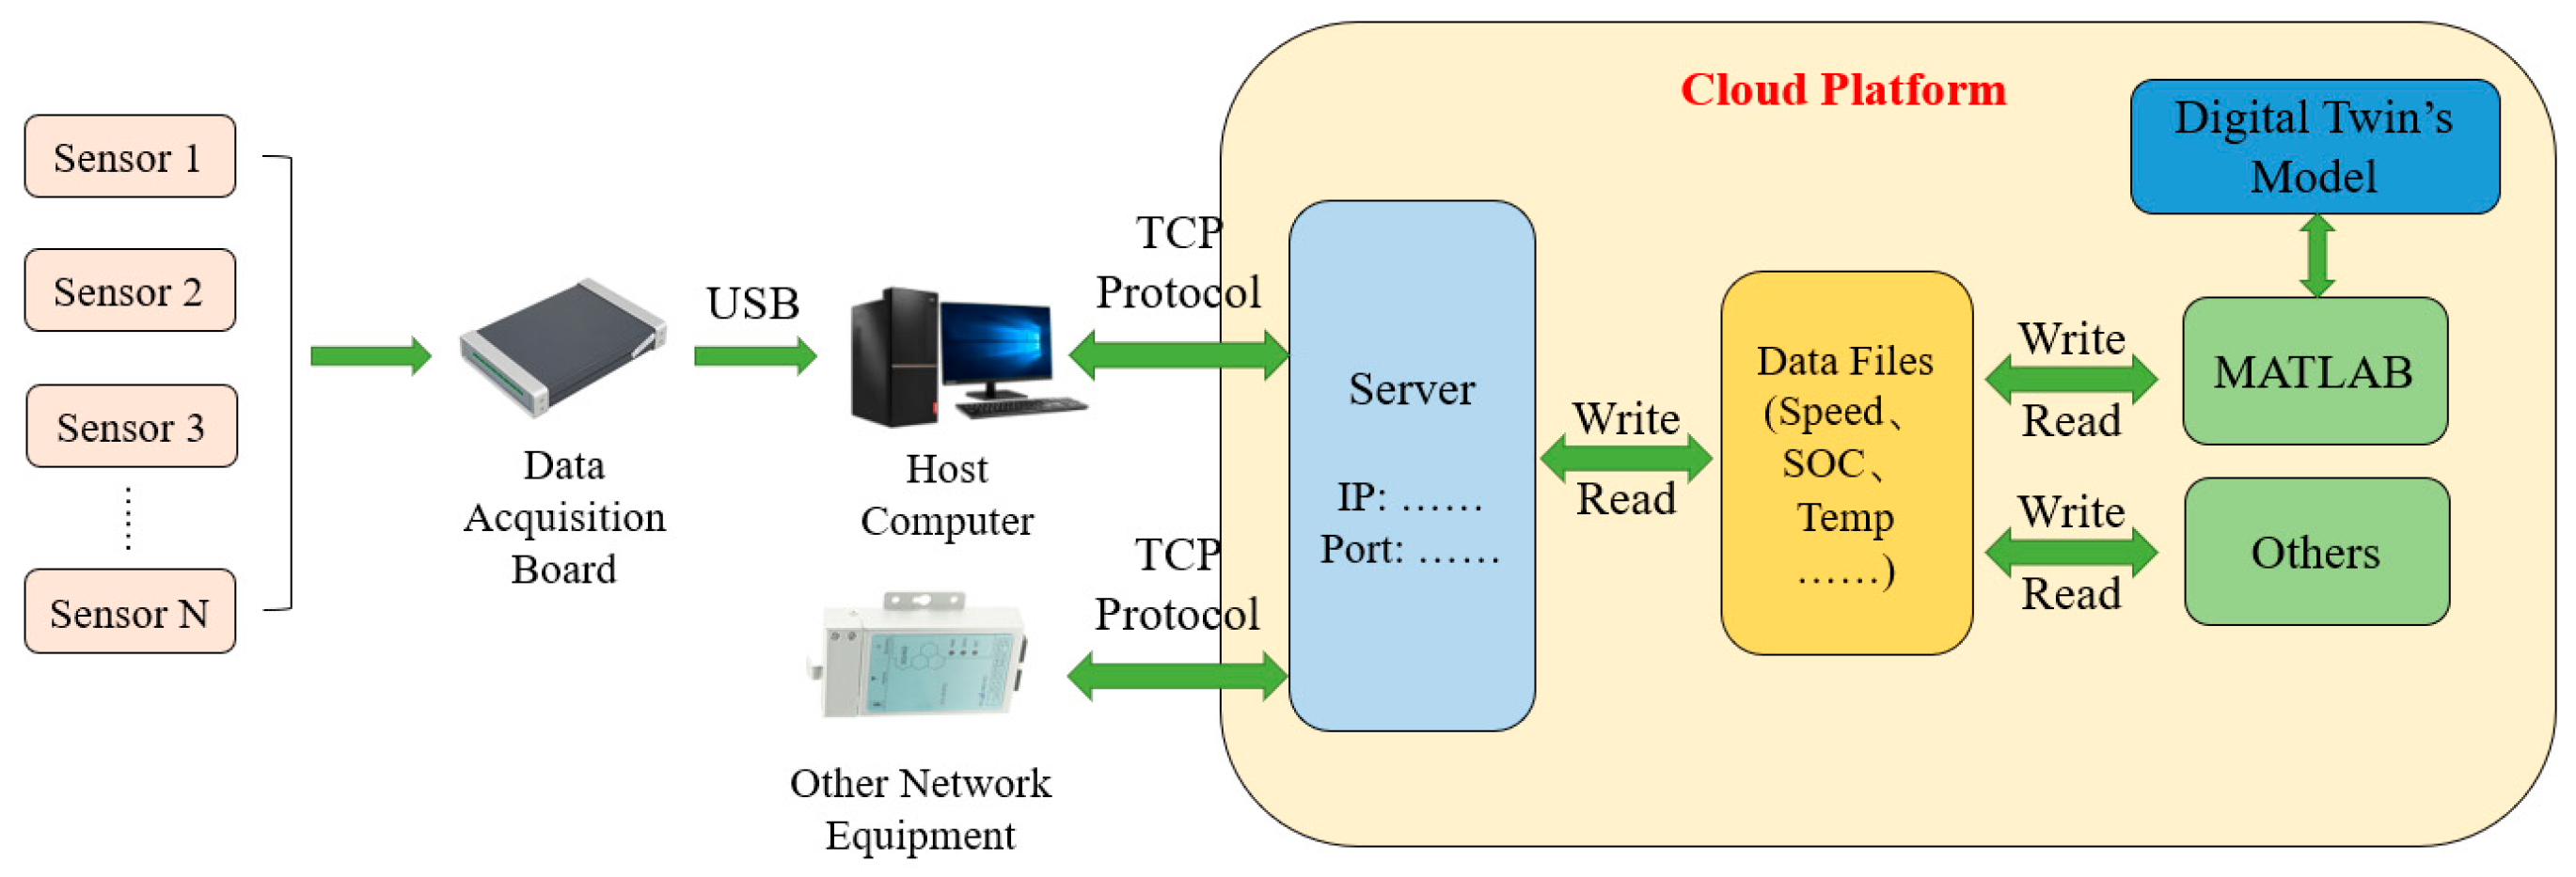
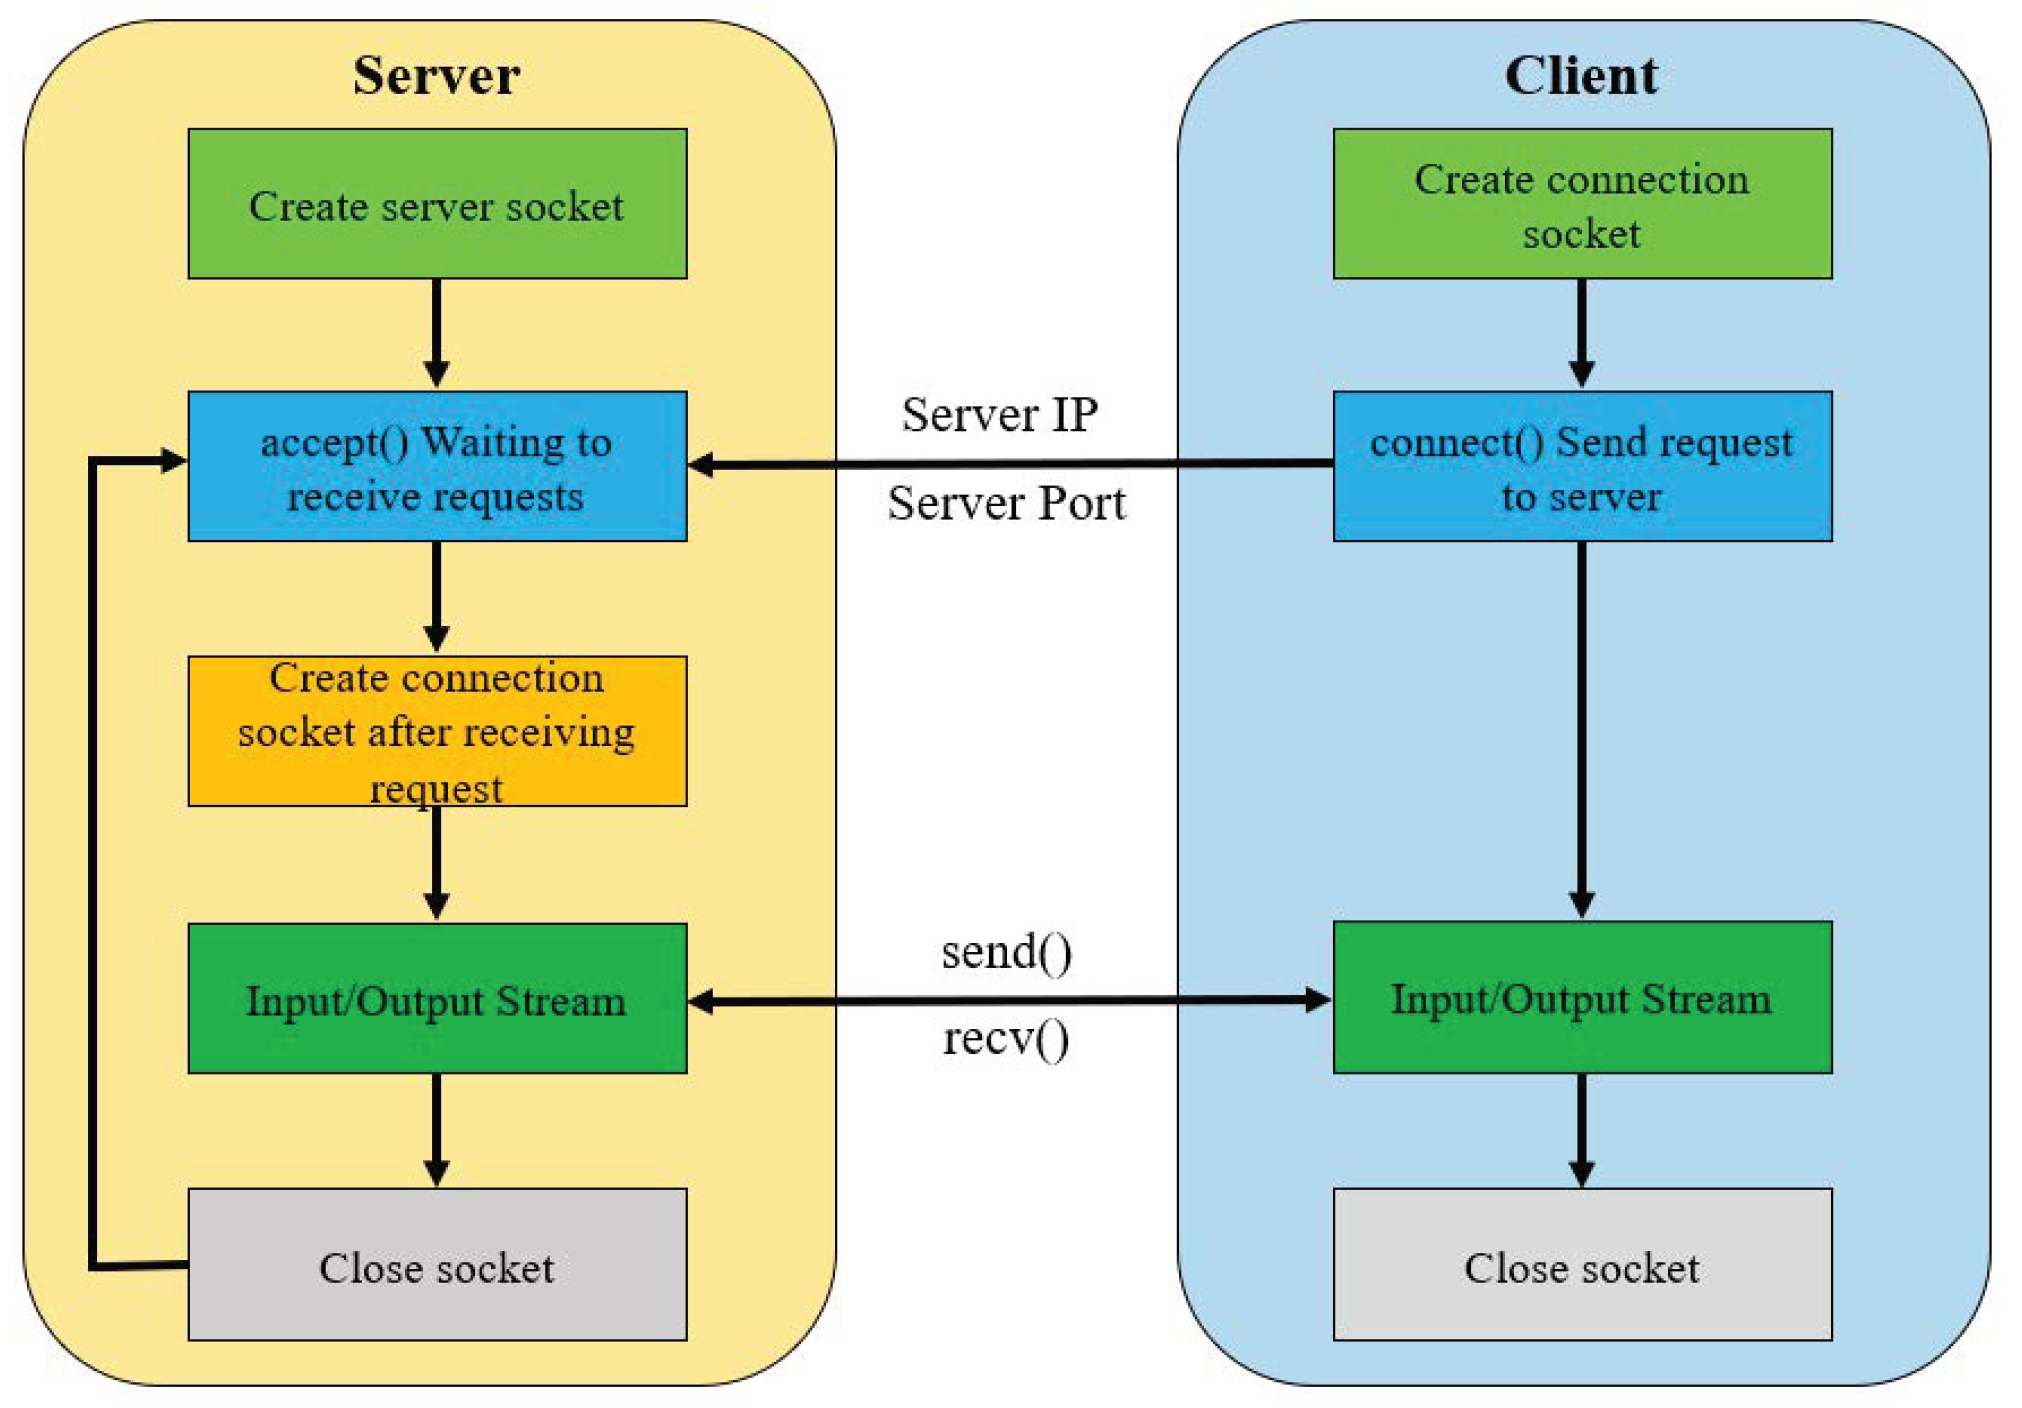
  • This study deploys a cloud server based with Transmission Control Protocol (TCP) to achieve real-time data acquisition and interaction between the real solar car and the DT system.

2. Architecture of the DT System of Solar Car

The DT system architecture of a solar car contains four layers: physical layer, connection layer, virtual layer and service layer, and the composition architecture is shown in Figure 1.
The physical layer is composed of physical objects, and mainly includes the solar car, as well as the internal and external environment, and the various operational logics existing between them. Concretely, the external environment in this system includes weather conditions such as temperature, wind and light intensity, and road conditions such as road slope and road surface unevenness. The actual vehicle used in this system is the self-developed “Sun Shuttle III” four-seater solar car. The appearance and specifications are shown in Figure 2 and Table 1, respectively.
The connection layer is also named the data layer. In this system, in addition to the inherent data in the physical space, the data also includes multi-mode and multi-type operational data collected by various sensors in real time. Based on the 4G communication technology and TCP, the collected sensor data are finally transmitted to the cloud platform to realize the information interaction between physical and virtual entities.
The virtual layer, also called the model layer, refers to the DT model of the solar car, which is a virtual copy of the physical entity, including the mechanism model and the data-driven model. The model is jointly built by CarSim (an automotive system simulation software developed by Mechanical Simulation Corporation) and Simulink, which can run in parallel and interact with the real vehicle in real time. Among them, “dynamic” is the key characteristic of this model, which means the model needs to have the abilities of self-learning and self-adjustment.
The service layer, i.e., the functional application of the DT, includes but is not limited to dynamic monitoring, report output, data analysis, data storage, and algorithm optimization. After the DT model runs in simulation, it can perform real-time monitoring of the real vehicle, driving strategy optimization and energy consumption prediction, etc.

3. Construction of the DT Model

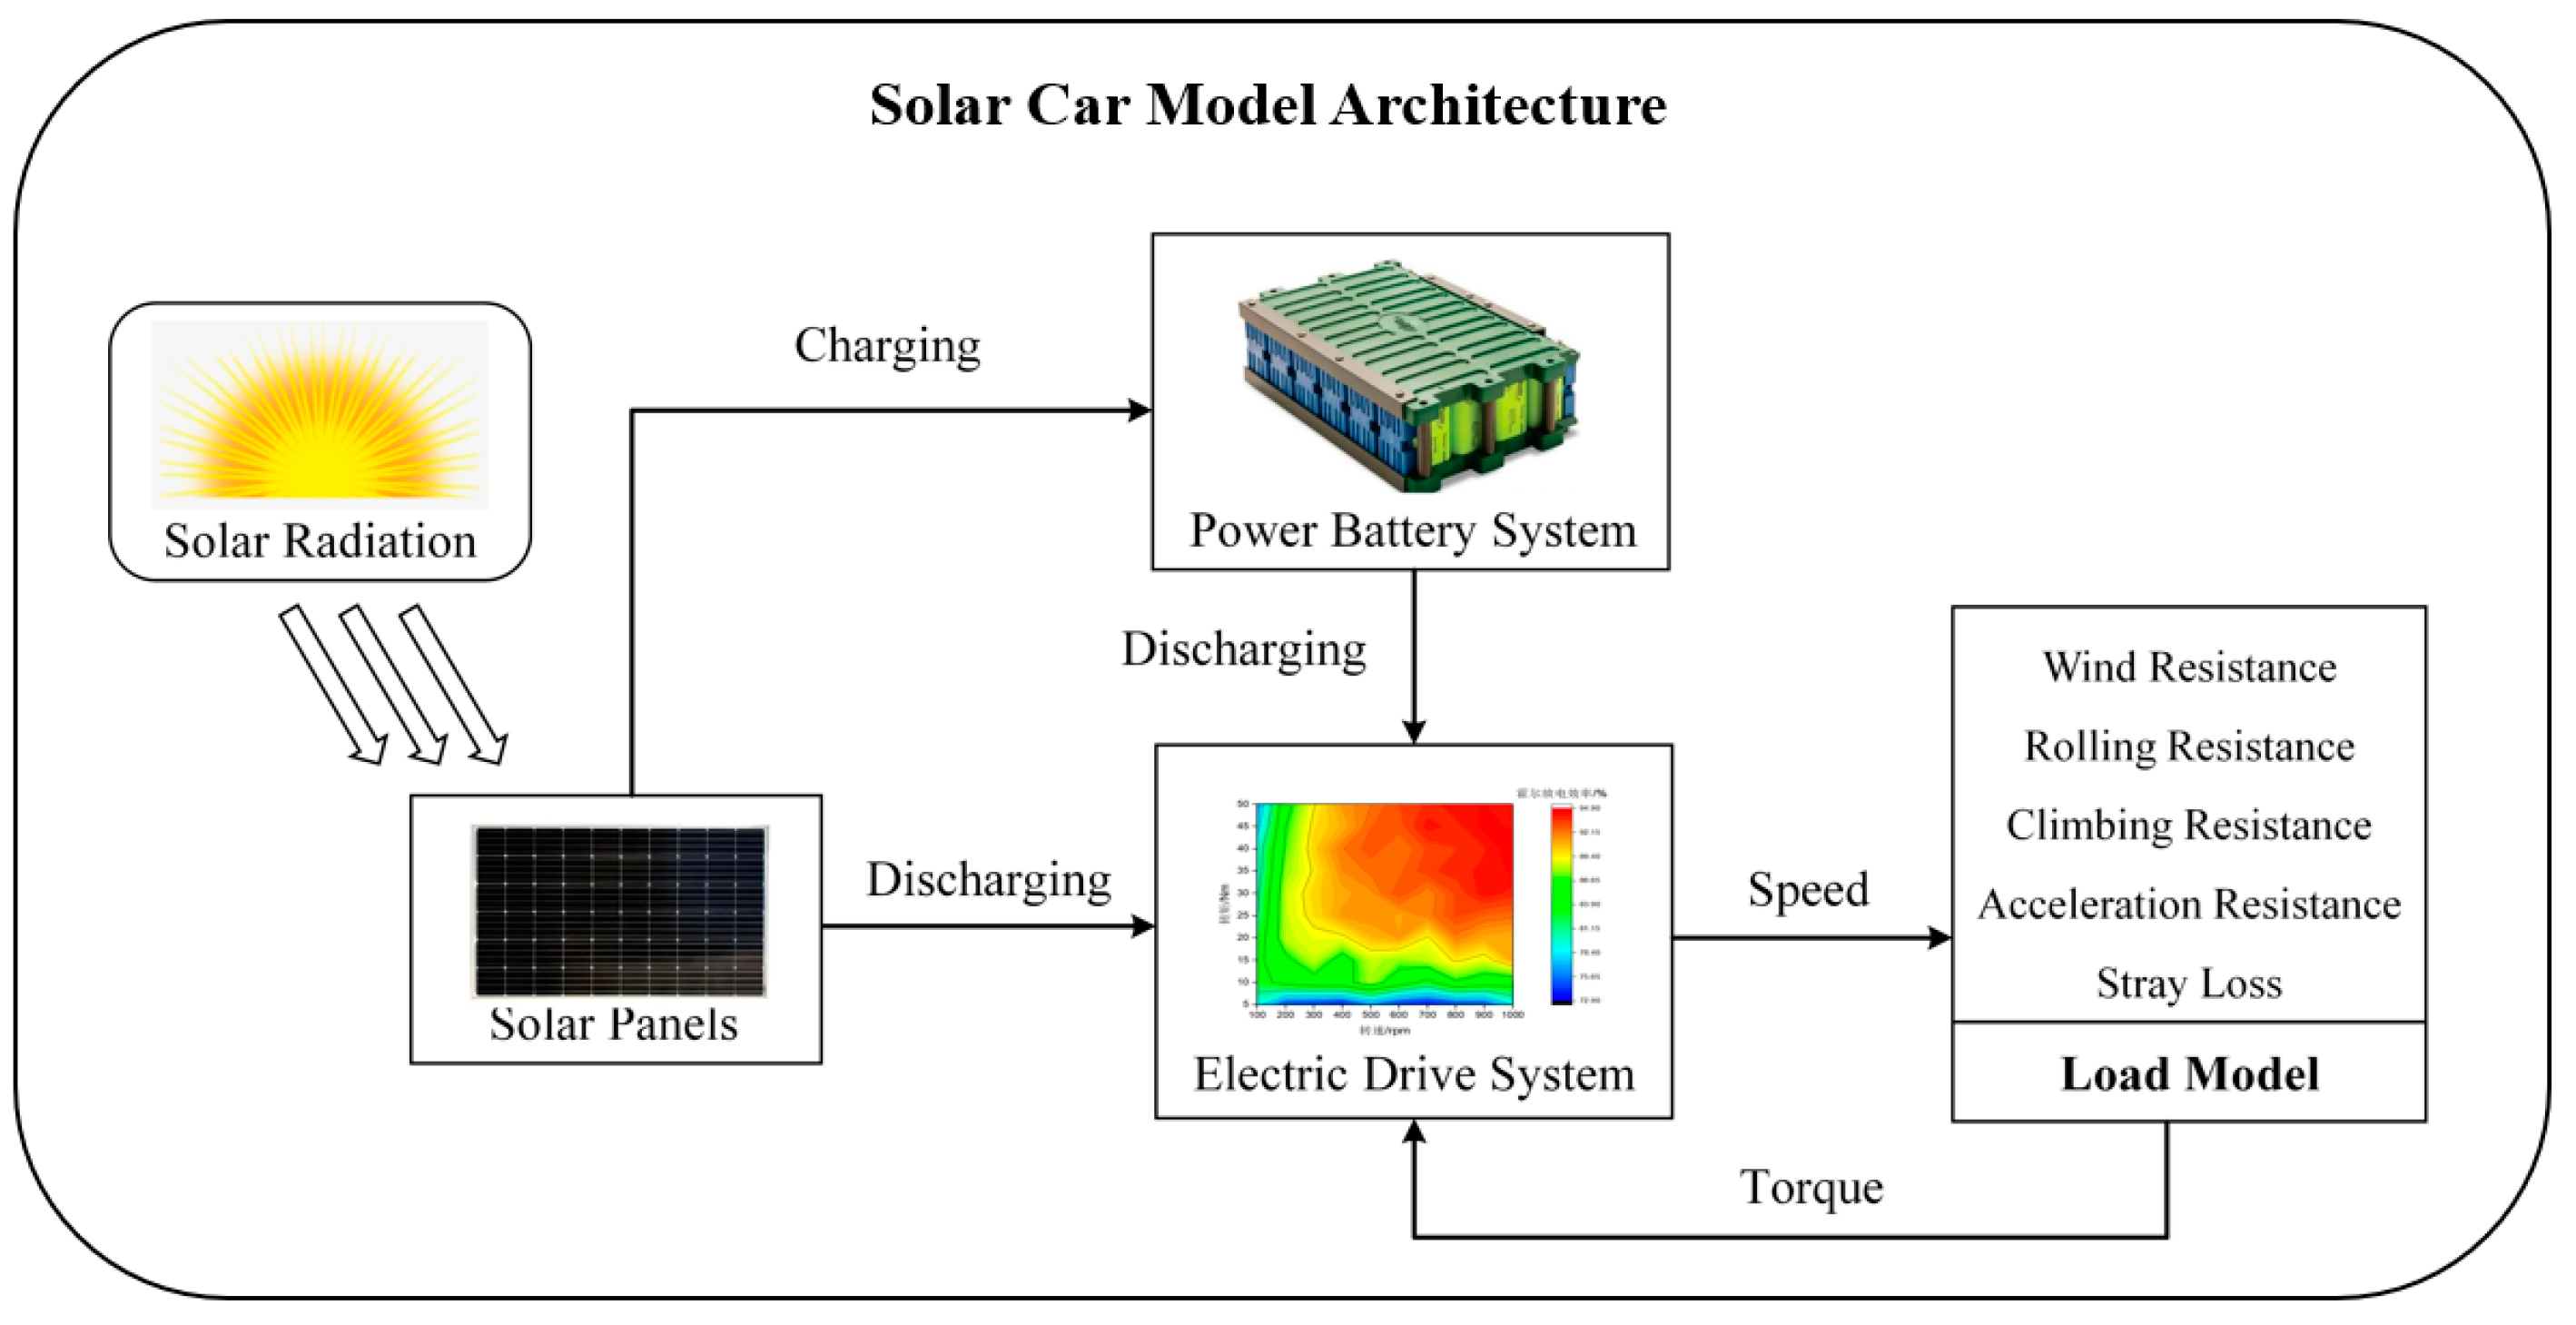
3.1. Solar Car Modeling Ideas

Solar cars are generally composed of five parts: power battery system, electric drive system, steering system, braking system, and driving system. The main difference from pure electric vehicles is the addition of photovoltaic cell arrays and a solar inverter to the power system, in addition to the conventional power battery pack [34,35].
One-to-one mapping modeling of solar cars is too difficult to achieve and would also significantly reduce the operational efficiency. Accordingly, the DT is performed for the energy consumption of the real vehicle to maximize the mapping of the energy flow and consumption on the basis of ensuring efficiency and feasibility. The overall modeling framework is shown in Figure 3. The solar panels receive solar radiation and are excited to generate electrical energy. The generated electrical energy will give priority to driving the solar car, and the remaining part will charge the power battery system. The electric drive system drives the solar car by motor and receives the torque demand from the load model. The load model includes windward resistance, rolling resistance, hill climbing resistance, acceleration resistance and stray losses [36,37].
In addition to the internal mechanism and response to the external environment, the DT model should include the geometric model describing the physical object appearance dimensions and composition style [38,39]. The geometric model of this solar car was first constructed by SolidWorks, then imported into CarSim in parts, and finally integrated to complete the geometric model.

3.2. Mechanism Modeling: PV Cell and Electric Drive System

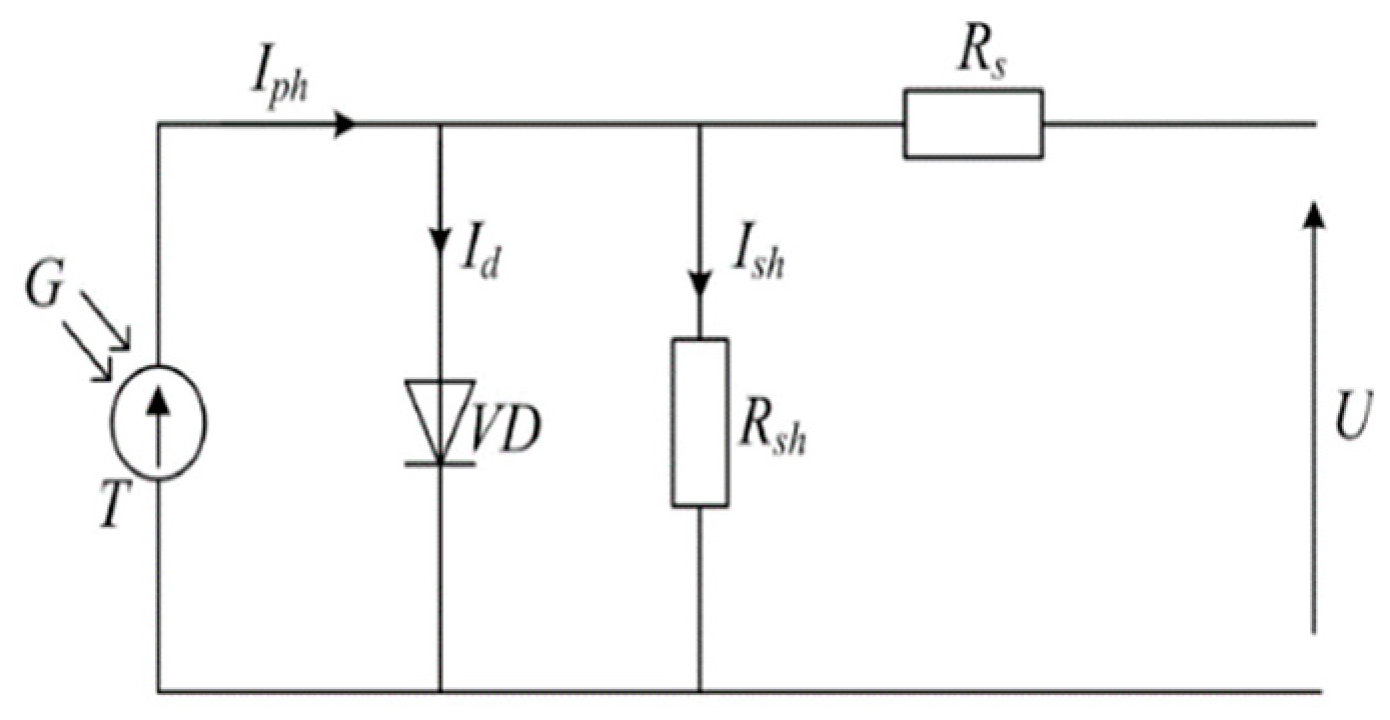
3.2.1. Photovoltaic Cell Model

The output characteristics of photovoltaic (PV) cells are similar to those of semiconductor diodes, where the current varies exponentially with voltage when light is available. The photogenerated current is regarded as a constant current source. The material body resistance and the P-N junction cross boundary area carrier load and contact resistance are equivalent to the series resistance Rs. The leakage current at the edge is equivalent to the shunt resistance Rsh, and the equivalent circuit of a single photovoltaic cell is shown in Figure 4.
The PV cell output current expression is given by the following equation:
I = I p h I 0 { e x p [ q ( U + I R s ) A k T ] 1 } U + I R s R s h
where Iph is the photogenerated current; I0 denotes the saturation dark current (reverse saturation current) of the PV cell in the absence of light; q is the electronic charge, 1.6 × 10⁻¹⁹ C; U is the voltage on the load resistance, V; Rsh is the shunt resistance, Ω; Rs is the series resistance, Ω; k is the Boltzmann constant, 1.38 × 10⁻²³ J/K; T is the cell temperature, K; A is the ideality factor of the diode, and takes the value of 1.2. The photogenerated and reverse saturation currents are solved by the following equations:
{ I p h = α ( T T r ) + I s c I r o I r I 0 = I r s ( T T r ) 3 e x p [ q E g A k ( 1 T r 1 T ) ]
where α is the short-circuit current temperature coefficient and takes the value of 1.06 × 10⁻⁵ A/K; Tr is the ideal reference operating temperature, 298.15 K; Isc is the solar panel short-circuit current, and Ir is the actual light intensity; Iro is the ideal light intensity, 1000 W/m2; Irs is the saturation current; Eg is the forbidden band width of the semiconductor material, taken as 1.1.
In the actual PV cell, the Rsh resistance value tends to infinity, so the third term on the right side of Equation (1) can be equated to 0, while the PV module is a multi-piece series-parallel package. The mathematical model of the PV cell array is as follows:
I = m I p h m I 0 { e x p [ q ( U + I R s ) n A k T ] 1 }
where m is the number of cells in parallel in the module and n is the number of cells in series in the module.

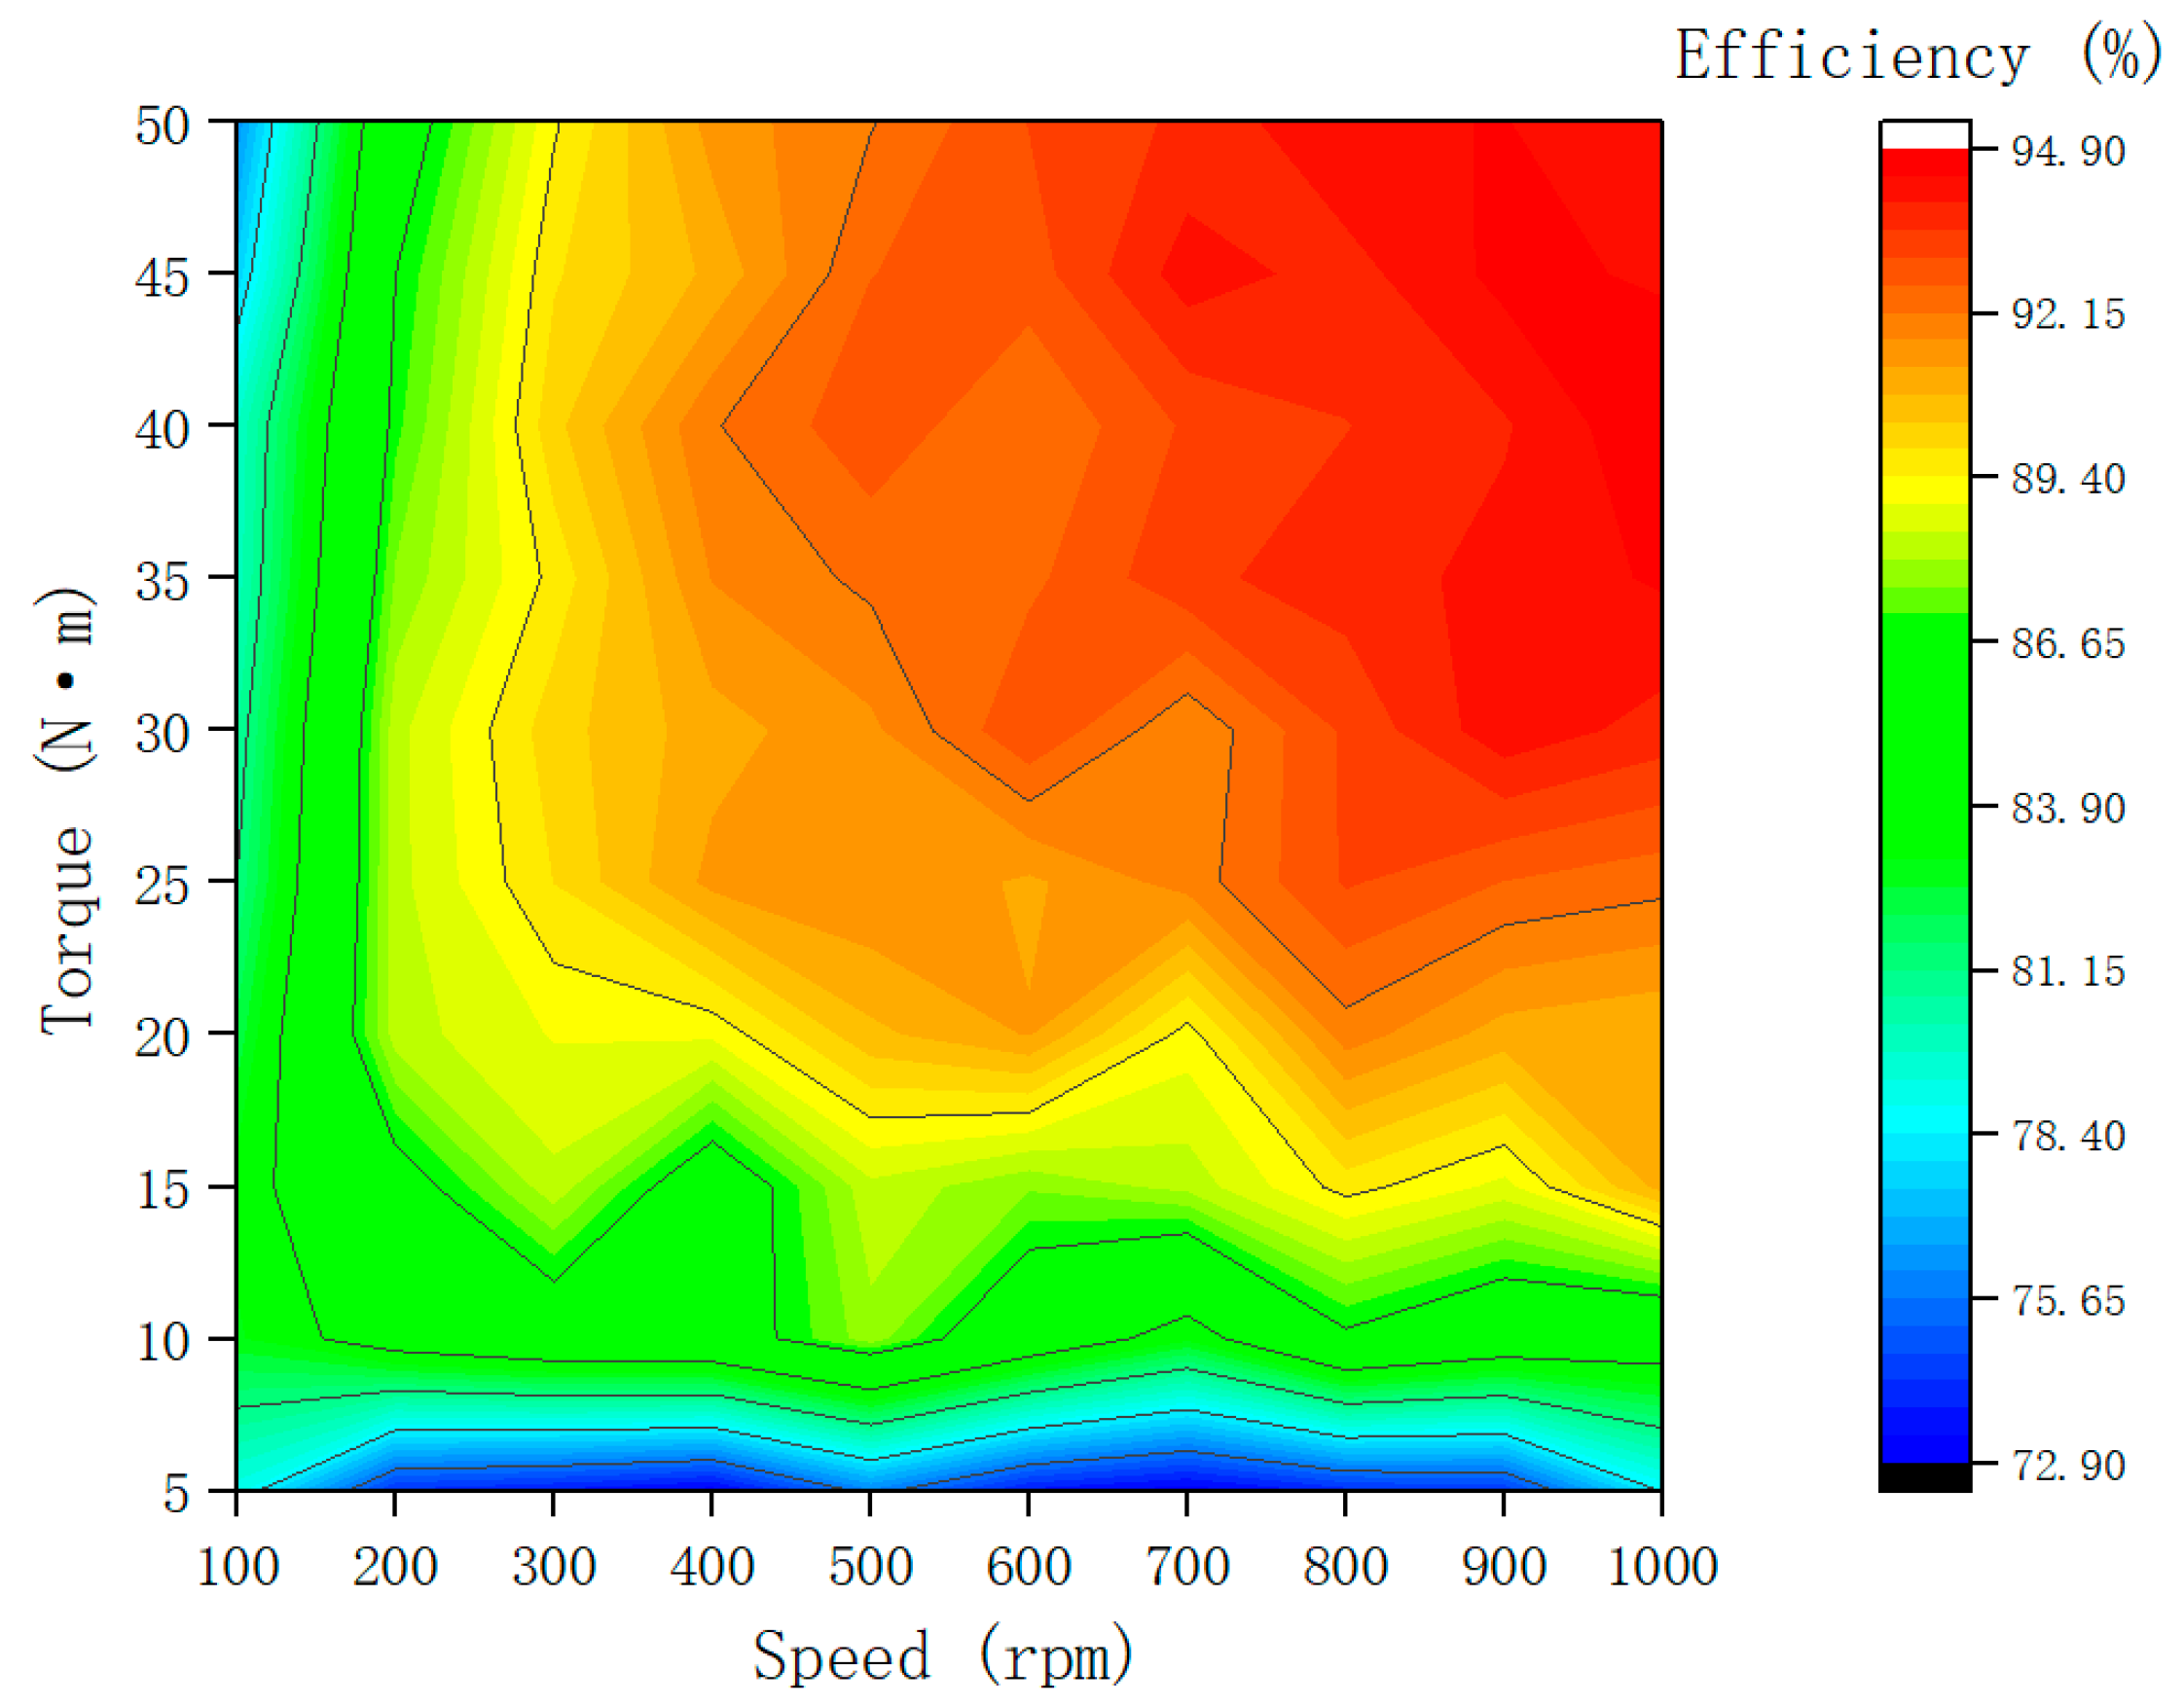
3.2.2. Drive Motor Model

The drive motor—named the permanent magnet synchronous hub motor—of the solar car is modeled by using mathematical equations and table look-up methods. The relationship between accelerator pedal opening and output torque refers to the following equation:
T o u t = { β 80 , 0.02 β 1 0 , 0 β 0.02
where 80 represents the maximum torque in Nm that this drive motor can provide, and β is the throttle pedal opening, whose value range is [0, 1]. The motor output power and output current are calculated by the following equation:
{ P o u t = T o u t W I o u t = P i n U
where W is the motor rotating speed, Pout is the motor output power, Pin is the input power, and U is the input voltage. The motor efficiency is calculated by the following equation:
η = P o u t P i n = f ( T , W )
where η is the motor efficiency as a function of motor rotating speed W and motor torque T. The motor is modeled using the look-up table module in Simulink, where the value of η is measured experimentally. The experimental motor efficiency MAP is shown in Figure 5.

3.3. Modeling of Power Battery Based on Data-Driven

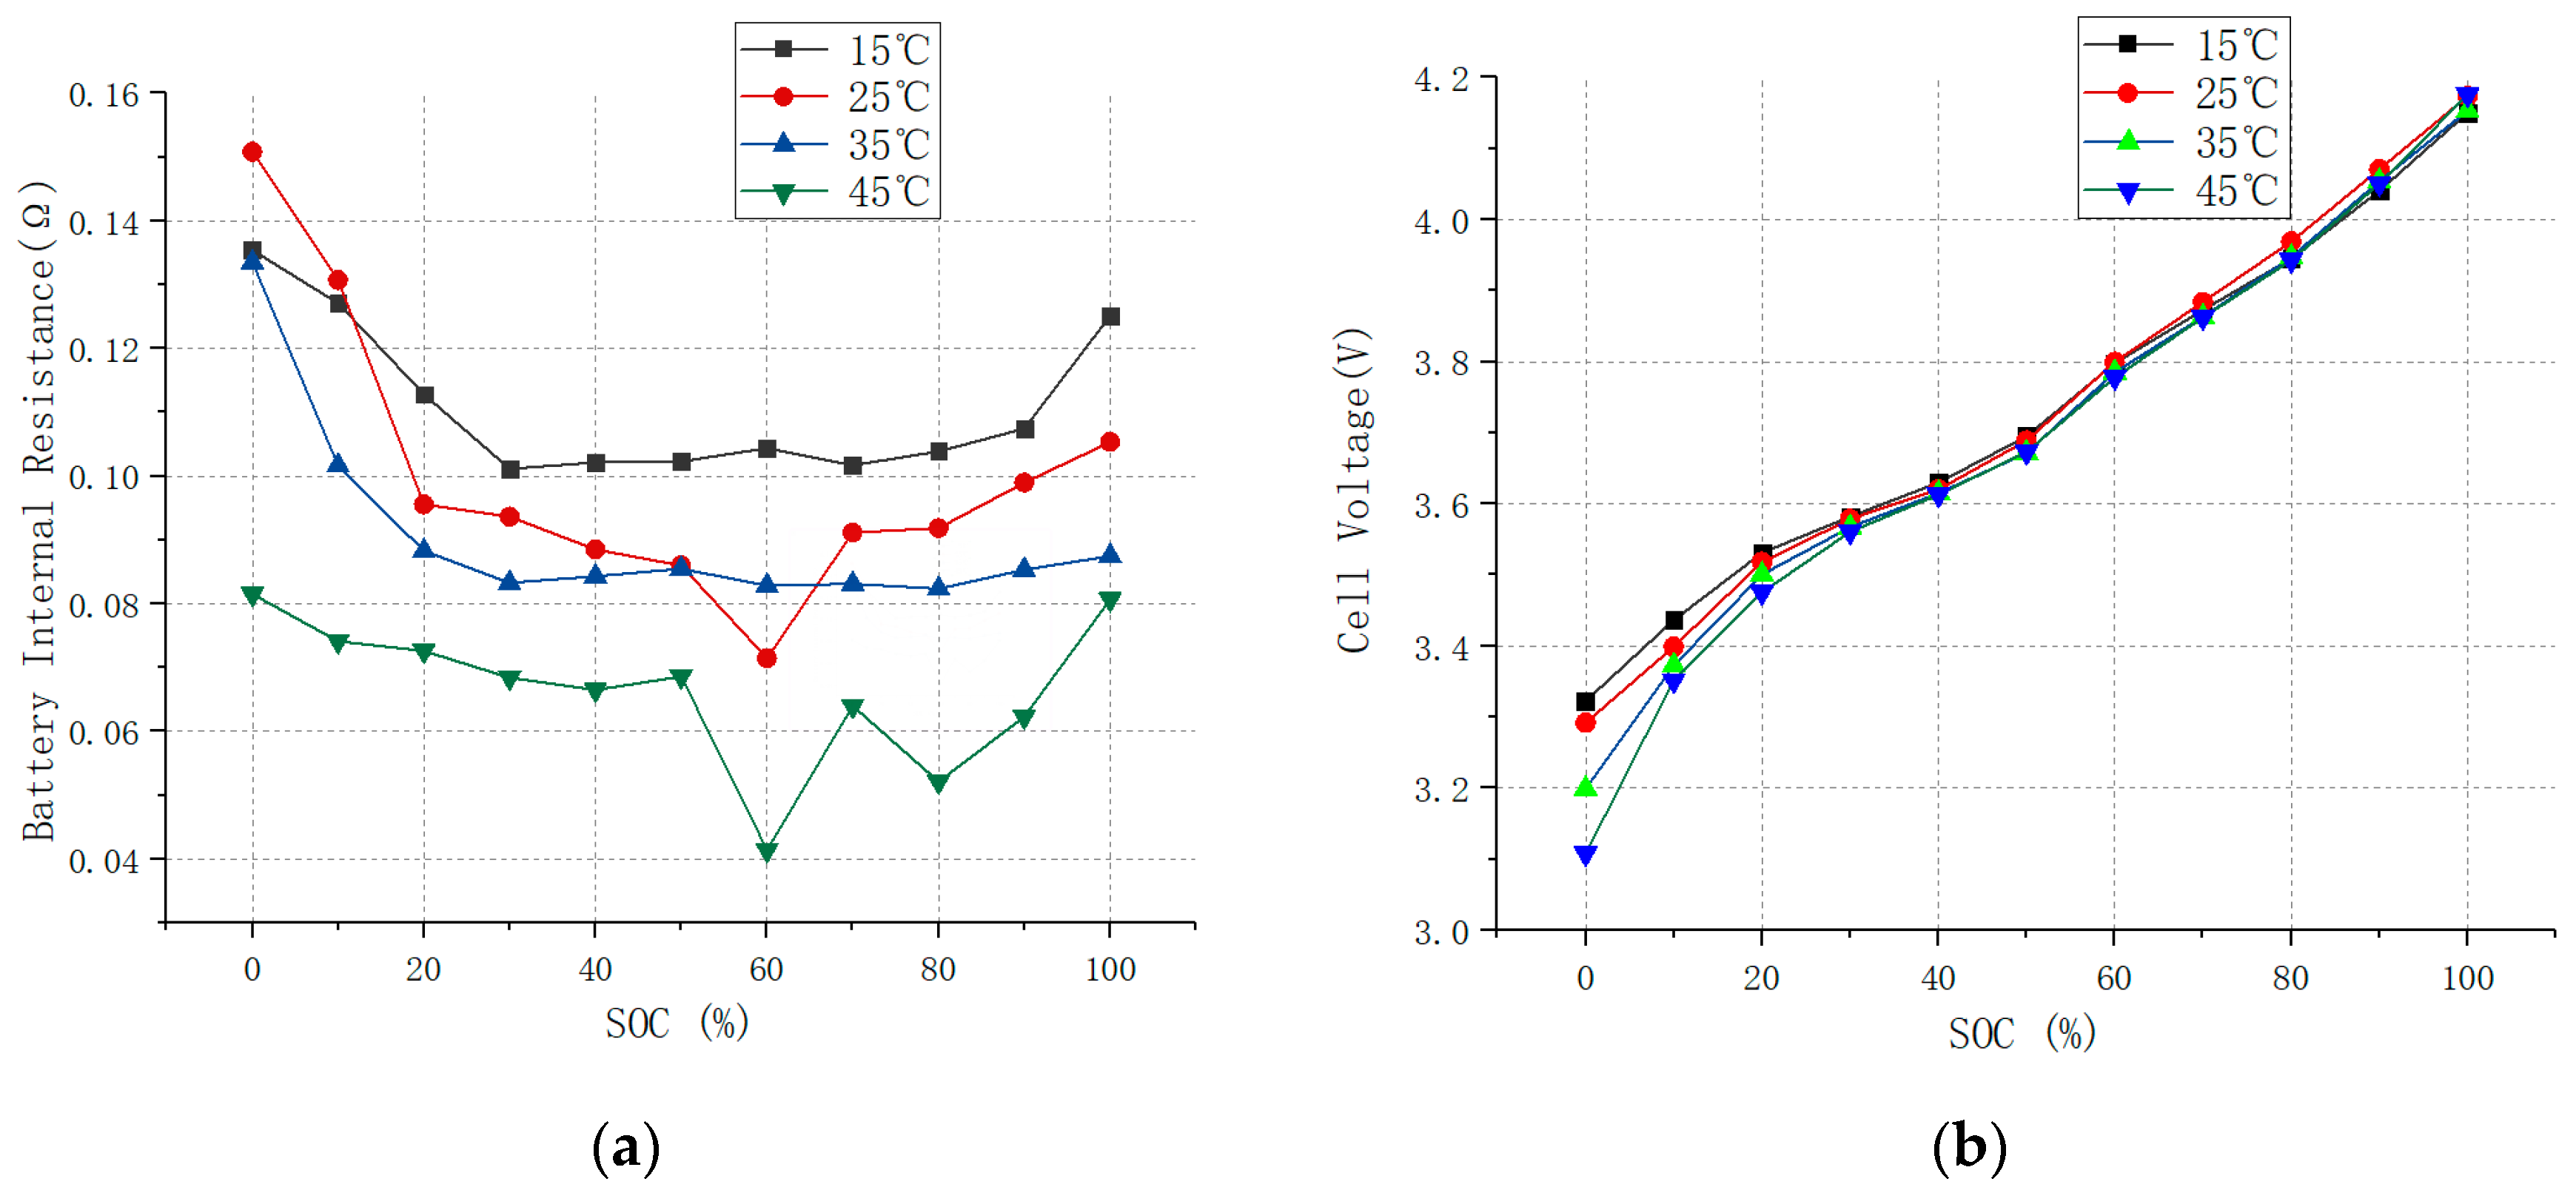
3.3.1. Power Battery Mathematical Model

The solar car power battery is a lithium-ion battery, and the basis of the battery modeling is to determine the characteristic functions of the electric potential and internal resistance of the lithium-ion battery, which are obtained based on the relationship of the battery state of charge value SOC (state of charge) variation [40,41]. This model includes three parts: calculation of available battery capacity, calculation of battery SOC value, and calculation of battery terminal voltage.
The available battery capacity is calculated by the following equation:
Q u ( t ) = Q 0 0 t λ I d t
where Qu(t) is the remaining available capacity at time t, Q0 is the initial capacity, λ is the charge/discharge efficiency, and I is the battery current. The SOC value is calculated by the following equation:
S O C ( t ) = S O C ( 0 ) 0 t λ I d t C N
where SOC(t) is the SOC value at time t, SOC(0) is the initial SOC value, and CN is the rated capacity of the battery. The battery terminal voltage is calculated by the following equation:
u ( τ , S O C ) = E ( τ , S O C ) I R ( τ , S O C )
where E(τ, SOC) denotes the open-circuit voltage as a function of temperature τ and SOC; R(τ, SOC) denotes the internal resistance of the battery as a function of temperature τ and SOC. The correspondence between R and E is obtained through experiments, as shown in Figure 6a,b below, respectively. It can be seen that it is difficult to establish the relationship between the terminal voltage of a lithium battery and its measurable parameters by pure mechanistic modeling, which includes temperature, voltage, current, internal resistance and SOC at the current moment. Therefore, the support vector machine (SVM) is introduced to solve this problem.

3.3.2. SVM-Based Data-Driven Modeling

From the previous section, it can be seen that the internal chemistry of the power cell is complex, with many influencing factors such as temperature uncertainty, aging conditions, and dynamic operating conditions, which is a highly nonlinear system [42]. In the face of this situation, a data-driven modeling approach based on SVM techniques is proposed to solve the current nonlinear problems and improve the prediction accuracy of the model. The temperature τ, voltage V, SOC value of the battery at the previous moment S, current I, and internal resistance R were selected as input variables, and the voltage at the battery terminal yi was the output. The sample points Xi at any moment i can be expressed as X i = [ S i 1 , τ i , V i , I i , R i ] .
By mapping each one with a nonlinear function Φ(x) to the high-dimensional feature space, and performing linear regression operations in the high-dimensional feature space, the effect of nonlinear regression in the original space can be obtained, and the regression estimation function f can be expressed as:
f ( x ) = ω ϕ ( x ) + b
where w is the normal vector of the optimal hyperplane, its dimension is the dimension of the feature space, and b is the threshold value.
For a given nonlinear sample set T = { ( x 1 , y 1 ) , ( x 2 , y 2 ) , , ( x i , y i ) } , x i R , y i R , the optimization problem is:
min ω , b 1 2 w 2 + C i = 1 l ( ξ i + ξ i ) s . t . { y i ω ϕ ( x i ) b ξ i + ε ω ϕ ( x i ) b y i ξ i + ε ξ i , ξ i 0 , i = 1 , 2 , , l C > 0
where ξi, ξi* is the relaxation factor, which represents the degree to which the group of samples does not satisfy the constraint. C represents the penalty factor, which indicates the strength of the constraint that some of the samples can be allowed not to be completely divided by the hyperplane intact, and ε is the insensitivity loss factor, which represents the error in the true value that can be allowed within some upper and lower range. The exact expression of the regression estimation function is obtained by solving it using the Lagrange multiplier method:
f ( x , α i , α i ) = i = 1 1 ( α i α i ) ϕ ( x i ) ϕ ( x j ) + b
where αi, αi* ≥ 0 is the Lagrangian multiplier. Using Wolfe’s pairwise theory and introducing the kernel function k ( x i , x j ) = ϕ ( x i ) ϕ ( x j ) , the final regression estimation function is shown in Equation (13):
f ( x , α i , α i ) = i = 1 l ( α i α i ) k ( x i , x j ) + b
The radial basis function is chosen as the kernel function because the radial basis kernel function performs better on highly nonlinear problems. The expression of the radial basis kernel function is:
K ( x i , x j ) = exp ( γ | x i x j | 2 )
where γ = 1 2 σ 2 is the kernel function parameter.

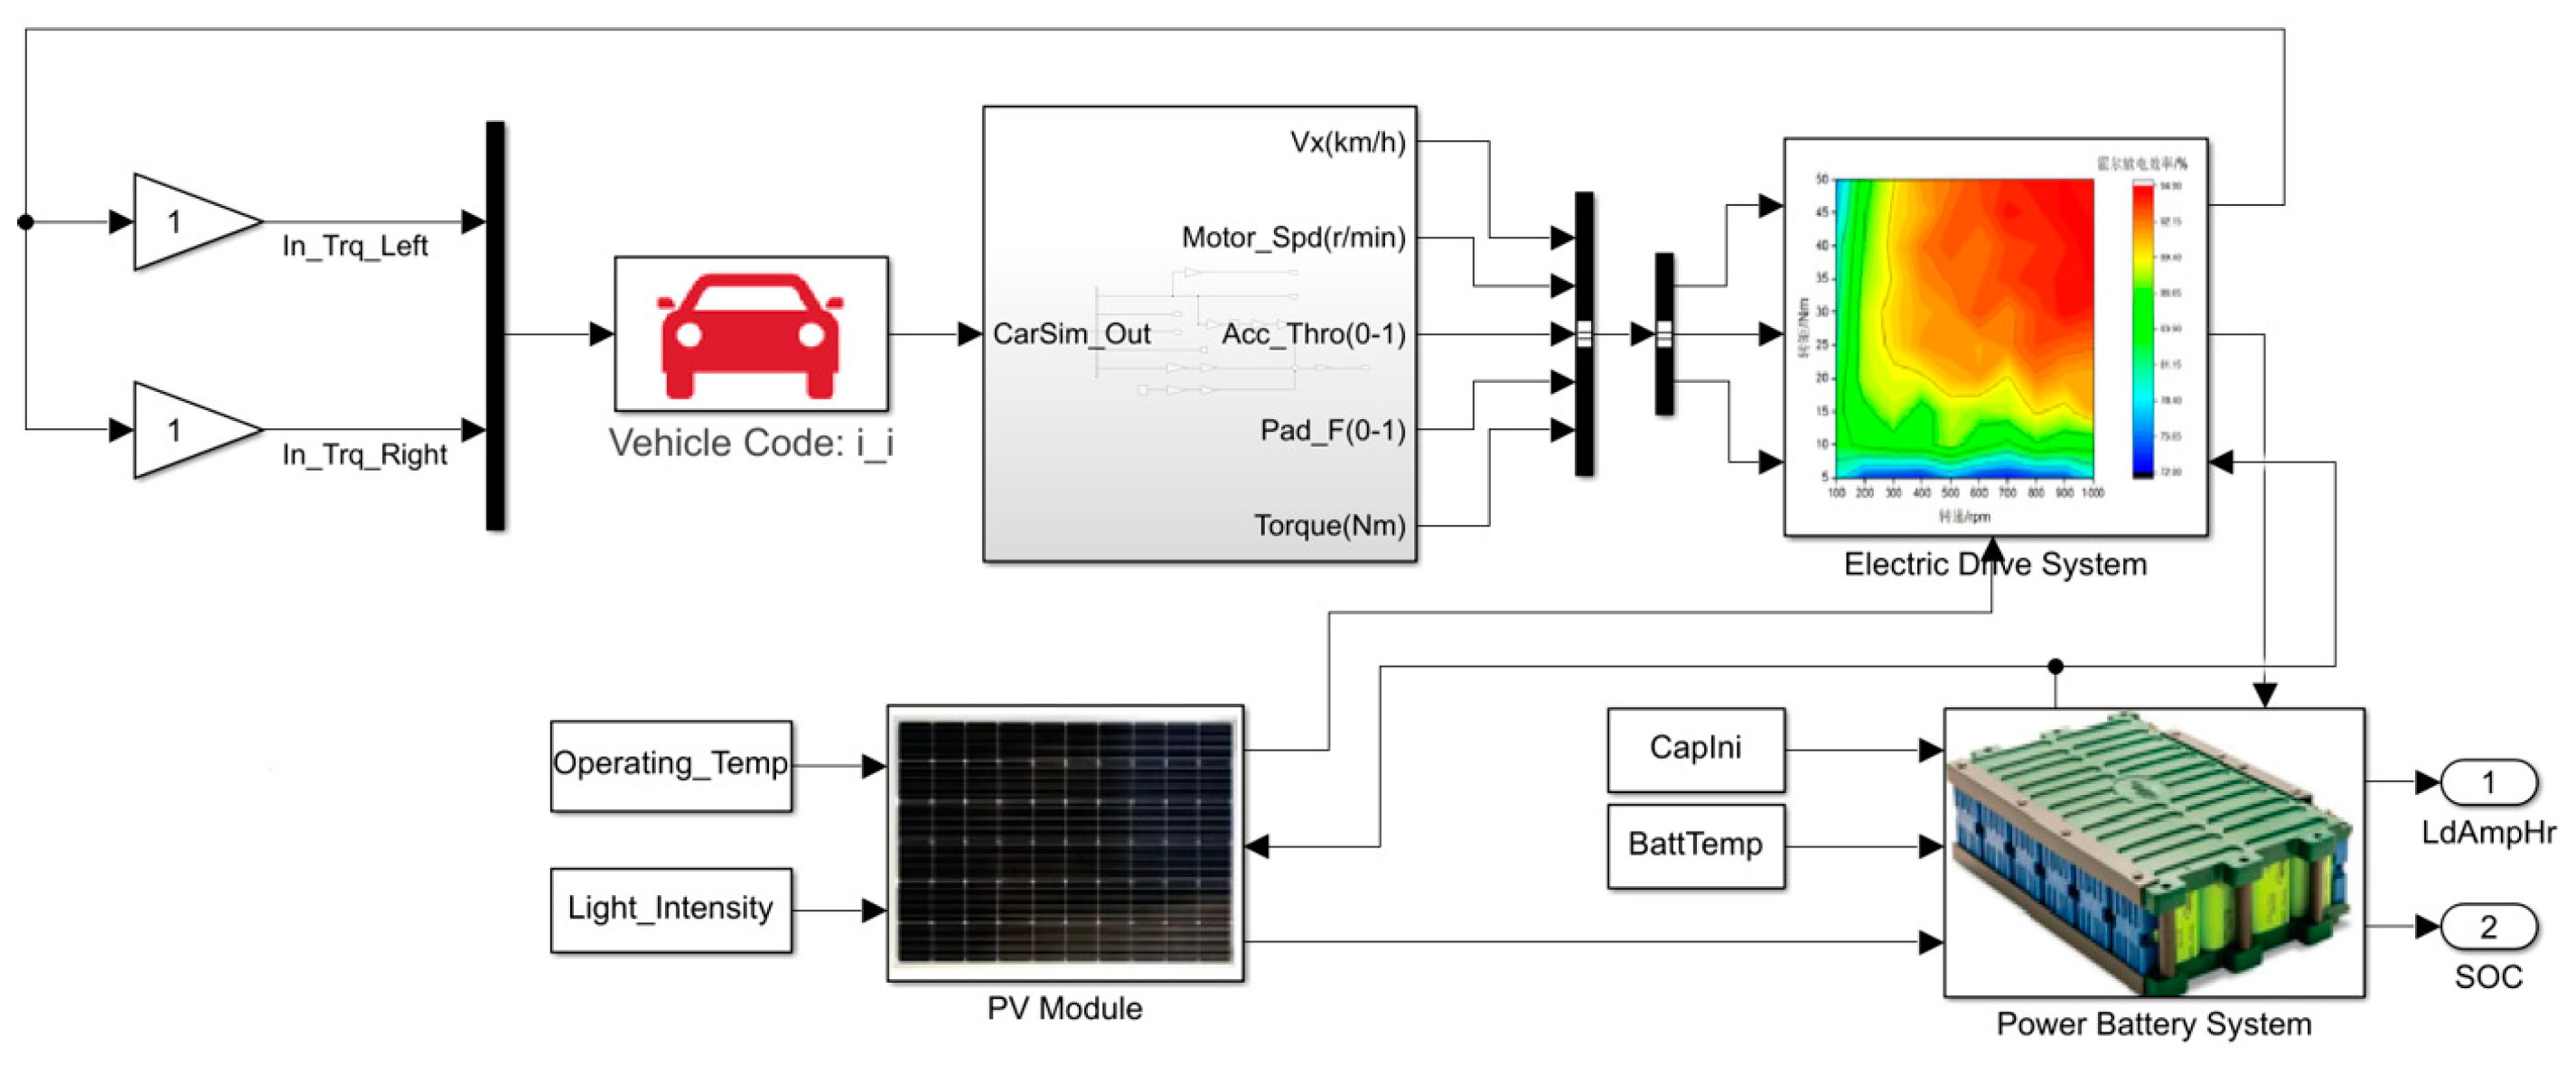
3.4. Complete Solar Car Model

The above power battery system, PV module and electric drive system were modeled in Simulink, while the rest of the vehicle was modeled in the CarSim software. The important parameter settings in CarSim are shown in Table 2. The built-in powertrain settings in CarSim were changed to external input access, i.e., the torque output from the drive motor in Simulink was used as the input to the powertrain here.
The joint simulation model of the whole vehicle is shown in the following Figure 7.

4. Validation and Discussion

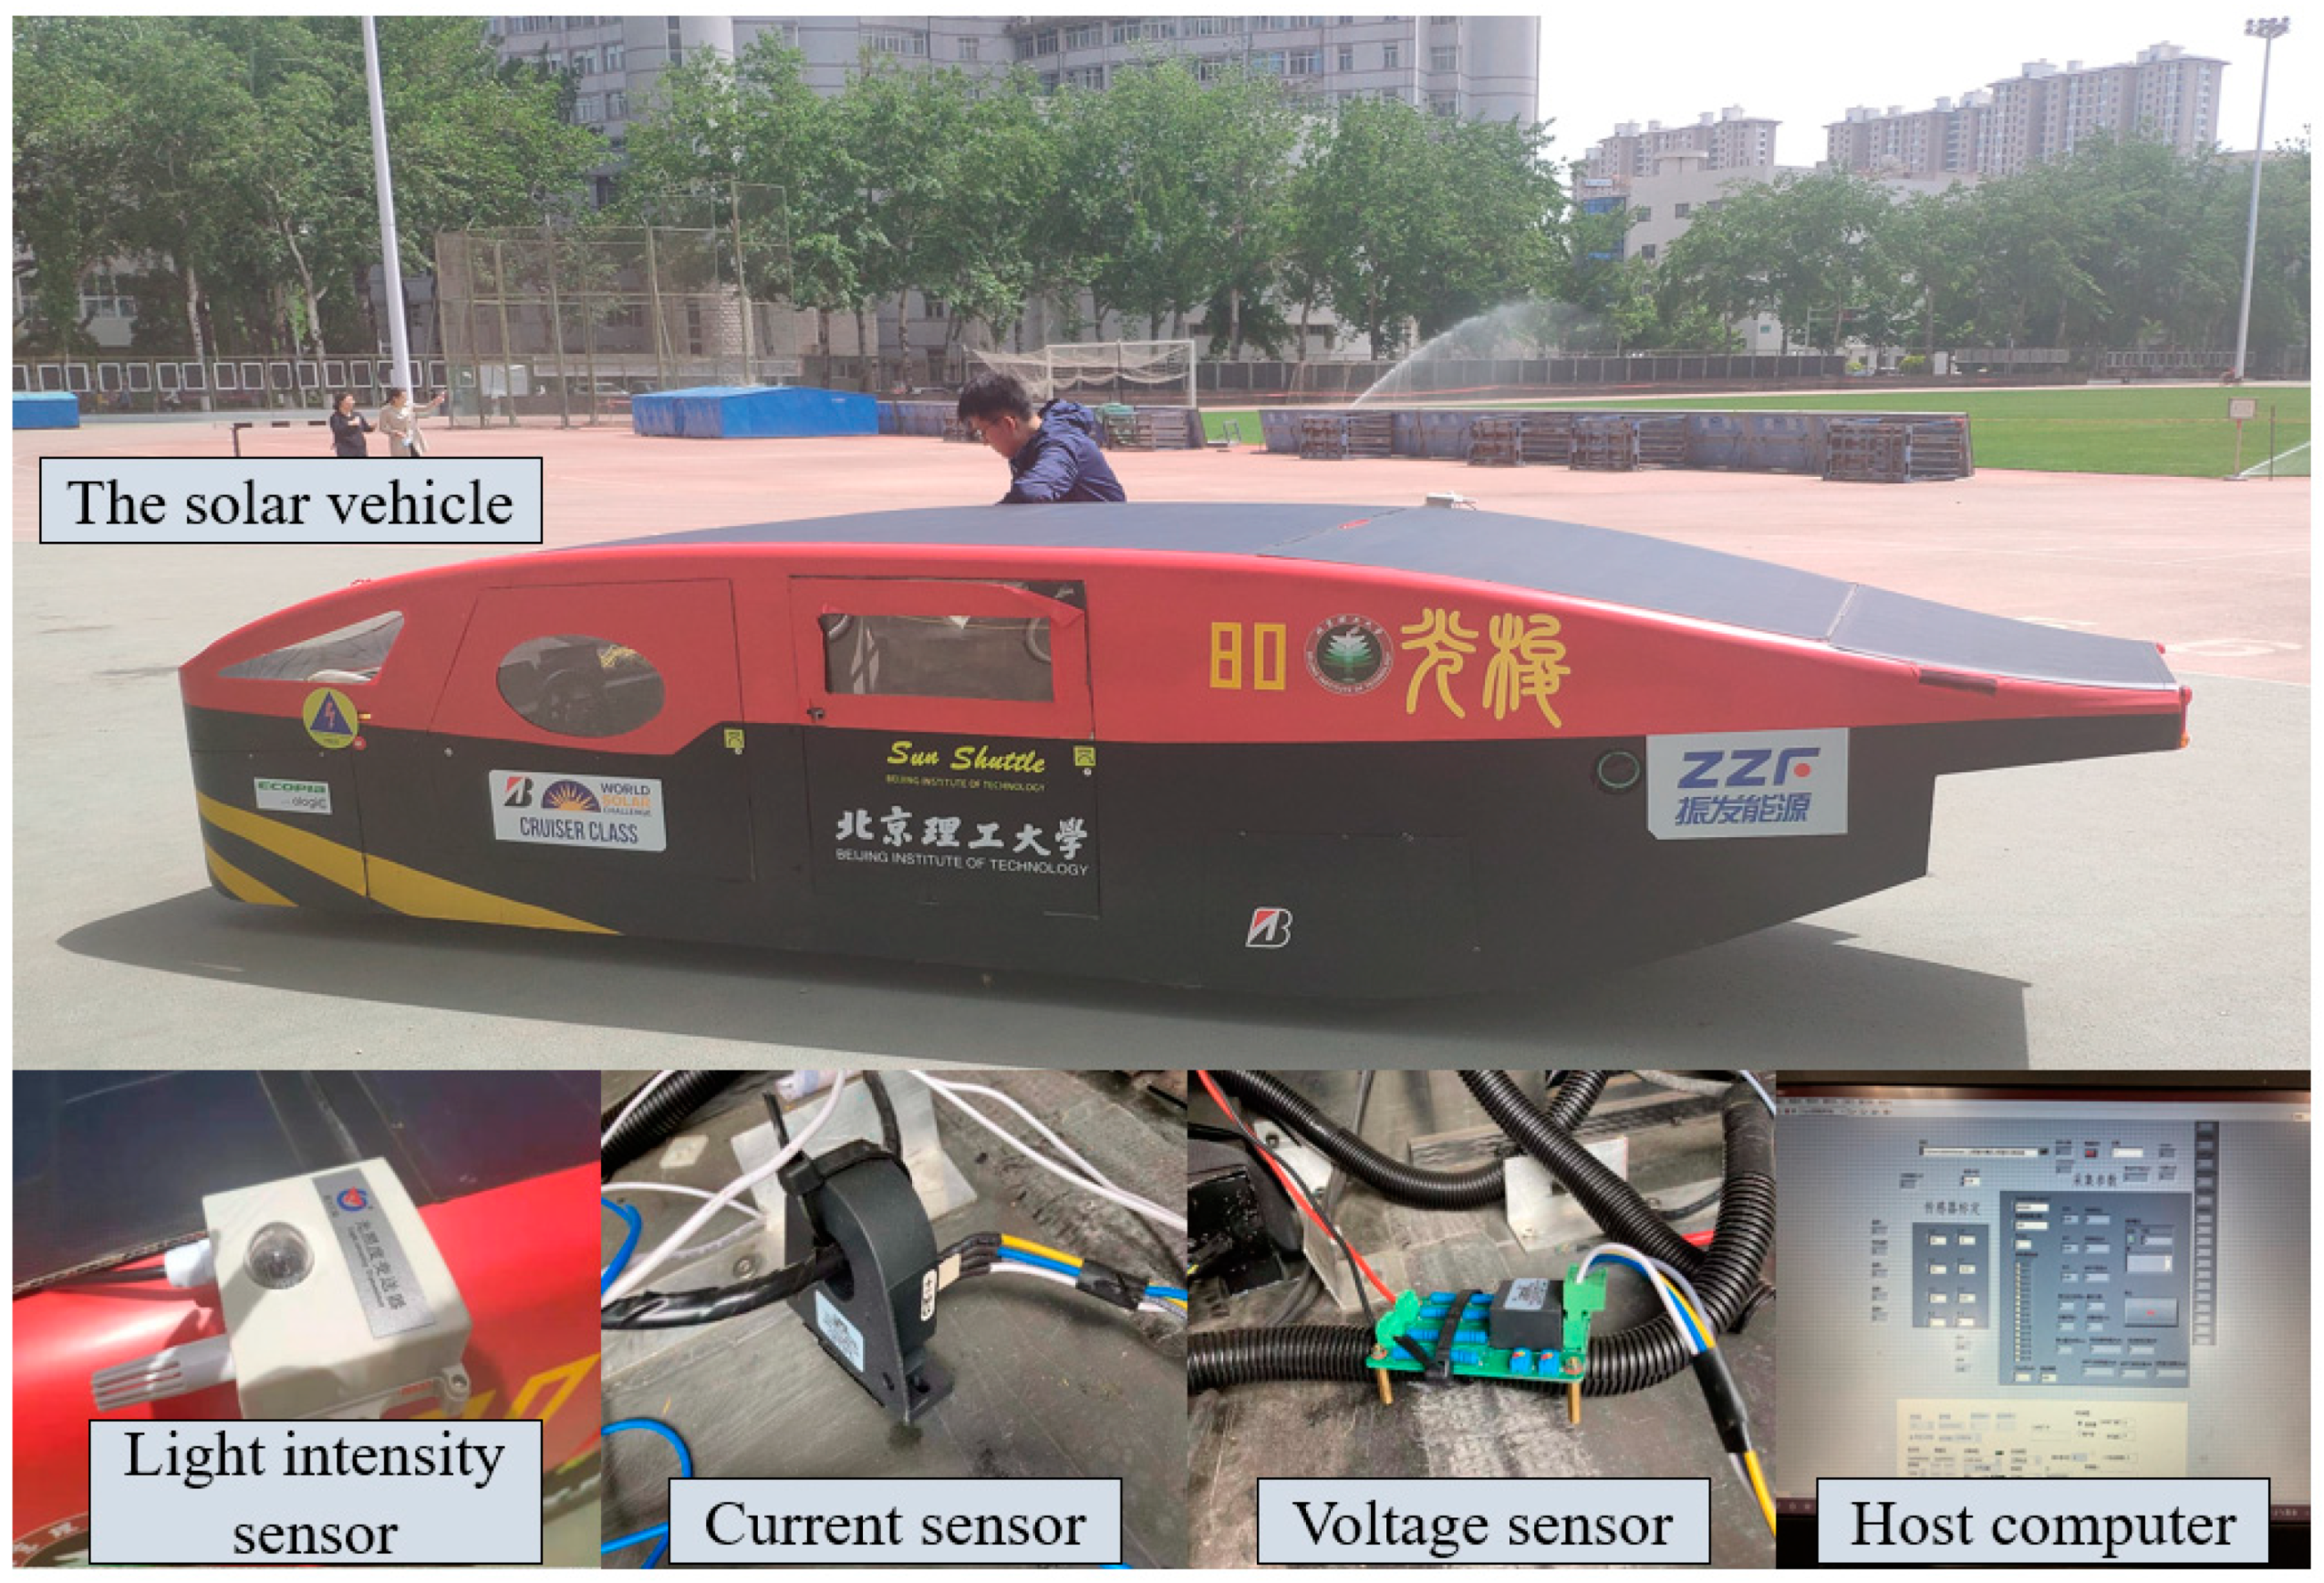
4.1. Construction of the Test Platform

4.1.1. Server Software Design

The most important feature of DT is the two-way communication between physical and virtual, and it is realized by establishing a cloud server based on TCP. In this process, the data acquisition card collects sensor signals and sends them to the host computer through a USB interface. The host computer then sends the data to the cloud server through TCP and the cloud server saves the data as data files. Finally, the data of the whole vehicle are read, updated, analyzed and calculated in real time by MATLAB to realize the information interaction between the virtual entity and the physical entity, real-time energy consumption calculation, data monitoring and other functions. The data transmission principle of the cloud platform is shown in Figure 8.
The cloud server uses the Windows system; hence, this system uses socket programming under Windows to establish a server in the cloud to receive data. Socket is the handle of a communication chain to describe the IP address and port, and applications of different computers can send requests to the network or answer network requests through socket. Socket is a network communication unit supporting TCP/IP and contains five basic information for conducting network communication: the protocol used for connection (TCP, UDP), the local host IP address (server intranet IP), the local remote protocol port (0~65535), the IP address of the remote host (client extranet IP), and the protocol port of the remote process. The communication model is shown in Figure 9.

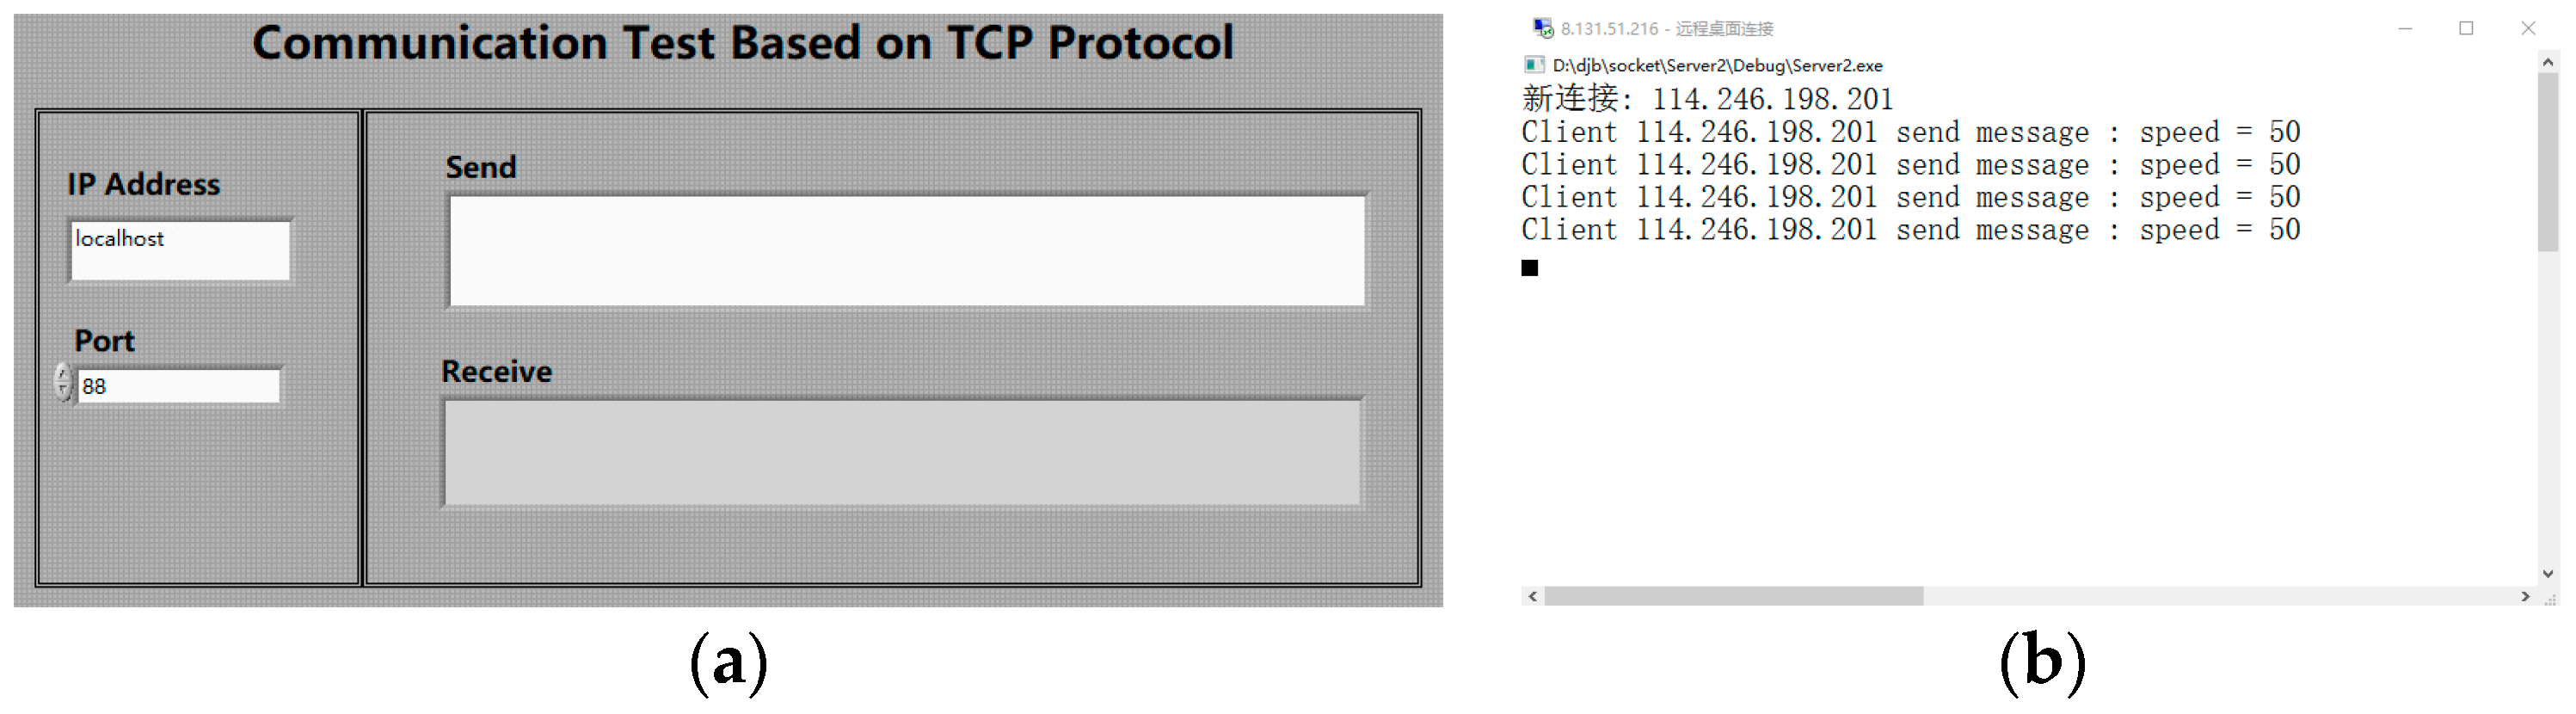
4.1.2. Data Transmission Test

For the data transmission test, the cloud server was connected through the remote desktop of the local computer, and the communication was carried out between the upper computer program and the cloud server. After the connection was successfully established, the upper computer would receive a prompt from the cloud server and then send the vehicle speed data, and at the same time, the data received by the server was observed, as shown in Figure 10. The test results show that the communication status is good.

4.1.3. Experimental Design

In order to verify the accuracy of the DT model and the real-time, stability and parallel operation capability of the DT, the solar car energy consumption as well as the solar panel power supply were tested. The real solar car and the DT have the same operating conditions, and the model parameters are updated by sensors to finally obtain the results of the real solar car operation and the simulation results of the DT. The specific test equipment is shown in Table 3 below, and the physical test platform built is shown in Figure 11.
In order to ensure the smooth conducting of the test, the test site is required to be in good road condition, capable of being driven on for a long time, and to not affect the normal vehicle driving; hence, the 400 m standard athletic track on campus was chosen as the test site. The test was conducted at 40 km/h cruising speed, with a cruising time of 30 min. The conditions on the test day are shown in Table 4, and the formula for calculating energy consumption is shown in Equation (15):
W = 0 t P d t = 0 t ( U I ) d t
where W denotes the energy consumed in t time in kWh; P denotes the solar car output power in W; U denotes the bus voltage in V; I denotes the bus current in A; t denotes the time in hours.

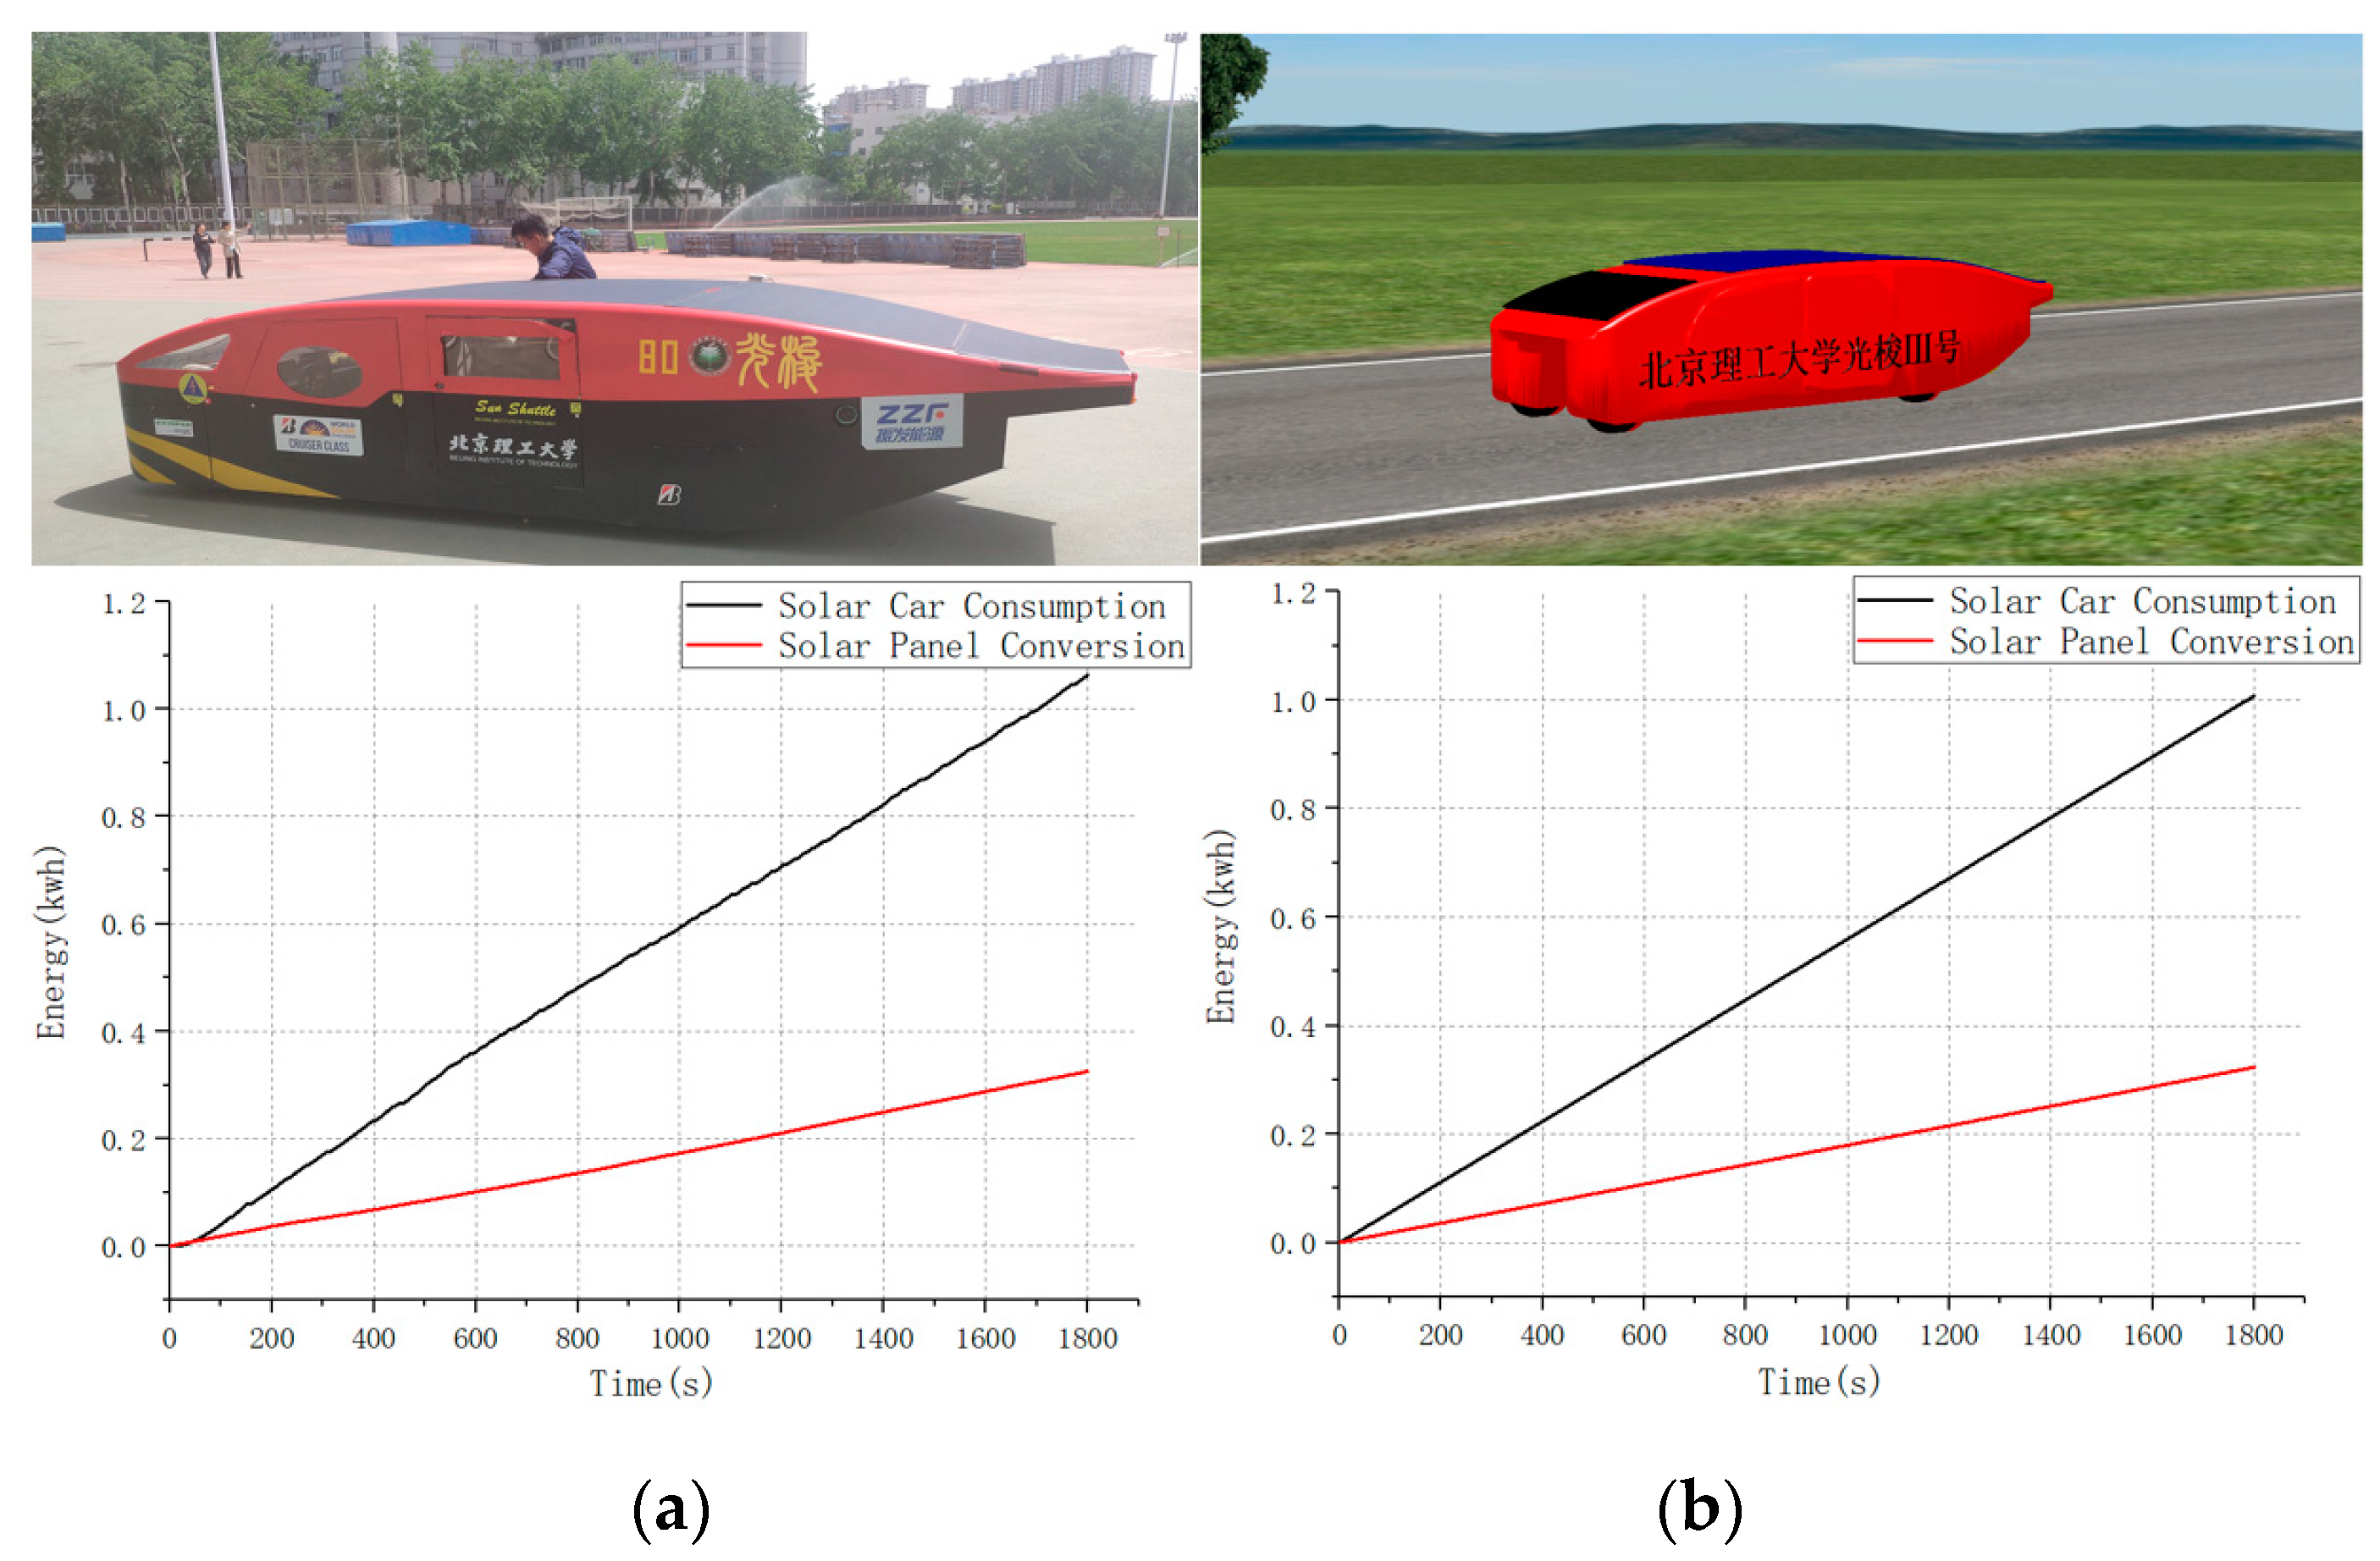
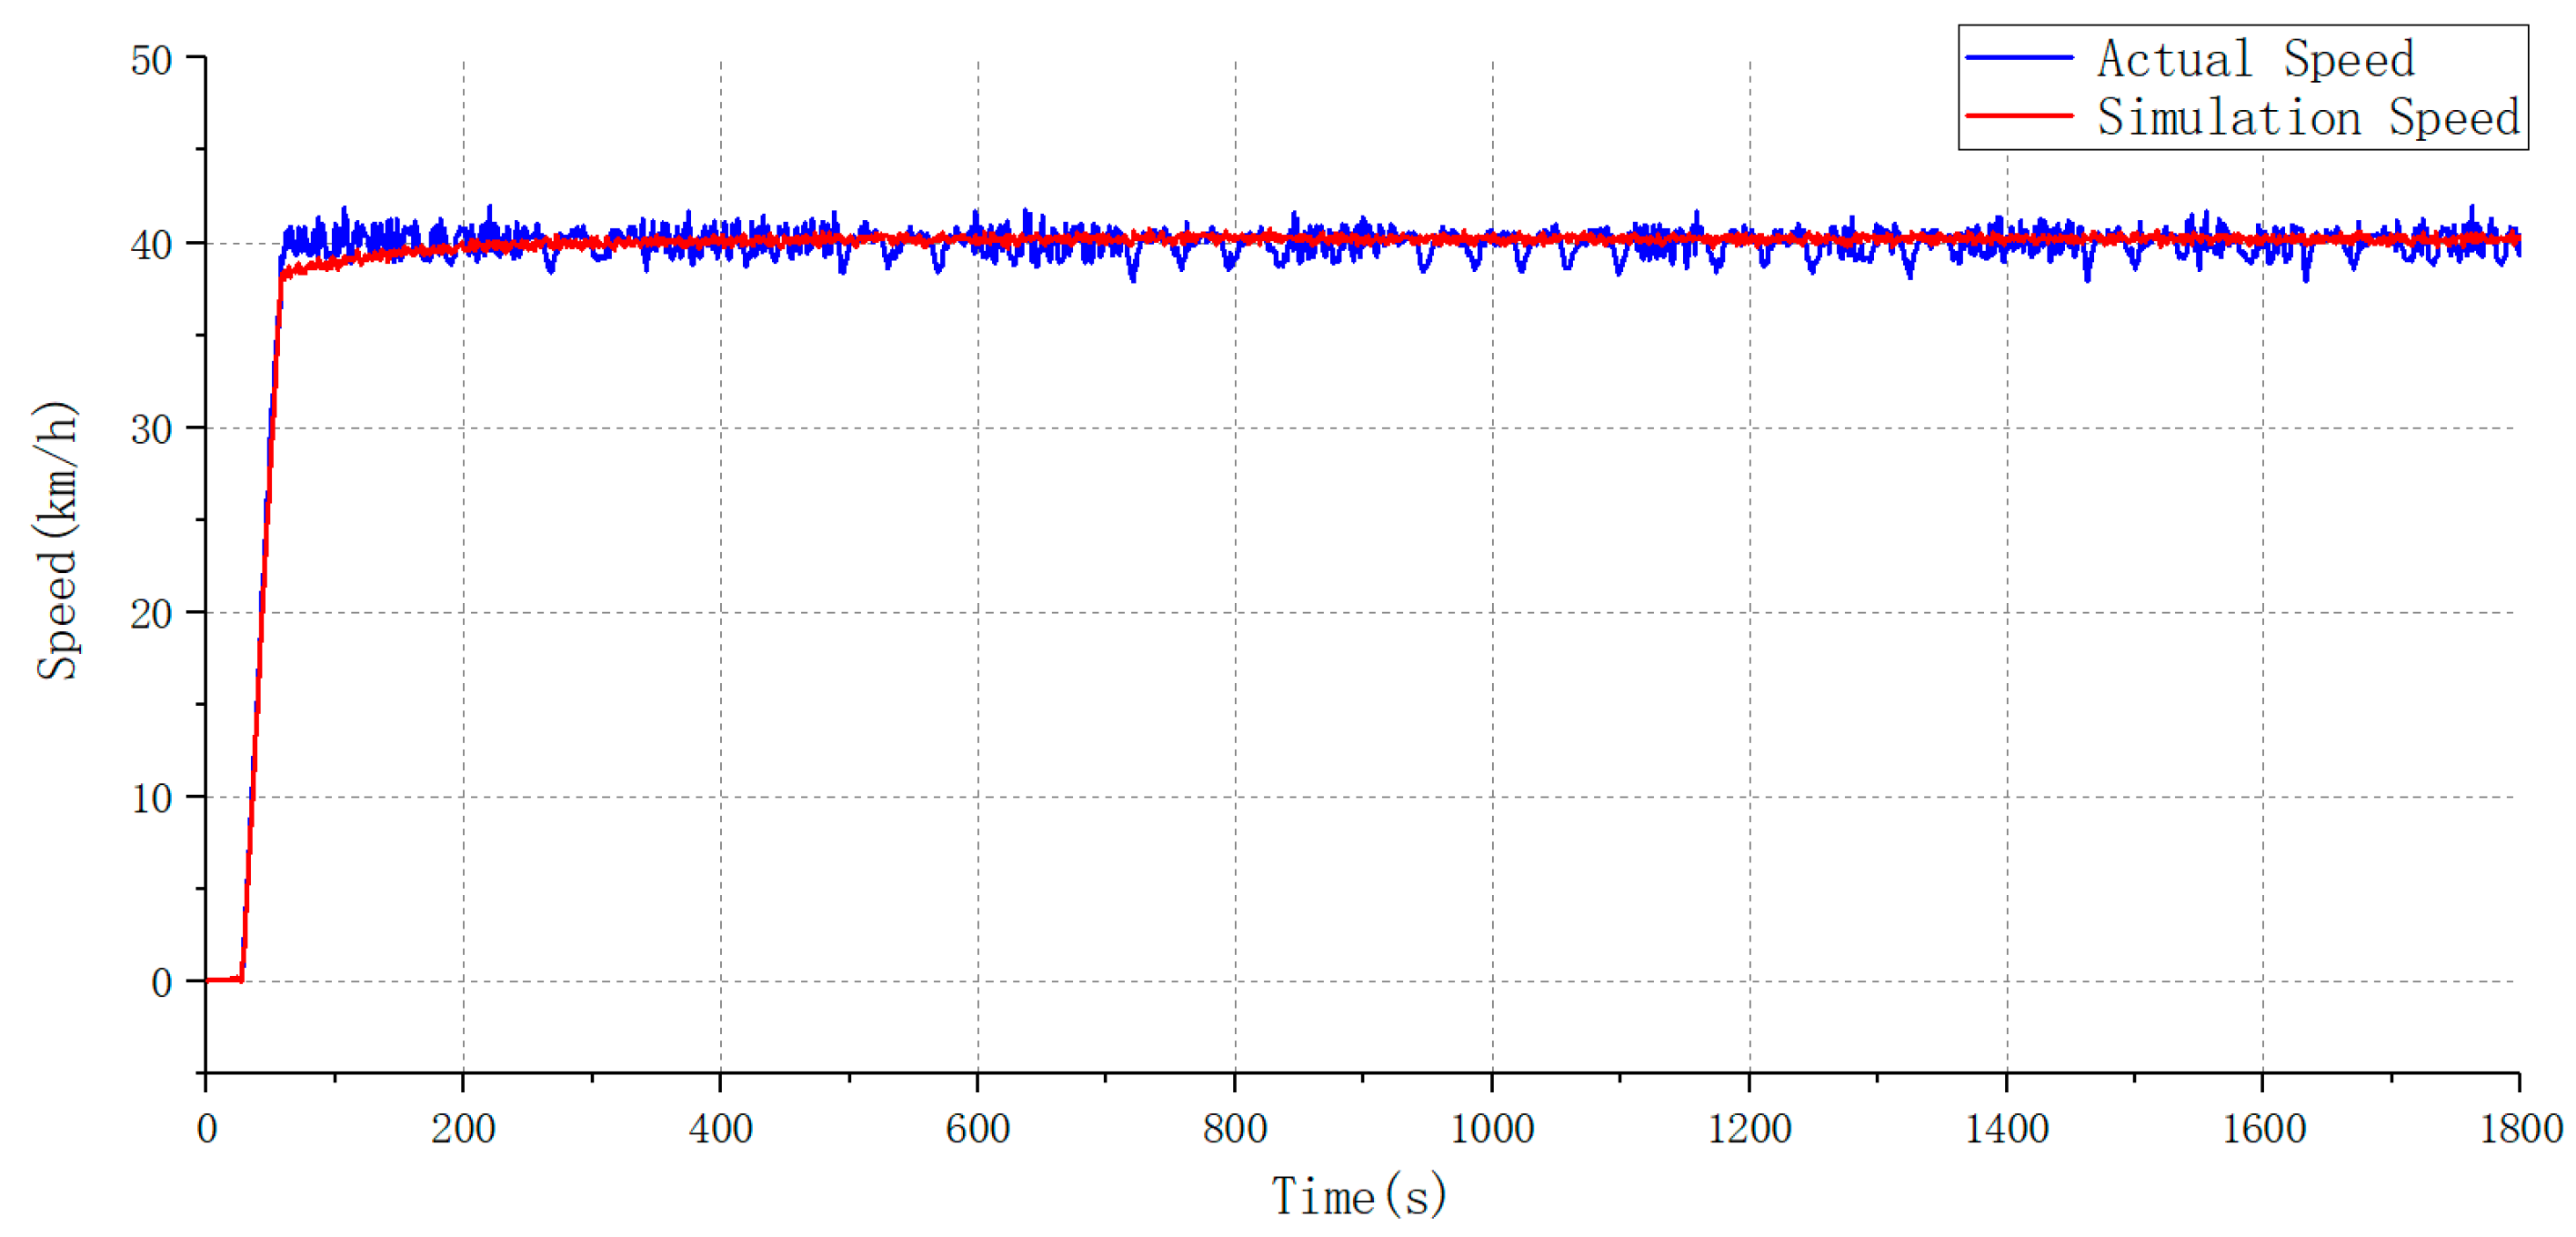
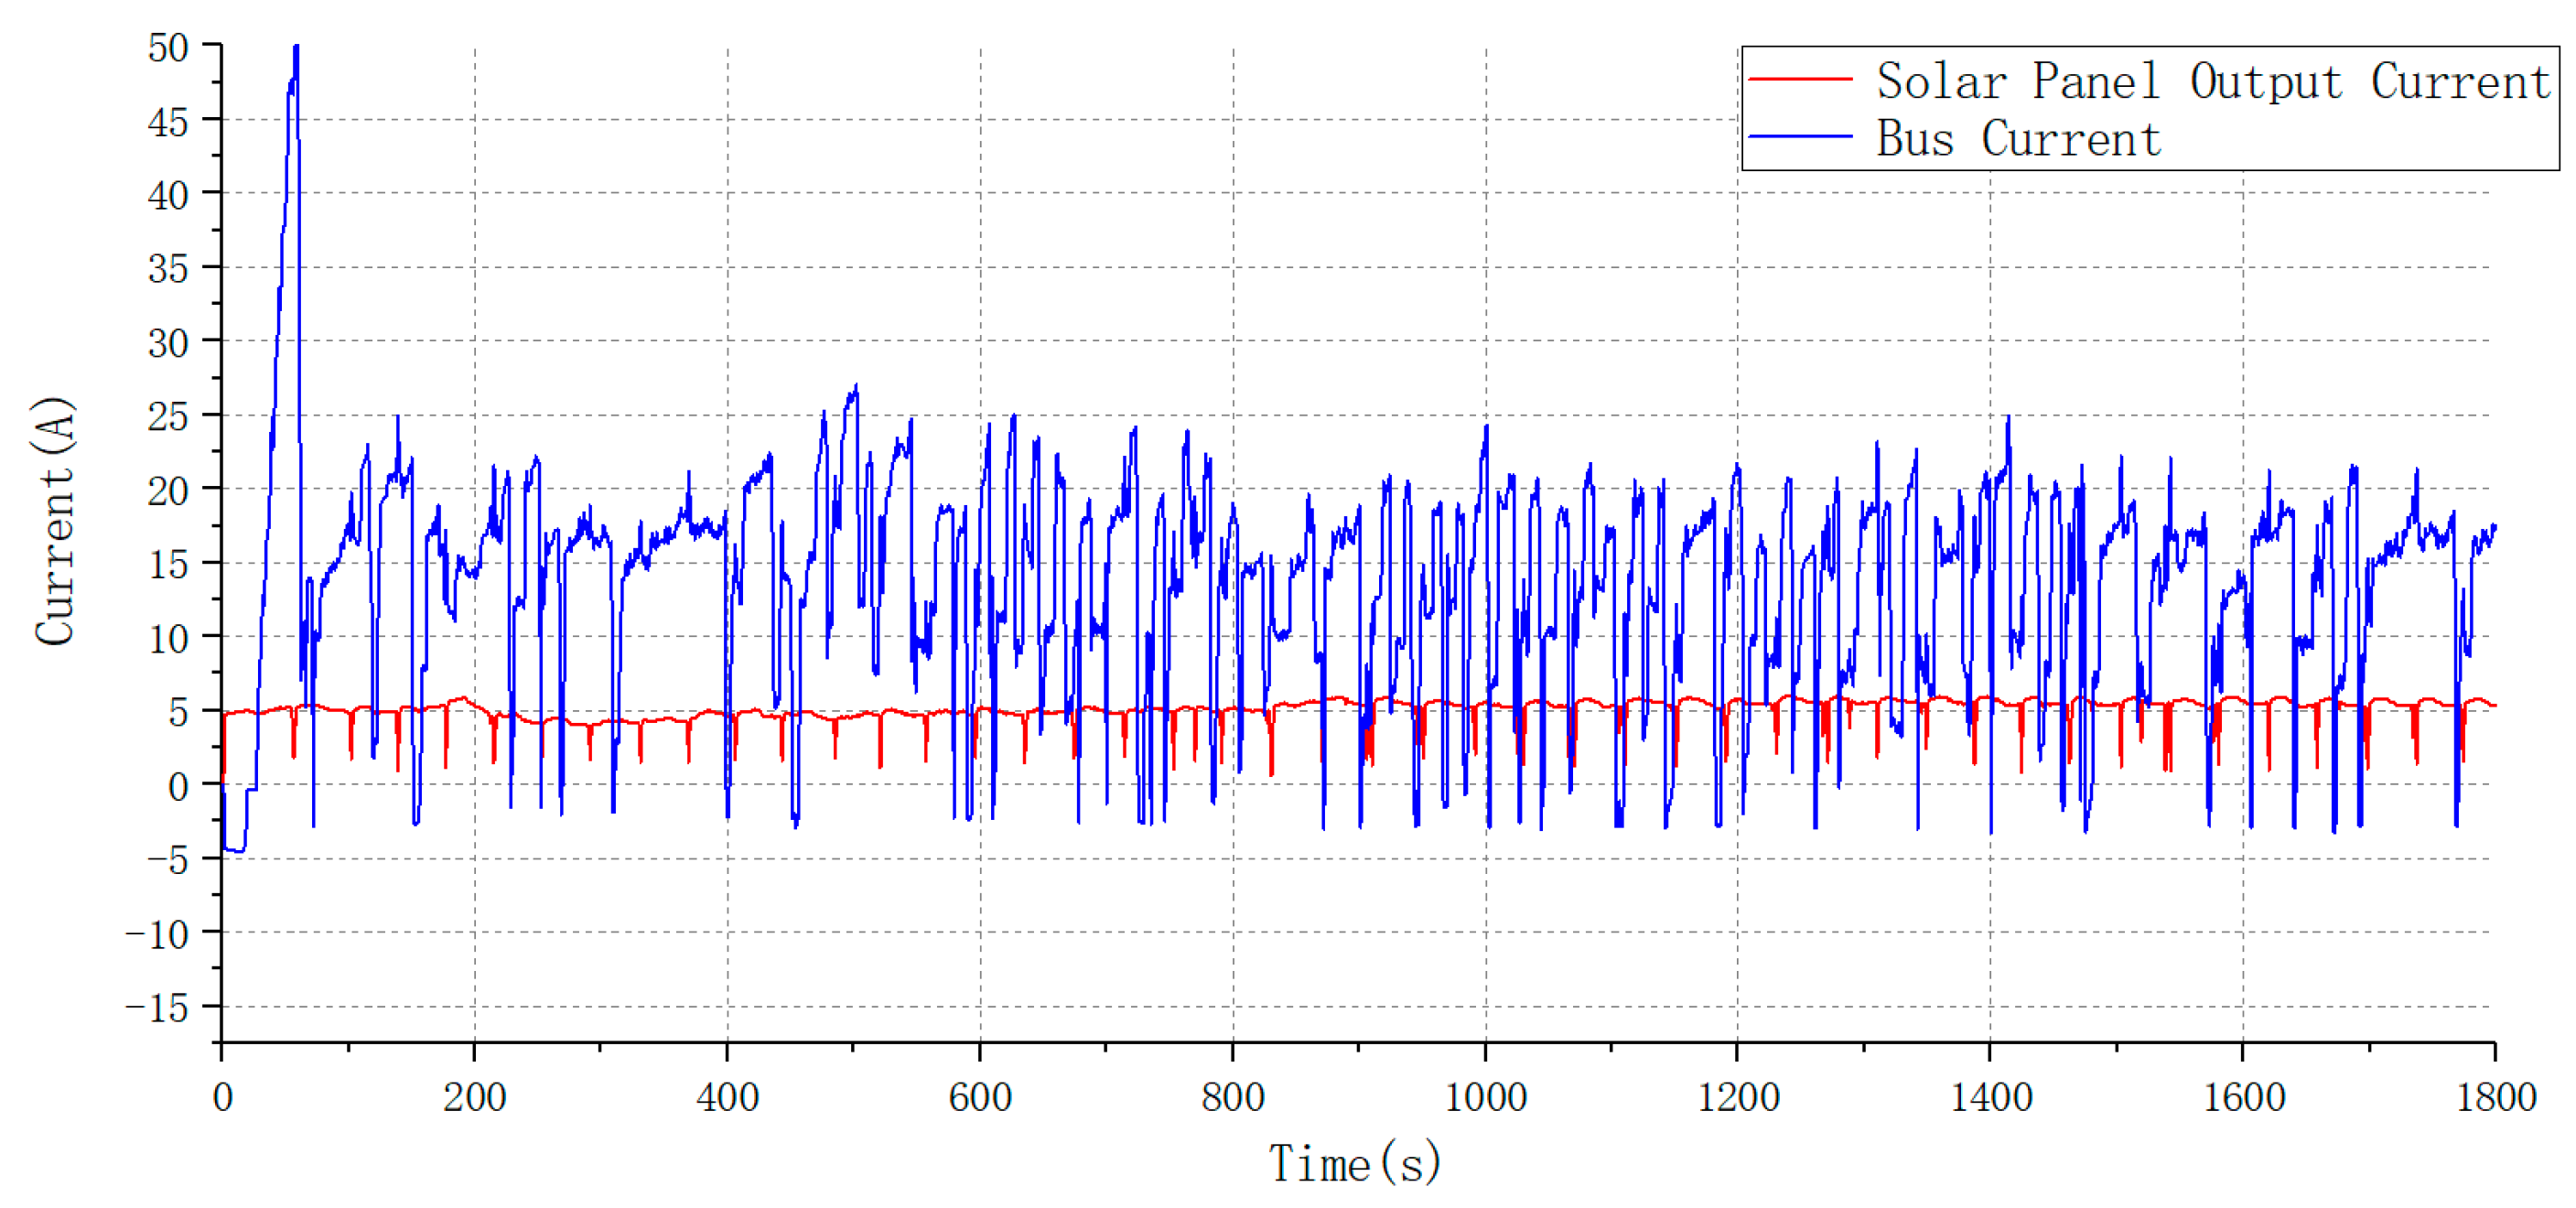
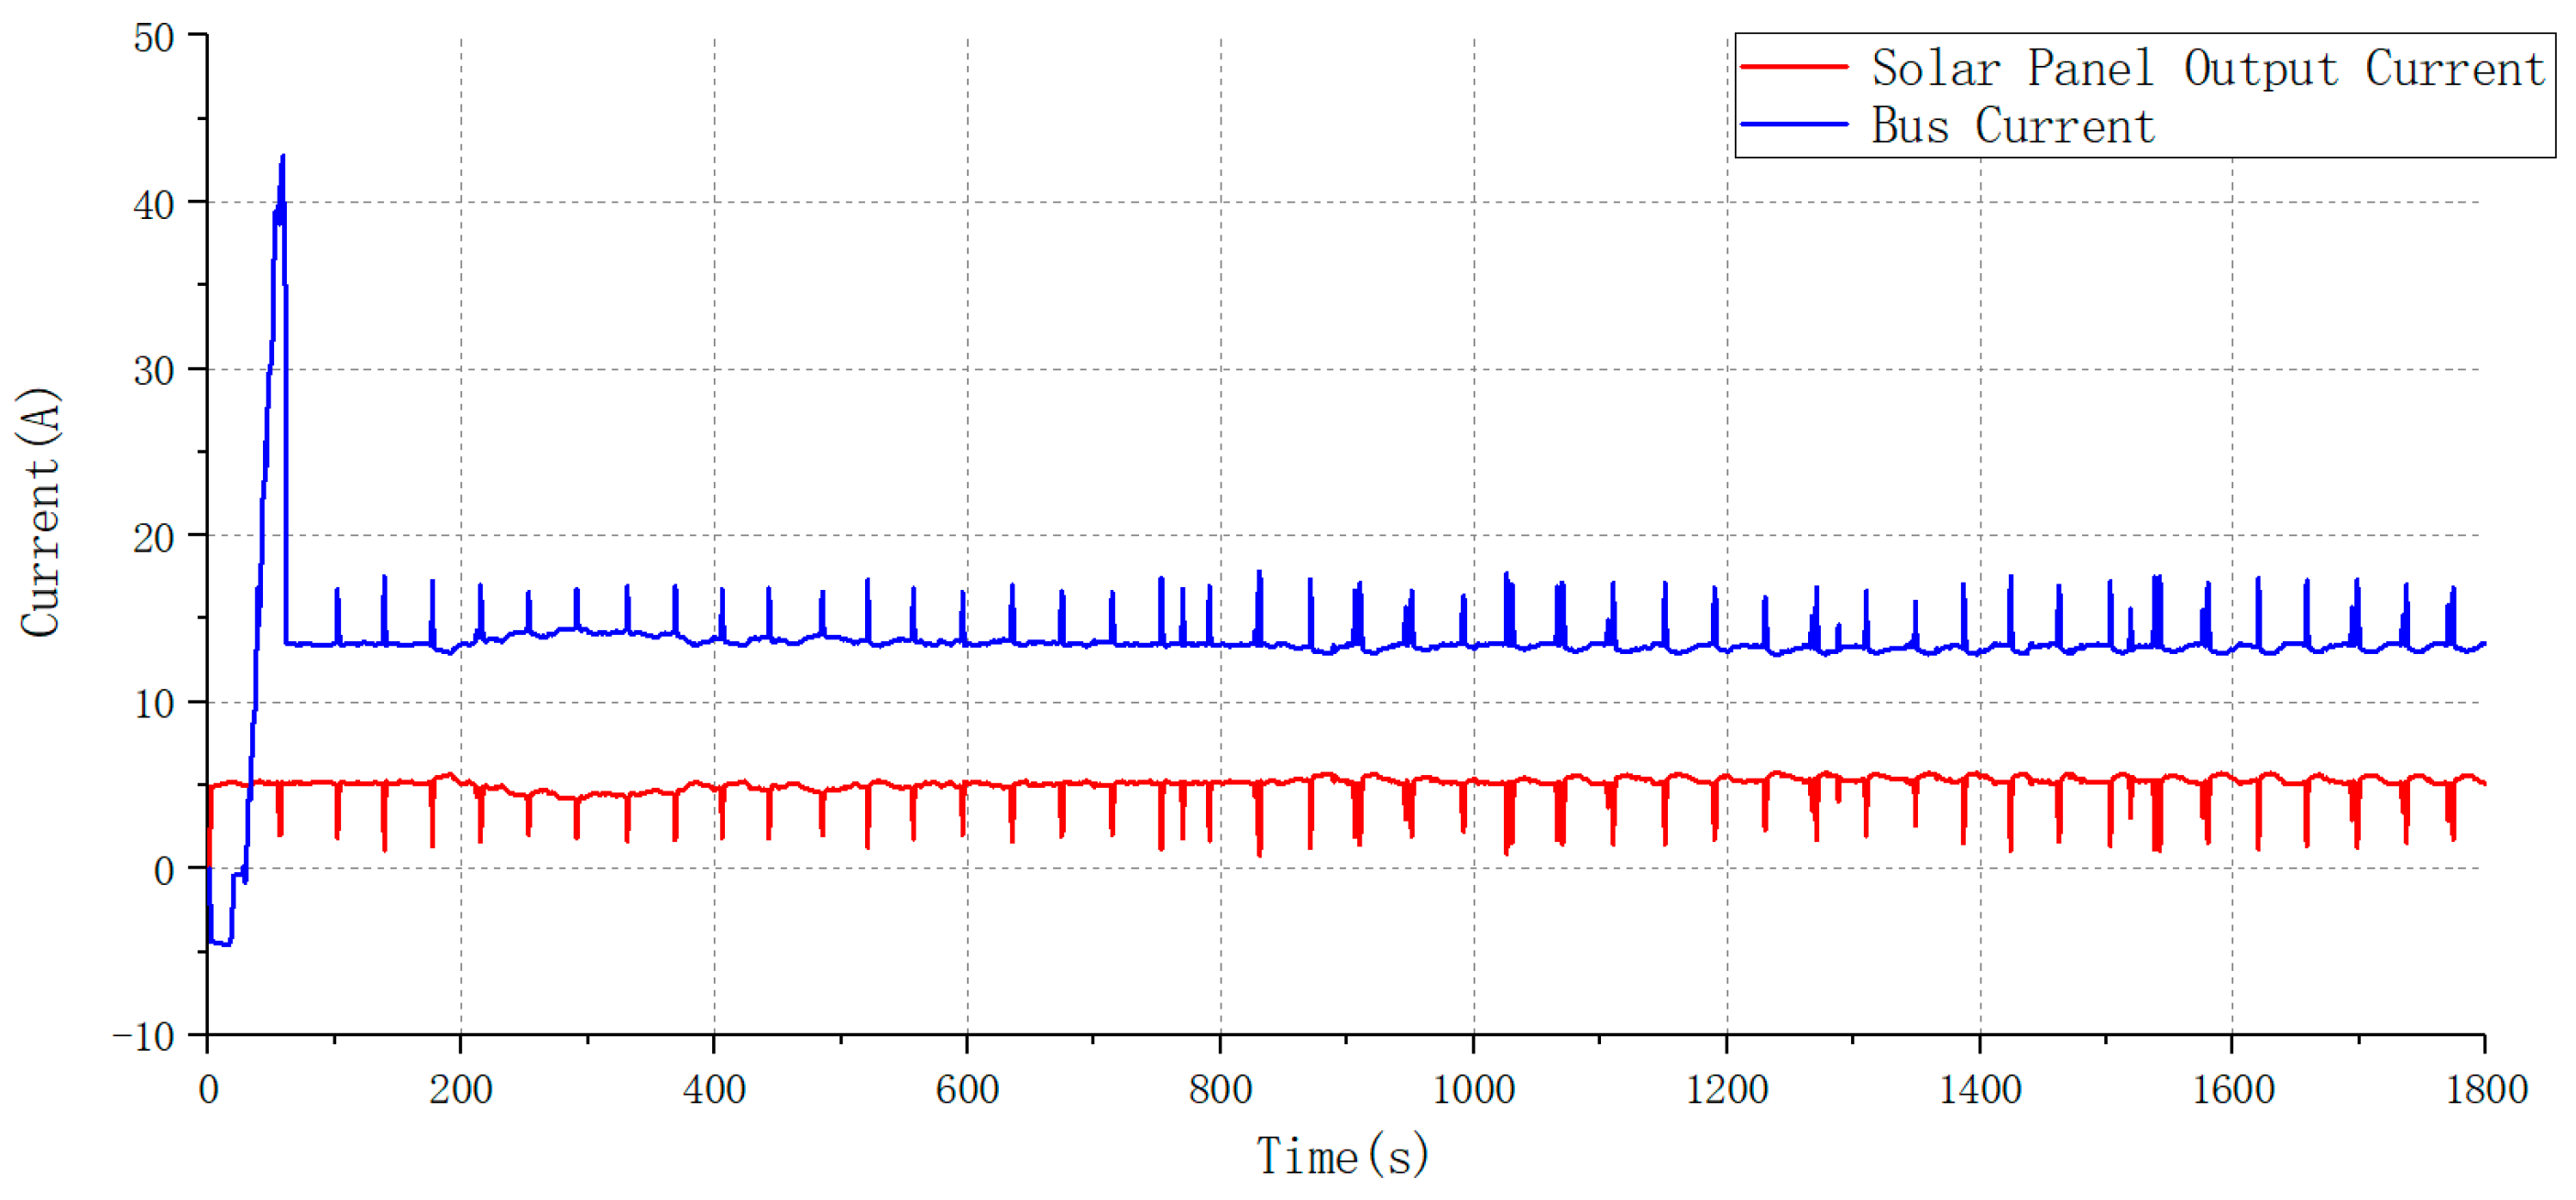
4.2. Experimental Results and Analysis

According to the test, the energy consumption of the solar car was 1.063 kWh, and the solar panel charged 0.325 kWh. The test result is shown in Figure 12a. Simulation under the same working conditions was conducted. The solar car energy consumption was 1.008 kWh, and the solar panel charged 0.323 kWh, as shown in Figure 12b.
From the test results and simulation results, the energy consumption of the actual solar car was 1.063 kWh and the simulated solar car was 1.008 kWh, with a difference of 0.055 kWh and an error of 5.17%; the actual solar panel charging was 0.325 kWh and the simulated solar panel charging was 0.323 kWh, with a difference of 0.002 and an error of 6.15%.
However, at the same time, we observed that the actual solar car energy consumption curve fluctuates much more than the simulation curve, and ideally, the energy consumption curve obtained by cruising at 40 km/h should be a straight line, so we conducted further investigation. The results of simulated vehicle speed and actual vehicle speed are shown in Figure 13, the test results of solar panel output current and bus current are shown in Figure 14, and the simulation results of solar panel output current and bus current are shown in Figure 15.
From Figure 13, it can be seen that both the simulated speed and the actual speed fluctuated above and below 40 km/h after stabilization, and the degree of fluctuation of the simulation results was significantly smaller than that of the actual speed. During the acceleration process, both of them reached the expected speed within a short time; meanwhile, the actual and simulated bus currents were accompanied by a large pulse, and after the speed stabilization, the bus current value dropped back to the normal level.
As seen in Figure 14 and Figure 15, there was a periodic downward pulse in the solar panel output current value, and the current value was stable for the rest of the moments. By observing the test site we found that at one of the curves of the athletic track, there would be shade trees, so when the solar car passed quickly, there would be a substantial weakening of the light intensity, and the light sensor sensed the change and transmitted it to the DT model at the same time, thus causing a short sharp drop in the solar panel output current, and after passing the shade trees, it would quickly return to normal level.
The actual bus current value oscillated violently in the process, on the one hand, because the solar panel output current dropped at the shade. As known from Section 3.1, the solar car’s direct drive current came from the solar panel and battery, so in order to maintain the current speed, the bus current increased to compensate. On the other hand, because there are more curves on the athletic track, the motor power demand became larger at the curves, so the bus current value also increased. The bus current value of the simulation was more stable, because in the simulation process, the curve was not considered as a factor, and the DT model was simulated according to the linear motion, so its change was mainly influenced by the output current of the external solar panel. It can also be seen from Figure 15 that the bus current value would change with the output current of the solar panel in order to maintain the current speed.

5. Conclusions

In this study, a DT system of solar car is designed and established based on a hybrid modeling approach. Considering that the complex process objects with partial mechanism knowledge are hard to acquire, a data-driven modeling approach based on SVM is used, while the different features of CarSim and Simulink are fully utilized for joint simulation, which ensures the accuracy of the model on the premise of enhancing the modelling efficiency. Meanwhile, two-way communication between physical and virtual entities based on TCP is realized, which allows the real-time data transfer and parallel operation between the DT model and the real vehicle. In addition, the energy consumption of this model is verified through the real-world vehicle experiment. The error of the energy consumption data is 5.17%, which shows that the DT model has good accuracy and can reflect the current actual vehicle energy consumption, and achieves the expected effect. The present DT system of solar car basically satisfies important characteristics that DT technology has, such as representativeness, reflection, entanglement, servitization, composability, and memorization [20], and can be considered as a primary stage DT system. In addition, limited by the current experimental site, some of the energy consumption characteristics of the solar car cannot be shown, and further work will consist of finding a more professional experimental site in which to analyze its energy consumption characteristics more comprehensively, and to optimize the support vector machine algorithm in detail.

Author Contributions

Conceptualization, L.B. and Y.Z.; methodology, L.B. and H.W.; software, J.D.; validation, L.B.; formal analysis, W.T.; investigation, Y.Z.; resources, L.B.; data curation, W.T.; writing—original draft preparation, L.B.; writing—review and editing, L.B., Y.Z. and H.W.; visualization, L.B.; supervision, Y.Z. and H.W.; project administration, L.B.; funding acquisition, Y.Z. All authors have read and agreed to the published version of the manuscript.

Funding

This research received no external funding.

Institutional Review Board Statement

Not applicable.

Informed Consent Statement

Not applicable.

Data Availability Statement

Not applicable.

Conflicts of Interest

The authors declare no conflict of interest.

References

  1. Araki, K.; Ota, Y.; Yamaguchi, M. Measurement and Modeling of 3D Solar Irradiance for Vehicle-Integrated Photovoltaic. Appl. Sci. 2020, 10, 872. [Google Scholar] [CrossRef] [Green Version]
  2. Kohei, Y.; Junji, H.; Dai, W.; Sadayuki, I. Graduation Research for Developing the Faculty of Creation—Design and Manufacturing of a Solar Car. Tech. Rep. Seikei Univ. 2003, 40, 9–16. [Google Scholar]
  3. Suita, Y.; Tadakuma, S. Driving Performances of Solar Energy Powered Vehicle with Novel Maximum Power Tracking Control for a Solar Car Rally. In Proceedings of the Industrial Technology, 2006. ICIT 2006. IEEE International Conference on Industrial Tehnology, Mumbai, India, 15–17 December 2016; IEEE: Piscataway, NJ, USA, 2006; pp. 1218–1223. [Google Scholar]
  4. Ustun, O.; Yilmaz, M.; Gokce, C.; Karakaya, U.; Tuncay, R.N. Energy Management Method for solar race car design and application. In Proceedings of the Electric Machines and Drives Conference, 2009. IEMDC ’09, IEEE International, Miami, FL, USA, 3–6 May 2009; IEEE: Piscataway, NJ, USA, 2009; pp. 804–811. [Google Scholar]
  5. Vinnichenko, N.A.; Uvarov, A.V.; Znamenskaya, I.A.; Ay, H.; Wang, T.H. Solar car aerodynamic design for optimal cooling and high efficiency. Sol. Energy 2014, 103, 183–190. [Google Scholar] [CrossRef]
  6. Mambou, E.N.; Swart, T.G.; Ndjiounge, A.R.; Clarke, W.A. Design and implementation of a real-time tracking and telemetry system for a solar car. In Proceedings of the Africon, Addis Ababa, Ethiopia, 14–17 September 105; IEEE: Piscataway, NJ, USA, 2015; pp. 1–5. [Google Scholar]
  7. Shao, X.; Lu, S.; van Kessel, T.G.; Hamann, H.F.; Daehler, L. Solar irradiance forecasting by machine learning for solar car races. In Proceedings of the IEEE International Conference on Big Data, Washington, DC, USA, 5–8 December 2016; IEEE: Piscataway, NJ, USA, 2016; pp. 2209–2216. [Google Scholar]
  8. Schroeder, G.N.; Steinmetz, C.; Pereira, C.E.; Espindola, D.B. Digital Twin Data Modeling with AutomationML and a Communication Methodology for Data Exchange. IFAC PapersOnLine 2016, 49, 12–17. [Google Scholar] [CrossRef]
  9. Schleich, B.; Anwer, N.; Mathieu, L.; Wartzack, S. Shaping the digital twin for design and production engineering. CIRP Ann. 2017, 66, 141–144. [Google Scholar] [CrossRef] [Green Version]
  10. Jacoby, M.; Usländer, T. Digital Twin and Internet of Things-Current Standards Landscape. Appl. Sci. 2020, 10, 6519. [Google Scholar] [CrossRef]
  11. Mukherjee, T.; Debroy, T. A digital twin for rapid qualification of 3D printed metallic components. Appl. Mater. Today 2018, 14, 59–65. [Google Scholar] [CrossRef]
  12. Kousi, N.; Gkournelos, C.; Aivaliotis, S.; Giannoulis, C.; Michalos, G.; Makris, S. Digital twin for adaptation of robots’ behavior in flexible robotic assembly lines. Procedia Manuf. 2019, 28, 121–126. [Google Scholar] [CrossRef]
  13. Matulis, M.; Harvey, C. A robot arm digital twin utilising reinforcement learning. Comput. Graph. 2021, 95, 106–114. [Google Scholar] [CrossRef]
  14. Vachálek, J.; Bartalský, L.; Rovný, O.; Šišmišová, D.; Morháč, M.; Lokšík, M. The digital twin of an industrial production line within the industry 4.0 concept. In Proceedings of the 2017 21st International Conference on Process Control (PC), Štrbské Pleso, Slovakia, 6–9 June 2017; IEEE: Piscataway, NJ, USA, 2017. [Google Scholar]
  15. Mohammadi, N.; Taylor, J.E. Smart city digital twins. In Proceedings of the 2017 IEEE Symposium Series on Computational Intelligence (SSCI), Honolulu, HI, USA, 27 November–1 December 2017; IEEE: Piscataway, NJ, USA, 2017. [Google Scholar]
  16. Fei, T.; Jiangfeng, C.; Qinglin, Q.; Zhang, M.; Zhang, H.; Fangyuan, S. Digital twin-driven product design, manufacturing and service with big data. Int. J. Adv. Manuf. Technol. 2018, 94, 3563–3576. [Google Scholar]
  17. Qi, Q.; Tao, F. Digital Twin and Big Data Towards Smart Manufacturing and Industry 4.0: 360 Degree Comparison. IEEE Access 2018, 6, 3585–3593. [Google Scholar] [CrossRef]
  18. Hyeong-su, K.; Jin-Woo, K.; Yun, S.; Kim, W.T. A novel wildfire digital-twin framework using interactive wildfire spread simulator. In Proceedings of the 2019 Eleventh International Conference on Ubiquitous and Future Networks (ICUFN), Zagreb, Croatia, 2–5 July 2019. [Google Scholar]
  19. Zehnder, P.; Riemer, D. Representing Industrial Data Streams in Digital Twins using Semantic Labeling. In Proceedings of the 2018 IEEE International Conference on Big Data (Big Data), Seattle, WA, USA, 10–13 December 2018; IEEE: Piscataway, NJ, USA, 2018. [Google Scholar]
  20. Minerva, R.; Lee, G.M.; Crespi, N. Digital Twin in the IoT Context: A Survey on Technical Features, Scenarios, and Architectural Models. Proc. IEEE 2020, 8, 1785–1824. [Google Scholar] [CrossRef]
  21. Barricelli, B.R.; Casiraghi, E.; Fogli, D. A Survey on Digital Twin: Definitions, Characteristics, Applications, and Design Implications. IEEE Access 2019, 7, 167653–167671. [Google Scholar] [CrossRef]
  22. Peng, Y.; Zhao, S.; Wang, H. A Digital Twin based Estimation Method for Health Indicators of DC-DC Converters. IEEE Trans. Power Electron. 2020, 36, 2105–2118. [Google Scholar] [CrossRef]
  23. Peng, Y.; Wang, H. Application of Digital Twin Concept in Condition Monitoring for DC-DC Converter. In Proceedings of the 2019 IEEE Energy Conversion Congress and Exposition (ECCE), Baltimor, MD, USA, 29 September–3 October 2019; IEEE: Piscataway, NJ, USA, 2019. [Google Scholar]
  24. Li, W.; Rentemeister, M.; Badeda, J.; Jöst, D.; Schulte, D.; Sauer, D.U. Digital twin for battery systems: Cloud battery management system with online state-of- charge and state-of-health estimation. J. Energy Storage 2020, 30, 101557. [Google Scholar] [CrossRef]
  25. Ramachandran, R.; Subathra, B.; Srinivasan, S. Recursive Estimation of Battery Pack Parameters in Electric Vehicles. In Proceedings of the 2018 IEEE International Conference on Computational Intelligence and Computing Research (ICCIC), Tamil Nadu, India, 13–15 December 2018; IEEE: Piscataway, NJ, USA, 2018. [Google Scholar]
  26. Venkatesan, S.; Manickavasagam, K.; Tengenkai, N.; Vijayalakshmi, N. Health monitoring and prognosis of electric vehicle motor using intelligent-digital twin. IET Electr. Power Appl. 2019, 13, 1328–1335. [Google Scholar] [CrossRef]
  27. Ezhilarasu, C.M.; Jennions, I.K.; Skaf, Z. Understanding the role of a Digital Twin in the field of Integrated Vehicle Health Management (IVHM). In Proceedings of the IEEE International Conference on Systems, Man, and Cybernetics 2019, Bari, Italy, 6–9 October 2019; IEEE: Piscataway, NJ, USA, 2019. [Google Scholar]
  28. Magargle, R.; Johnson, L.; Mandloi, P.; Davoudabadi, P.; Kesarkar, O.; Krishnaswamy, S.; Batteh, J.; Pitchaikani, A. A Simulation-Based Digital Twin for Model-Driven Health Monitoring and Predictive Maintenance of an Automotive Braking System. In Proceedings of the International Modelica Conference, Prague, Czech Republic, 15–17 May 2017. [Google Scholar]
  29. Zakrajsek, A.J.; Mall, S. The Development and use of a Digital Twin Model for Tire Touchdown Health Monitoring. In Proceedings of the 58th AIAA/ASCE/AHS/ASC Structures, Structural Dynamics, and Materials Conference, Grapevine, TX, USA, 9–13 January 2017. [Google Scholar]
  30. Jain, P.; Poon, J.; Singh, J.P.; Spanos, C.; Sanders, S.R.; Panda, S.K. A Digital Twin Approach for Fault Diagnosis in Distributed Photovoltaic System. IEEE Trans. Power Electron. 2019, 35, 940–956. [Google Scholar] [CrossRef]
  31. González, M.; Salgado, O.; Croes, J.; Pluymers, B.; Desmet, W. A Digital Twin for operational evaluation of vertical transportation systems. IEEE Access 2020, 8, 114389–114400. [Google Scholar] [CrossRef]
  32. Breen, D.; Zordan, V.B.; Horst, N. Mapping optical motion capture data to skeletal motion using a physical model. In Proceedings of the 2003 ACM SIGGRAPH/Eurographics Symposium on Computer Animation, San Diego, CA, USA, 26–27 July 2003; Eurographics Association: Goslar, Germany; pp. 245–250. [Google Scholar]
  33. Rojek, I.; Mikołajewski, D.; Dostatni, E. Digital Twins in Product Lifecycle for Sustainability in Manufacturing and Maintenance. Appl. Sci. 2021, 11, 31. [Google Scholar] [CrossRef]
  34. Birnie, D.P. Analysis of energy capture by vehicle solar roofs in conjunction with workplace plug-in charging. Sol. Energy 2016, 125, 219–226. [Google Scholar] [CrossRef]
  35. Gibson, T.L.; Kelly, N.A. Solar photovoltaic charging of lithium-ion batteries. J. Power Sources 2010, 195, 3928–3932. [Google Scholar] [CrossRef]
  36. Xie, Y.; Li, Y.; Zhao, Z.; Dong, H.; Wang, S.; Liu, J.; Guan, J.; Duan, X. Microsimulation of electric vehicle energy consumption and driving range. Appl. Energy 2020, 267, 115081. [Google Scholar] [CrossRef]
  37. Luin, B.; Petelin, S.; Al-Mansour, F. Microsimulation of electric vehicle energy consumption. Energy 2019, 174, 24–32. [Google Scholar] [CrossRef]
  38. Malik, A.A.; Brem, A. Digital twins for collaborative robots: A case study. Robot. Comput. Integr. Manuf. 2021, 68, 102092. [Google Scholar] [CrossRef]
  39. Son, Y.H.; Park, K.T.; Lee, D.; Jeon, S.W.; Do Noh, S. Digital twin-based cyber-physical system for automotive body production lines. Int. J. Adv. Manuf. Technol. 2021, 115, 1–20. [Google Scholar] [CrossRef]
  40. Chiang, Y.H.; Sean, W.Y.; Ke, J.C. Online estimation of internal resistance and open-circuit voltage of lithium-ion batteries in electric vehicles. J. Power Sources 2011, 196, 3921–3932. [Google Scholar] [CrossRef]
  41. Sun, L.; Li, G.; You, F. Combined internal resistance and state-of-charge estimation of lithium-ion battery based on extended state observer. Renew. Sustain. Energy Rev. 2020, 131, 10994. [Google Scholar] [CrossRef]
  42. Gu, L.; Gui, J.Y.; Wang, J.V.; Zhu, G.; Kang, J. Parameterized evaluation of thermal characteristics for a lithium-ion battery. Energy 2019, 178, 21–32. [Google Scholar] [CrossRef]
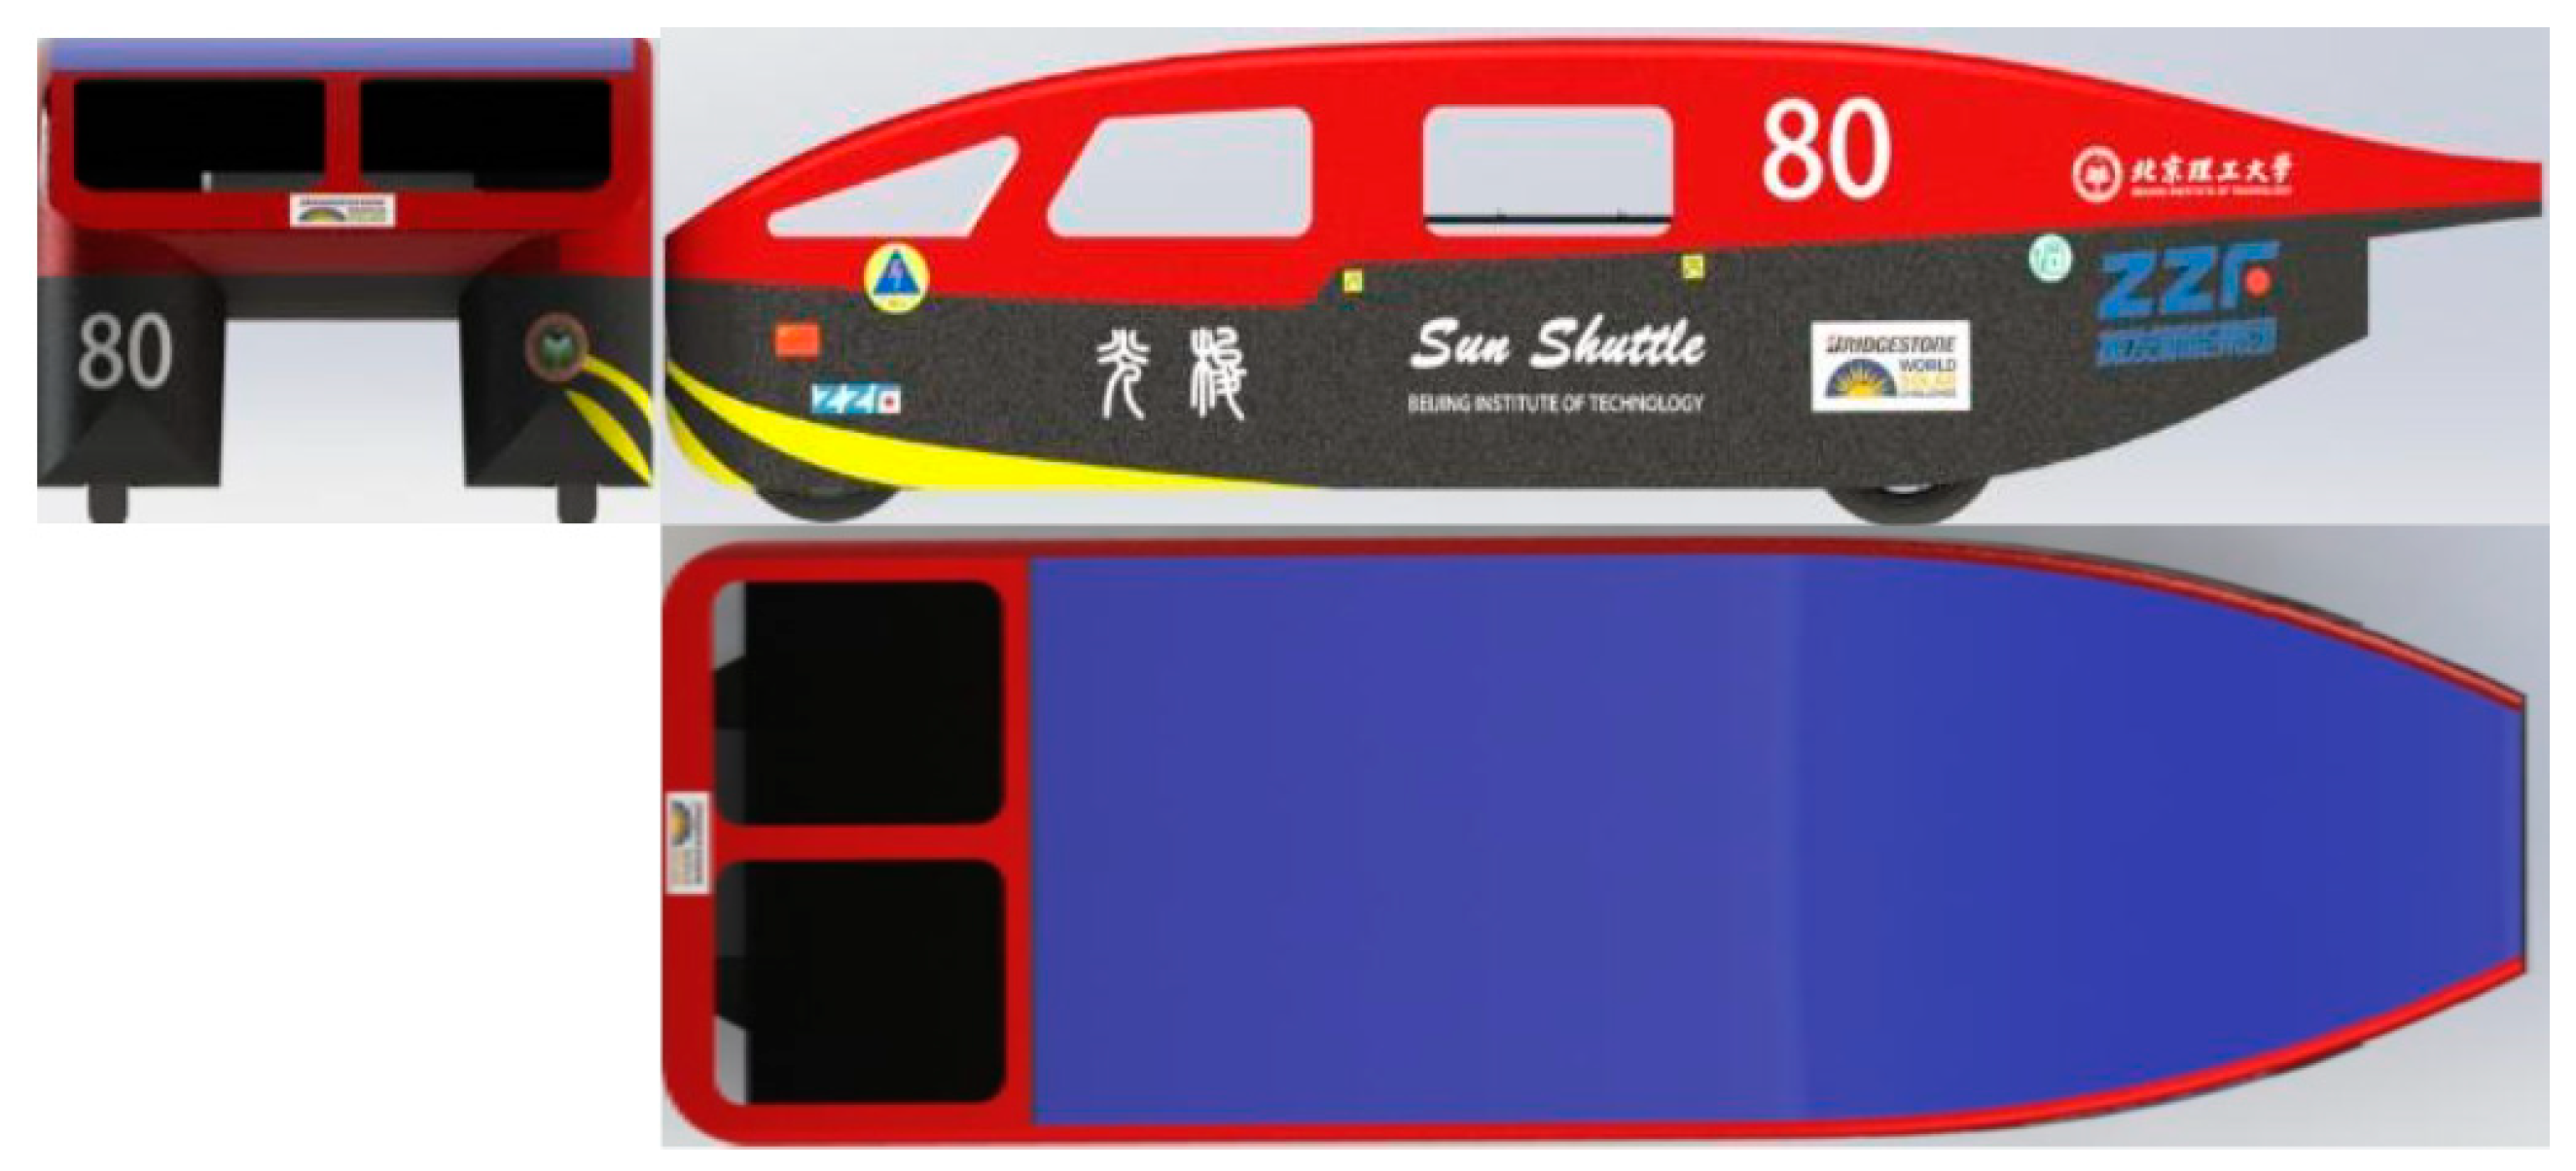
Figure 1. Elements of the presented architecture.
Applsci 11 06399 g001
Figure 2. Appearance of “Sun Shuttle III”.
Applsci 11 06399 g002
Figure 3. Overall modeling framework diagram.
Applsci 11 06399 g003
Figure 4. Equivalent circuit of photovoltaic cell.
Applsci 11 06399 g004
Figure 5. Motor efficiency MAP.
Applsci 11 06399 g005
Figure 6. Internal resistance and open circuit voltage characteristics of the battery: (a) Description of what is contained in the first panel; (b) Description of what is contained in the second panel.
Applsci 11 06399 g006
Figure 7. Simulink simulation model of the whole vehicle.
Applsci 11 06399 g007
Figure 8. Cloud platform data transmission principle.
Applsci 11 06399 g008
Figure 9. Socket communication model.
Applsci 11 06399 g009
Figure 10. Data transfer test: (a) Client: interface for sending data from the upper computer. (b) Server: receiving real-time data.
Applsci 11 06399 g010
Figure 11. Physical test platform.
Applsci 11 06399 g011
Figure 12. Comparison of test-simulation results: (a) Graph of test results; (b) Graph of simulation results.
Applsci 11 06399 g012
Figure 13. Simulated vehicle speed and actual vehicle speed result graph.
Applsci 11 06399 g013
Figure 14. Solar panel output current and bus current test results.
Applsci 11 06399 g014
Figure 15. Solar panel output current and bus current simulation results.
Applsci 11 06399 g015
Table 1. Specifications of “Sun Shuttle III”.
ParametersValues
Curb Mass 395 kg
Dimensions 5000 × 1650 × 1200 mm
Wheelbase 2850 mm
Battery Capacity 20 kWh
Solar Panel Area 5 m2
Max Power 12 kW
Top Speed 130 km/h
Range 700 km
Table 2. Important parameter settings in CarSim.
ParametersValues
Sprung Mass420 kg
Axial Load Distribution Ratio40:60
Mass Center of Sprung Mass520 cm
Drag Coefficient0.16
Frontal Area1.45 m2
No-load Tire Radius280 mm
Drive FormRear hub motor direct drive
Maximum Brake Pedal
Input Force
400 N
Ratio of Front and Rear Braking Force55:45
Table 3. Specifications of test equipment.
CategoryTypeRangeAccuracy
Voltage SensorKSD-4U0–150 V±0.1%
Current SensorKXK-360–50 A±0.1%
Light Intensity SensorRS-GZ-V05-20-65535 Lux±7%(25 °C)
Temperature SensorPt100−50–200 ℃±0.35 °C
Tire Pressure SensorYB-680–5.0 Bar±0.1Bar
AnemometerPM6252B0.40–30.0 m/s±0.01 m/s
Data Acquisition BoardUSB-2000±5 V±0.9 mV
GPS SensorWTGAHRS1-<2 m
AccelerometerWTGAHRS1±8 g±0.01 g
Table 4. Experimental conditions.
CategoryData
Temperature22 °C
Wind Speed<0.5 m/s
Light Intensity9500–100,000 Lux
RoadPlastic Runway
Road Slope<1
Total Load600 kg
Cruising Speed40 km/h
Publisher’s Note: MDPI stays neutral with regard to jurisdictional claims in published maps and institutional affiliations.

