Article

A Hybrid Multi-Objective Evolutionary Algorithm-Based Semantic Foundation for Sustainable Distributed Manufacturing Systems

1
Department of Mechanical Engineering, National Institute of Technology, Warangal 506004, Telangana, India
2
MEtRICs Research Center, Mechanical Engineering Department, Campus of Azurém, University of Minho, 4800-058 Guimarães, Portugal
3
Algoritmi Research Centre, Department of Production and Systems, Campus of Azurém, University of Minho, 4800-058 Guimarães, Portugal
*
Author to whom correspondence should be addressed.
Appl. Sci. 2021, 11(14), 6314; https://doi.org/10.3390/app11146314
Submission received: 19 May 2021 / Revised: 27 June 2021 / Accepted: 29 June 2021 / Published: 8 July 2021
(This article belongs to the Special Issue Systems Engineering: Availability and Reliability)

Abstract

:
Rising energy prices, increasing maintenance costs, and strict environmental regimes have augmented the already existing pressure on the contemporary manufacturing environment. Although the decentralization of supply chain has led to rapid advancements in manufacturing systems, finding an efficient supplier simultaneously from the pool of available ones as per customer requirement and enhancing the process planning and scheduling functions are the predominant approaches still needed to be addressed. Therefore, this paper aims to address this issue by considering a set of gear manufacturing industries located across India as a case study. An integrated classifier-assisted evolutionary multi-objective evolutionary approach is proposed for solving the objectives of makespan, energy consumption, and increased service utilization rate, interoperability, and reliability. To execute the approach initially, text-mining-based supervised machine-learning models, namely Decision Tree, Naïve Bayes, Random Forest, and Support Vector Machines (SVM) were adopted for the classification of suppliers into task-specific suppliers. Following this, with the identified suppliers as input, the problem was formulated as a multi-objective Mixed-Integer Linear Programming (MILP) model. We then proposed a Hybrid Multi-Objective Moth Flame Optimization algorithm (HMFO) to optimize process planning and scheduling functions. Numerical experiments have been carried out with the formulated problem for 10 different instances, along with a comparison of the results with a Non-Dominated Sorting Genetic Algorithm (NSGA-II) to illustrate the feasibility of the approach.

1. Introduction

Increasing competition, coupled with advancing computing technologies and the advent of decentralization in the supply chain, has led to the attainment of a shorter product life cycle, reducing production costs and responding to customer demands with greater flexibility. Thus, manufacturing units are now leaning toward a distributed manufacturing environment far from the traditional approach of promptly manufacturing products [1]. This involves multiple processes consisting of classification of manufacturing units, assignment of tasks as per product category on the basis of requirements, and information exchange within various units of an enterprise and between firms. All these together represent parameters of a compound scenario needed to be refined. In this paper, the implications of the proposed classification and optimization-/simulation-based integrated approach for the considered system is presented.
Managing supplier relationships and estimating the level of risk involved with various categories of suppliers, their capabilities, core services, constraints, target industries, and customers are some of the parameters for classification and selection. Dealing with selection of suppliers on such a large scale becomes tedious; thus, it is required to subsume advanced techniques for supplier classification. This research incorporates text mining based on supervised machine-learning models as one of the approaches for a better resolution of the aforementioned supplier classification problem. Text mining is the operation through which information from unstructured text documents is extracted by devising non-trivial patterns and trends through statistical pattern learning. It contains various steps, viz., pre-processing, structuring of the input text data, extracting patterns, and classification of information from various sources into a pre-defined genre [2]. Irrespective of any kind of manufacturing system, the prominent functions are process planning and scheduling. The former includes raw materials, semi-finished products, machine tools, and process information. The latter includes the allocation of resources over a set of constraints for manufacturing various entities [3]. The delay of time between planning and execution phase demands the modification of process plans. In other words, it is estimated that 20–30 percent of the already-generated process plans has to be modified in a given life cycle as a result of sequential processing of planning and scheduling in the existing systems [4].
This study seeks to address the following questions:
  • How can supervised machine-learning models be employed to find an efficient method for supplier classification, categorizing suppliers based on specific tasks?
  • What type of mathematical model can be developed considering the optimization of various conflicting objectives such as completion time, energy consumption, interoperability, machine utilization rate, service utilization, and utility?
  • In what way can evolutionary algorithms be utilized to optimize scheduling and planning?
  • What are the benefits of the proposed approach on the considered problem, and how would these effects influence the manufacturing system in a real-time environment?
  • How can the effectiveness of the proposed Hybridized evolutionary (HMFO) algorithm be validated?
In this paper, the context of the problem considered is a distributed manufacturing environment where different enterprises are geographically distributed, in which coordination and collaboration among such enterprises for mutual exchange of information without any significant loss of data represent a challenge. Motivated by the nature of the problem and the factors considered above, this study, in a distributed network manufacturing system, pursues the classification, coordination, and communication to optimize scheduling and planning. This paper introduces three different steps which have been duly scrutinized to achieve the desired optimization of parameters, i.e., makespan, energy consumption, machine utilization rate, and reliability of services. Initially, a supplier classification problem is explored under a manufacturing setup in which the suppliers are classified into task specific suppliers using text mining. Thereafter, a many-objective mathematical model is developed to achieve the above-mentioned competing objectives. We then compared the effectiveness of the above propounded approach by equating the outcomes with the proposed multi-objective Hybrid Moth Flame Optimization (HMFO) algorithm with another benchmark algorithm such as NSGA-II.
The research contributions of this paper can be outlined as given below:
  • Proposing an integrated text-mining assisted process planning framework for distributed manufacturing systems;
  • Employing a machine-learning-based text-mining method to identify the potential enterprises and sharing of resources effectively across the network and tested its feasibility with various other machine-learning algorithms;
  • A multi-objective evolutionary algorithm-based Hybridized Moth Flame Optimization Algorithm (HMFO) is used to solve the considered problem in the scenario of distributed gear manufacturing industries;
The results of the proposed HMFO method are validated with the Non-Dominated Sorting Genetic Algorithm (NSGA-II) to evaluate their usefulness by both experimental and practical instances. Finally, the superiority of the proposed HMFO is confirmed with the help of various performance indicators.
In this paper, Section 2 deals with the literature, Section 3 describes the problem and the developed mathematical model developed. Section 4 explains the proposed framework and algorithm for the text-mining approach. In Section 5, experimentation with a case study of the gear manufacturing industry is presented, and the corresponding outcomes are explained in Section 6. The paper is concluded in Section 7 by providing scope for future work.

2. Literature Review

The section discusses a review of text mining, Integration of Process Planning and Scheduling (IPPS), interoperability, and evolutionary algorithm-based approaches implemented in the proposed methodology.
A review has been conducted for knowledge discovery and text-mining techniques with data-mining attributes, namely depiction, explanation, classification, estimation, grouping, and evolution in the domain of manufacturing [5]. An algorithm developed with K-means and support vector machine (SVM) clustering algorithms to examine the polarity of text and group the online hotspot detection forums into clusters depending upon their similarities [6]. An ontology was implemented based on text-mining strategy to extract the fault system information from the unstructured natural language text. All the information regarding the manufacture of the product was represented as a knowledge with the help of an ontology naming product to share this knowledge in any platform by achieving interoperability [7]. At the same time, the Naive Bayes algorithm approach was adopted for classification of manufacturing supplier. Later, Decision Trees and Random Forests were utilized for supervised machine-learning model-based digit classification using Waikato Environment for Knowledge Analysis (WEKA) and have performed comparison on multiple performance parameters such as Kappa Statistic, Precision, Recall, and F-measure [8]. A resource allocation strategy with help of big data and Machine-Learning (ML) techniques is proposed to find the perfect forecasting of energy consumption patterns [9]. A text-mining technique was proposed for classification of sustainable environmental indices for service and manufacturing system. They also established relationships between indicator utility levels and company characteristics [10]. A support SVM classification algorithm was presented to classify the supplier’s text data of various web pages into manufacturing and non-manufacturing suppliers [11]. An e-commerce strategy was adopted for monitoring specific features of the enterprises. It describes how the records are obtained automatically from a corporate website using supervised classification algorithms [12].
Process Planning and Scheduling (PPS) mentions the requirement of manufacturing resources, operations, and routes that are possible to manufacture a product and allocate the operations of all the jobs on machines, without disturbing the actual precedence relationships in the process plans [13]. In traditional manufacturing system, process planning and scheduling were carried out in a step-by-step process. To overcome the adverse effects by a conventional way of PPS, researchers have identified the need to integrate both PPS and have found the benefits of it in case of networked manufacturing environment. Manufacturing decision making (MADEMA) approach was proposed for the assignment of work center resources with multiple decision-making criteria in order to have an effective utilization for IPPS problem [14]. Later, the modified above-proposed MADEMA model consists of five basic steps and mainly focuses on finding alternative machines and solving the Integration of Process Planning and Scheduling (IPPS) problem [15]. Furthermore, a net-man strategic framework proposed where an operational mechanism is introduced for manufacturing organizations that helps to change their operations on a timely basis with the help of forming distributed manufacturing networks that help as a performance enabler for manufacturers in the Networked Manufacturing System (NMS) [16]. The agent-based system has been proposed with the distributed ruler method for distributed manufacturing systems as a function-based decomposition method to accomplish the process planning and scheduling, and the feasibility is illustrated through different case studies [17]. A Disruptive Innovation-Like Algorithm (DILA) is presented to minimize the tardiness for the job and to obtain the optimal schedule for one machine by varying setup times at irregular interval of time [18]. A novel way for formalizing datasets and concepts utilized for ontology were embedded in the product itself and hence made it interoperable in NMS. Furthermore, a two-level nested solution algorithm was implemented by developing a hybrid adaptive genetic algorithm (HAGA) to achieve optimal process plans for multiple jobs in NMS. The feasibility of the approach is investigated through numerical experiments [19]. The Binary Spring Search Algorithm (BSSA) based on simulation of Hookes law is employed to solve various optimization problems. Moreover, the results obtained by BSSA are compared with other standard binary algorithms, namely the grasshopper mechanism, bat algorithm, etc. [20]. The mobile-agent-based system, introduced for IPPS in NMS to prove the consistency of the proposed model comparison, was made with the Controlled Elitist Non-dominated sorting GA [21].
The effectiveness of the integration of production planning and scheduling approach is compared and proved with conventional sequential scheduling approach. An evolutionary algorithm-based GA approach was adopted for the scheduling of integrated manufacturing and distribution systems [22]. A two-loop algorithm consists of the longest processing-time rule-based tabu search, which is proposed to obtain the optimal schedule in IPPS by minimizing the total cost for manufacturing and maintenance of machines arranged in series in case of NMS [23]. A hybrid dynamic-DNA assisted an evolutionary algorithm proposed to solve N-person non-co-operative game in context to produce various optimal schedule for several jobs in a NMS [24]. A Chaotic Particle Swarm optimization (C-PSO) algorithm for IPPS problem in network manufacturing and compared it with other benchmark algorithms like Genetic Algorithm (GA), Simulated Annealing (SA), and hybrid algorithm to prove its superiority [25]. A Hybrid Particle Swarm Optimization (H-PSO) was described for IPPS and delivery route planning. This was implemented utilizing multi-purpose machines to minimize the cost and earliness and tardiness of the jobs [26]. A logic-based Benders decomposition (LBBD) algorithm mainly separates the decision variables into two sub-categories, i.e., master problem deals with the process plan and sub-problem deals with the sequencing has been emphasized that can solve the IPPS problem for finding an exact solution [27]. A MILP formulation was proposed to minimize the storage cost and workforce cost in the airline industry. This problem mainly deals with the maintenance and repair operations allocation, and it is an NP-hard problem solved by evolutionary algorithms [28]. A combination of algorithms, namely H-PSO and GA with special operators, has been presented to deal with the existed uncertainty in IPPS problem. Later, standard problems are considered to validate the effectiveness of the presented hybrid approach [29]. To overcome the trapping of solutions to a local optimum while solving the multi-modal functions by using several heuristic algorithms, a Comprehensive Learning Particle Swarm Optimizer (CLPSO) has been proposed that combines the advantage of Local Search (LS) strategy along with the excellent global search ability of Particle Swarm Optimizer (PSO). In this work, several multi-modal benchmark functions such as CEC2013 are tested for determining the effectiveness of CLPSO-LS algorithm [30].
A dynamic scheduling method based on event-triggered dynamic task scheduling (EDS) proposed to get the optimal services times for cloud manufacturing systems. A case study of numerical control machines has been considered to prove the effectiveness of the proposed methodology. [31]. Furthermore, generic mediator architecture for effective coordination and task planning in a Distributed Manufacturing Environment (DME) were developed [32]. Moreover, a review has been presented on the articles related to game theory and optimization methods for several applications of problems. Furthermore, there was a classification into various categories where game theory is useful for increasing the effectiveness of optimization; optimization methods are useful for solving the game theory problems; and a combination of game theory and optimization also may be useful for efficient solving of other classes of problems. The proposed classification was based on four criteria: mainly based on nature of optimization (classic or modern), based on the number of objectives (single or multi), and based on the type of game theory [33]. Subsequently, the reduction of maximum completion time, tardiness, and production cost along with the optimal schedule are generated with the help of GA integrated with Gantt chart (GC) methodology for DMS. A case study of manufacturing scenario with six jobs and twelve machines considered and solved with the proposed GA-GC method [34]. Likewise, resource, management and part agents are considered in a multi-agent-based system to make decisions in a timely manner with proper co-ordination to generate optimal process plans in a distributed scheduling environment [35].
The question lies in how to make the proper choice of action without deviating from the optimal strategy in an uncertain environment that exists in distributional robust optimization problems where the decision maker is not sure about the distribution of uncertainty that exists in the problem. In such a situation, this work gives insight into exploring the alternative ways that help find the distribution of uncertainty by the decision maker, based on the observations found from the experiments. Algorithms are proposed to find the local optima and are derived from a common evolutionary stable strategy to explore their convergence rate by using a mean estimate [36]. A memetic algorithm was discussed for the minimization of makespan for a distributed assembly permutation flow-shop scheduling problem to obtain accurate results [37]. A multi-objective-based mixed-integer programming model was implemented with the consideration of makespan and total traveling distance as objective functions, and a GA-based heuristic approach was proposed to obtain the optimum results in virtual manufacturing cells (VMC) [38]. To solve the scheduling and maintenance planning simultaneously in DMS, an evolutionary-based GA is proposed, and the performance was validated by comparing with the other algorithm [39]. An IPPS problem was solved with the Simulated Annealing (SA) approach that contains the added flexibilities of process, operation, scheduling to optimize the utilization of machines, and production cost in a DMS [40]. A GA was introduced to identify a near-optimal configuration in a manufacturing network. The performance of GA-derived alternate designs is held in comparison with the output of an intelligent search algorithm. A new approach named hybrid of Estimation of Distribution Algorithm (EDA) was employed to increase the profit in forwarding supply chain and to reduce the carbon footprints in a closed-loop supply chain network system [41]. A framework model was presented for the feasibility and merits and their applications of complex networks in advanced manufacturing systems [42]. A particle swarm optimization with a hill-climbing approach was proposed for minimizing the functions that make span and energy consumption in distributed manufacturing systems [43].
To avoid the difficulty of applying the heuristics for the combinatorial nature of problems like crude oil operation scheduling problem, initially, the problem was converted to an assignment problem-related to tanks and distillers, and later a chromosome was implemented, which helps the further application of meta-heuristics like NSGA-II for optimization of refinery schedule. A case study of a china refinery with three distillers and ten charging tankers with multiple objectives was considered and tested successfully [44]. A modified particle swarm optimization was developed to generate an optimal process plan, and its performance was verified through five independent experiments and a comparison with other meta-heuristic algorithms in the domain of flexible process planning research [45]. Recent advances of multi-objective genetic algorithms (MoGA) were described with differential evolution (HSS-MoEA-DE) to solve several multi-objective scheduling problems in manufacturing systems [46]. A hybrid harmony search and genetic algorithm (HSGA) was proposed for an integrated job maintenance scheduling problem in NMS [47]. A hybrid algorithm was proposed to solve the lot sizing and IPPS problem in the case of plastic molding industry. The proposed approach was compared with the simulated annealing for test its effectiveness [48].

3. Problem Description

Here, thirty-six medium-scale gear manufacturing industries located in a distributed manner across the southern part of India were considered as a case study for investigation for the prospect of providing an optimum solution with a composite multi-objective evolutionary algorithm approach assisted by a classifier. The systematic diagram of the gearbox that is being manufactured and its major parts, i.e., gear, shaft, coupling flanges, key, bearing inner-outer race, and bearing ball in a gearbox is mainly considered in this study and, as shown in Figure 1 has been considered for further investigation. Our research addresses areas of great concern related to finding a suitable supplier according to product consignment, interoperability, lack of efficient techniques, tools, and methods for enhancing the productivity of the system. The process usually begins with the customers in a network-based manufacturing service requesting resources through a particular supplier. However, the search and selection of an appropriate supplier are time-consuming, with the consumer having little or no information about the respective capability narratives. We intend to categorize suppliers that manufacture gearbox related products in the market from their capability narratives and textual information collected via multiple product sourcing and supplier discovery platforms through text mining. Further, efficient supplier classification through the use of supervised machine-learning algorithms is implemented.
The output obtained in the form of task-specific suppliers from the proposed supervised learning algorithm is fed as input for the considered network-based manufacturing system which consists of a set of job orders given by the customers denoted by n.
Each job has numerous process plans by which it can be implemented. A set of available machines is distributed geographically to perform necessary operations in a process plan for the completion of the job. Considering the scenario of the current network-based manufacturing environment, the above background setting presents a challenge in terms of optimizing the objectives, i.e., completion time, energy consumption, machine utilization rate, and service utilization. As the problem is computationally complex and NP-hard in nature, it becomes tedious to solve the above scenario. Thus, there is a necessity for an efficient and effective approach for an optimal process plan of the considered jobs. This research aims to provide a solution to approach an optimal process plan of the considered jobs by fulfilling the above-mentioned objectives.
Hence, an integrated machine-learning-based evolutionary algorithmic approach where the outcome of a supervised algorithm is used as an input to an evolutionary algorithm that was considered. The mathematical model involved is presented in the below section, and its respective notations are explained in Table 1. The present problem requires a few assumptions that are very important to mention below.
  • Job pre-emption is prohibited.
  • Until the previous job is completed, the successive job cannot be processed.
  • Only one job can be processed in an enterprise at a time.
  • The reliability of a machine with respect to time is constant, and its value is the same for that particular machine for every operation while processing a job.
  • At time t = 0, all machines and jobs are concurrently available.
  • The operations of every job and its respective sequence consisting of future processing tasks need to be pre-defined.
Decision Variables:
  • Xvp 1 The pth alternative process plan of job v is selected
  • 0 Under other conditions
  • Yvkpwtur 1 The operation Qvkp preceding over the operation Qwtu on given machine r
  • 0 Under other conditions
  • Zvkpr 1 If given machine r is selected for Qvkp
  • 0 Under other conditions

3.1. Objectives

Minimization   of   makespan   ( L min ) = Max C vkpr
Minimization   of   Machine   Utilization   ( U v ) = v = 1 E D r v r = 1 G ( m c t r m s t r )
Minimization   of   energy   consumption   ( E ) = v = 1 E k = 1 S v p r = 1 G E v k r
Minimization   of   Reliability   ( R ) = k = 1 S v p Re l v k
where Drv represents processing time of job v on the rth machine, and mctr indicates finishing time of rth machine, i.e., the time taken to finish the final operation on rth machine. mstr is the start time of rth machine.

3.2. Subject to Constraints

The initial operation (k = 1) in the possible process plan p of job v is mentioned as
C v p 1 r + B ( 1 X v p )   D v p 1 r v   [ 1 , E ] ,   p     [ 1 , H v ] , r   [ 1 , G ]
The final operation for the possible process plan p of job v is mentioned below
C v p S v p r B ( 1 X v p ) C v p k r v   [ 1 , E ] ,   p     [ 1 , H v ] , r   [ 1 , G ]
Different operations for the same job having precedence constraints are unable to be processed simultaneously.
C v p k r C v p ( k 1 ) r 1 + B ( 1 X v p )   D v k p r     v   [ 1 , E ] ,   p     [ 1 , H v ] , k [ 1 , S v p ] , r , r 1   [ 1 , G ]
Every machine is able to process only one operation at a time and is expressed as
C v p k r C w u t r + B Y v p k w t u r   D v k p r     v , w   [ 1 , E ] ,   p , u     [ 1 , H v ] , k , t [ 1 , S v p ] , r [ 1 , G ]
Among the available process plans, there is the possibility to choose only one alternative process plan
v = 1 E X v p = { 1   if   processplan   p   is   selected   from   job   v   0     otherwise   zero p     [ 1 , H V ]
One machine only must be chosen for each operation.
r = 1 G Z v k p r = { 1   if   processplan   p   is   selected   from   job   v   0     otherwise   zero
v [ 1 , E ] ,   p [ 1 , H v ] , k [ 1 , S v p ]
Table 1 presents the notation used in the mathematical model. Equations (1)–(4) represent an optimization of process parameters like minimizing makespan, maximization of machine utilization, minimization of energy consumption, and maximization of reliability, respectively. Precedence constraints of the operations are represented by Equations (5) and (6); more specifically after the finishing of operation of a particular job, only the next operation must start. Equation (7) represents different operations for the same job having precedence constraints that are unable to be processed simultaneously. Equation (8) represents that each machine is able to process only one operation at a time and is expressed as a constraint for the machine. Equation (9) indicates that among the available process plans there is the possibility to choose only one alternative process plan, and Equation (10) represents that one machine only must be chosen for each operation.

4. A Framework of the Proposed Classifier-Assisted Evolutionary Algorithm Approach

In this section, the proposed classifier-assisted evolutionary algorithm approach as a framework is explained. A distributed manufacturing network environment is considered. Figure 2 represents the proposed approach. In this model, the process gets initiated with the customer requests for a specific product. These requests are handled by enterprise user (EU) and customer user (CU), which are service providers in network-based manufacturing service. CU is an organization that accepts requests of different products from varied customers to complete the consignment agreement. To complete the accepted tasks, the available potential suppliers are evaluated from their database for assigning the task. Here, the main role of CU is to assign the tasks to the appropriate suppliers/manufacturers/distributors, etc., and to monitor their activities regularly to finish the task effectively and efficiently. On the other side, EU also accepts multiple requests from customers; unlike CU, it has the capacity to provide some of the services on its own due to its own manufacturing unit. The remaining services are fulfilled by assigning the task through potential enterprises as sub-contracting. In this study, we consider the EU service path where some of the services are fulfilled on their own. The next step would be the selection of the most appropriate supplier from the list of potential enterprises to whom the customer request must be forwarded. These suppliers are either maintained in the knowledge base or available as text corpus in the form of capability narratives. Initially, categorization into manufacturing and non-manufacturing units is carried out. Following this, text mining is implemented to finally perform supervised machine-learning models-based classification to differentiate the above dataset of suppliers into task-specific suppliers.
The above outcome of task-specific suppliers is further considered in a networked manufacturing environment to undergo three different stages, i.e., order pool, task pool, and service pool for processing requirements of the jobs to its final outcome. To execute the process of the desired product, requests are sent to the order pool where the information of product specifications and their requirements are sorted and stored. These stored orders in the order pool have classified the tasks into individual tasks by taking into consideration factors such as reliability, task priority, processing time, and serviceability identified in this work. They contain a wide variety of tasks initiating from the procurement of raw goods to dispatching the processed product to customers. Among the group of enterprises, the enterprises that are needed to meet the product and process requirements are chosen to carry out the manufacturing functions, i.e., process planning and scheduling for optimal solutions.

5. Experimentation Part Text-Mining

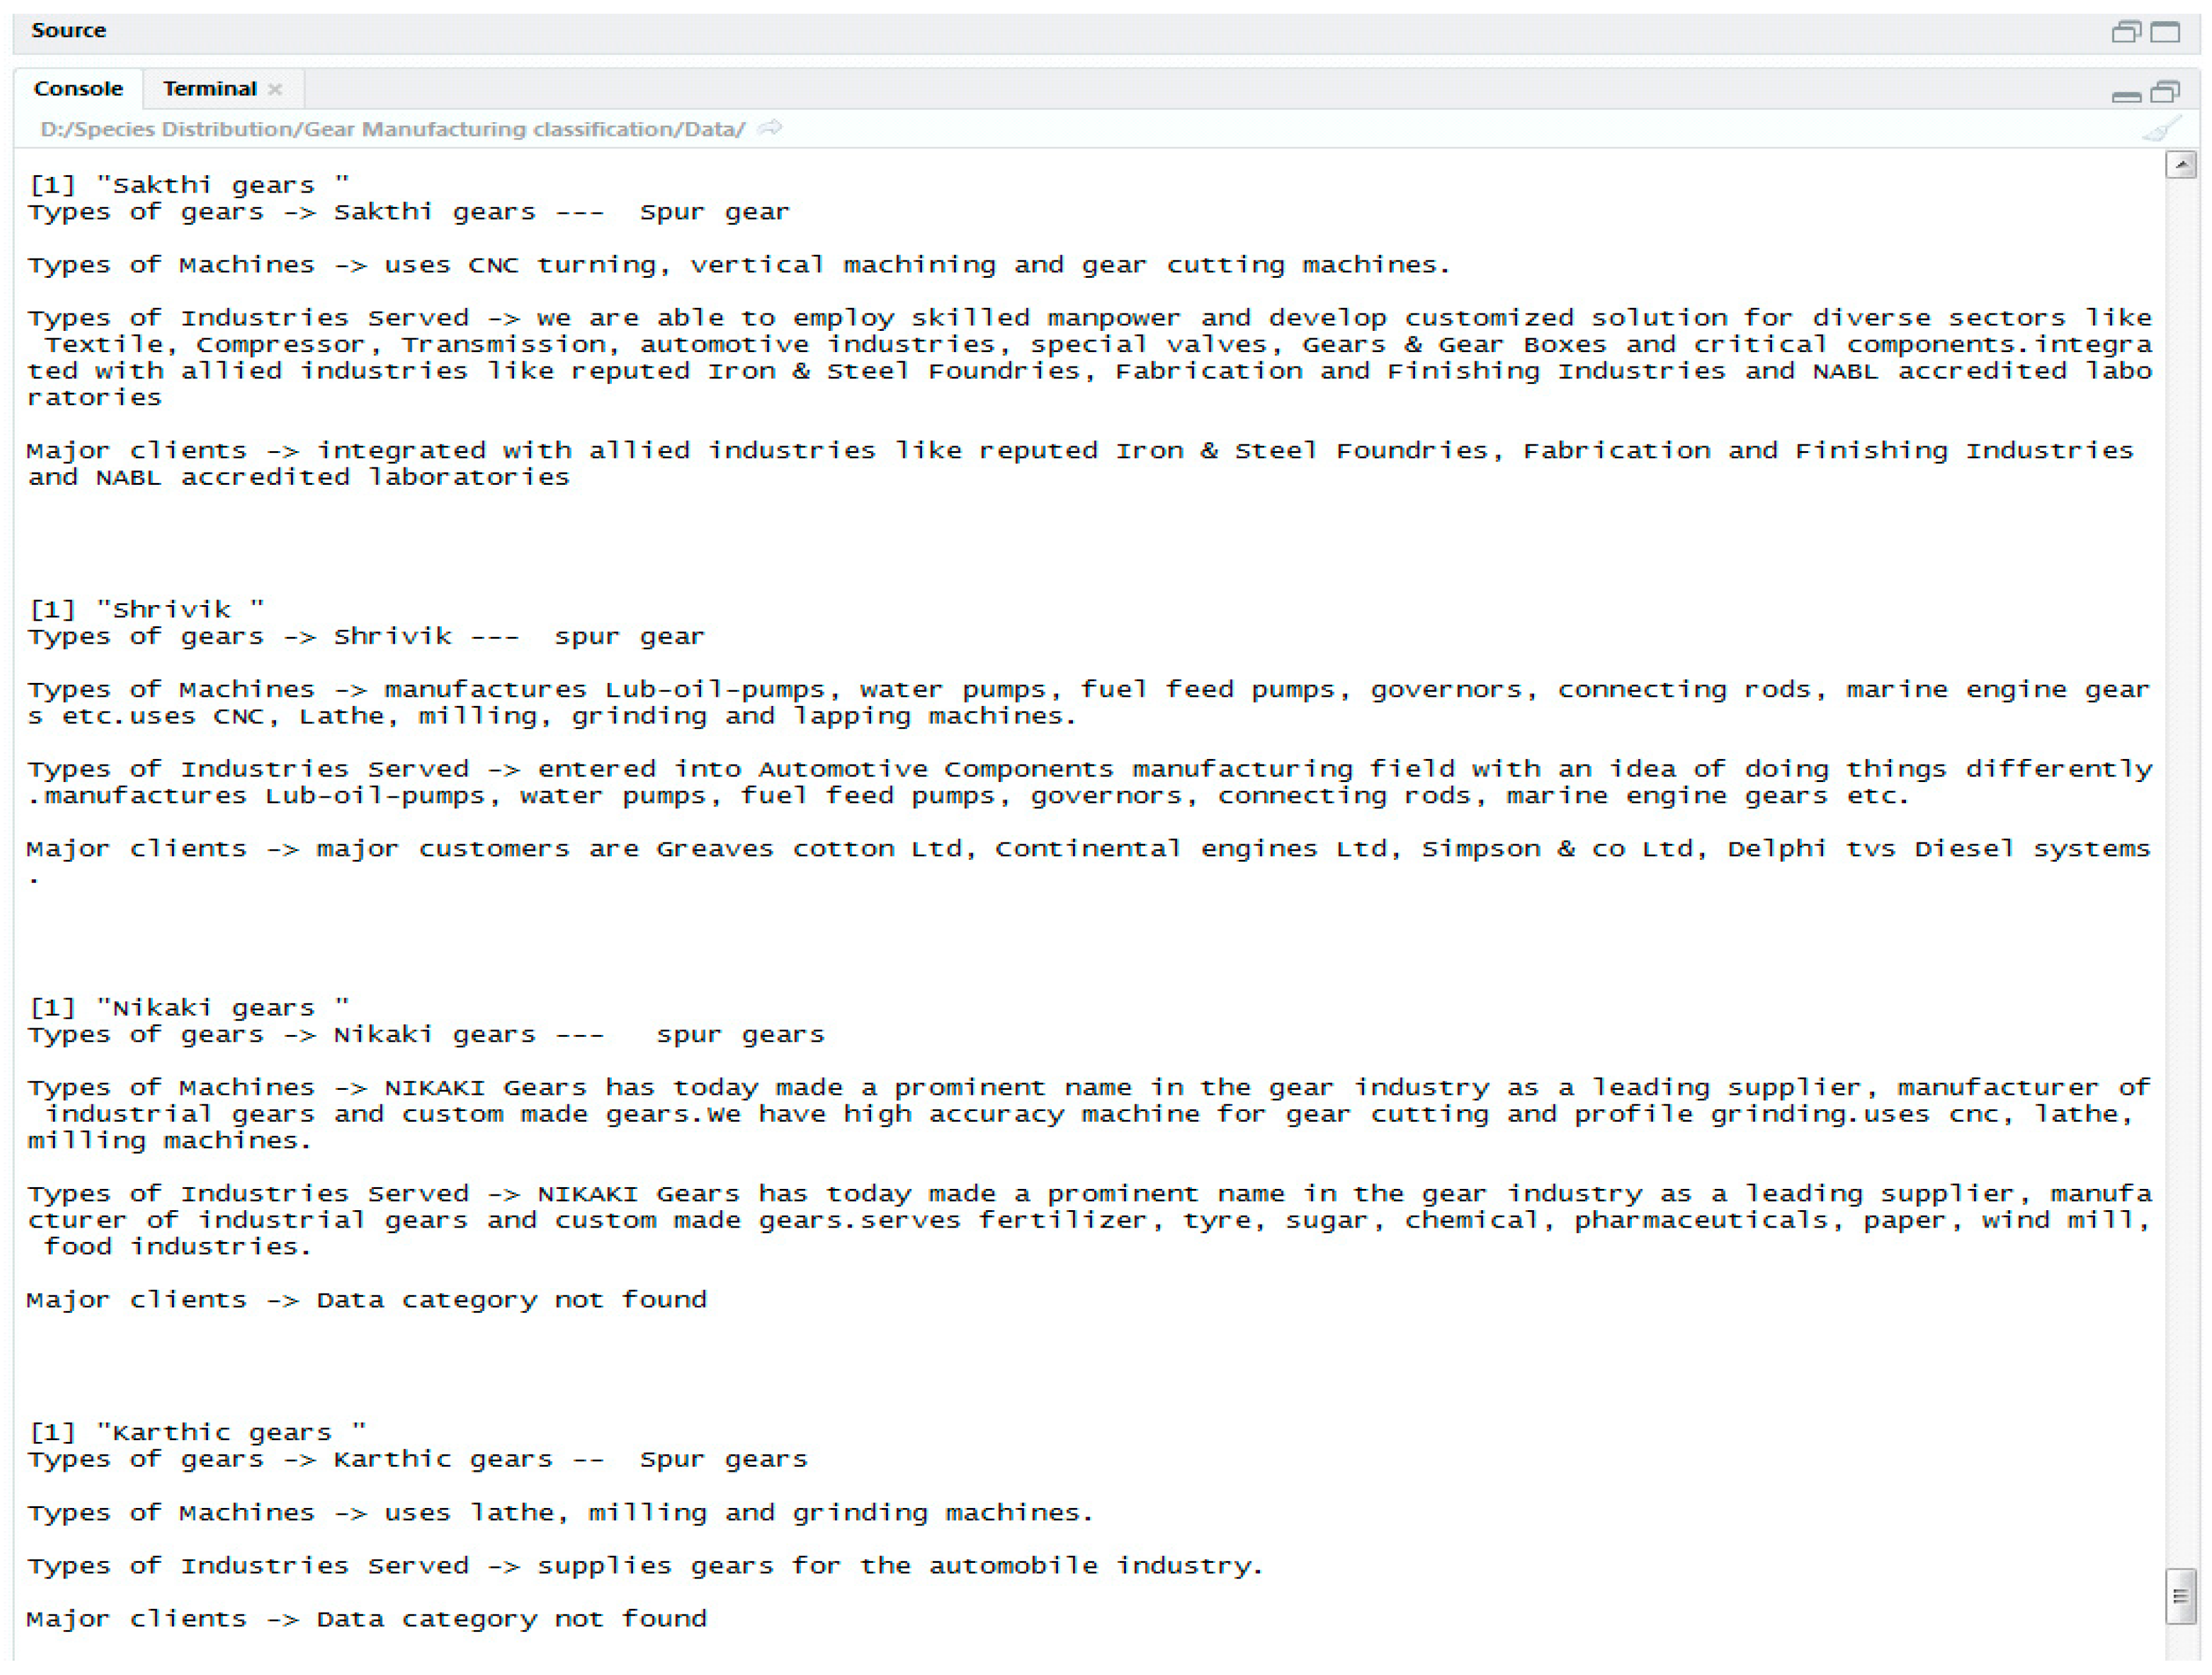
5.1. Task-Specific Supplier Classification through Supervised Machine-Learning Algorithms Based on Text Mining

For the purpose of supplier classification, numerous suppliers representing the gear manufacturing industry in India are taken as a case study. A flowchart explaining the methodology for supplier classification is shown in Figure 3. After pre-processing and mining are applied to the above dataset, the suppliers are classified into manufacturing and non-manufacturing suppliers. Later, the manufacturing suppliers are further classified into task-specific suppliers with the help of various supervised machine-learning algorithms. The performance of these algorithms is validated with different performance measures. The above approach is implemented using R and WEKA.
Step 1.
Creation of Supplier Corpus.
For the purpose of text mining, a corpus of suppliers representing the gear manufacturing industry was created. This corpus was constructed with the help of capability narratives and textual portfolios accumulated via multiple product sourcing and supplier discovery platforms such as Thomas Net, Procure Search, and Supply and Demand Chain Executive, among several others. The enterprises fall into five different categories of gear manufacturing as shown in Table 2. To accumulate any gear not falling into one of the above categories, a miscellaneous type ‘All types of gear’ was created. A test corpus of 40 different gear firms was also created to later validate our approach and classification performance. Out of these four, data are removed from corpus due to inadequate information on several parameters, such as Types of Gears, Types of Machines, Industries Served, etc. This unstructured textual information is then read and converted into vectors in R.
Step 2.
Pre-Processing of Text Corpus and Creation of Document Term Matrix.
The prepared text corpus usually consists of delimiters, blank spaces, punctuation mark, and stop words. These need to be removed before the application of machine-learning models to remove any unnecessary bias during training. The corpus is thus subjected to data cleaning in this stage to eliminate the above entities. To proceed to the later stages, two separate corpuses for manufacturing and non-manufacturing were created. The created manufacturing and non-manufacturing corpus are subjected to training and testing with varied weightages depending upon the frequency of their occurrence as explained [10]. The document term matrix was also created by selecting the features which are critical in the classification. The features can be represented in the form of a word cloud on the basis of varying sparsity measure which indicates the numeric occurrence estimate of the feature in the overall dataset. This measure can then be used to eliminate those features which are not distributed entirely over the dataset and cannot be used to accurately classify the dataset. This matrix is then converted into a comma-separated value CSV file to be later used in training and testing for machine-learning models. Figure 4 represents the word clouds which were formed for the six different gear classes with a varying sparsity measure. Namely, Figure 4a represents word Cloud for Worm at 0.77 sparsity, Figure 4b Word Cloud for Spur 0.90 sparsity, Figure 4c Word Cloud for Helical at 0.77 sparsity Figure 4c Word Cloud for Worm and Helical at 0.90, Figure 4c Word Cloud for Bevel at 0.90, and Figure 4f Word Cloud for All Types of gears at 0.77 sparsity are represented. Through a hit-and-trial approach, 0.77 was selected as the optimum. Several industry-specific information is also extracted through the use of regular expressions as shown in Table 3.
Step 3.
Classification into Task-Specific Suppliers.
The manufacturing corpus represented through document term matrix in the format of comma-separated values is subjected to classification algorithms such as Support Vector Machines, Decision Tree, Naïve Bayes, and Random Forests to classify them into task-specific suppliers. This is implemented with WEKA [49]. Training is performed on a dataset comprising numerous random capability narratives and testing on the above 36 capability narratives of gear manufacturing industries to classify them in one of the industrial categories. The performance of various classification algorithms is validated through the confusion matrix and other performance measures such as Kappa statistic, precision, recall, F-measure, etc., as shown in Table 4 obtained through WEKA. Figure 5 shows the confusion matrix which gives an idea about the number of instances that are classified in various categories, leading the classification to be either False Positive (FP), True Positive (TP), False Negative (FN), or True Negative (TN). The Decision Tree was found to be the best among all models with 0.932 precision the least relative absolute error at 9.6%, followed by Naïve Bayes at 0.73. SVM and Random Forest, having performed below par. Figure 6 shows the results of the text mining depicting the enterprise information. It gives the detailed information of an enterprise such as types of gears manufactured, types of machines used, types of industries served, and major clients of that particular enterprise.

5.2. Proposed Multi-Objective Evolutionary Algorithms

A nature-inspired population-based algorithm called Moth Flame Evolutionary Optimization (MFEO) algorithm introduced bfy MirjalIli [50] that works on the consideration of the natural transverse movement of moths in nature. Moths can travel very long distances on a straight-line path. However, interestingly, along with the straight-line, moths travel spirally near to the light sources which converge into an optimized path for them to reach their destination. Based on this phenomenon, the Moth Flame Evolutionary Optimizing algorithm was developed. The effectiveness of this algorithm over other algorithms (GA, PSO, ACO) is clearly shown by Mirjalili by considering several benchmark functions and case studies [50]. In this work, a hybridized form of the Moth Flame Evolutionary Optimizing algorithm (HMFEO) is presented. We have considered non-dominated sorting Pareto approach for the proposed algorithm hybridization. This has been implemented to the moth flame optimization with non-dominated sorting and crowding distance operators, and a flowchart for the same is presented in Figure 7.
The parameters for the HMFO technique are specified for the implementation of algorithms shown in Table 5 with the number of moths at 200 and the maximum number of iterations at 1500. The upper boundary and lower boundary values are specified based on the test data input.
Step 1.
In HMFO, potential solutions are represented as moths and variables are represented as position in the moth space. A matrix consists of all the moths (n), and their dimension is d.
L = L 11 L 12 .... L 1 d L 21 L 22 .... L 2 d L 31 L 32 .... L 3 d L 41 L 42 .... L 4 d
Initialization of moth population and their spaces are defined with the time matrices and their corresponding inputs. In this proposed HMFEO, a new type of encoding schema was presented to suit the problem nature. The encoding scheme for makespan is presented in Figure 8.
The example of encoding schema is represented in Figure 8, and the encoding consists of three parts. If we observe from bottom to top, Figure 8a is the encoding based on a sequence of operations of each job, which can determine the sequence of operations needed to produce a job. Figure 8b is the encoding based on machines, which can choose the machine for each operation. Figure 8c is the encoding based on the processing times of each machine for the corresponding operation. Therefore, a chromosome in Figure 8 shows three jobs, which consist of nine operations, and will be processed on three different machines. The processing sequence of this chromosome can be represented as Qik j that the jth operation of the ith job that will be processed on the kth machine. Where Q23 1 is the first operation of the second job that will be processed on the third machine. Based on the encoding, schema time matrices were obtained, and the time matrices for makespan can be represented as follows. Makespan = zeros(mach, opns, pp, jobs); makespan(:,:,2, 3) matrix below indicating the processing time values of machines for the corresponding operation for the third job and second process plan. The remaining values in the matrix are kept as zeros.
M1M2M3M4M5M6M7M8M9M10M11M12
O1[12189000000000;
O214923000000000;
O3111616000000000;
O4000000000000;
O5000000000000];
Step 2.
Based on the above information, the energy consumption matrix (Equation (11)) is obtained through multiplication with the corresponding time matrix with specified energy consumption input mentioned in Table 6. The encoding schema is specified in Figure 9.
EC matrix (o, m, p, j) = L matrix (o, m, p, j) ∗ E (Rated energy matrix);
The encoding schema is represented as shown in Figure 9, and the encoding consists of three parts. Figure 9a is the encoding based on a sequence of operations of each job, which can determine the sequence of operations needed to produce a job. Figure 9b shows the encoding based on machines, which can choose the machine for each operation. Figure 9c is the encoding based on the energy consumption of each machine for the corresponding operation of a particular job. Based on the encoding schema time, matrices were obtained, and the time matrices for energy consumption can be represented as follows. Energy-consumption(:,:,1,2) indicates energy consumption matrix for second job first process plan.
M1M2M3M4M5M6M7M8M9M10M11M12
O1[175312198000000000;
O2400234330000000000;
O3325429352000000000;
O4000000000000;
O5000000000000];
The above matrix indicating the energy consumption values of machines for the corresponding operation for the third job and second process plan. The remaining values in the matrix are kept as zeros.
Step 3.
A score function is defined that helps to select a suitable process plan, and it is shown in Equation (12), where a higher score value indicates that the probability of selecting the process plan is lesser. The lower the score value, the better the process plan. The formula for the score function is shown below.
Score = ( L E v k ) / ( R v k )
where L represents makespan, Evk indicates energy consumption for job v on machine k, and Rvk indicates reliability for job v on machine k.
Step 4.
A matrix CL is formed considering all the moths into the objective functions that are stored in FK represented below.
C = [ C L 1 C L 2 C L 3 C L 4 ] T
A flame matrix with a similar size to the moth’s matrix is considered that stores the fitness values. Even though the moth (L) matrix and flame (C) matrix consist of solutions, the difference is that moths are search agents, whereas the flame indicates the best position of moths
Step 5.
After an appropriate process plan is selected, we consider the rows as individual light sources through which we find the minimum values.
Step 6.
The matrices are explored row-wise to find a minimum entry in their respective rows once the required inputs are received and the search space is clearly initialized.
Step 7.
Moths maintain the best solution by updating its position Equation (13) by moving around the flag that is dropped by themselves during the search process. Update the position of the moth with respect to one flame. The spiral motion follows the Equation (13) represented as
Z ( L x , C y ) = S x e a t c o s ( 2 t ) + L y
Lx indicates the xth moth, Cy indicates the yth flame, and Z indicates spiral function. Sx is the distance of xth moth for yth flame, Sx = ‖Cy − Lx‖, which is a constant defining shape of spiral motion. Where t [−1, 1],
Step 8.
After finding the minimum entry in the summed matrix and converting all ∞’s to 0s, the sum of all the values is found in their respective objective function matrices.
Step 9.
Finally, we solve the function to generate optimal values for all objectives.
The most likely solution to our problem is selected based on the most appropriate fitness value. First, the data from various gear manufacturing enterprises are collected. The collected data contain the information regarding make span of the jobs, energy consumption, reliability of machines, and service utilization rate. The proposed HMFO algorithm is run on the Mathworks on Lenovo with an Intel processor with Windows 10 as the OS with 64 Gigabyte of RAM.
In this study, 10 different instances which are real-life case data have been considered by setting the numerical quantity of jobs to be 6 and machines to be 12, where each job has a varied number of substitutable process plans. Every process plan has a different set of operations. For each operation, there is a different set of machines which are capable enough to process the required task. For example, the instance 6 shown in the below Table 7 has 6 jobs and 12 machines in total. Job 1 has two alternative process plans and these process plans have three and three operations, respectively. One operation processed on a machine at a time.
The processing time of various operations of jobs on several machines in different process plans, the energy consumption, and reliability of all the machines are known earlier. Table 6 provides the energy consumed per unit time by each machine and the reliability of the machine. To solve the considered problem, a newly established bio-inspired Moth Flame Optimization algorithm (HMFO) was adopted, and further, it was mapped according to problem nature. The operations were assigned to the machines in such a way that the considered objective functions are satisfied and an optimal sequence is obtained. The above-discussed approach is implemented for all formulated instances to find the robustness of the algorithm.

6. Discussion and Results

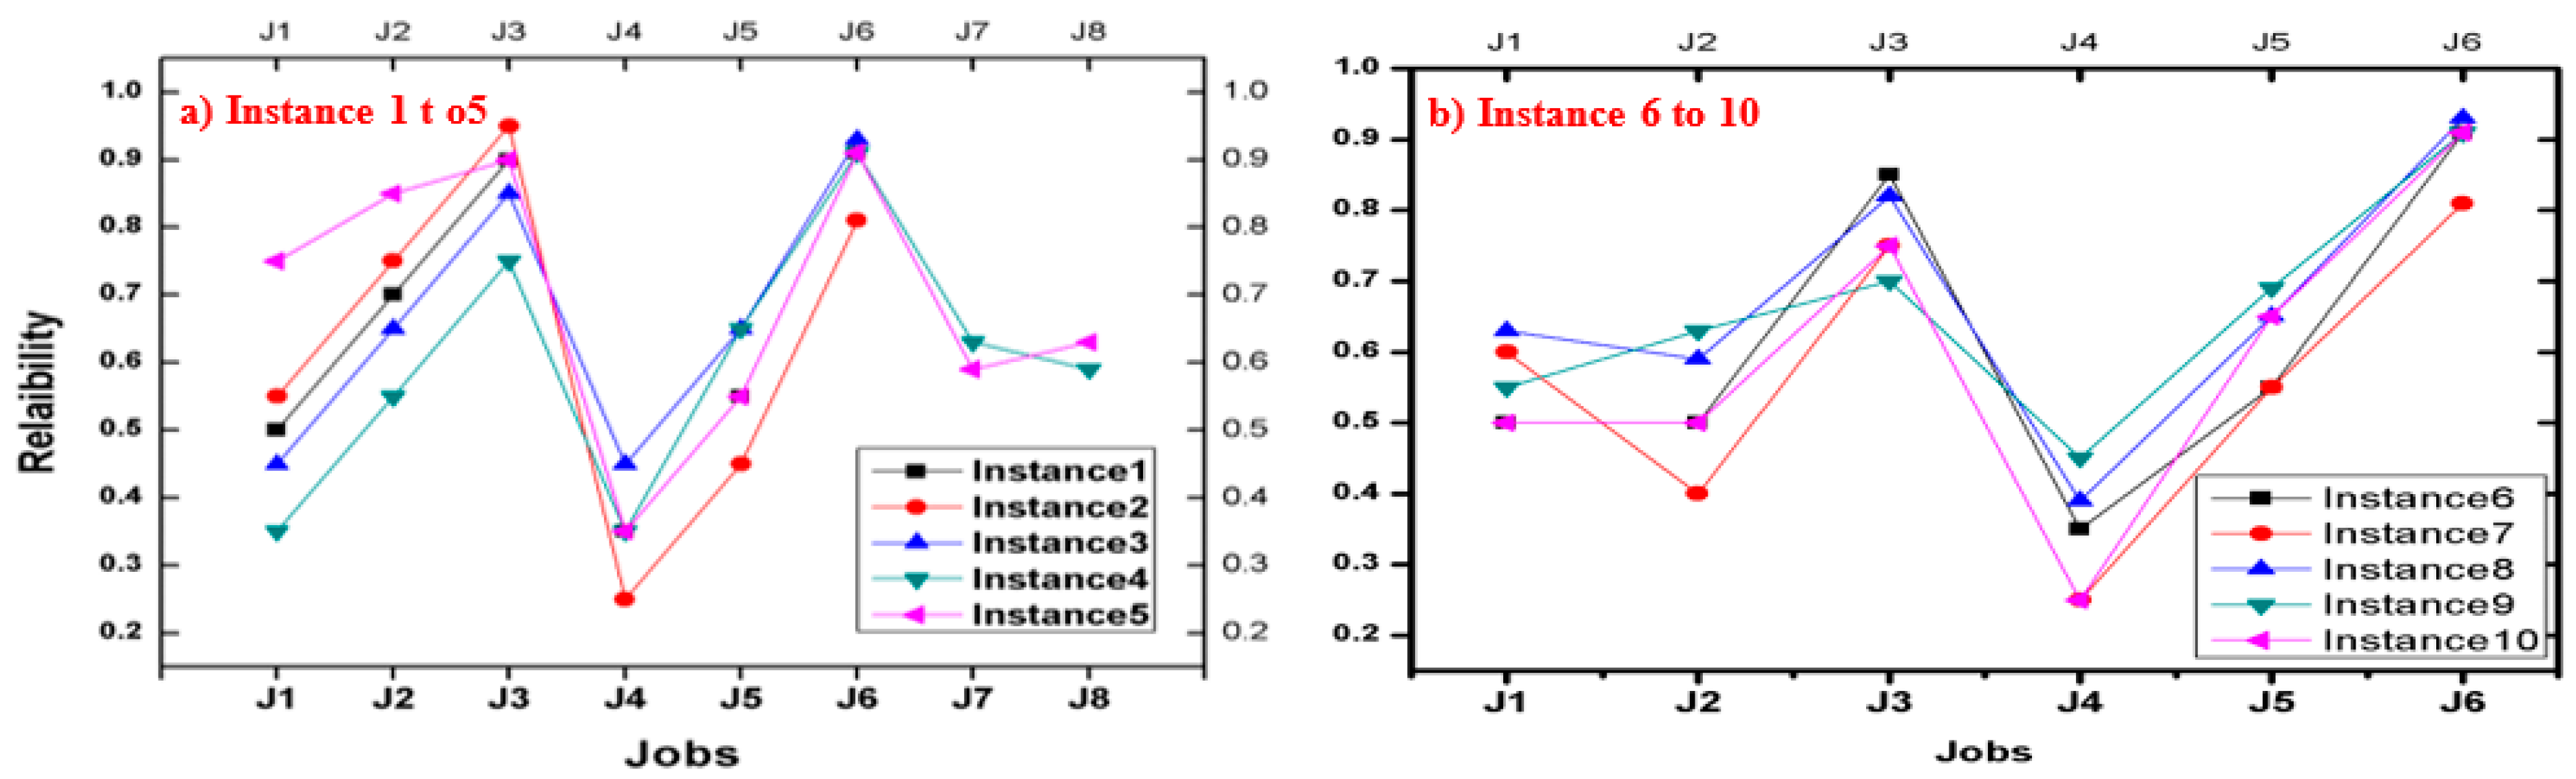
6.1. Validation of Proposed HMFO Algorithm with the Experimental Instances

To validate our approach toward optimization of makespan and energy consumption, we consider some experimental instances from the literature. Table 7 shows the results of the experimental instances with makespan and energy consumption values. We have calculated makespan and energy consumption for around a total of 35 experiments with the data available from (instances 1–32) mentioned in [51] and (instances 33–35) mentioned in [52]. A comparison of our proposed HMFO results with results carried out with a Simulated Annealing Genetic Algorithm (SA-GA) for instances 1–32. For most of the instances, the proposed HMFO gives better makespan and energy consumption values when compared with existing SA-GA makespan and energy consumption values. We also compared our proposed HMFO results with results carried out by [52], a Genetic Algorithm-based Memetic Algorithm (GA-MA) for instances 33–35. For most of the instances, the proposed HMFO gives better makespan and energy consumption values when compared with existing GA-MA makespan and energy consumption values. All the above results indicate the better performance of proposed HMFO with some of the experimental instances which were already proposed in the literature.

6.2. Evolution of Proposed HMFO with Practical Instances

After proving the effectiveness of the proposed HMFO with practical instances in Table 8. Furthermore, the effectiveness of the proposed algorithm is tested on different problems of practical instances with the aim to minimize makespan and energy consumption, maximizing machine utilization and reliability. Table 8 describes the optimal process plans chosen for each job in all the instances. Out of the various alternative process plans, only one process plan per job is chosen depending upon the score value. The lower the score value, the better the process plan. Thus, whichever process plan gives the lowest score value, that process plan is selected. For example, in instance 6, the process plans selected for the jobs 1–6 are 1, 1, 1, 1, 2, and 1, respectively.
Table 9 shows the optimal values of makespan and energy consumption for all different problem instances (1–10) of HMFO and NSGA-II. These are the Pareto optimal values obtained by the simultaneous optimization of all the objectives. For example, in instance1, for proposed HMFO, the Pareto optimal value of makespan is 30, and energy consumption is 8906 and with NSGA-II the values of makespan and energy consumption as 43 and 9083, respectively. For instance6, for proposed HMFO, the value of makespan is 986, and energy consumption is 15,553. With NSGA-II, we obtained the values of makespan and energy consumption as 1083 and 17,694, respectively. To validate the performance of the proposed algorithm, 10 different instances were considered, and their considered objectives makespan and energy consumption values are shown in Table 9. In Table 9, clear observation indicates Pareto optimal values of makespan and energy consumption values are dependent on the number of jobs and machines. Interestingly makespan and energy consumption values for instance 3, i.e., six jobs and eight machines (6 × 8) case is more when compared to instances other instances 1, 2, i.e., six jobs, six machine cases (6 × 6), and instances 4 and 5, i.e., eight jobs, eight machine case (8 × 8). A similar trend is also shown in the literature for 6 × 8 cases for makespan and energy consumption values. In almost all instances, the makespan and energy consumption values of HMFO are lesser and far better than those given by NSGA-II. Thus, upon comparing both the algorithms we can conclude that the optimum values are attained in the case of HMFO, which proves the effectiveness of the proposed multi-objective evolutionary algorithm.
For instances 6–10, even though there are equal instances of jobs and machines, the makespan and energy consumption values are different and depend only on the operations and types of machines used.
For a better portrayal of the optimized HMFO algorithm’s results, Gantt charts have been utilized for all 10 instances. For better understanding, Gantt charts for instances 1–5 are shown separately in Figure 10, and Gantt charts for instances 6–10 are shown separately in Figure 11. Here, Figure 10 and Figure 11 illustrate the maximum completion time for the problem with respect to instances 1–5 and instances 6–10, respectively. The X-axis of the Gantt chart indicates the average time of completion of the job (makespan), and the Y-axis denotes the machines. As stipulated in Figure 10, it is clearly observable that the makespan for all the five instances is 30, 27, 179, 42, and 50, respectively, which replicates the results that are previously mentioned in Table 9. In Figure 11, it is clearly observable that the makespan for all the five instances is 986, 1179, 1026, 669, and 814, respectively, which replicates the results that are previously mentioned in Table 9.
In addition to comparing the performance of both the algorithms, i.e., HMFO and NSGA-II, a comparative study of the machine utilization rate of different machines for all the 10 instances is illustrated in Figure 12 and Figure 13. It can be inferred from Figure 12 that in all instances 1–5, machine utilization rates are far better for the results that are obtained with HMFO when compared with results that are obtained with NSGA II. In Figure 13 for instance 6 in case of HMFO, machine 6 has the maximum utilization rate, and machine 9 has the minimum utilization rate. In case of NSGA-II, machine 6 has the highest, and machine 12 has the least utilization rate. In addition, it is evident from the bar graph that in the case of HMFO, machine 8 and machine 12 have zero utilization rate. This means that these machines are not at all utilized in the manufacturing process and in the case of NSGA-II, all the machines are completely utilized. Since our objective is the maximization of the service utilization rate, the machines that are not utilized can be completely removed from being ignored and can be removed from the workspace. Since HMFO reduces the initial cost involved in installing the machines by eliminating the machines, we can conclude that HMFO gives the optimum results of the machine utilization rates.
In Table 9, the energy consumption values for all instances are plotted and shown in the Figure 14. It can be inferred that energy consumption values for all 10 instances are lower for HMFO when compared to NSGA II. Figure 15 articulates the reliability of the jobs/services provided by the selected enterprise with respect to each instance. In Figure 15, it can be inferred that for all five instances, there is not much change in the reliability. In all the instances, i.e., instances 1–10, job 3 has the highest reliability, which means machines performing job 3 have the highest probability of surviving their expected lifetime. Job 4 has the least reliability, which indicates that machines processing job 4 fail at a very early stage and cannot survive at least half of their intended lifetime. Hence, the machines involved in the manufacture of job 4 need to be improved/changed.
To make the comparison of proposed algorithm with the benchmark algorithms, several performance measures were reported [53,54,55,56], and these measures were mainly useful for multi-/many-objective optimization problems. To make the process simple and effective, Pareto optimal graphs were plotted for three objectives shown in Figure 16 and Figure 17. Figure 16 and Figure 17 give various Pareto graphs generated by HMFO and NSGA –II, respectively. In Figure 16 and Figure 17, the black color solutions indicate the non-dominated solutions, and blue color solutions indicate the remaining solutions. Considering effective evolution of all of the algorithms’ performances gives a better picture.
The hypervolume (HV) is most used Performance Indicator (PI) among all for the comparison multi-objective algorithms [56]. HV is the volume occupied by the dominated Pareto front approximation ‘R’ drawn from a reference point o £ O L, such that Y £ R, R < o. The HV is given by Equation (14). Here, ηL represents L dimensional lebesgue measure.
H V ( R ,   o ) = η L ( Y R [ Y , o ]
The HV describes the region of the objective space which is weakly dominated by the approximation set. Until now, there are no particular guidelines for selecting the reference point; however, the worst possible point (i.e., dominated by all points) then the nadir point (1, 1, … 1) is considered in most of the studies [57]. Here, the HV is calculated by specifying the reference point as (1.1, 1.1, … 1.1). Out of all the available HV values, the best, median, and least values of hypervolume (HV) results are indicated with help of box-plot in Figure 18. The HV is calculated for various instances of problems of proposed HMFO and NSGA-II algorithms represented in Figure 18. For instance 1, in the case of HMFO, the best, median, and least values are 0.6997, 0.6297, and 0.5497, and similarly for instance 1, in the case of NSGA II, the best, median, and least HV values are 0.5653, 0.4853, and 0.3653, respectively. In a similar manner, the box plots were obtained for all 10 instances that are represented in Figure 18. It is well known from the literature the higher the HV value, the better the performance of the algorithm. In the figure, after thorough observation, the HV values indicate the higher values for all the instances (i.e., from instance 1 to instance 10) in case of proposed HMFO when compared to the NSGA –II algorithm. This demonstrates the superiority of the proposed HMFO over the NSGA II algorithm for better approximation. Moreover, HV results for the first five instances (instances 1–5) fall in a lower range when compared to the other instances (instances 6–10). This may be due to different problem scenarios that were considered in all 10 instances.
Apart from HV indicator, the results of various other performance measures for first five instances (1–5) and last five instances (6–10) are shown in Table 10 and Table 11, respectively. Out of all the available solutions, the number of Non-Dominated (ND) solutions obtained by a proposed algorithm is denoted as α, and the number of ND solutions that are not identified by the benchmark algorithm is denoted by β. For better results, it is suggested to have larger values of α and β and the ratio of β/α ratio near to one determines the effectiveness of the algorithm’s strength. The percentage of ND solutions provided by a certain algorithm is expressed in terms of dominance ratio ϒ in Equation (15). If larger, the dominance ratio indicates the superiority of the given algorithm.
ϒ =   | B ( i M i ) \ B ( i k M i ) | B ( i M i )
where | B ( i M i ) \ B ( i k M i ) | indicates the non-dominated solutions found by the algorithm M that are unable to identify by the other standard algorithms.
K(a,b) in Equation (16) is useful for comparison of Pareto fronts, particularly to identify the weak solutions of algorithm b with an algorithm (a > b), which ultimately gives the correctness of the particular algorithm. Furthermore, lesser K species than the ND solutions identified by a particular algorithm are considered weaker.
K ( a , b ) = | b B , a A : a > b | | B |    
Lesser π is necessary, and the values which are very nearer indicate the highly distributed uniformly over the Pareto front. Equation (17) values of π which is the Euclidean length between end points of the identified ND Pareto set by an algorithm is compared to the net ND Pareto front.
Π = F f + F l + i = 1 J 1 | F i F | F f + F l + ( J 1 ) F
λ indicates convergence power if smaller λ values are useful for identified ND solutions by the algorithm and fall very close range in the vicinity of net ND solutions for Euclidean lengths.
Hyper-volume ratio or Hyper-area Ratio (HR) is the ratio of HV ratio of the algorithms. HR(R,h,o,) = HV(R, o)/HV(h, o) from this lower HR is required to obtain better approximation [58]. In Table 10 and Table 11, it can be confirmed that the values marked in bold are the best values for showing the superiority of the proposed HMFO algorithm over the NSGA II algorithm.

7. Conclusions

Advancements in technology, such as information and communication technologies (ICT), have changed the traditional manufacturing systems practices. This is especially true for a distributed manufacturing system due to its ability to cater to its needs such as Big Data, interoperability, timely delivery, etc. In this research, the authors have considered a case study of automotive industries which are small and medium scale in nature and are geographically distributed with the objectives such as the selection of appropriate suppliers according to product type and enhancing the system functions such as makespan, energy consumption, and increased service utilization rate, interoperability, and reliability. To execute the first objective: supplier discovery is implemented through text mining based on supervised machine-learning models. The results of classification Decision Tree (J48), Naïve Bayes, Random Forest, and Support Vector Machines are validated through various performance measures, mainly Precision, Recall, and F-Measures. Decision trees have been found to be best with a precision of 0.93 for the purpose. These selected potential suppliers and their related information have been transferred as input data to the next phase.
The flexibility and complexity of a distributed manufacturing environment create the need for investigating the multiple process plans and multiple performance measures. Hence, the research paper also investigated alternative process plans to the objective functions makespan, energy consumption, service utilization, and reliability of services. We developed a MINLP model, and by acknowledging the NP-hard nature of the above scenario, a multi-objective evolutionary algorithm was decided to be utilized for which the input of task-specific suppliers is the outcome of supervised algorithmic models. As a result, we have used a bio-inspired Moth Flame Optimization evolutionary algorithm and tuned the algorithm to fit our problem objectives.
The results demonstrate that the use of evolutionary HMFO reduces the number of machine when compared to NSGA-II proving the effectiveness of the methodology used in this research. It also provides similar results with respect to the survivability of jobs as compared to NSGA-II. Out of all the considered objective functions, energy consumption is of utmost importance because of its effect on the current manufacturing environment. An experimental comparison also reveals the effectiveness of the proposed HMFO. Various performance indicators are used to compare the superiority of the proposed HMFO over the benchmark NSGA II algorithm. Thus, the results obtained showcase the superiority of the approach mentioned in this research. Future work requires adopting an application of the proposed methodology on a wider dataset using various other many-objective evolutionary algorithms. It is important to mention here that the comparison of proposed algorithms must be performed by using the state-of-the-art many-objective optimization algorithms like Non-Dominated Sorting Genetic algorithm (NSGA) –III, S-Metric Selection Evolutionary Multi-Objective Optimization Algorithm (SMS-EMOA), EvolutionaryA Algorithm-based on Decomposition (MOEA/D), etc., for better understanding of the performance of the algorithm [59].

Author Contributions

All authors contributed equally to this work and approved the final manuscript. All authors have read and agreed to the published version of the manuscript.

Funding

The project is funded by Department of Science and Technology, Science and Engineering Research Board (DST-SERB), Statutory Body Established through an Act of Parliament: SERB Act 2008, Government of India with Sanction Order No ECR/2016/001808, and also by FCT–Portuguese Foundation for Science and Technology within the R&D Units Projects Scopes: UIDB/00319/2020, UIDP/04077/2020, and UIDB/04077/2020.

Institutional Review Board Statement

Not applicable.

Informed Consent Statement

Not applicable.

Data Availability Statement

Not applicable.

Conflicts of Interest

The authors declare no conflict of interest.

References

  1. Srai, J.S.; Graham, G.; Hennelly, P.; Phillips, W.; Kapletia, D.; Lorentz, H. Distributed manufacturing: A new form of localised production? Int. J. Oper. Prod. Manag. 2020, 40, 697–727. [Google Scholar] [CrossRef]
  2. Ur-Rahman, N.; Harding, J.A. Textual data mining for industrial knowledge management and text classification: A business-oriented approach. Expert Syst. Appl. 2012, 39, 4729–4739. [Google Scholar] [CrossRef] [Green Version]
  3. Zhang, J.; Gao, L.; Chan, F.T.; Li, P. A holonic architecture of the concurrent integrated process planning system. J. Mater. Process. Technol. 2003, 139, 267–272. [Google Scholar] [CrossRef]
  4. Kumar, M.; Rajotia, S. Integration of scheduling with computer aided process planning. J. Mater. Process. Technol. 2003, 138, 297–300. [Google Scholar] [CrossRef]
  5. Choudhary, A.; Oluikpe, P.; Harding, J.; Carrillo, P. The needs and benefits of text mining applications on post-project reviews. Comput. Ind. 2009, 60, 728–740. [Google Scholar] [CrossRef] [Green Version]
  6. Li, N.; Wu, D. Using text mining and sentiment analysis for online forums hotspot detection and forecast. Decis. Support. Syst. 2010, 48, 354–368. [Google Scholar] [CrossRef]
  7. Kucheria, P.B.; Shaikh, I.R. Ontology Based Text Mining. Corpus ID: 212474163. Available online: https://www.semanticscholar.org/paper/Ontology-based-Text-Mining-Kucheria-Shaikh/ec8e69e2250eb5916e7aa1c782a9689bce985876 (accessed on 19 May 2021).
  8. Yazdizadeh, P.; Ameri, F. A text mining technique for manufacturing supplier classification. In Proceedings of the ASME 2015 International Design Engineering Technical Conferences and Computers and Information in Engineering Conference, Boston, MA, USA, 2–5 August 2015. [Google Scholar]
  9. Morariu, C.; Morariu, O.; Răileanu, S.; Borangiu, T. Machine learning for predictive scheduling and resource allocation in large scale manufacturing systems. Comput. Ind. 2020, 120, 103244. [Google Scholar] [CrossRef]
  10. Park, K.; Kremer, G.O. Text mining-based categorization and user perspective analysis of environmental sustainability indicators for manufacturing and service systems. Ecol. Indic. 2017, 72, 803–820. [Google Scholar] [CrossRef]
  11. Akhtar, M.D.; Manupati, V.K.; Varela, M.L.R.; Putnik, G.D.; Madureira, A.M.; Abraham, A. Manufacturing services classification in a decentralized supply chain using text mining. In Advances in Intelligent Systems and Computing; Kacprzyk, J., Ed.; Springer Science and Business Media LLC: Warangal, India, 2018; pp. 186–193. [Google Scholar]
  12. Bianchi, G.; Bruni, R.; Scalfati, F. Identifying e-commerce in enterprises by means of text mining and classification algorithms. Math. Probl. Eng. 2018, 2018, 7231920. [Google Scholar] [CrossRef]
  13. Shao, X.; Li, X.; Gao, L.; Zhang, C. Integration of process planning and scheduling—A modified genetic algorithm-based approach. Comput. Oper. Res. 2009, 36, 2082–2096. [Google Scholar] [CrossRef]
  14. Chryssolouris, G.; Chan, S.; Cobb, W. Decision making on the factory floor: An integrated approach to process planning and scheduling. Robot. Comput. Manuf. 1984, 1, 315–319. [Google Scholar] [CrossRef]
  15. Chryssolouris, G.; Chan, S.; Suh, N. An integrated approach to process planning and scheduling. CIRP Ann. 1985, 34, 413–417. [Google Scholar] [CrossRef]
  16. Montreuil, B.; Frayret, J.-M.; D’Amours, S. A strategic framework for networked manufacturing. Comput. Ind. 2000, 42, 299–317. [Google Scholar] [CrossRef]
  17. Wang, Y.H.; Yin, C.W.; Zhang, Y. A multi-agent and distributed ruler based approach to production scheduling of agile manufacturing systems. Int. J. Comput. Integr. Manuf. 2003, 16, 81–92. [Google Scholar] [CrossRef] [Green Version]
  18. Chen, C.-L. A novel disruptive innovation-like algorithm for single-machine scheduling with sequence-dependent family setup times. Appl. Sci. 2021, 11, 986. [Google Scholar] [CrossRef]
  19. Tursi, A.; Panetto, H.; Morel, G.; Dassisti, M. Ontological approach for products-centric information system interoperability in networked manufacturing enterprises. Annu. Rev. Control. 2009, 33, 238–245. [Google Scholar] [CrossRef] [Green Version]
  20. Dehghani, M.; Montazeri, Z.; Dehghani, A.; Malik, O.; Morales-Menendez, R.; Dhiman, G.; Nouri, N.; Ehsanifar, A.; Guerrero, J.M.; Ramirez-Mendoza, R.A. Binary spring search algorithm for solving various optimization problems. Appl. Sci. 2021, 11, 1286. [Google Scholar] [CrossRef]
  21. Manupati, V.; Thakkar, J.; Wong, K.; Tiwari, M. Near optimal process plan selection for multiple jobs in networked based manufacturing using multi-objective evolutionary algorithms. Comput. Ind. Eng. 2013, 66, 63–76. [Google Scholar] [CrossRef]
  22. Ehm, J.; Freitag, M.; Frazzon, E.M. A heuristic optimisation approach for the scheduling of integrated manufacturing and distribution systems. Procedia CIRP 2016, 57, 357–361. [Google Scholar] [CrossRef]
  23. Al-Shayea, A.; Fararah, E.; Nasr, E.A.; Mahmoud, H.A. Model for integrating production scheduling and maintenance planning of flow shop production system. IEEE Access 2020, 8, 208826–208835. [Google Scholar] [CrossRef]
  24. Manupati, V.; Deo, S.; Cheikhrouhou, N.; Tiwari, M. Optimal process plan selection in networked based manufacturing using game-theoretic approach. Int. J. Prod. Res. 2012, 50, 5239–5258. [Google Scholar] [CrossRef]
  25. Petrović, M.; Mitić, M.; Vuković, N.; Miljković, Z. Chaotic particle swarm optimization algorithm for flexible process planning. Int. J. Adv. Manuf. Technol. 2016, 85, 2535–2555. [Google Scholar] [CrossRef]
  26. Mohammadi, S.; Al-E-Hashem, S.M.; Rekik, Y. An integrated production scheduling and delivery route planning with multi-purpose machines: A case study from a furniture manufacturing company. Int. J. Prod. Econ. 2020, 219, 347–359. [Google Scholar] [CrossRef]
  27. Barzanji, R.; Naderi, B.; Begen, M.A. Decomposition algorithms for the integrated process planning and scheduling problem. Omega 2020, 93, 102025. [Google Scholar] [CrossRef]
  28. Ertogral, K.; Öztürk, F.S. An integrated production scheduling and workforce capacity planning model for the maintenance and repair operations in airline industry. Comput. Ind. Eng. 2019, 127, 832–840. [Google Scholar] [CrossRef]
  29. Li, X.; Gao, L.; Wang, W.; Wang, C.; Wen, L. Particle swarm optimization hybridized with genetic algorithm for uncertain integrated process planning and scheduling with interval processing time. Comput. Ind. Eng. 2019, 135, 1036–1046. [Google Scholar] [CrossRef]
  30. Cao, Y.; Zhang, H.; Li, W.; Zhou, M.; Zhang, Y.; Chaovalitwongse, W.A. Comprehensive learning particle swarm optimization algorithm with local search for multimodal functions. IEEE Trans. Evol. Comput. 2019, 23, 718–731. [Google Scholar] [CrossRef]
  31. Zhou, L.; Zhang, L.; Sarker, B.R.; Laili, Y.; Ren, L. An event-triggered dynamic scheduling method for randomly arriving tasks in cloud manufacturing. Int. J. Comput. Integr. Manuf. 2018, 31, 318–333. [Google Scholar] [CrossRef]
  32. Maturana, F.P.; Norrie, D.H. A generic mediator for multi-agent coordination in a distributed manufacturing system. In Proceedings of the 1995 IEEE International Conference on Systems, Man and Cybernetics. Intelligent Systems for the 21st Century, Vancouver, BC, Canada, 22–25 October 2002; Institute of Electrical and Electronics Engineers (IEEE): Piscataway, NJ, USA, 2002; pp. 952–957. [Google Scholar]
  33. Sohrabi, M.K.; Azgomi, H. A Survey on the combined use of optimization methods and game theory. Arch. Comput. Methods Eng. 2018, 27, 59–80. [Google Scholar] [CrossRef]
  34. Jia, H.; Fuh, J.; Nee, A.; Zhang, Y. Integration of genetic algorithm and Gantt chart for job shop scheduling in distributed manufacturing systems. Comput. Ind. Eng. 2007, 53, 313–320. [Google Scholar] [CrossRef]
  35. Shen, W.; Wang, L.; Hao, Q. Agent-based distributed manufacturing process planning and scheduling: A state-of-the-art survey. IEEE Trans. Syst. Man Cybern. Part C Appl. Rev. 2006, 36, 563–577. [Google Scholar] [CrossRef]
  36. Gao, J.; Smyrnakis, M.; Gao, H.T.; Xu, Y.; Barreiro-Gomez, J.; Ndong, M.; Smyrnakis, M.; Tembine, H. Distributionally Robust Optimization. Optim. Algorithms Ex. 2018. [Google Scholar] [CrossRef]
  37. Liu, B.; Wang, K.; Zhang, R. Variable neighborhood based memetic algorithm for distributed assembly permutation flowshop. In Proceedings of the 2016 IEEE Congress on Evolutionary Computation (CEC), Vancouver, BC, Canada, 24–29 July 2016; pp. 1682–1686. [Google Scholar] [CrossRef]
  38. Kesen, S.E.; Das, S.K.; Güngör, Z. A genetic algorithm based heuristic for scheduling of virtual manufacturing cells (VMCs). Comput. Oper. Res. 2010, 37, 1148–1156. [Google Scholar] [CrossRef]
  39. Sortrakul, N.; Nachtmann, H.; Cassady, C. Genetic algorithms for integrated preventive maintenance planning and production scheduling for a single machine. Comput. Ind. 2005, 56, 161–168. [Google Scholar] [CrossRef]
  40. Li, W.D.; McMahon, C.A. A simulated annealing-based optimization approach for integrated process planning and scheduling. Int. J. Comput. Integr. Manuf. 2007, 20, 80–95. [Google Scholar] [CrossRef] [Green Version]
  41. Tiwari, A.; Chang, P.-C.; Tiwari, M.K.; Kandhway, R. A Hybrid Territory Defined evolutionary algorithm approach for closed loop green supply chain network design. Comput. Ind. Eng. 2016, 99, 432–447. [Google Scholar] [CrossRef]
  42. Li, Y.; Tao, F.; Cheng, Y.; Zhang, X.; Nee, A. Complex networks in advanced manufacturing systems. J. Manuf. Syst. 2017, 43, 409–421. [Google Scholar] [CrossRef] [Green Version]
  43. Tang, D.; Dai, M.; Salido, M.A.; Giret, A. Energy-efficient dynamic scheduling for a flexible flow shop using an improved particle swarm optimization. Comput. Ind. 2016, 81, 82–95. [Google Scholar] [CrossRef]
  44. Hou, Y.; Wu, N.; Zhou, M.; Li, Z. Pareto-optimization for scheduling of crude oil operations in refinery via genetic algorithm. IEEE Trans. Syst. Man, Cybern. Syst. 2015, 47, 517–530. [Google Scholar] [CrossRef]
  45. Wang, X.; Xing, K.; Yan, C.B.; Zhou, M. A novel MOEA/D for multiobjective scheduling of flexible manufacturing systems. Complexity 2019, 2019, 5734149. [Google Scholar] [CrossRef]
  46. Lin, L.; Hao, X.-C.; Gen, M.; Jo, J.-B. Network modeling and evolutionary optimization for scheduling in manufacturing. J. Intell. Manuf. 2011, 23, 2237–2253. [Google Scholar] [CrossRef]
  47. Piroozfard, H.; Wong, K.Y.; Hassan, A. A hybrid genetic algorithm with a knowledge-based operator for solving the job shop scheduling problems. J. Optim. 2016, 2016, 7319036. [Google Scholar] [CrossRef] [Green Version]
  48. Klement, N.; Abdeljaouad, M.A.; Porto, L.; Silva, C. Lot-sizing and scheduling for the plastic injection molding industry—A hybrid optimization approach. Appl. Sci. 2021, 11, 1202. [Google Scholar] [CrossRef]
  49. Beckham, C.; Hall, M.; Frank, E. WekaPyScript: Classification, regression, and filter schemes for WEKA implemented in Python. J. Open Res. Softw. 2016, 4, e33. [Google Scholar] [CrossRef] [Green Version]
  50. Mirjalili, S. Moth-flame optimization algorithm: A novel nature-inspired heuristic paradigm. Knowl. Based Syst. 2015, 89, 228–249. [Google Scholar] [CrossRef]
  51. Tang, D.; Dai, M. Energy-efficient approach to minimizing the energy consumption in an extended job-shop scheduling problem. Chin. J. Mech. Eng. 2015, 28, 1048–1055. [Google Scholar] [CrossRef]
  52. Jin, L.; Zhang, C.; Fei, X. Realizing energy savings in integrated process planning and scheduling. Processes 2019, 7, 120. [Google Scholar] [CrossRef] [Green Version]
  53. Cheng, C.-Y.; Li, S.-F.; Ying, K.-C.; Liu, Y.-H. Scheduling jobs of two competing agents on a single machine. IEEE Access 2019, 7, 98702–98714. [Google Scholar] [CrossRef]
  54. Ying, K.-C.; Lin, S.-W.; Wan, S.-Y. Bi-objective reentrant hybrid flowshop scheduling: An iterated Pareto greedy algorithm. Int. J. Prod. Res. 2014, 52, 5735–5747. [Google Scholar] [CrossRef]
  55. Lin, S.-W.; Ying, K.-C. A multi-point simulated annealing heuristic for solving multiple objective unrelated parallel machine scheduling problems. Int. J. Prod. Res. 2014, 53, 1065–1076. [Google Scholar] [CrossRef]
  56. Audet, C.; Bigeon, J.; Cartier, D.; Le Digabel, S.; Salomon, L. Performance indicators in multiobjective optimization. Eur. J. Oper. Res. 2021, 292, 397–422. [Google Scholar] [CrossRef]
  57. Ishibuchi, H.; Imada, R.; Setoguchi, Y.; Nojima, Y. How to specify a reference point in hypervolume calculation for fair performance comparison. Evol. Comput. 2018, 26, 411–440. [Google Scholar] [CrossRef] [PubMed]
  58. Haber, R.E.; Beruvides, G.; Quiza, R.; Hernandez, A. A Simple multi-objective optimization based on the cross-entropy method. IEEE Access 2017, 5, 22272–22281. [Google Scholar] [CrossRef]
  59. Yang, Z.; Wang, H.; Yang, K.; Bäck, T.; Emmerich, M. SMS-EMOA with multiple dynamic reference points. In Proceedings of the 12th International Conference on Natural Computation, Fuzzy Systems and Knowledge Discovery (ICNC-FSKD), Changsha, China, 13–15 August 2016; Institute of Electrical and Electronics Engineers (IEEE): Piscataway, NJ, USA, 2016; pp. 282–288. [Google Scholar]
Figure 1. Various components in the gear box.
Applsci 11 06314 g001
Figure 2. Framework of the proposed network manufacturing approach.
Applsci 11 06314 g002
Figure 3. Flowchart for the proposed text-mining approach.
Applsci 11 06314 g003
Figure 4. (a) Word Cloud for Worm at 0.77, (b) Word Cloud for Spur 0.90, (c) Word Cloud for Helical (d) Word Cloud for Worm and Helical at 0.90, (e) Word Cloud for Bevel at 0.90, and (f) Word Cloud for All Types of gears at 0.77 sparsity.
Applsci 11 06314 g004
Figure 5. Confusion matrices of Naïve Bayes, Random Forest, SVM, and Decision Trees.
Applsci 11 06314 g005
Figure 6. Screen shot of extracted enterprise information and classification into task-specific supplier with text mining.
Applsci 11 06314 g006
Figure 7. Flowchart of the proposed HMFO.
Applsci 11 06314 g007
Figure 8. Representation of chromosome initialization for make span.
Applsci 11 06314 g008
Figure 9. Representation of chromosome initialization for energy consumption.
Applsci 11 06314 g009
Figure 10. Gantt chart showing the makespan of instances from 1–5.
Applsci 11 06314 g010
Figure 11. Gantt chart showing the make span of instances from 6–10.
Applsci 11 06314 g011
Figure 12. Utilization rate of different machines of instance 1–5.
Applsci 11 06314 g012
Figure 13. Utilization rate of different machines of instance 6–10.
Applsci 11 06314 g013
Figure 14. Energy consumption values of all instances 1–10.
Applsci 11 06314 g014
Figure 15. Reliability of different jobs of instance from 6–10.
Applsci 11 06314 g015
Figure 16. Pareto optimal graphs showing various solutions for three objectives makespan, energy consumption, and machine utilization for HMFO algorithm.
Applsci 11 06314 g016
Figure 17. Pareto optimal graphs showing various solutions for three objectives makespan, energy consumption, and Machine utilization for NSGA-II algorithm.
Applsci 11 06314 g017
Figure 18. Comparison of HMFO and NSGA-II with Hyper-Volume (HV) results for all the 10 instances of problems.
Applsci 11 06314 g018
Table 1. Notations used in mathematical model.
NotationDescription
EThe number of all the available jobs
GThe number of all the available machines
HvThe number of all the available alternative process plans of job v.
Qvpkpth alternative process plan for kth operation of job v
SvpThe number of all the available operations in the pth alternative process plan of the job v
LMaximum completion time of vth job from the all the available process plans
DvkprFor operation Qvkp corresponding processing time of the on machine r
BAn arbitrary Integer which is a very large positive integer.
CvThe completion time till the processing of job v
CvkprThe earliest completion time till the operation Qvkp on machine r
EvkrIndicates energy consumption for processing kth operation of job v on machine r
RelvkIndicates reliability of the kth operation of job v
Table 2. Various types of gear manufacturing.
Category 1Bevel gear
Category 2Helical and worm
Category 3Helical gear
Category 4Spur gear
Category 5Worm gear
Category 6All types of gear
Table 3. Information to be extracted from mining and gear classification categories.
Types of machines (CNC, LATHE)
Types of operations (milling, drilling, and grinding)
Types of gears (spur, helical, and bevel)
Types of materials (steel, aluminum, bronze, and brass)
Types of certifications (ISO 9000, ISO 14000
Types of manufacturing process (casting, forging, and extrusion)
Table 4. Various performance measures for machine-learning algorithms Decision Tree (J48), Naïve Bayes, Random Forest, and Support Vector Machines.
Decision Tree (J48)
TP RateFP RatePrecessionRecallF-MeasureMCCROC AreaPRC AreaClass
0.4000.0001.0000.4000.5710.6040.8810.694All types
1.0000.0330.8571.0000.9230.9100.9830.857Bevel gear
1.0000.0001.0001.0001.0001.0001.0001.000Helical and worm gear
1.0000.0001.0001.0001.0001.0001.0001.000Helical gear
1.0000.0710.8001.0000.8890.8620.9910.950Spur gear
1.0000.0001.0001.0001.0001.0001.0001.000Worm gear
0.9170.0210.9320.9170.9030.8990.9790.923Weighted Avg.
Naïve Bayes
TP RateFP RatePrecessionRecallF-MeasureMCCROC AreaPRC AreaClass
0.2000.0970.2500.2000.2220.1140.4900.181All types
0.8330.0330.8330.8330.8330.8000.9780.897Bevel gear
0.5000.1250.3330.5000.4000.3160.6720.573Helical and worm gear
1.0000.0001.0001.0001.0001.0001.0001.000Helical gear
0.8750.0001.0000.8750.9330.9190.9380.920Spur gear
0.7140.0690.7140.7140.7140.6450.8080.723Worm gear
0.7220.0460.7380.7220.7270.6810.8380.750Weighted Avg.
Random Forest
TP RateFP RatePrecessionRecallF-MeasureMCCROC AreaPRC AreaClass
0.0000.0000.0000.0000.0000.0000.7710.435All types
1.0000.0670.7501.0000.8570.8371.0001.000Bevel gear
0.5000.0630.5000.5000.5000.4380.9690.817Helical and worm gear
1.0000.0330.8571.0000.9230.9101.0001.000Helical gear
0.8750.0360.8750.8750.8750.8390.9960.986Spur gear
1.0000.0690.7781.0000.8750.8511.0001.000Worm gear
0.7780.0450.6690.7780.7170.6920.9640.898Weighted Avg.
Support Vector Machines
TP RateFP RatePrecessionRecallF-MeasureMCCROC AreaPRC AreaClass
0.0000.0000.0000.0000.0000.0000.5000.139All types
0.6670.0330.8000.6670.7270.6830.8170.589Bevel gear
0.0000.0000.0000.0000.0000.0000.5000.111Helical and worm gear
0.5000.0001.0000.5000.6670.6740.7500.583Helical gear
0.8750.2860.4670.8750.6090.4970.7950.436Spur gear
0.8570.2410.4620.8570.6000.5070.8080.423Worm gear
0.4830.0933330.4548330.4830.4330.39350.6950.380Weighted Avg.
Table 5. Initialization of parameters for proposed solution algorithm.
Process ParametersHMFEONSGA II
Population Size/No. of Moths200200
Number of generations15001500
Mutation Probability-0.07
Cross-Over Probability-0.76
Table 6. Energy and reliability data.
MachineM1M2M3M4M5M6M7M8M9M10M11M12
Energy consumption152932141112192414162211
Reliability0.760.820.780.840.840.920.890.940.880.950.840.92
Table 7. Results of the experimental instances with makespan and energy consumption values.
JobsMachinesProcessing Time RangeGA-SA (Instance 1 to 32)
GA-MA (Instance 33 to 35)
Proposed HMFO
MakespanEnergy ConsumptionMakespanEnergy Consumption
Instance 135[1, 10]41138.130.826.3
Instance 237[1, 10]54.1205.443190.5
Instance 3310[1, 10]61.2229.149.7204
Instance 435[1, 50]190.3708.7171617
Instance 537[1, 50]252.8960.6226.7834
Instance6310[1, 50]333.81273.3301.71110
Instance735[1, 100]375.41307.1319.31134
Instance837[1, 100]531.91895.4516.71644.9
Instance9310[1, 100]729.12830.56982467.5
Instance1055[1, 10]35140.424126.1
Instance1157[1, 10]46186.330169
Instance12510[1, 10]51.5199.943.7177
Instance1355[1, 50]165.5671.5149.8583.9
Instance1457[1, 50]225.2951.2201.7828
Instance15510[1, 50]3171303.6306.81139
Instance1655[1, 100]325.51253.2311.71098
Instance1757[1, 100]436.919094101663
Instance18510[1, 100]610.32587.55982257
Instance1975[1, 10]28.7110.919.696.7
Instance2077[1, 10]39.3162.224146
Instance21710[1, 10]56.5241.649218
Instance2275[1, 50]159.7607143524
Instance2377[1, 50]220.8919.1206846
Instance24710[1, 50]304.61310.5265.0021150.9
Instance2575[1, 100]3511422.9305.371287.9
Instance2677[1, 100]426.11978.3370.71725
Instance27710[1, 100]625.92664.1544.52319.7
Instance281010[1, 200]939.049873.2816.968597.6
Instance291515[1, 200]1554.1222,505.21352.0819,579.5
Instance302020[1, 200]4778.0780,577.2415670,102.16
Instance312020[1, 200]7753.04100,073.4674987,263.8
Instance322020[1, 200]15,062.5197,787.513,115172,975.7
Instance 331815[1, 200]53113,340.350212,986
Instance 341815[1, 200]8102036.327391956
Instance 351815[1, 200]6802267.885931837.6
Table 8. Optimal process plans selected for each job for all practical instances 1–10.
Case Process Plans Selected
JobsMachinesJ1J2J3J4J5J6J7J8
Instance166222222--
Instance266112212--
Instance368312334--
Instance48822221213
Instance58821211122
Instance6612111121--
Instance7612222322--
Instance8612222222--
Instance9612211221--
Instance10612211321--
Table 9. Results of the practical instances with makespan and energy consumption values.
JobsMachinesProposed HMFONSGA-II
MakespanEnergy ConsumptionMakespanEnergy Consumption
Instance 166308906359083
Instance 266278325388700
Instance 36817939,65818744,920
Instance 4884213,0895014,040
Instance 5885010,1296211,189
Instance661298615,553108317,694
Instance7612117915,224.5125616,785
Instance8612102613,881109414,205.5
Instance961266914,29875614,898.5
Instance1061281414,143.588414,678
Table 10. Results of performance indicators for comparison of HMFEO and NSGA II instance 1–5.
IndicatorAlgorithmInstance
12345
αHMFEO
NSGA II
8.5
8.0
10.8
10.5
9.7
9.4
10.6
10.6
8.8
8.6
βHMFEO
NSGA II
8.1
7.0
10.7
9.5
9.5
9.3
10.6
9.3
8.6
8.3
ᵝ/ᵅHMFEO
NSGA II
0.9529
0.8750
0.9900
0.9047
0.9700
0.9893
1.0000
0.8773
0.9700
0.9651
ϒHMFEO
NSGA II
0.5264
0.4736
0.5079
0.4921
0.6012
0.3988
0.5000
0.5000
0.5264
0.4736
KHMFEO
NSGA II
0.0800
0.1250
0.0100
0.0953
0.0300
0.0107
0.0000
0.1227
0.0300
0.0349
λHMFEO
NSGA II
0.3693
12.123
0.0037
9.236
0.6289
8.265
0.0000
8.6321
0.0042
9.5632
πHMFEO
NSGA II
0.4236
0.4125
0.4856
0.5563
0.4982
0.6029
0.4932
0.6765
0.4495
0.5988
HRHMFEO
NSGA II
0.8526
1.2536
0.7445
1.1456
0.9538
0.9469
0.6984
0.9548
0.4495
0.9854
Table 11. Results of performance indicators for comparison of HMFEO and NSGA II instance 6–10.
IndicatorAlgorithmInstance
678910
αHMFEO
NSGA II
12.5
12.0
13.8
10.5
9.7
9.4
16.6
16.6
9.8
8.8
βHMFEO
NSGA II
12.1
11.0
12.7
9.2
9.5
9.3
16.6
15.0
9.6
8.3
ᵝ/ᵅHMFEO
NSGA II
0.9682
0.9166
0.9202
0.8761
0.9700
0.9893
1.0000
0.9036
0.9795
0.9431
ΩHMFEO
NSGA II
0.5151
0.4848
0.5070
0.4929
0.5078
0.4922
0.5000
0.5000
0.5057
0.4942
KHMFEO
NSGA II
0.0800
0.1250
0.0104
0.0835
0.0310
0.0307
0.0000
0.1027
0.0400
0.0349
λHMFEO
NSGA II
0.4693
12.123
0.0089
9.236
0.5259
8.265
0.0000
8.6321
0.0063
10.5632
πHMFEO
NSGA II
0.5136
0.4125
0.4856
0.4563
0.4982
0.5129
0.4932
0.5365
0.4445
0.5488
HRHMFEO
NSGA II
0.7415
0.9438
0.8556
1.2465
0.8629
1.1803
0.7875
1.9888
0.7589
0.8765
Publisher’s Note: MDPI stays neutral with regard to jurisdictional claims in published maps and institutional affiliations.

