1. Introduction
Soil is an extremely important, renewable natural resource, a means of production, the place of production of plants, and the object of soil tillage. Soil conservation is a global, multidisciplinary task in which machine-soil-plant-weather interactions play an important role. It is compromised by the use of heavy machinery, the increased number of passes, the increased tire air pressure, and the agricultural traffic performed over wet soil. In addition, tillage tools can have a destructive effect on soil clumps, which are destroyed by deformation, fragmentation, and cutting, thus also affecting the intensity of soil compaction [
1]. Mechanization systems developed on this basis can offer perspectives for reducing soil destruction problems in crop production. The role of active tillage machines is becoming more important.
The goal of operating the machines is to provide as little soil destruction, soil compaction, and number of passes as possible and favourable energy consumption. Measuring the forces acting on tillage implements is one of the main goals of many researchers in the field of tillage and soil dynamics [
2]. The implementations of these goals are studied through experimental and theoretical research.
In experiments, Giordano et al. [
3] observed that no hardpan is formed below the depth of the spaded soil, thus improving the water balance of the soil and the penetration of the root. With a well-structured soil, a single pass of the spading machine may be sufficient to create optimal conditions for sowing, while one or more subsequent harrows are always required after ploughing. This can be profitable in horticulture and floriculture, where many cultivation cycles are usually carried out each year [
3]. In soil tilled with the spading machine, soil penetration resistance never exceeded 2.5 MPa, which was demonstrated to be a critical value for root elongation, and no evidence of the formation of hardpan beneath the tilled layer was observed [
4].
The effect of the spade angle and the spading frequency on the specific soil resistance, the energy consumed per unit volume of the moved soil, and the bulk density of the soil were investigated by experiments. A larger spading angle and a higher spading frequency are recommended for better shredding, optimum soil resistance, and energy consumption [
5]. Experiments have shown that the share of soil fractions of different sizes depends on the advancing speed of the spading machine, the frequency of rotation of the power take-off (PTO) of the tractor, and the position of the deflector cover [
6].
PTO-driven tillage implements did not show advantages in terms of capacity, but they gave better results in fuel consumption and soil shredding. Economic evaluation showed lower unit costs (17% to 28%) for the spading machine compared to the plough [
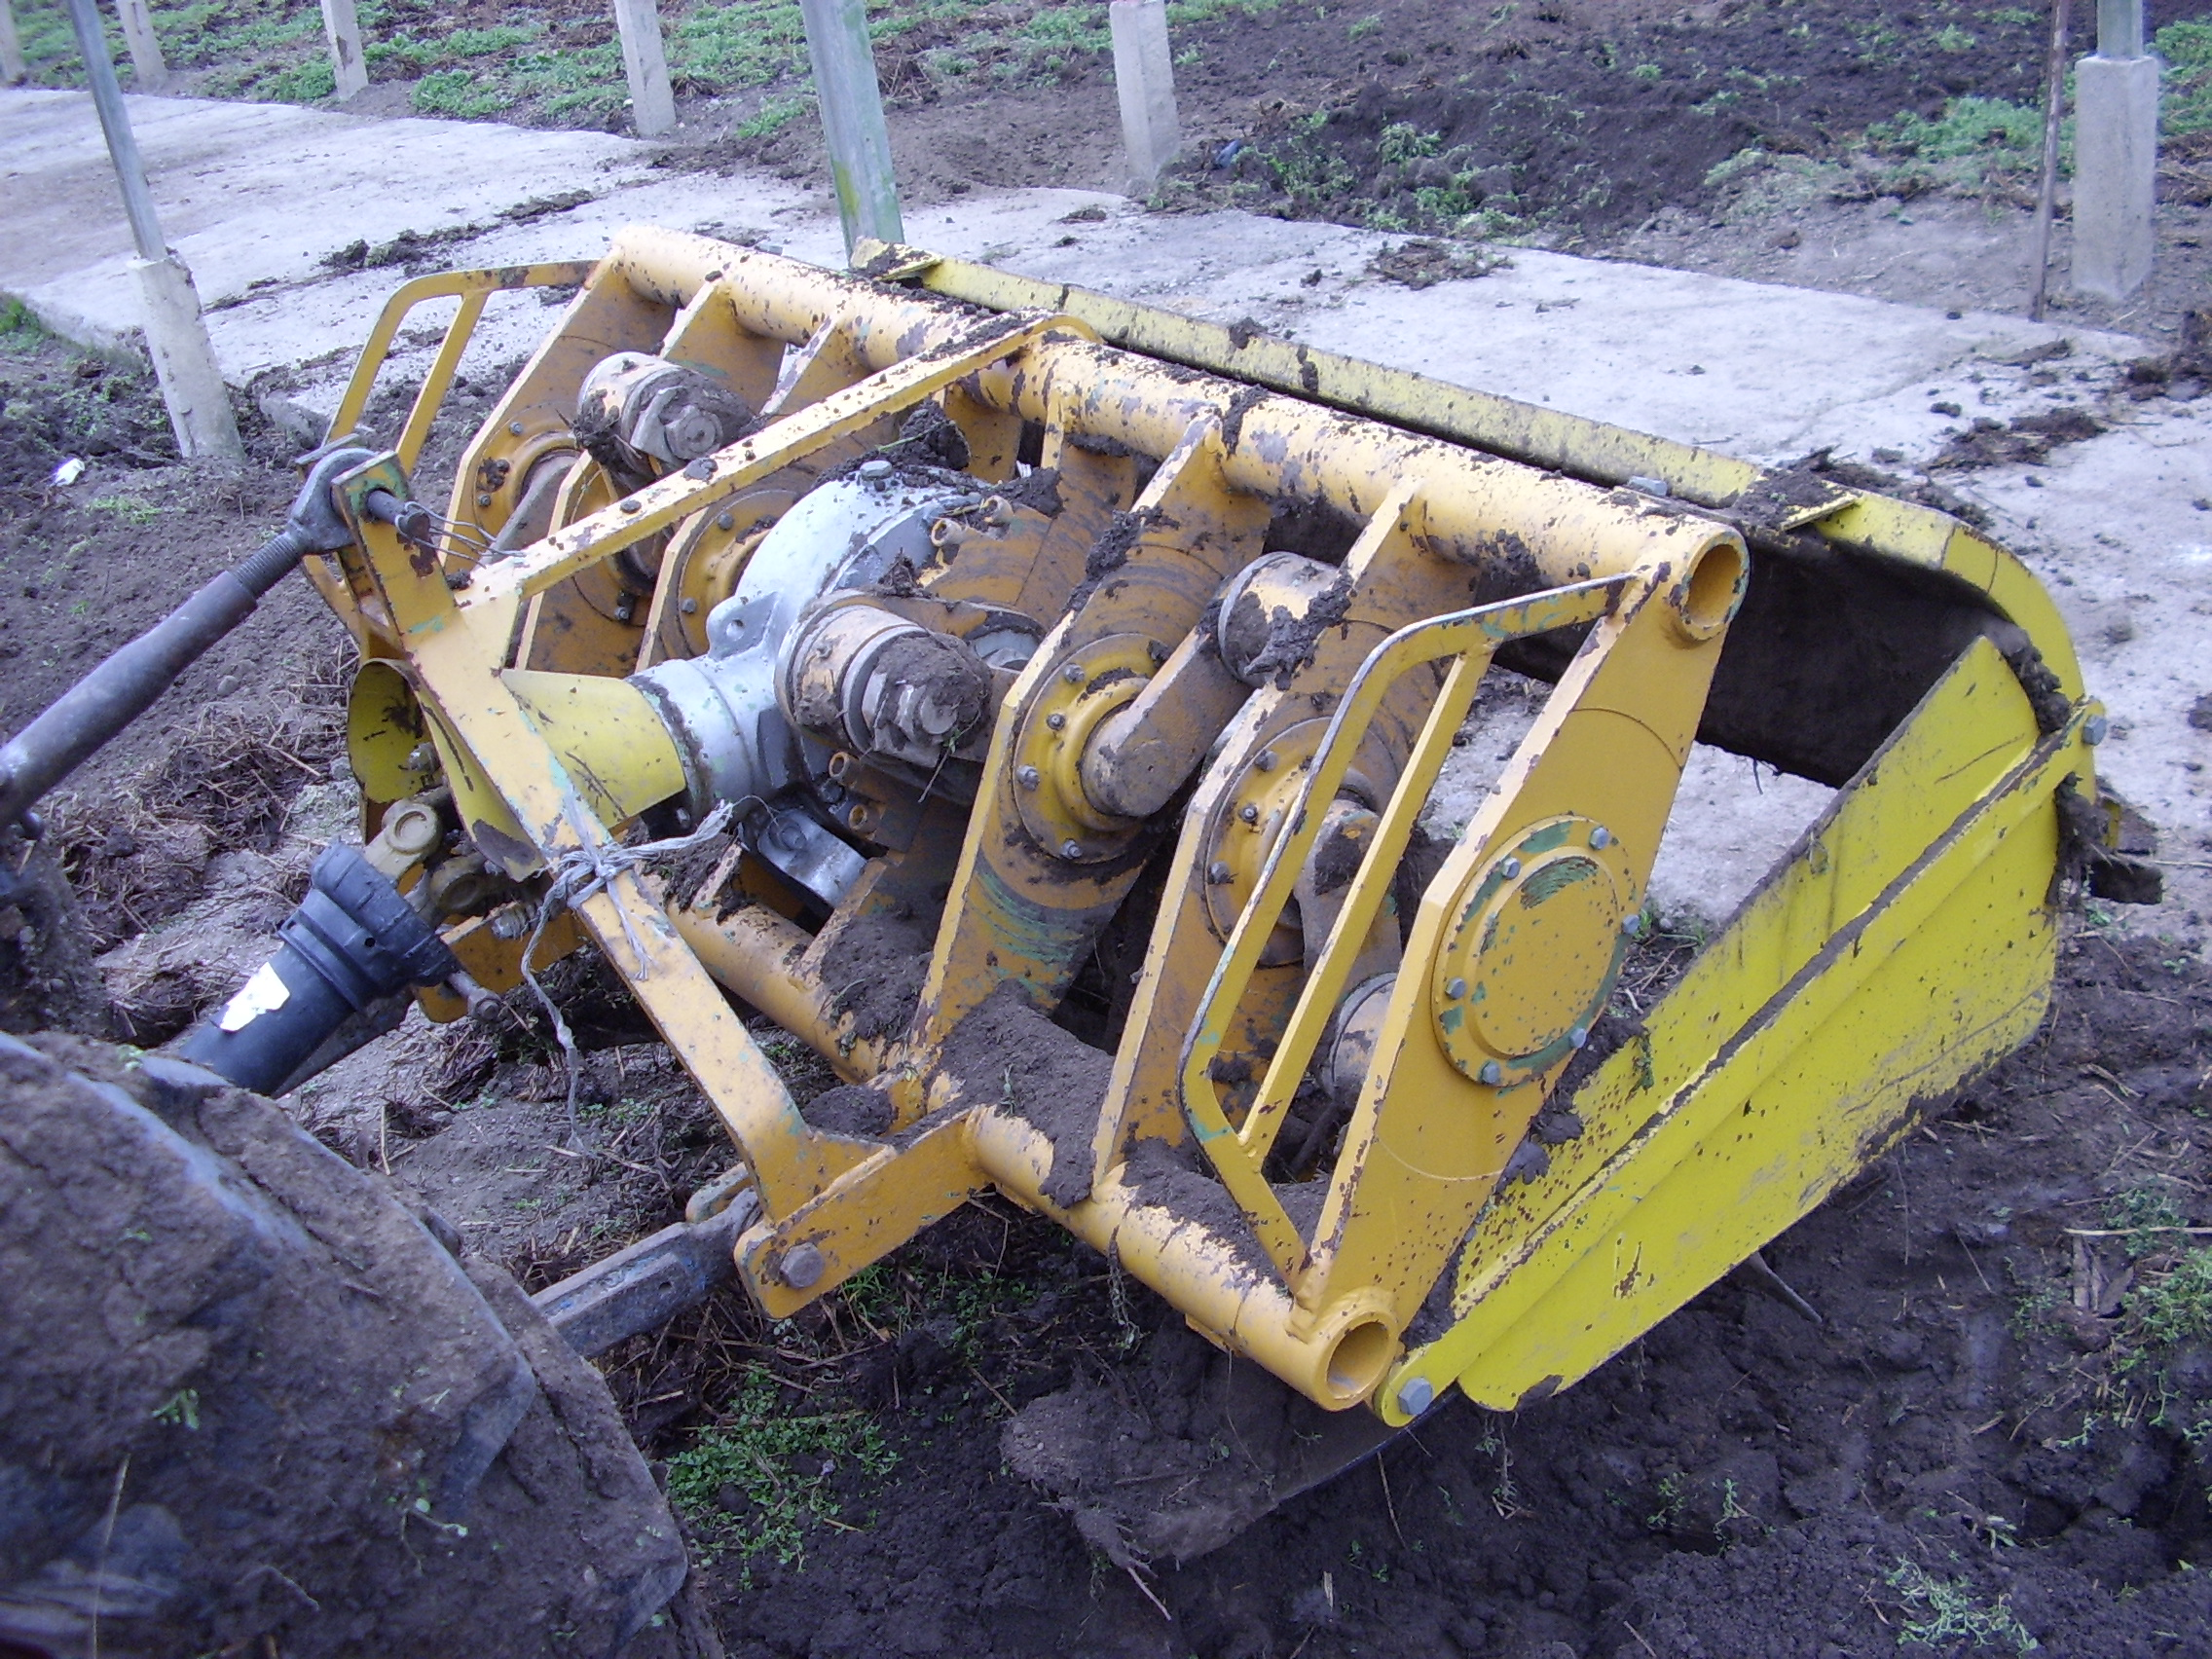
7]. Thus, determining the energy demand of active tillage machines for various working parameters is a main technical task. As the authors have previously performed experiments regarding fuel consumption (i.e., energy demand) for an MSS-140-type spading machine (
Figure 1), the current proposed aim is the testing of our investigation approach against the experiment results. The spading machine rotates the soil while also shredding, loosening, and mixing it. It is most often used for the basic cultivation of the soil in greenhouses, as it eliminates lateral transport of the soil. The implements of the machine are the spades. The spade penetrates the soil, cuts a soil chip, lifts it, and discards it. The soil chip collides with the deflector cover and is strongly shredded and mixed. The machine leans on the ground using sliders, which serve also for working depth adjustments.
The energy consumption of the mentioned spading machine type was studied experimentally in the previous year [
8]. The experiments were carried out at the National Institute of Research–Development for Machines and Installations Designed for Agriculture and Food Industry—INMA Bucharest. The fuel consumption of the tractor was measured in the case of zero working depth (the tractor towing the actuated spading mechanism above the soil surface) and at 0.28 m working depth. Two advancing speeds (towing speeds) were set through specified gear ratios, recommended by the spading machine’s manufacturer. The third speed was chosen outside the recommended values. Each case was run five times, the real speed measured, and an average calculated. The fuel consumption of the tillage process was calculated as the difference of the two working depth scenarios. These advancing speeds will be considered in our modelling as inputs. Using the same advancing speeds in the model as in the real experiments, we can validate the model. By applying the dynamic model, we propose in this work to calculate the energy consumption values and to compare them with the experimental results.
Scientific modelling is playing an increasingly important role in the study of the tillage process and in a scientific approach of the tillage process. Using special engineering software, the trajectory of the spade and the shape of the soil slices cut by the spade can be determined. The thickness of the soil slides increases with the advancing speed of the spading machine [
9]. Saimbhi et al. [
9] also uses the computer modelling methods of the working process in the minimum tillage study.
2. Material and Methods
The paper presents a study of a real spading machine using computer-modelling software. During the modelling and simulation:
a 3D solid model of the real spading machine was prepared;
the forces acting on the spade were calculated based on literature data;
the acting of the forces and the necessary mechanical energy were modelled and simulated in Matlab® Simscape™ environment.
2.1. Presentation of the Spading Machine
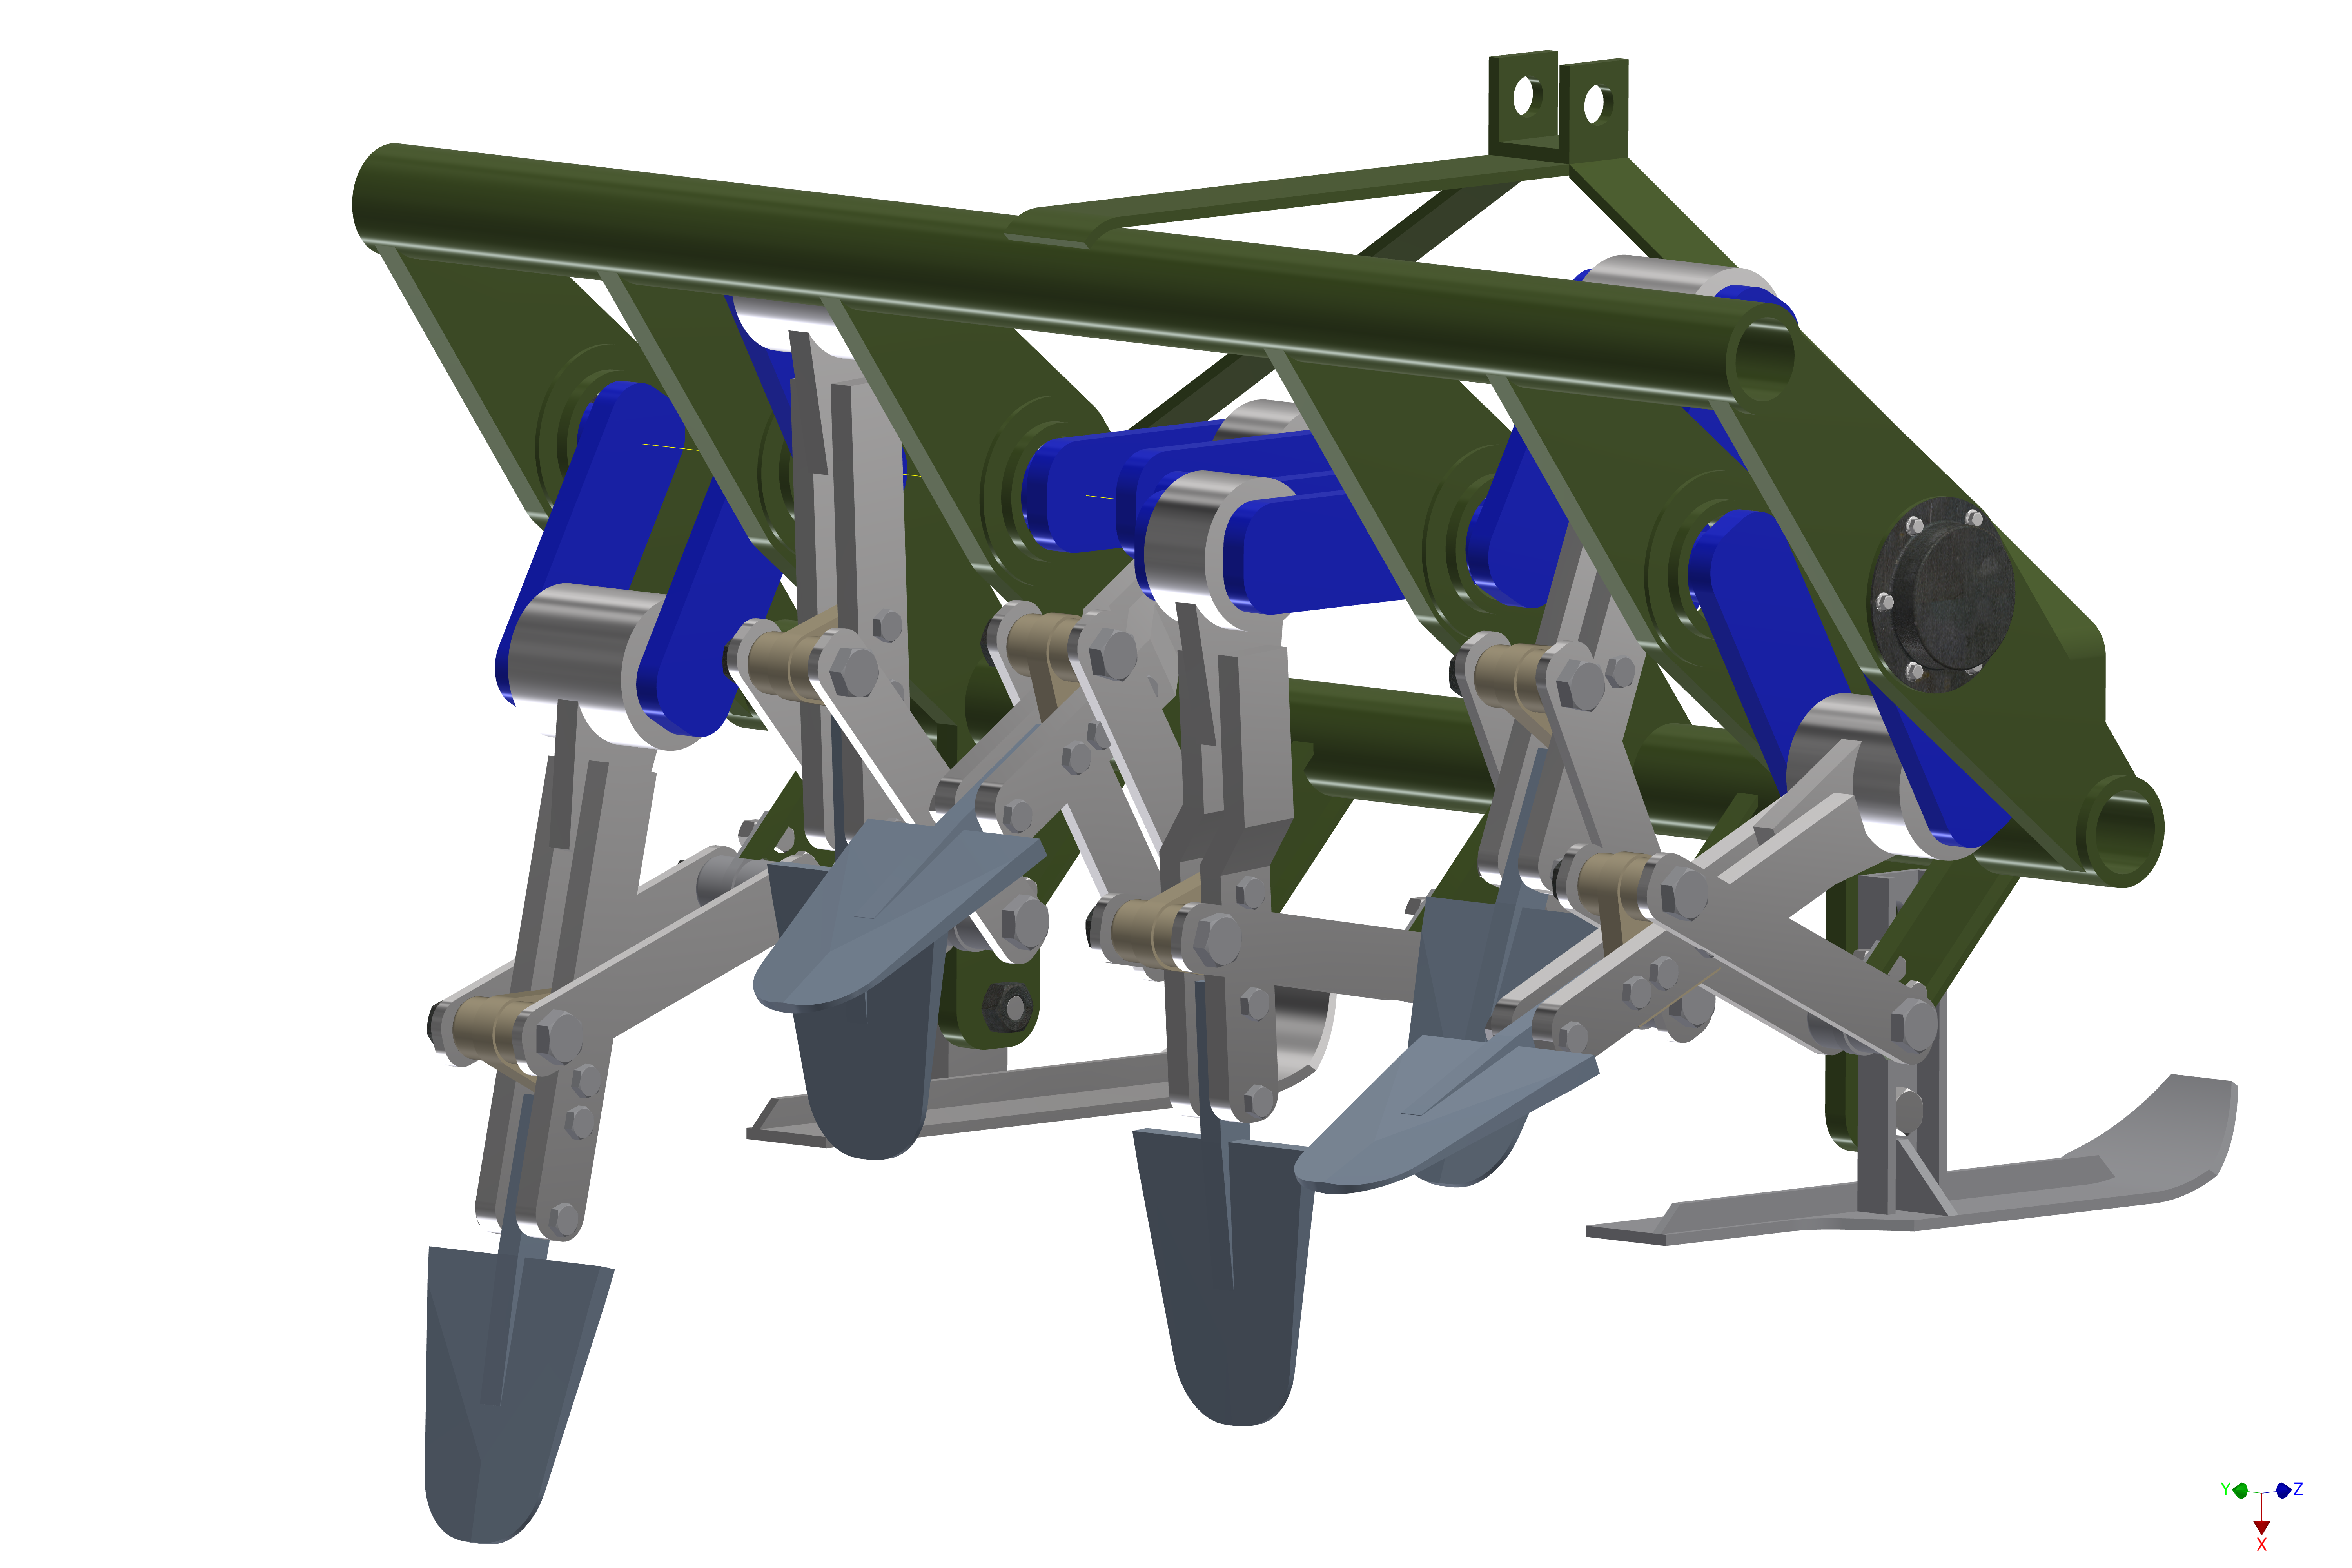
For the study, an MSS-140-type spading machine was available. The modelling procedure was a reverse engineering back modelling. We measured the individual part dimensions, and using usual parametrical modelling steps, like those in [
10], a parametric model was built (
Figure 2 and
Table 1). The spades are mounted on a crankshaft using four arm mechanisms driven by the PTO shaft. The model is a simplified one: for our purpose, the gearbox, the deflector cover, and the bearings were not modelled. As in the simulation software, the crank is driven directly with an angular velocity and the gearbox is omitted.
2.2. Loads and Forces in the Spading Process
Soil is a complex, open dynamic system, which is both the result of the interaction of soil-formation factors and the environment in which this process is currently ongoing [
11]. Determining the forces and the loads on the implements, which result from tillage of the soil, is a difficult task, as the stresses already laying in the soil can also influence the soil’s response to tillage forces, and these should be incorporated into the models, [
12].
Following the movements of a single spade, the spade penetrates the soil, cuts a soil chip, lifts it, and discards it.
Technologically, soil spading is a process of separating pieces and layers from the soil massif with a wedge-shaped tool. The soil slice geometric dimensions and shape of the loosening zone depends on the physical and mechanical properties of the soil, the number and shape of the tools, and the position of the spade relative to the cutting direction [
11].
The work of soil-cutting tools in various soil works has been verified by several theoretical and experimental studies. The mechanical properties of soils are quite complex, with many factors associated with strength and deformation properties, such as moisture content and soil composition [
13,
14].
Tillage is one of the most power-consuming process in agriculture. In order to study the power demand, the peculiarities of the interaction of the tillage implement must be known. The penetration of the spade in the soil is considered in a plan, and the spade is considered a wedge with a very small thickness [
14,
15,
16].
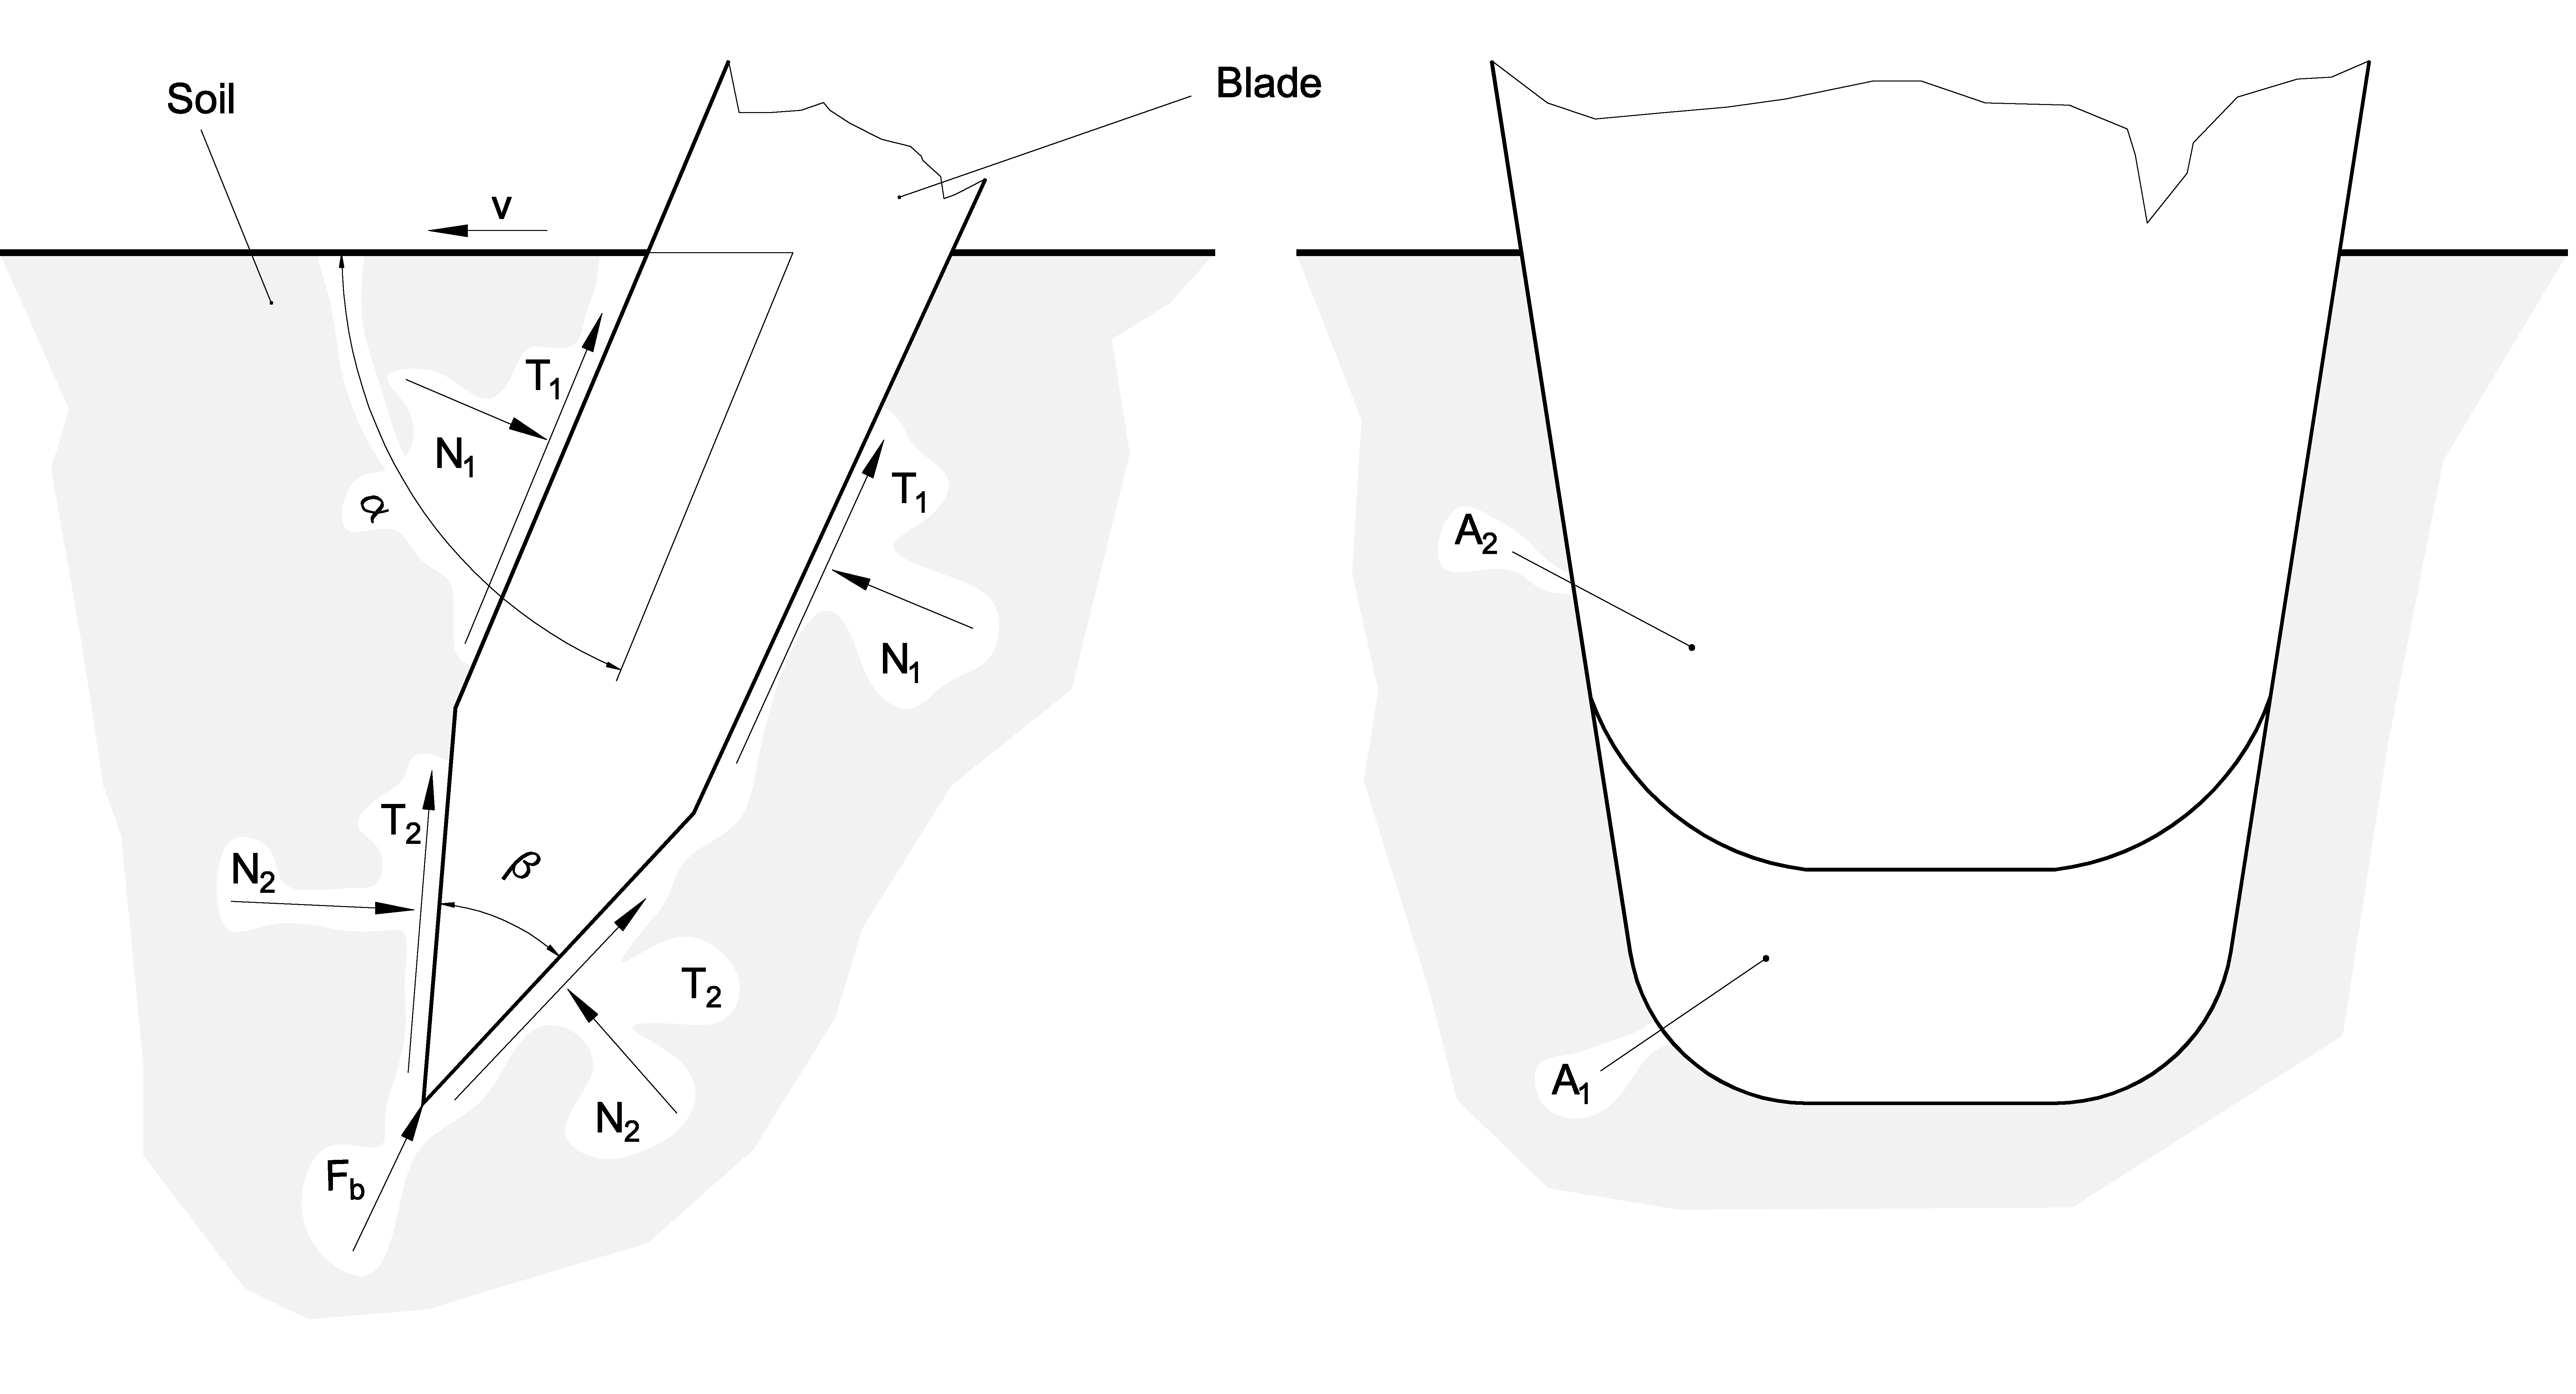
After penetration, the movement of the spade in the soil is characterized by the α rake angle,
Figure 3. As the spade moves, it causes breakage or shear in the soil, depending on the rake angle α. A large rake angle results in shear, while a smaller angle results in soil break [
15,
17].
In this paper, we consider the work of the spade divided into three elementary processes: the penetration of the soil clumps, the separation process of the soil chip, and the dislocation processes of the soil chip.
According to these processes, the following forces are considered:
As the deflector cover’s purpose is to throw back the soil on a narrow area of the machine, in our simulation, it can be omitted also.
The spade is considered a wedge-type blade having a pentagonal cross-section with parallel sides,
Figure 3 [
14,
15,
16].
2.2.1. Determination of the Bit Force
The bit force acting on the spade can be calculated using the cutting resistance. The bit force derives from normal forces and frictional forces,
Figure 3, where:
where
and
are the specific resistance to soil deformation [N/m
2];
is the active surface of the spade edges [m
2];
is the surface of one of the sides of the spade in contact with the soil [m
2];
is the friction between the soil and the spade; and
is the lip angle of the spade (
Figure 3).
During penetration, the surface varies from 0 to its maximum value in a very short time. Due to this short time, in our model, the surface can be considered as constantly at the maximum value. This simplifies the model although in further developments, for a better accuracy, the variation of the surface can be taken into consideration.
2.2.2. Determination of Shear Force
During spading, as a result of a large α rake angle (
Figure 3), the soil chip is separated by a shearing force [
18]. It is assumed that the soil is incompressible. The necessary shear force for the chip separation is calculated from the necessary shear tension. The shear tension
is calculated based on classical soil mechanics theory, which relies upon the Mohr–Coulomb model [
16,
17,
19]:
where
is the cohesion of soil [N/m
2];
is the surface pressure [N/m
2];
is the internal friction angle of the soil [°];
is the spading step [m]; and
is the working length of the spading edge [m].
2.2.3. Determination of Inertial Force
The inertial force is used to lift the soil chip. The displaced soil’s mass is calculated using Equation (8):
where
is the density of the soil [kg/m
3];
is the volume of the lifted soil chip [m
3];
is the displaced soil acceleration [m/s
2];
is thickness of soil chip measured along the advancing direction [m]; and
is the detachment surface of the dislocated soil chip [m
2].
2.3. Model Description
This paper presents a model realized in the Matlab® Simscape™ environment for the spading machine, introducing a methodology which will be used for driving torque determination. This model includes not only the mechanical characteristics of the spading machine but also the load acting on the spade during soil cultivation. Therefore, the study of the spading machine is divided in two main aspects: the kinematic and dynamic study of the machine are investigated.
The Matlab
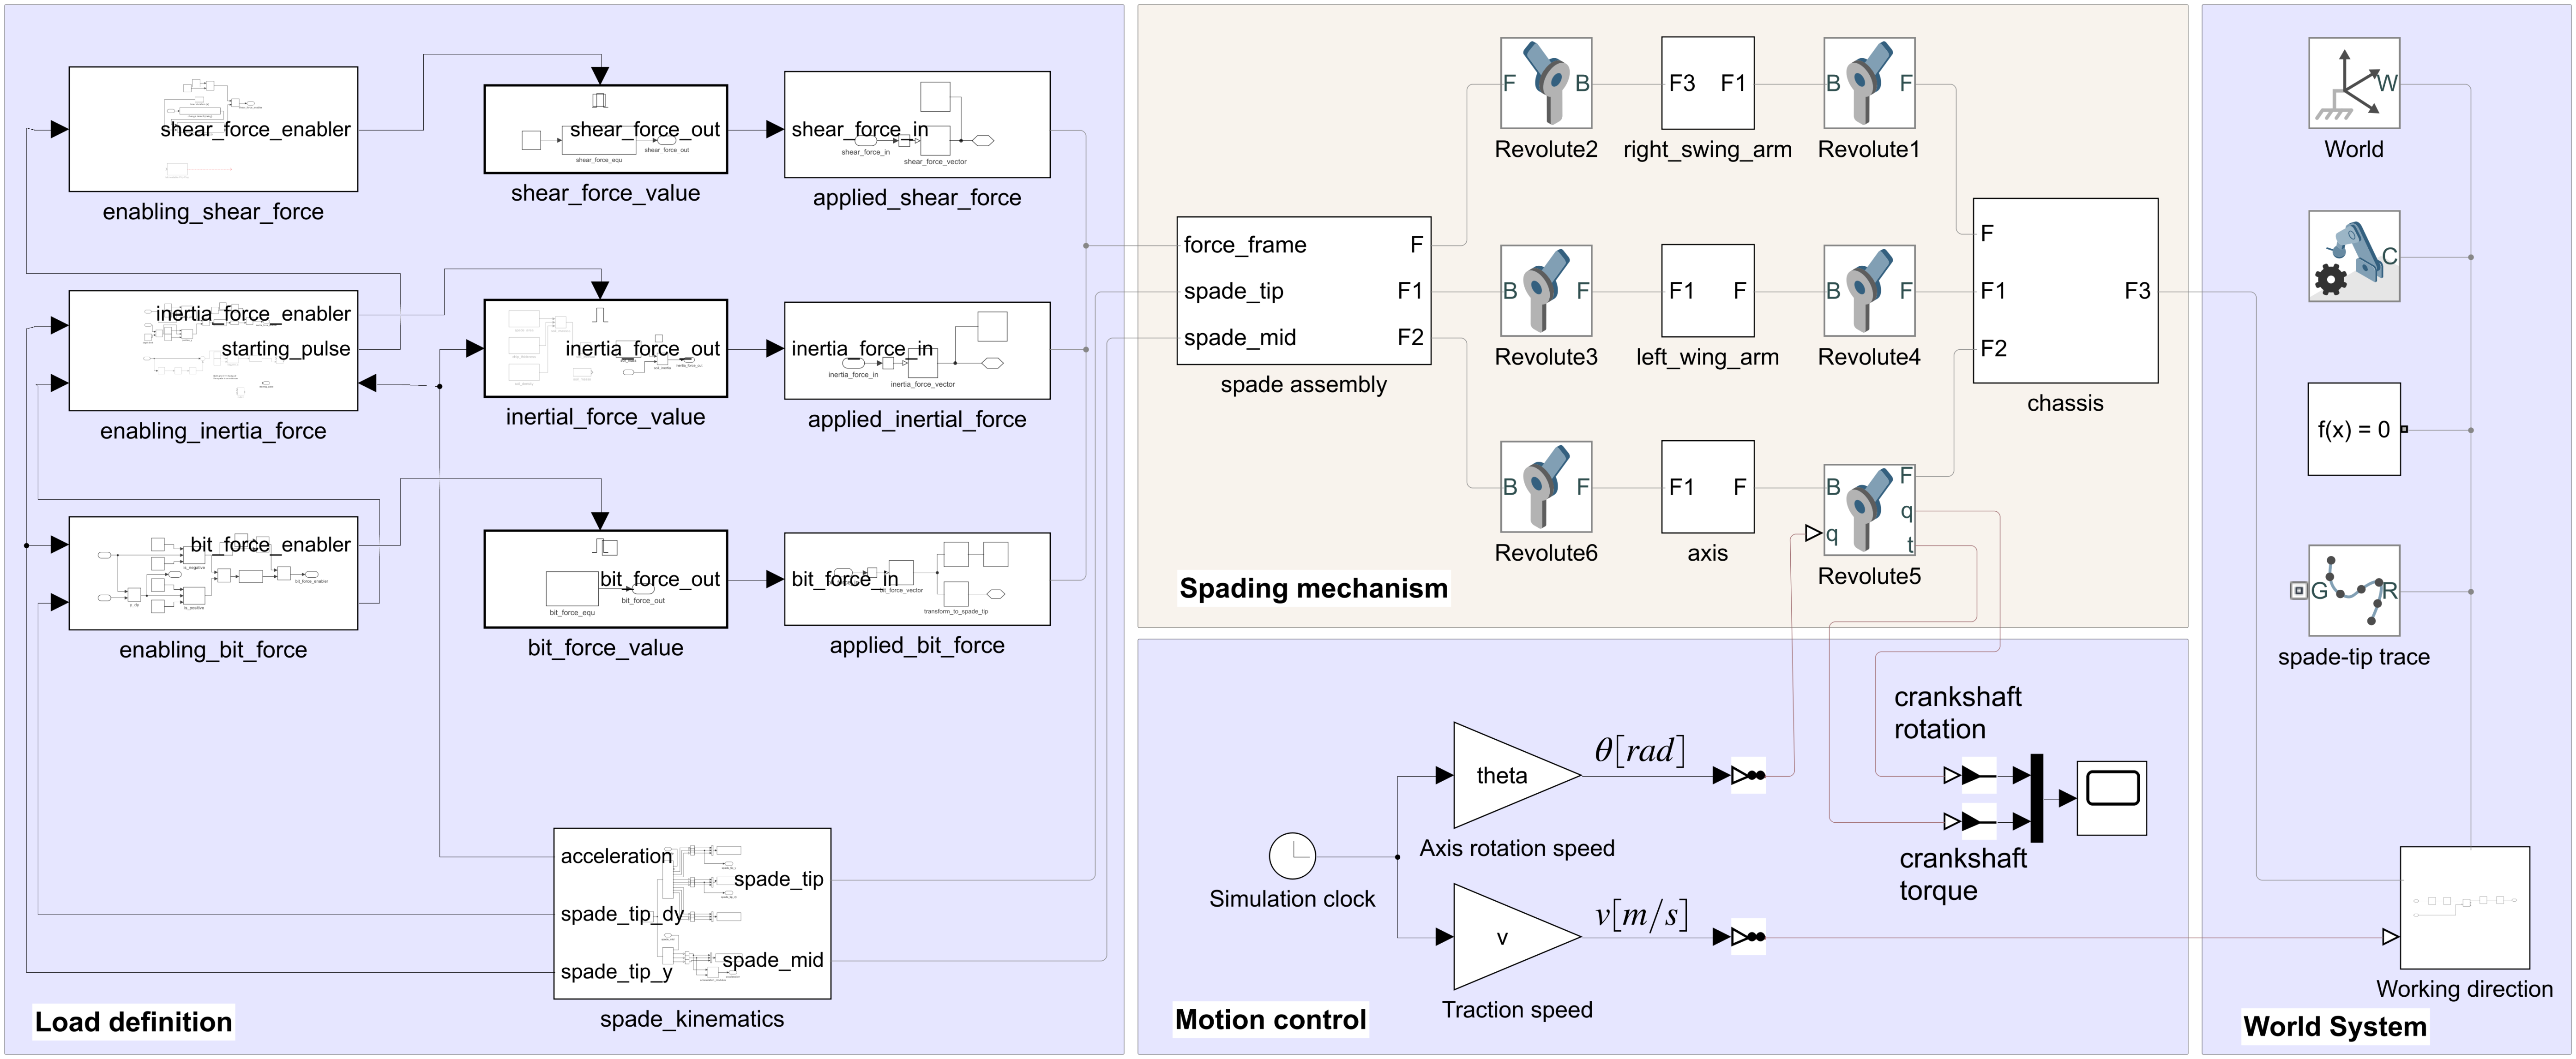
® Simscape™ model may be divided in four areas (
Figure 4). One is the
world system consisting of the
world (coordinate system) block, the
mechanism configuration block, and the
solver configuration block, containing the initial settings for the Simscape™ simulation. Those blocks are completed with the
spade-tip trace block, which is responsible for the spade-tip trace representation as spline, and the
advancing direction block for the adequate orientation of the spade machine displacement during the simulation. The
spading mechanism area holds the Simscape™ Multibody model of the spading machine. The linkage can be clearly followed between the mechanism elements and joints as depicted in the
Figure 2.
The driven element of the mechanism is the crankshaft, the axis for the spade assembly actuation. The
motion control area embraces the input and output blocks of the model by imposing an advancing speed (
v (m/s)) as well as the angular displacement of the spade assembly axis (
θ (rad)) in the right joints. Here, the simulation-calculated torque as the output of the model is obtained. The fourth area, namely
load definition, determines the kinematics of the mechanism needed as input for the spade load calculation. Because different loads have no continuous effect during the motion cycle, the enabling conditions are calculated during the simulation, and the magnitude of those loads are determined as well. Finally, using proper orientation, the different loads are applied at the characteristic points of the mechanism (
Figure 4).
3. Results and Discussion
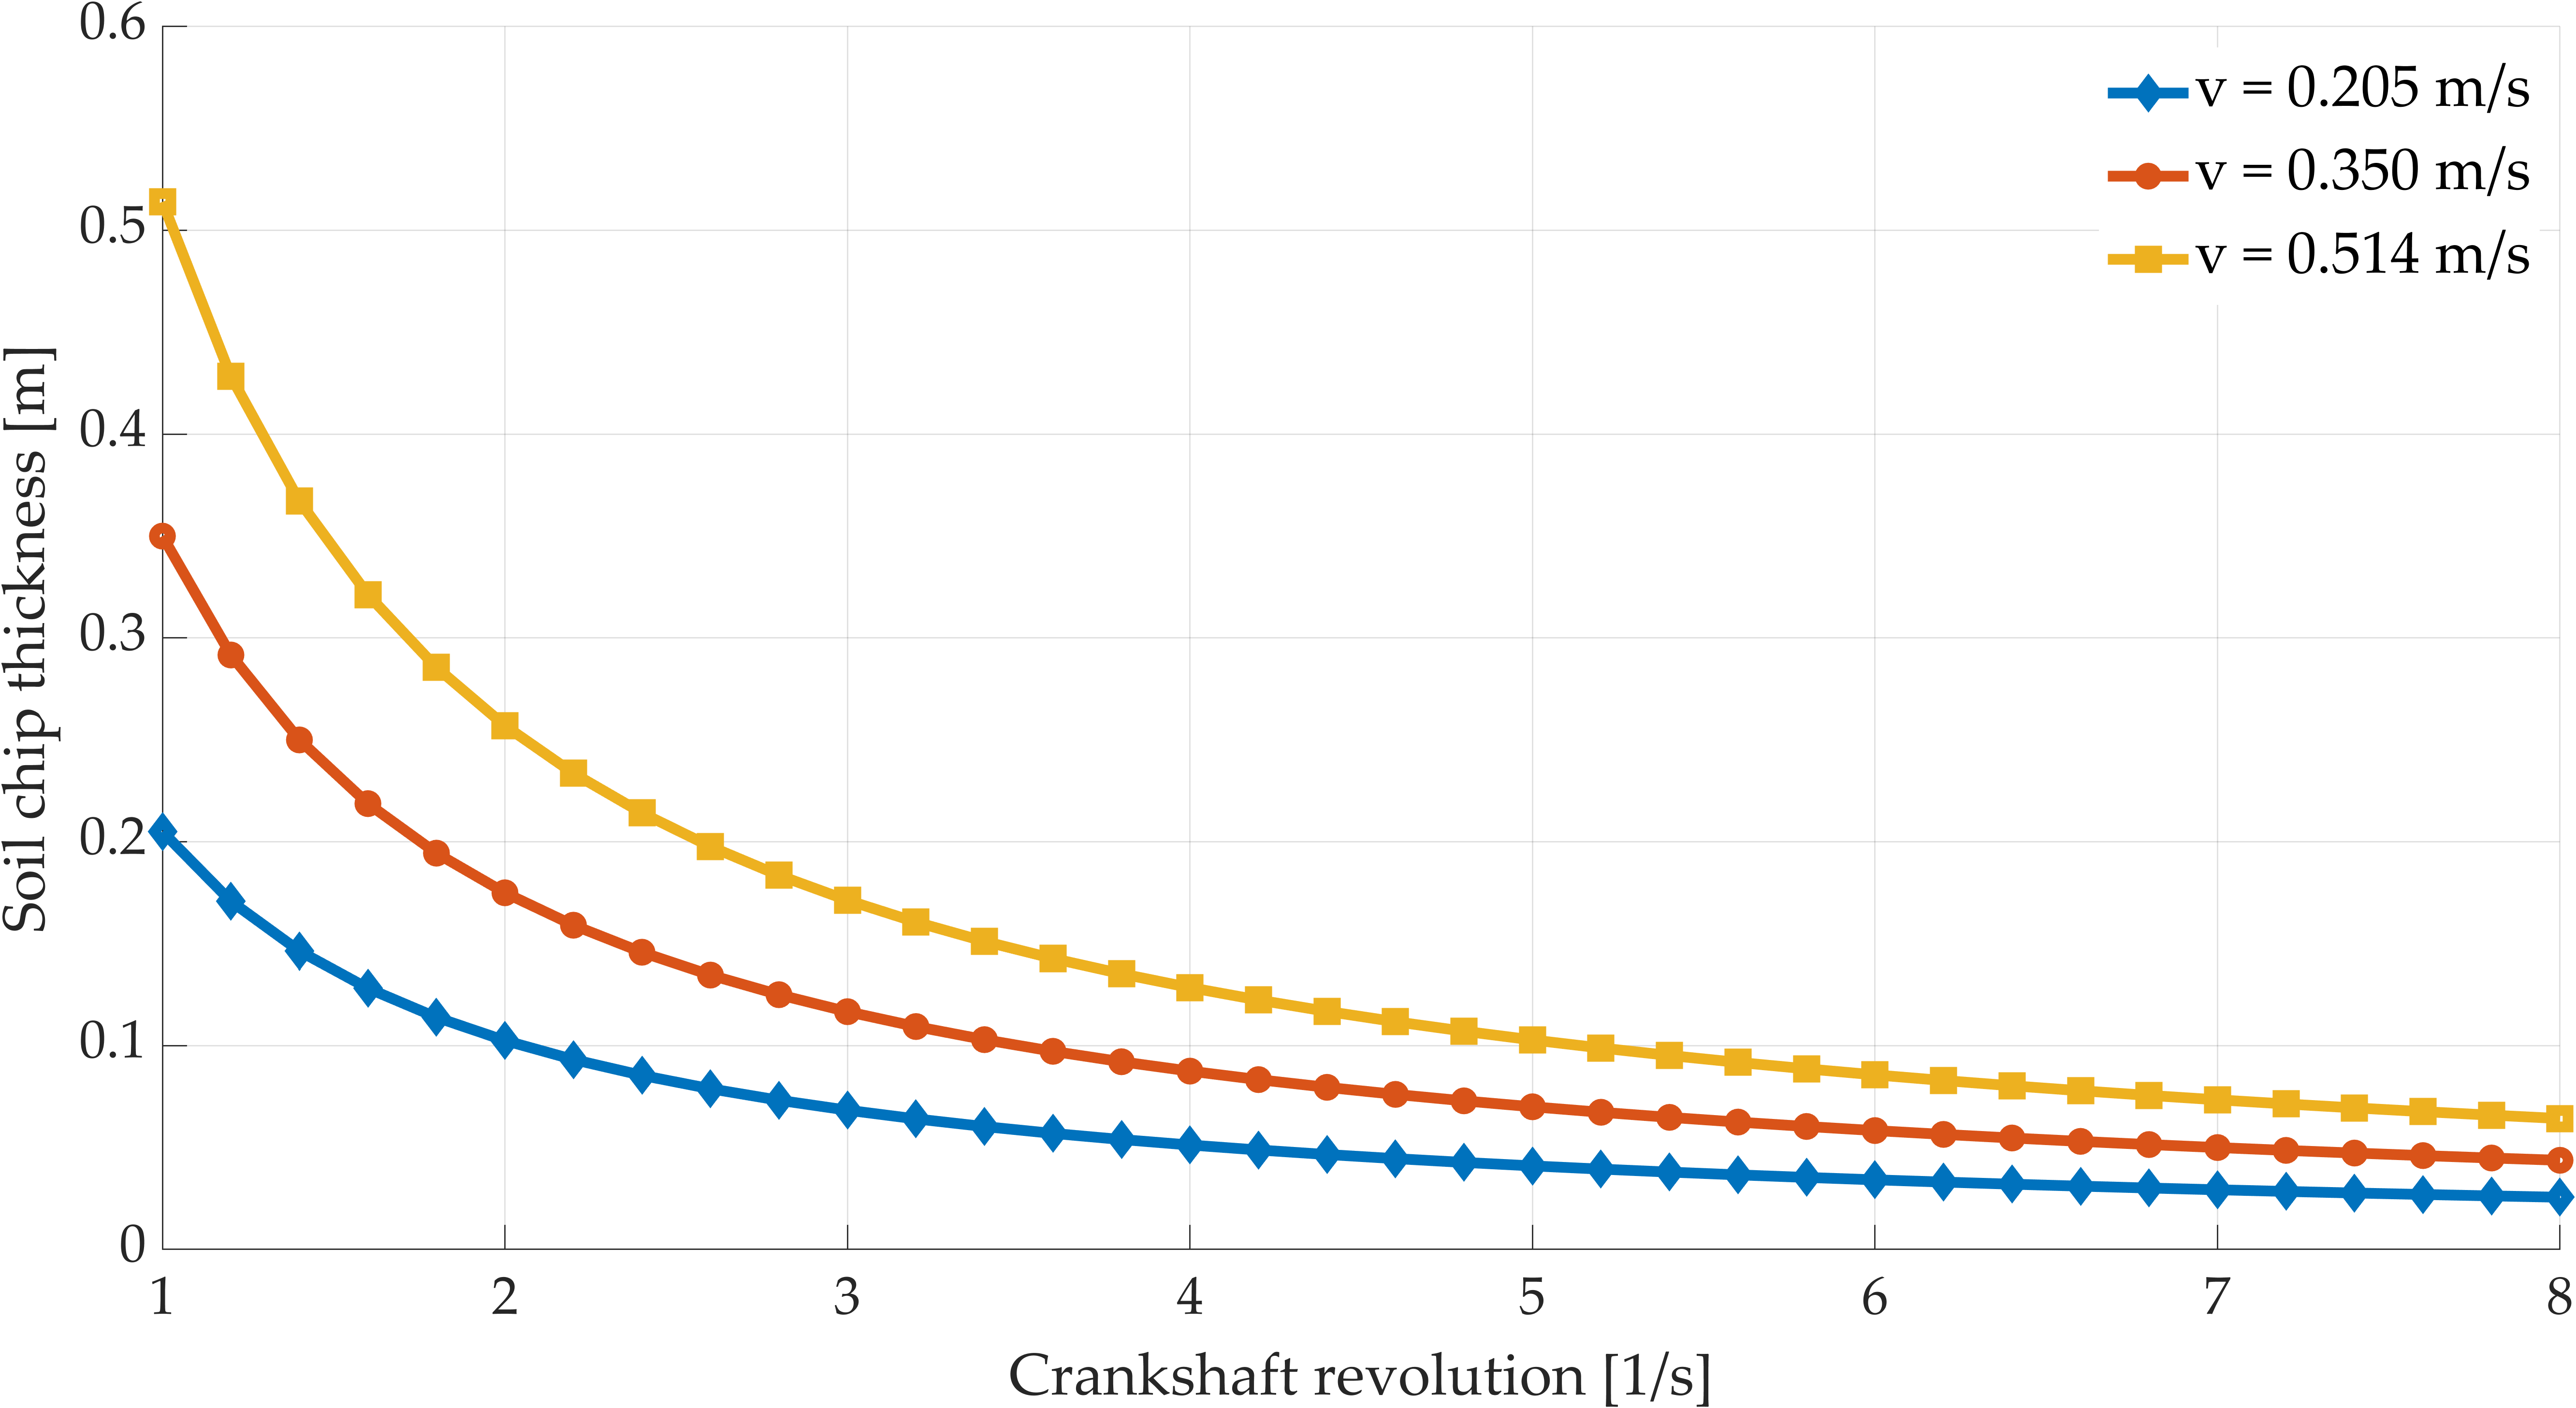
In order to determine the kinematic parameters of the machine’s mechanism, experimental measurements for the advancing speed
v (m/s) and soil chip thickness
s (m) are considered based on
Table 2 [
20]. Using the relation between those parameters, the crankshaft rotation is calculated and presented in
Table 2:
Based on the above Equation (11),
Table 2 and
Figure 5 may be built for the soil chip thickness determination as a function of the advancing speed and crankshaft revolution.
Considering the cases presented in
Table 2, it is obvious that higher rotation speeds of the spade assembly axes involves higher speeds and accelerations of the mechanism’s elements, which clearly implies higher load on the machine axle.
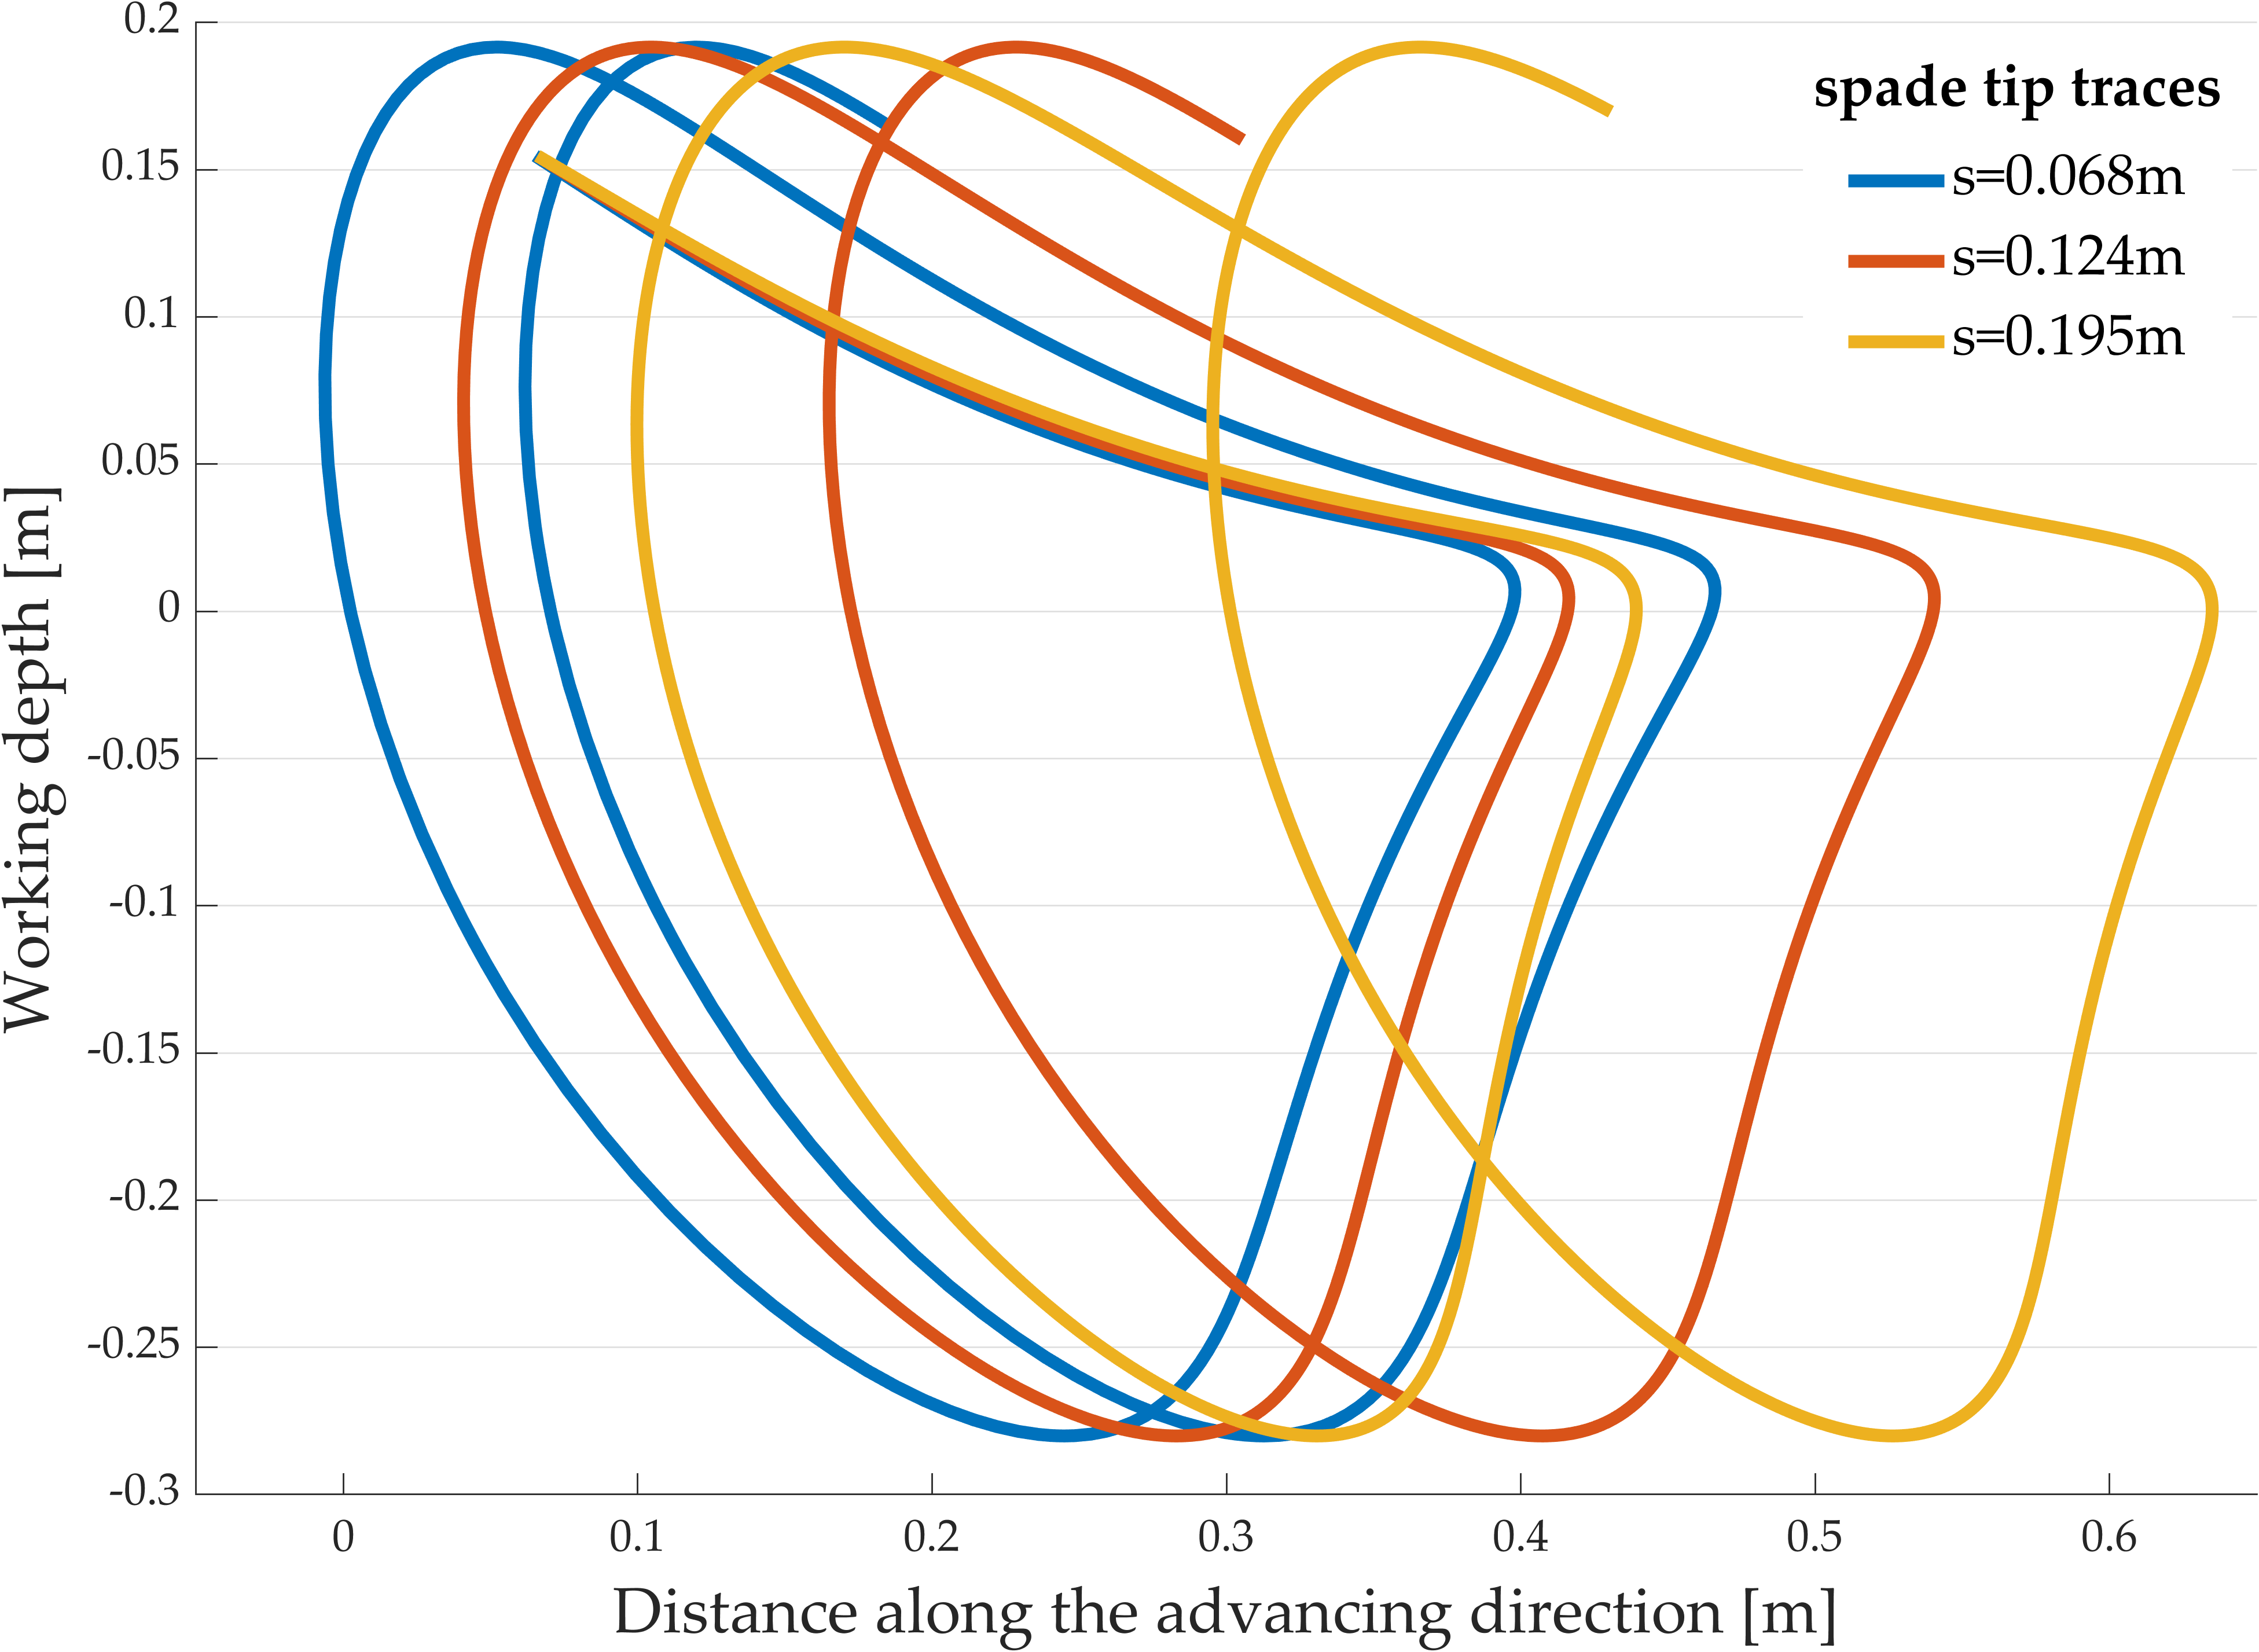
In order to expose the effect of different loads during the soil tillage, first the actuation of the machine above the soil surface is considered, involving 0 m working depth. Due to the geometry of the machine’s mechanism, the realized spade-tip trace is similar to that in
Figure 6, but the curve is shifted above the 0 value. In this case, the load of the rotating axle is produced because of the kinematic parameters of the working mechanism as well the mechanical parameters of the mechanism elements. The torque for the awakened inertial forces during cases IV, V, and VI can be seen in
Figure 7 for one working cycle in each case.
The recommended model (as already presented in
Figure 4) calculates the loads acting on the spading mechanism and implements Equations (5), (7) and (10) as further presented. The variables used to determine the implemented equations are chosen according to experimental data for a loam soil with 21% moisture content, with a density value of
= 1500 (kg/m
3) as considered in [
16,
17,
19]. The values
= 0.488 (m),
= 10
−4 (m
2), and
= 27·10
−3 (m
2) (
Figure 3) were read from the solid modelling system software (Autodesk Inventor) based on the CAD model of the spade. In the case of parameter
, the
component is ignored because
so the value
= 0.027 (m
2) is used in our simulations. Further parameters for the soil are based on [
16,
17,
18]:
= 12 (N/m
2),
= 0.5 (N/m
2),
= 0.6,
= 41°,
= 1000 (N/m
2),
= 20,000 (N/m
2), and
= 32°.
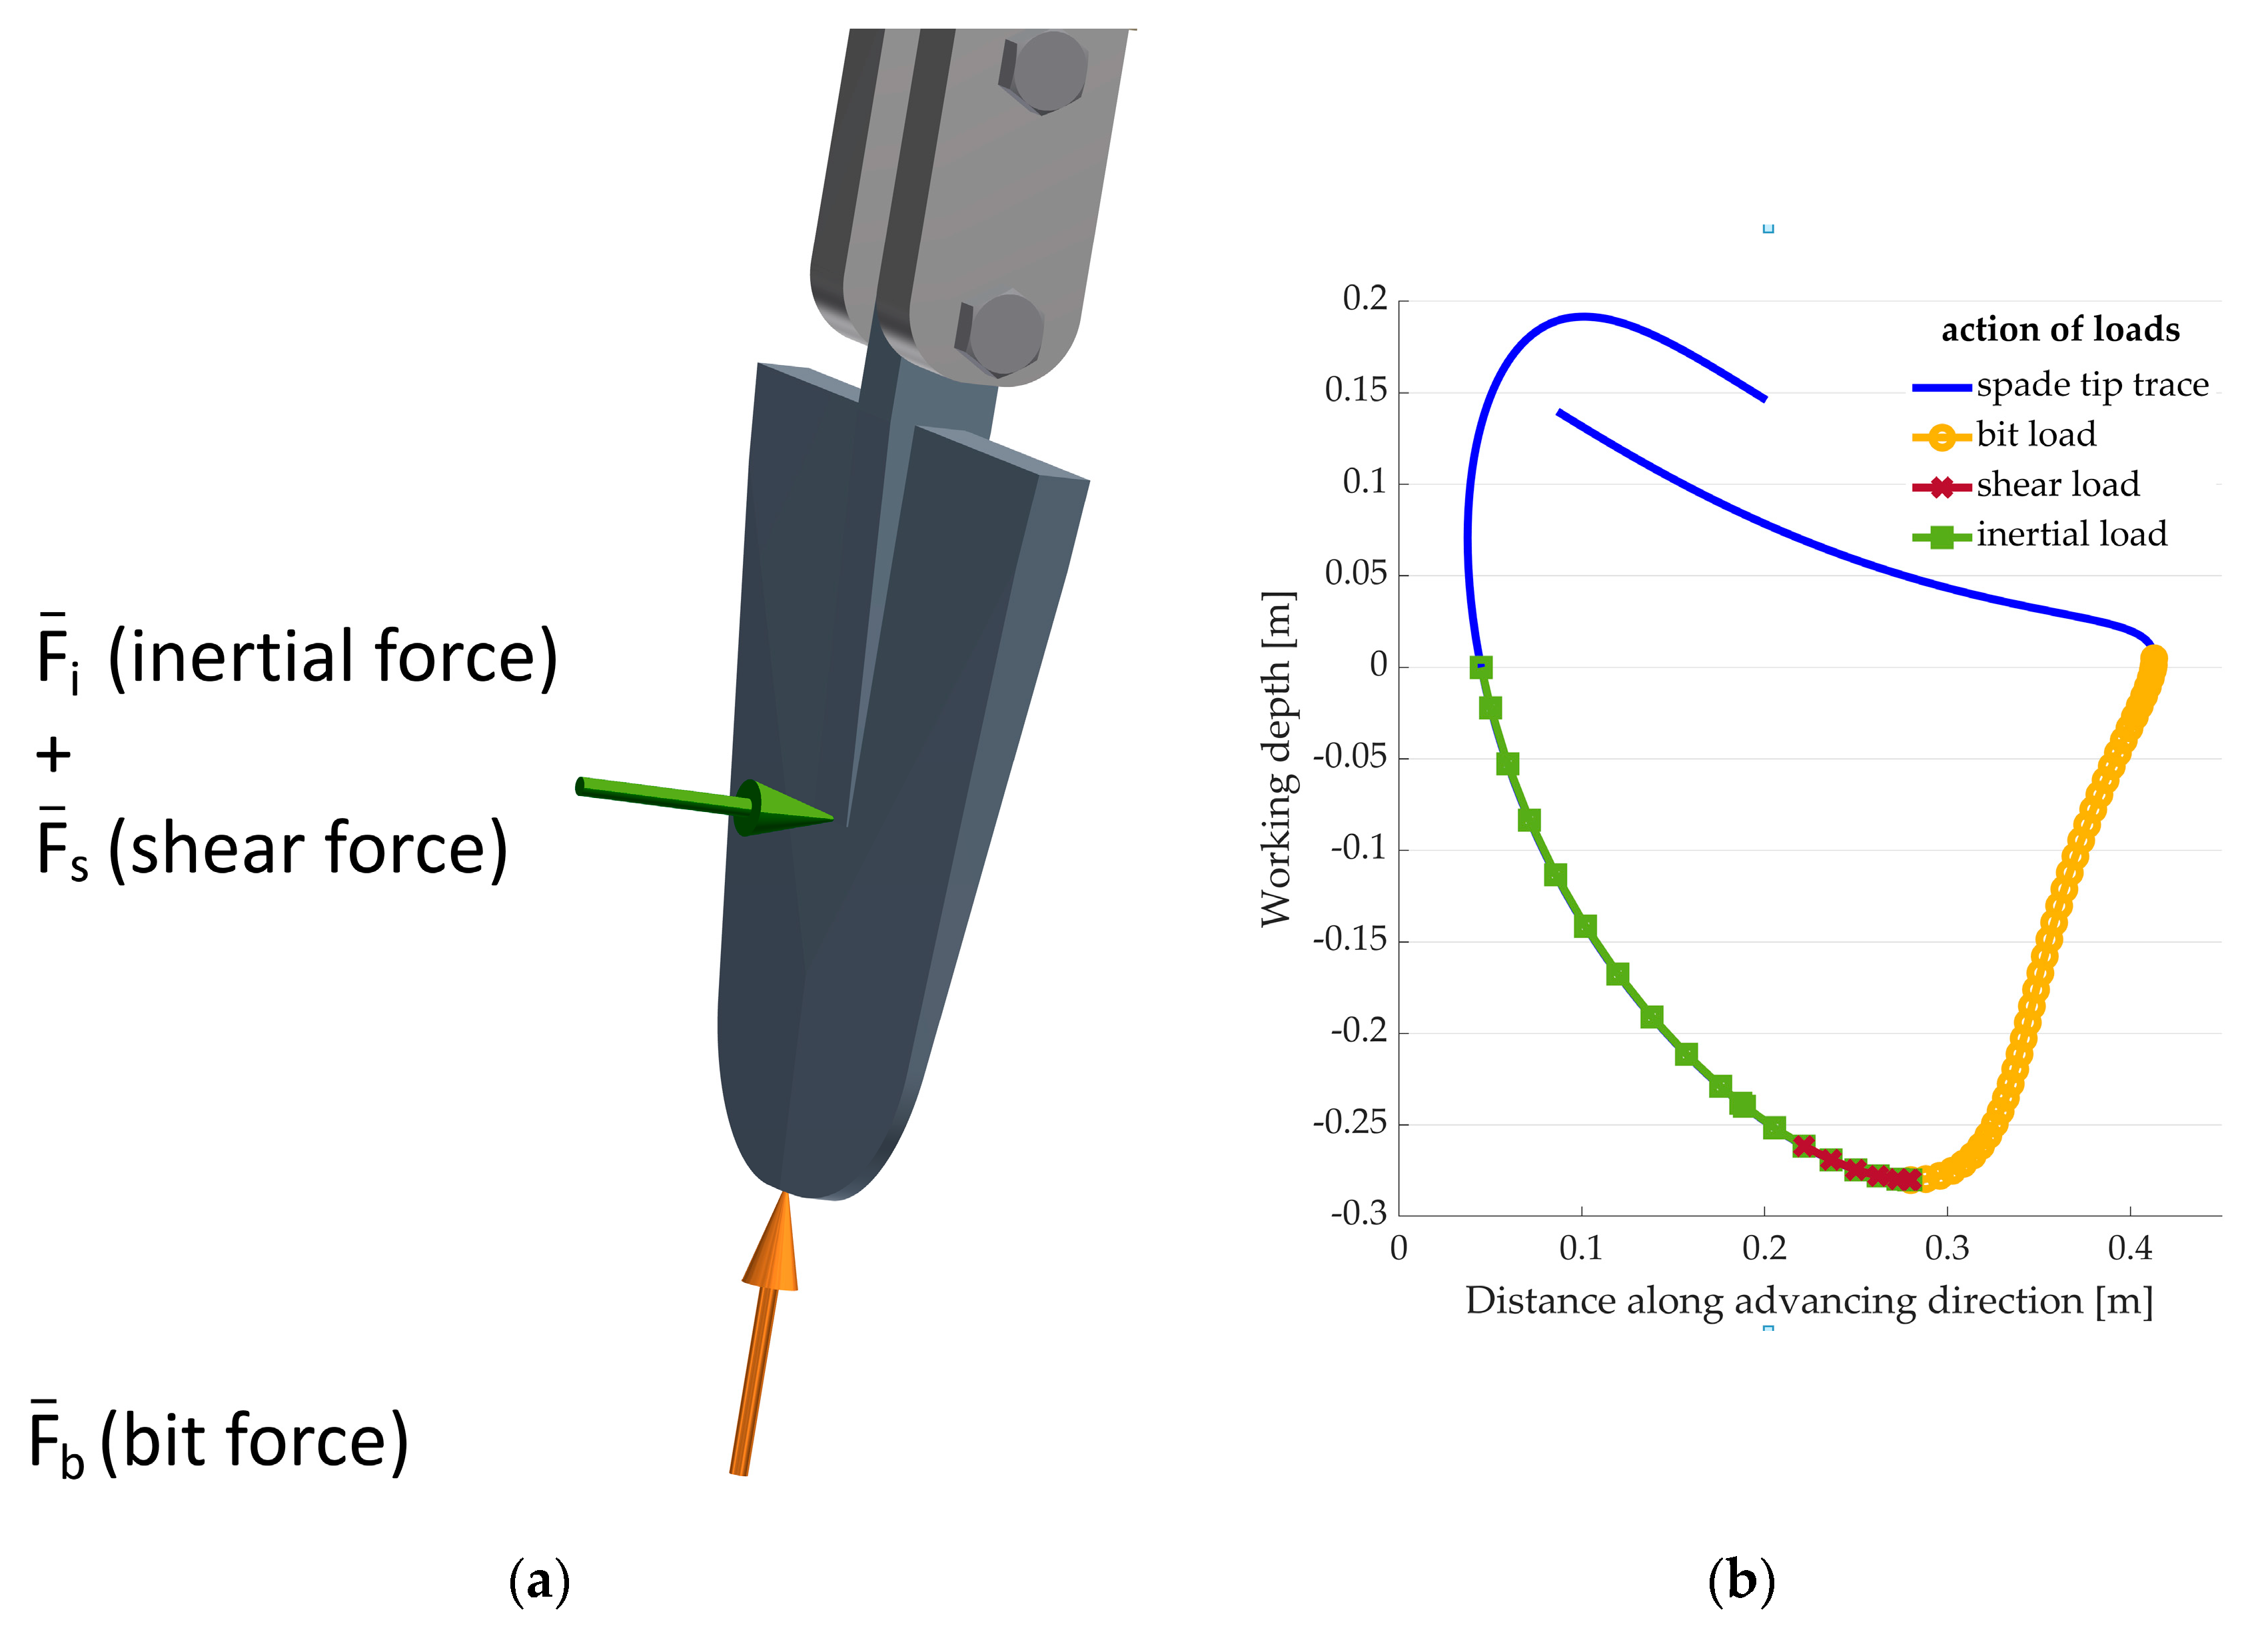
In this paper, to present the methodology of the investigation, the working load (with a working depth different from 0 m) is split in three forces acting on the spade. The positions of the acting points are given relative to the spade depicted in
Figure 8a. Taking into account one rotation cycle of the spade assembly, the action interval of the loads relative to the tip trace of the moving spade are presented in the
Figure 8b.
Next, the loads resulting from the different type of forces applied on the driving crankshaft are investigated. As a final step, the combined load of the different forces are studied.
As presented in
Figure 8a, three type of force were taken into account:
The bit force is acting along the spade’s plane, resulting from the penetrating movement in the soil as the spade cuts the soil chip, which will be moved.
The shear force is acting in a short time interval at the moment in which the soil chip is displaced. The shearing phenomena appears along the down and side part circumference of the spade, but in this paper, the equivalent load is considered acting in the middle of the spade as a concentrated load.
The inertial force is acting also in the middle of the spade, and is a load resulting from the mass of the displaced soil, and is influenced by the acceleration of the spade during the up and backward motion.
To be able to take into account these three forces, they are determined separately and applied individually in the model, as presented in the area “Load definition” of
Figure 4. Based on the kinematics of the spade assembly (obtained by the mechanism element’s properties query, through the model block
spade_kinematics), at each step of the simulation, the conditions of the presence of distinct forces are evaluated by the
enable_X blocks.
Figure 8b presents the acting intervals of the forces relative to the working cycle. Inside the intervals, the model blocks
X_value, which returns the calculated force values, are enabled. Then, in the way presented above, they are directionally applied as vectors within the
applied_X blocks. As can be observed in
Figure 4, inside the mentioned block names, the
X stands for
bit_force,
shear_force, and
inertial_force, depending of the examined type of load.
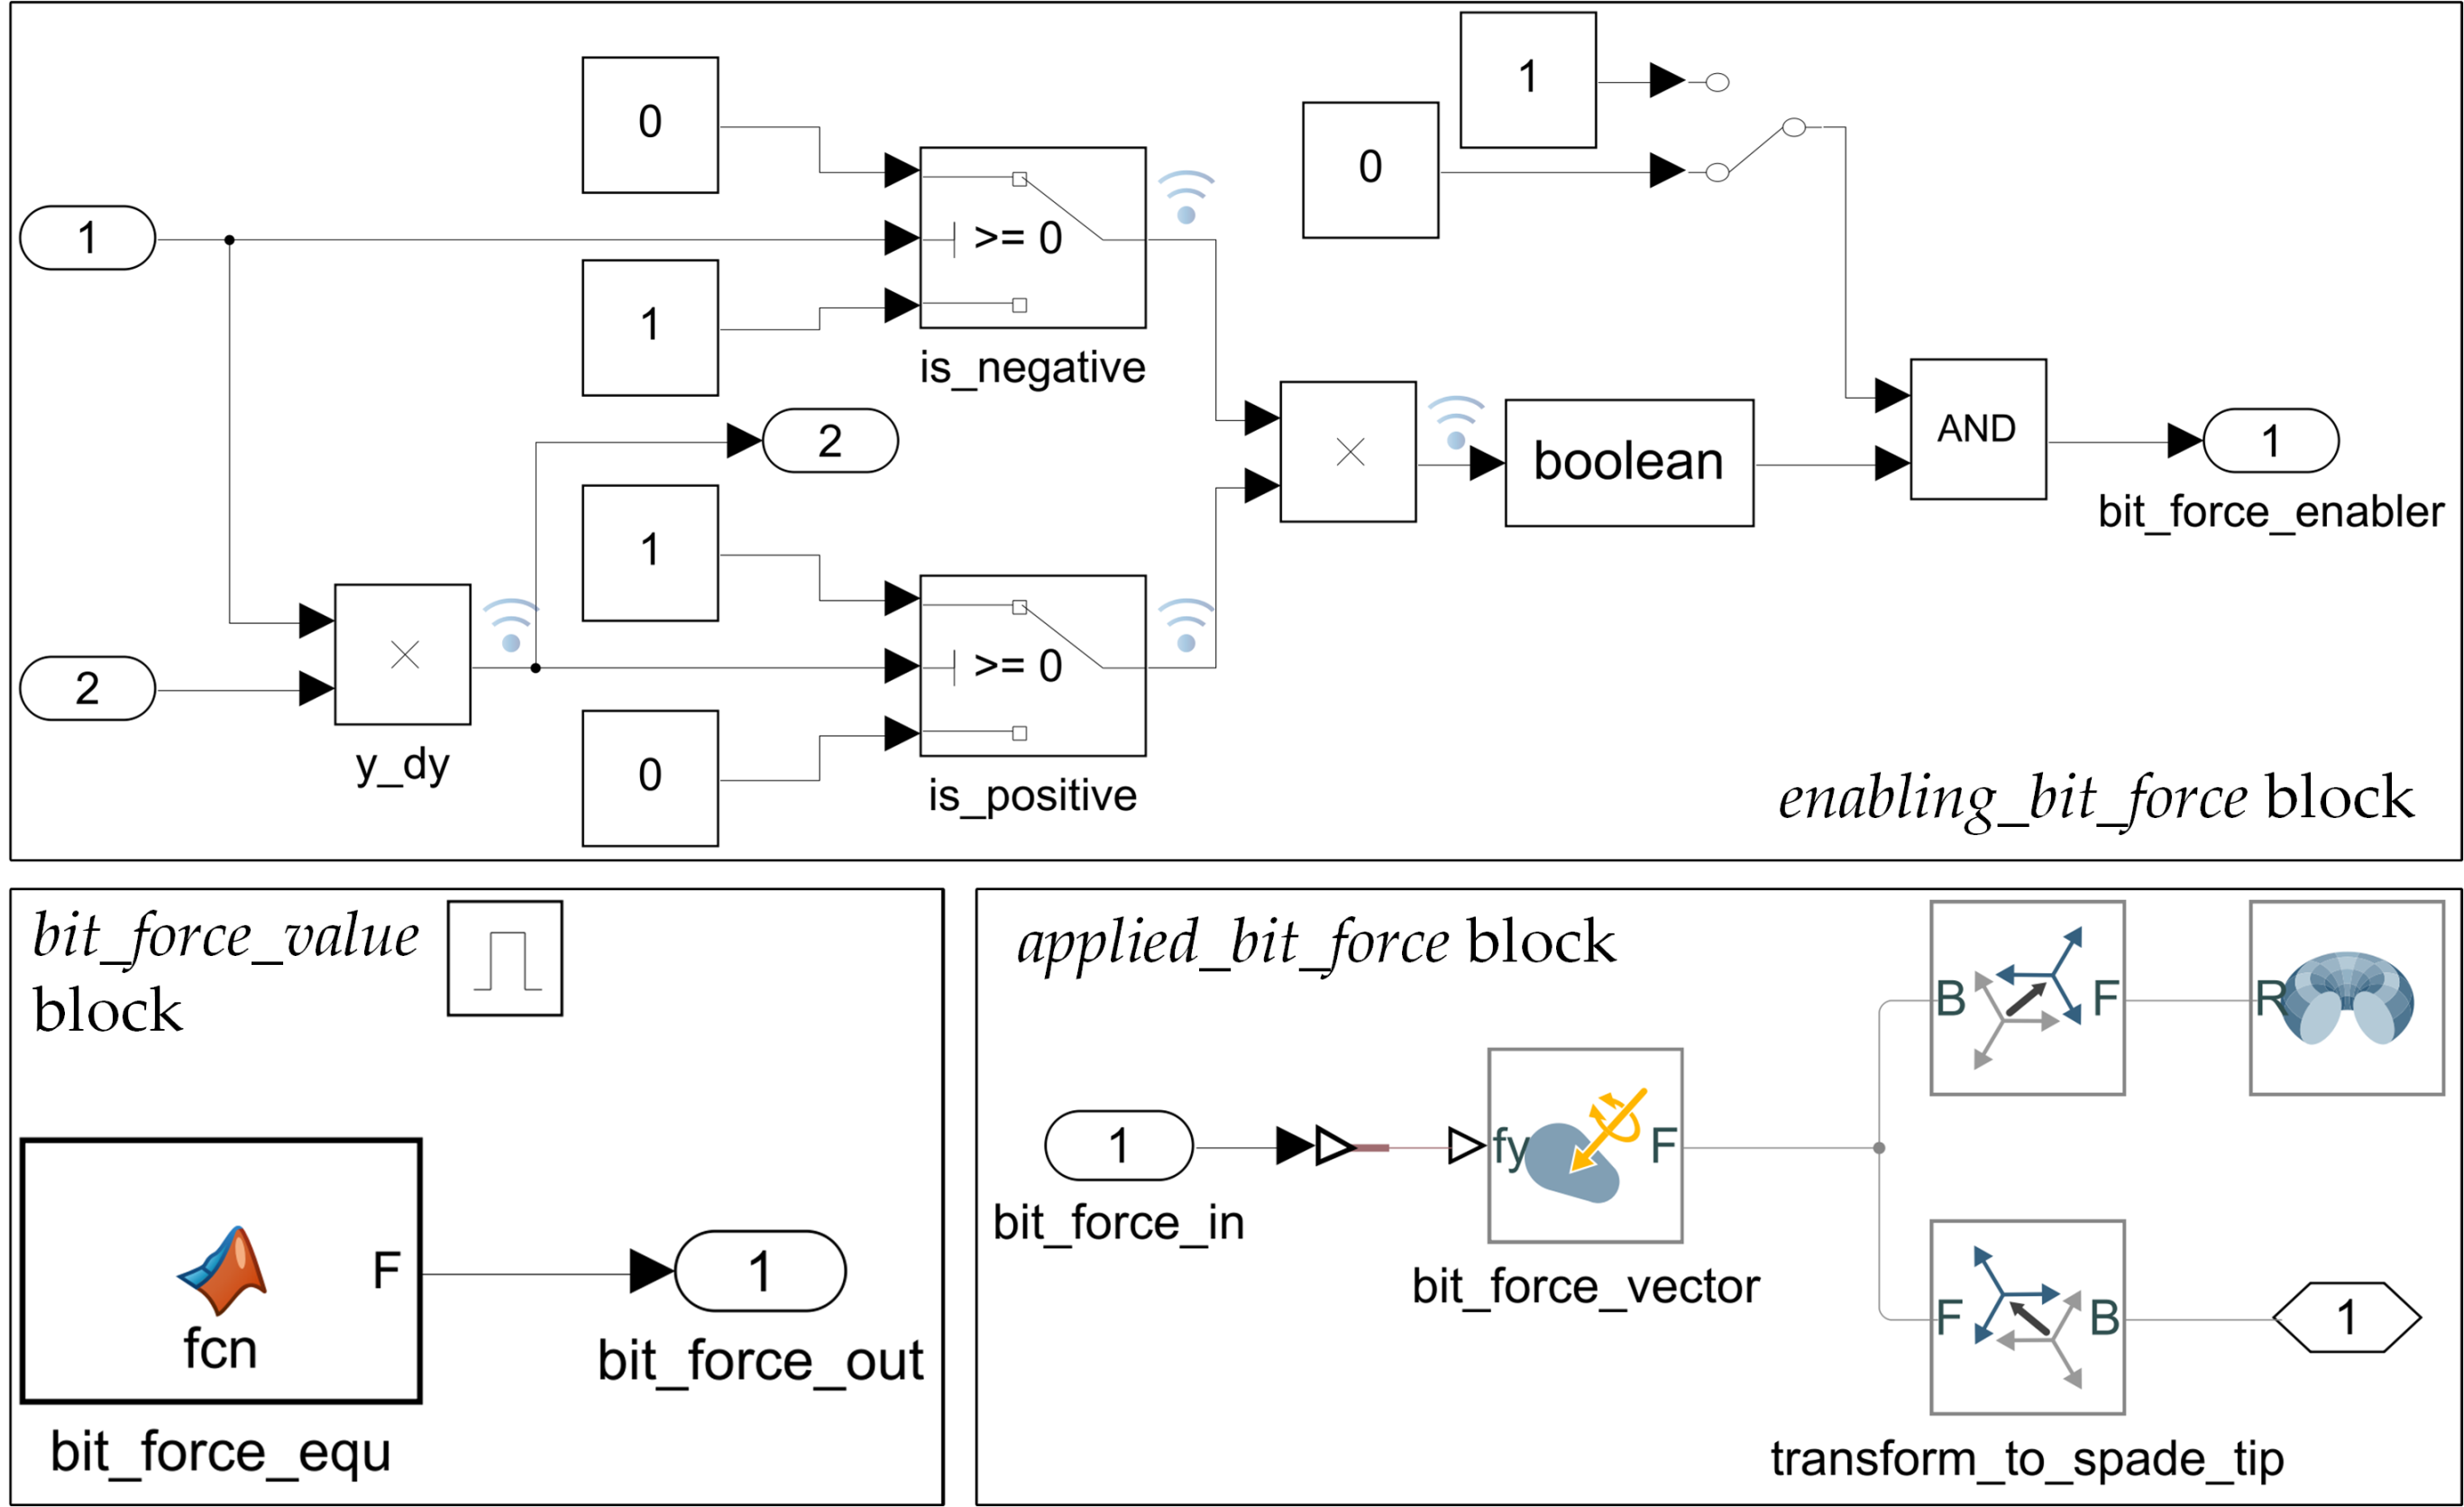
3.1. Effect of the Bit Force
Because the bit force must act on the spade as it hits the soil, until the spade moves downward, the enabling condition is met if the actual depth of the spade tip is below the surface (
< 0) and
, where
is the vertical velocity of the spade. The bit force is calculated based on Equation (5) implemented in the
bit_force_equ block (
Figure 9) as MATLAB
® script. In the third block, the load is applied as vector along the longitudinal axis of the spade. The
enabling_bit_force block contains a manual switch (as can be seen in other enabling blocks, too) in order to be able to switch on/off the force effect during different investigations.
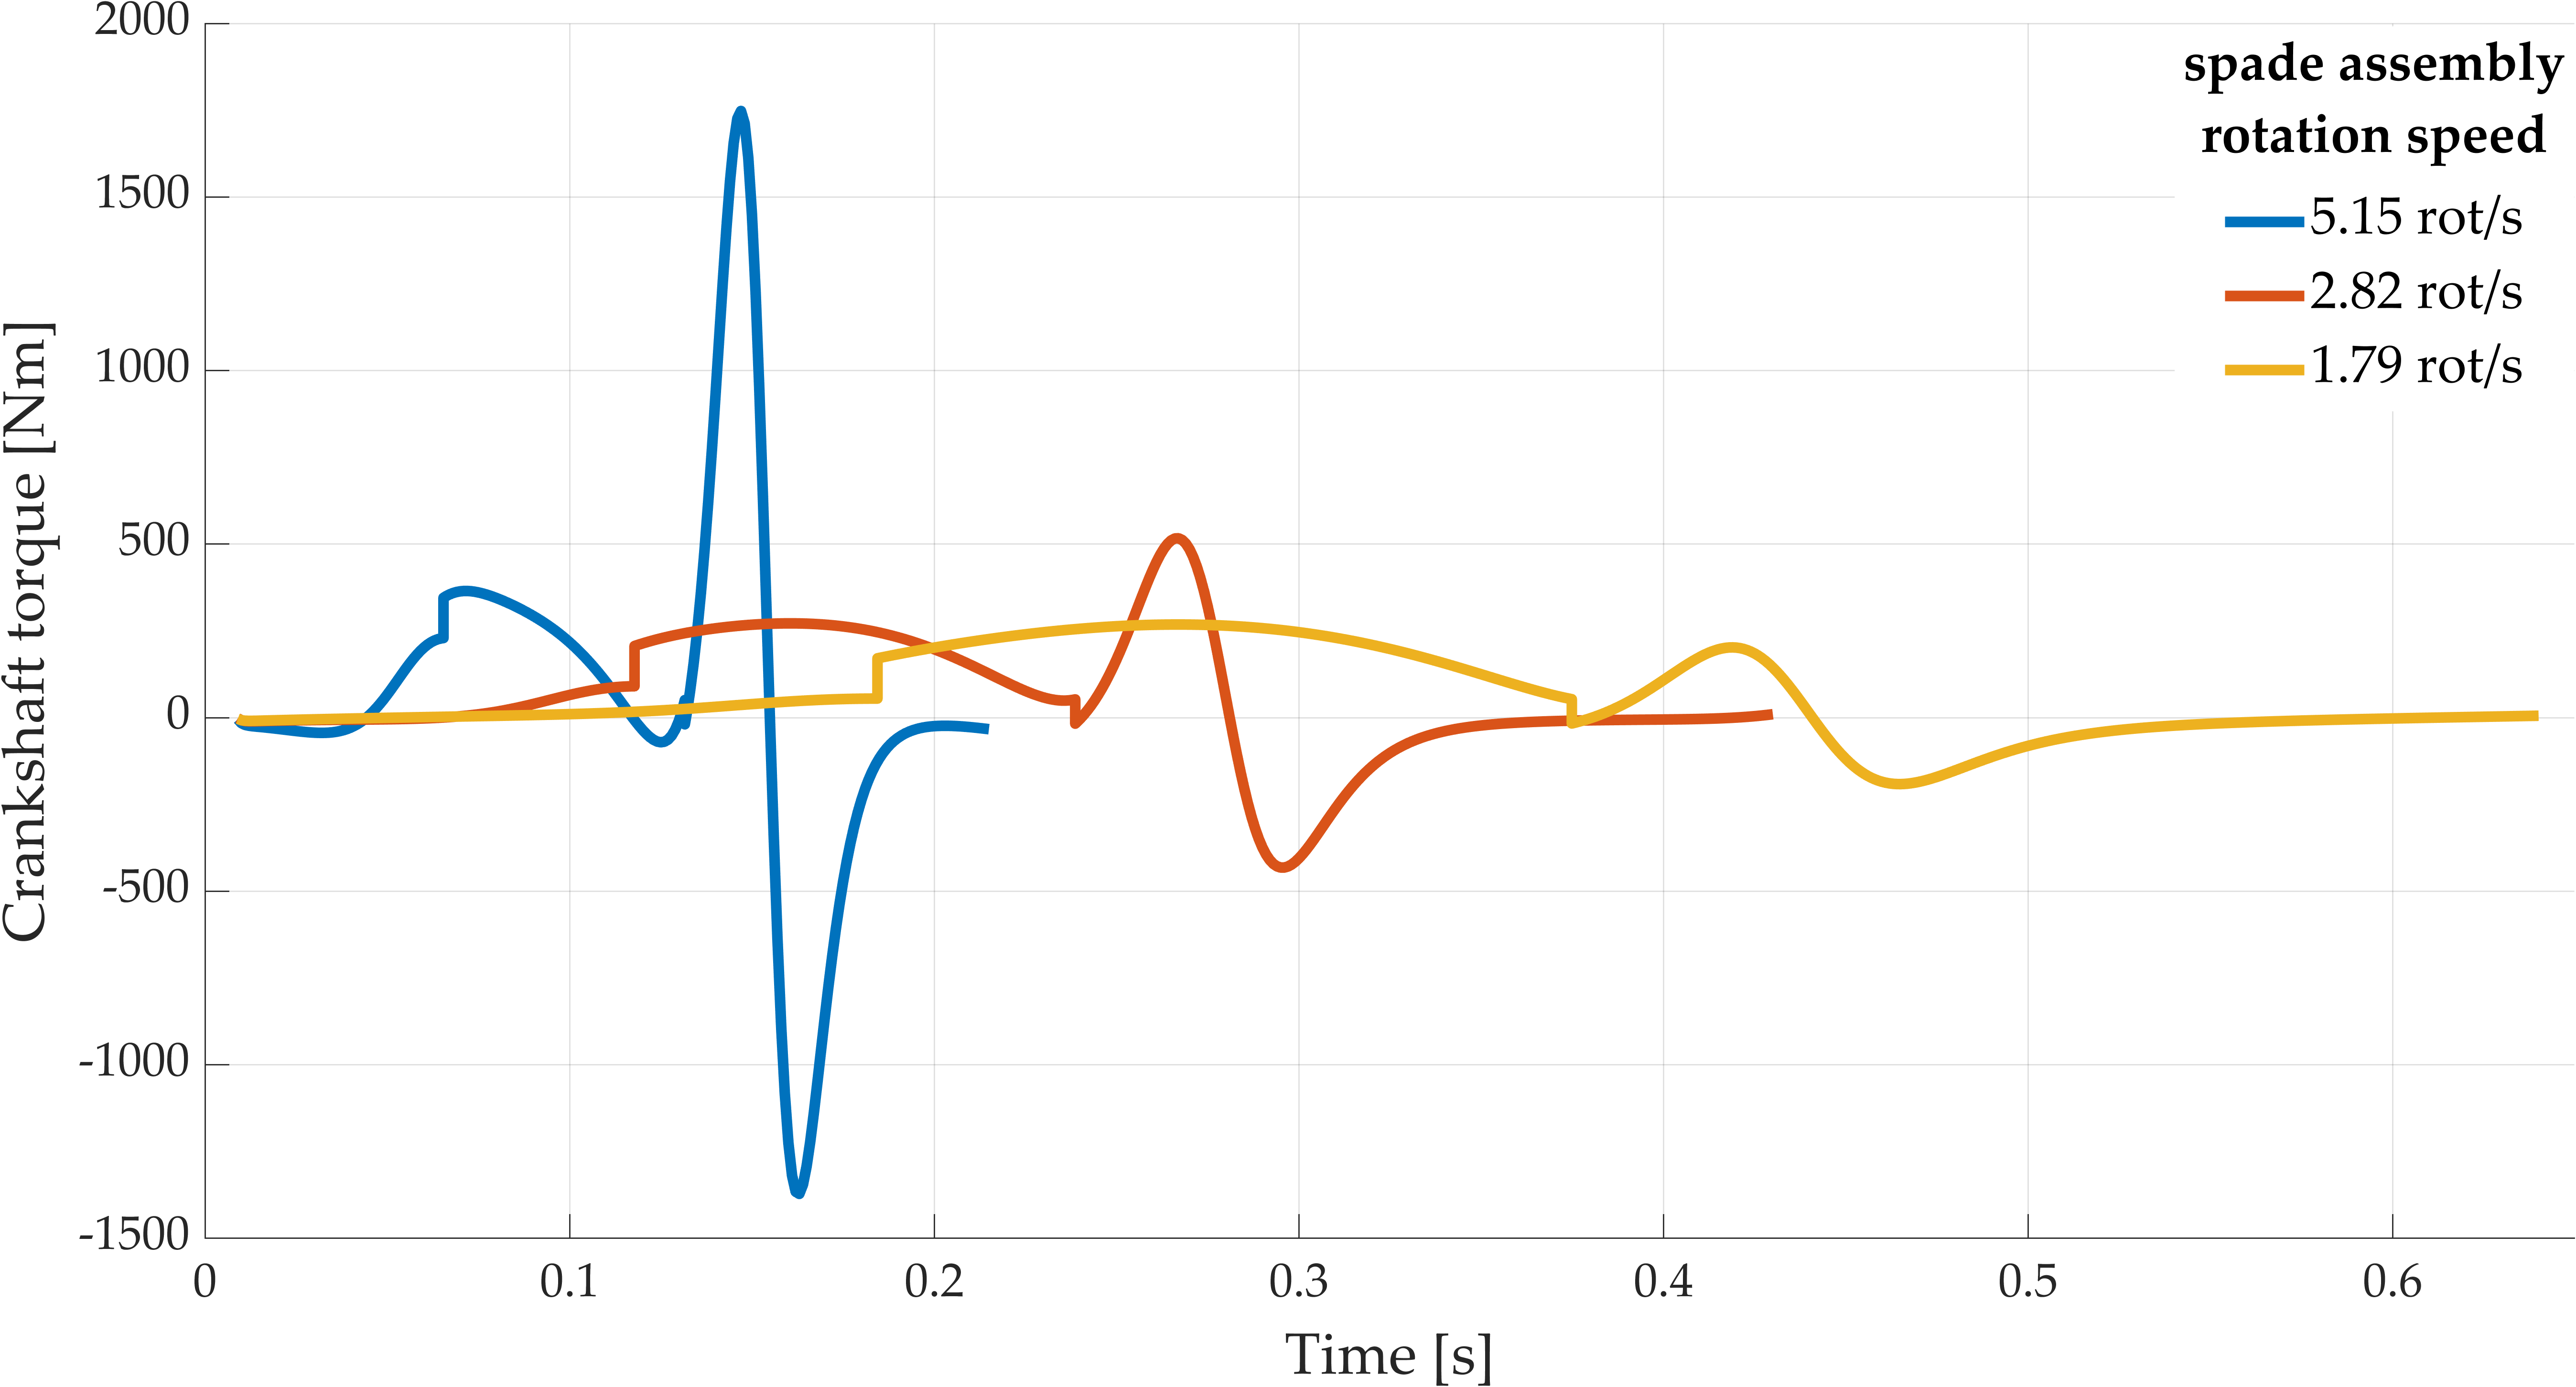
In
Figure 10, the simulation results of working cases IV, V, and VI (
Table 2) are presented regarding the influence of the bit force on the crankshaft by a working depth of 0.28 m and machine advancing speed of 0.35 m/s. Those will be overlapped over the spade assembly torques already presented in
Figure 7. A major observation can be made: for case VI, the load deriving from the bit process is comparable with the working 0-depth maximum load. This means that, considering six equidistant rotating spade assemblies, extraordinary torque spikes can be avoided by carefully choosing the working parameters for soil tillage.
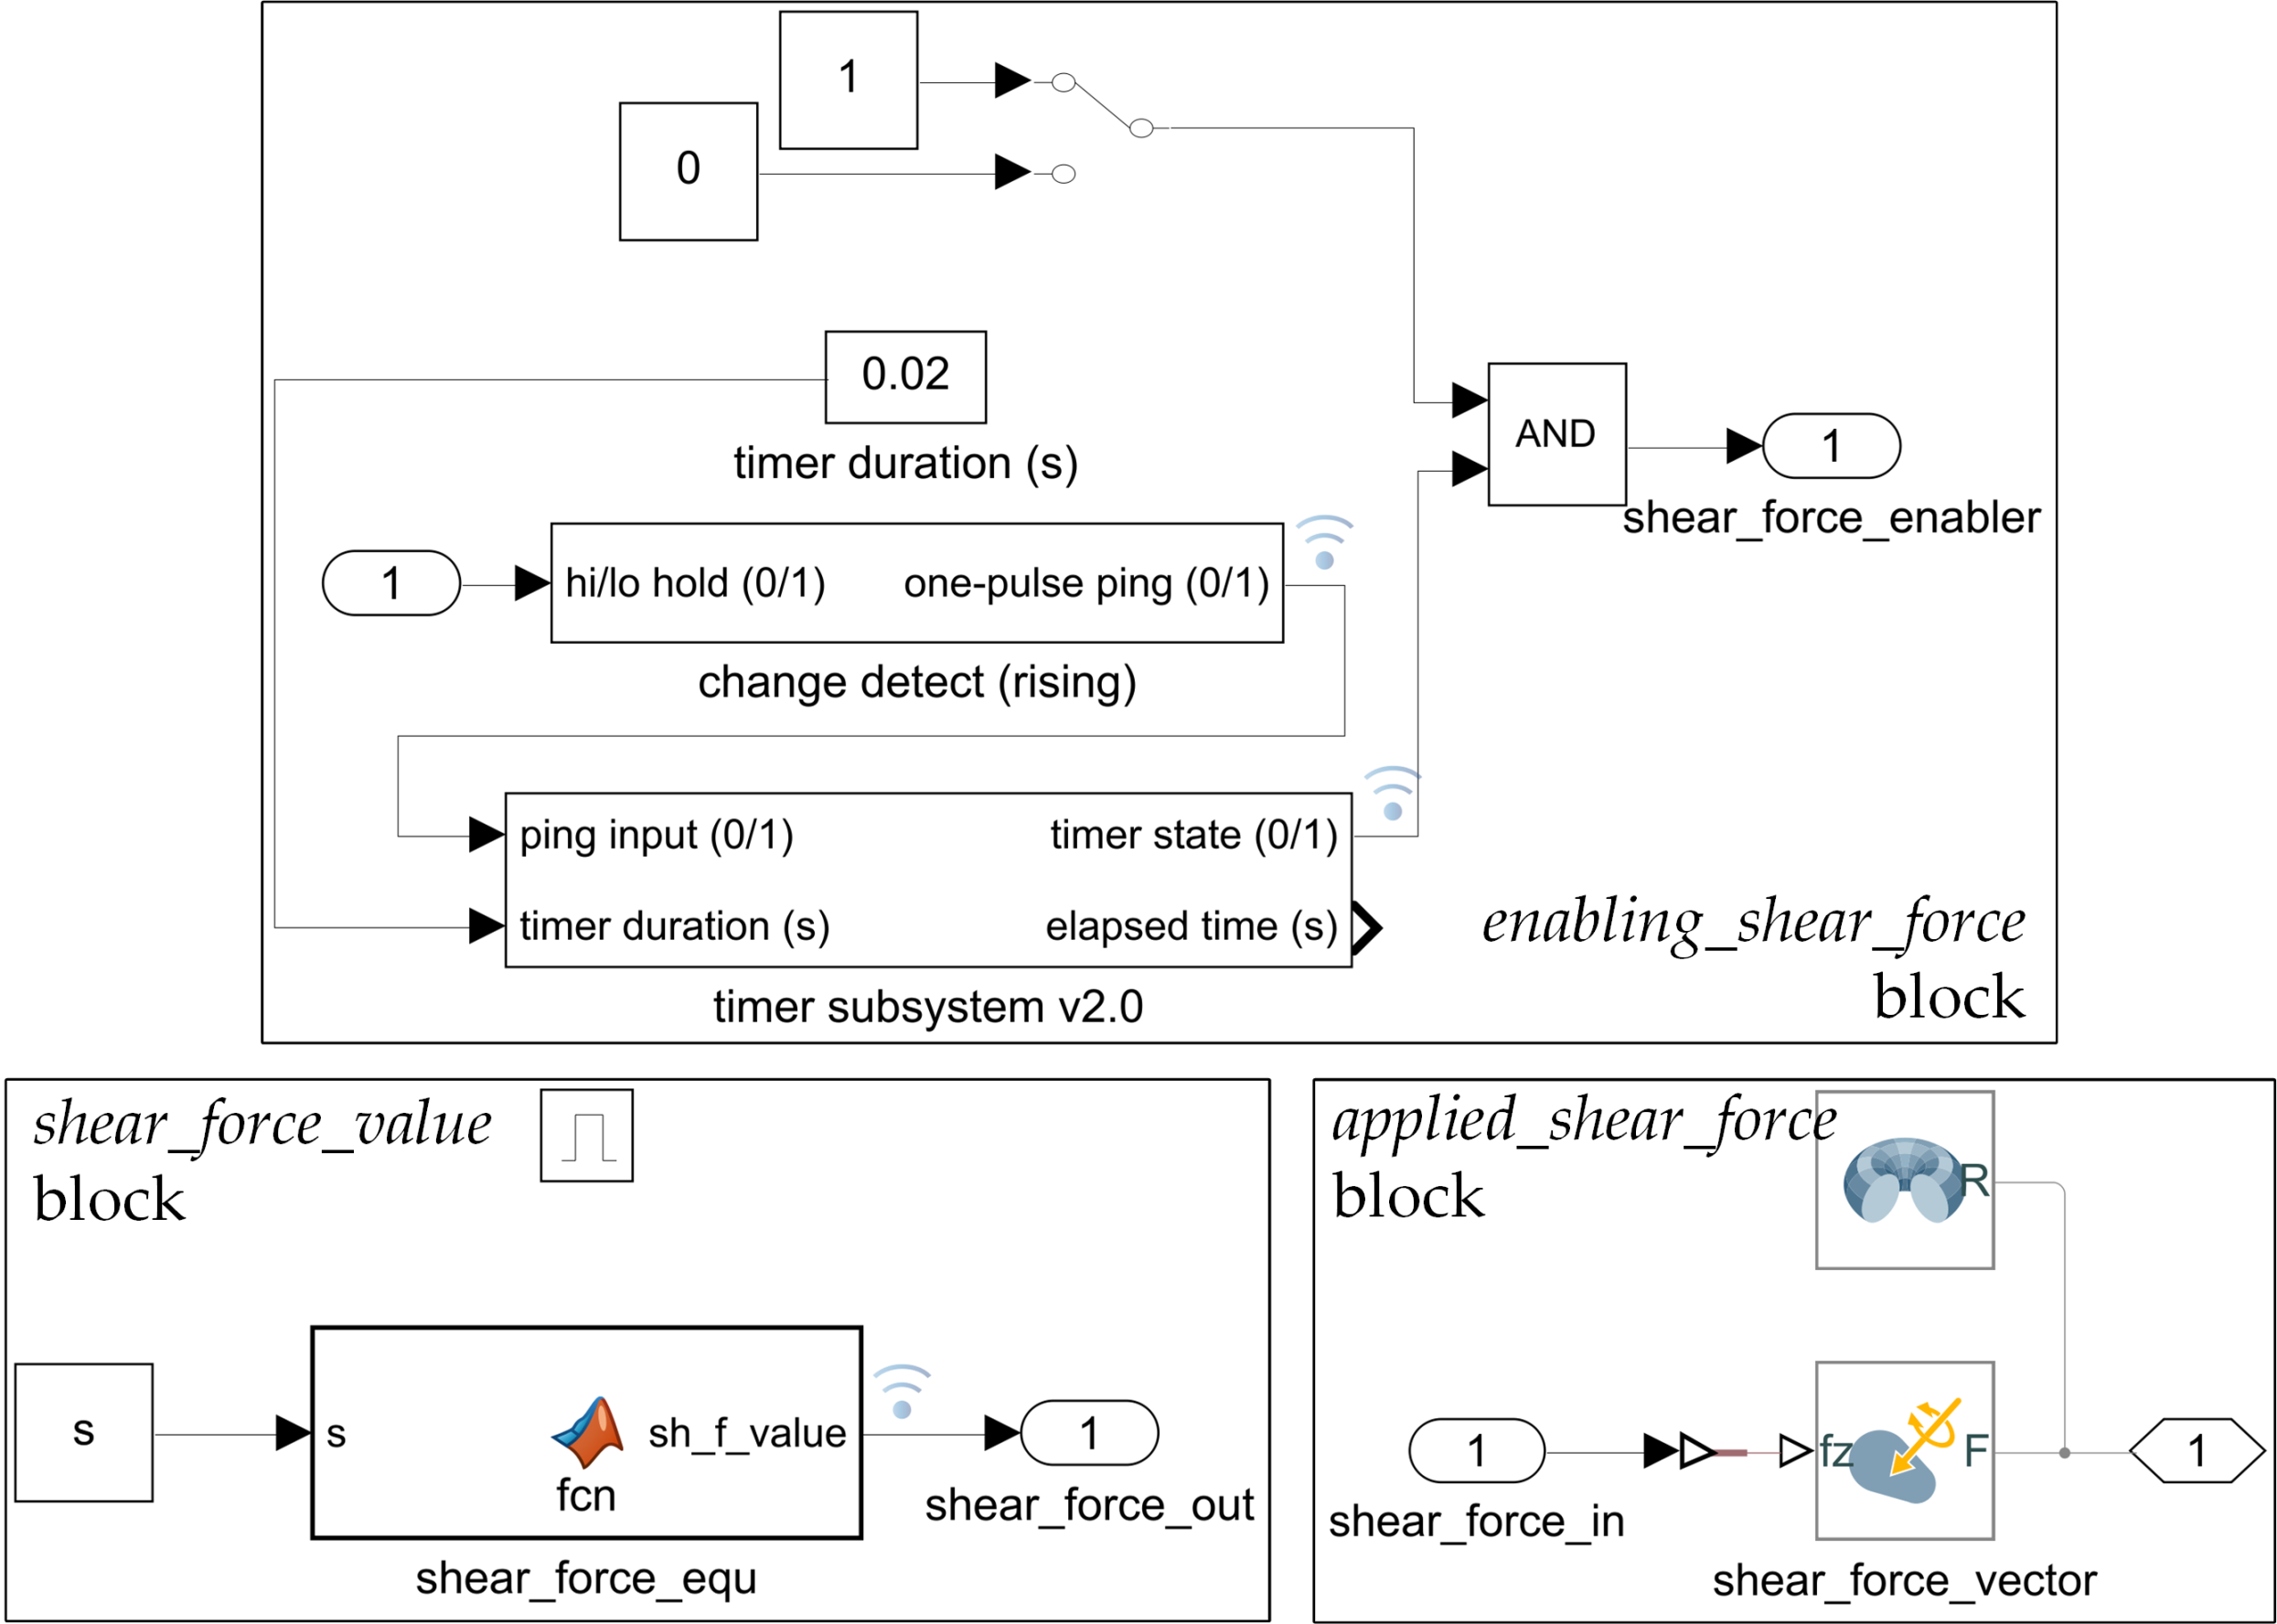
3.2. Effect of the Shear Force
As can be seen in
Figure 8b, the shear force must be considered for a short period of time as the spade begins to move backward relative to the machine advancing direction. Because it happens approximately on the minimum of the spade-tip trace, the input of the
enabling_shear_force block comes as the
turns to be positive.
Figure 4 shows that the shear force will be enabled by the
bit_force_disabler block for a short time through an inverted logical signal’s rising edge. In the MATLAB
® model, the timer subsystem from [
21] is used. The duration of the action can be set, and for the present investigation, the 0.02 s time parameter is used. The modulus of the shear force is calculated based on Equation (7) and applied in the
shear_force_equ block (
Figure 11) as MATLAB
® script. In the third block, the load is applied as a vector along the normal of the spade plane acting in the middle of the spade according to
Figure 8a.
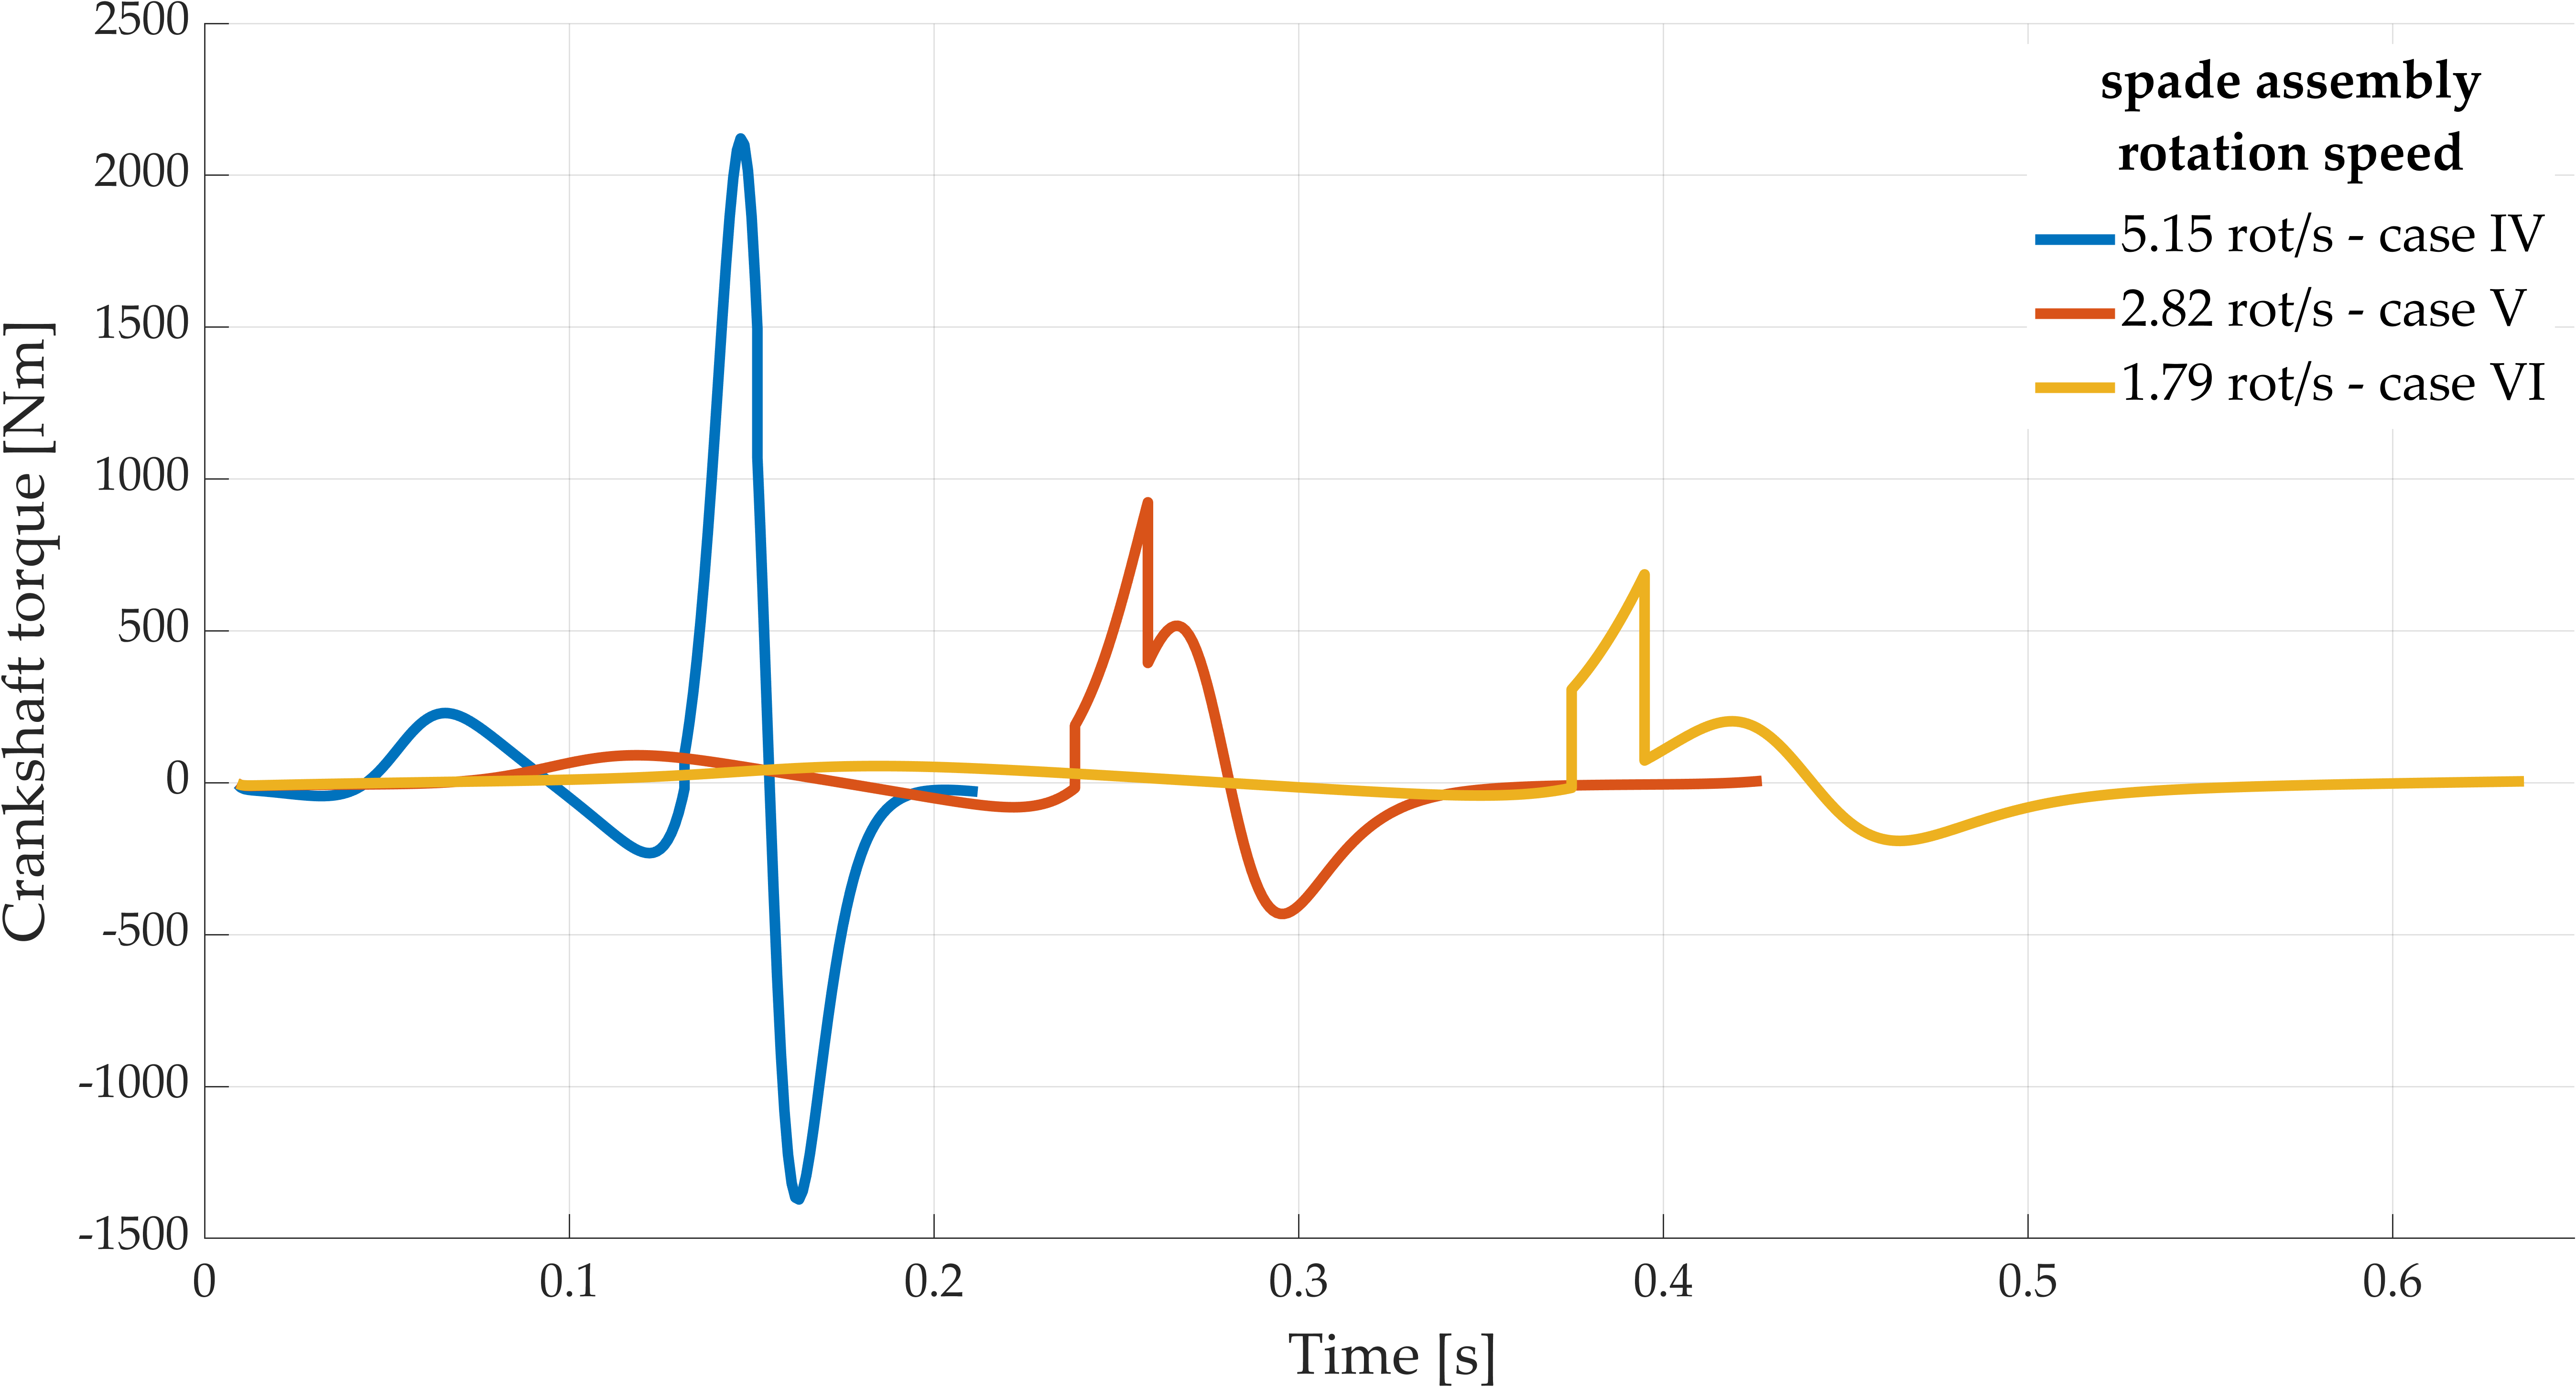
The effects of shearing forces for working cases IV, V, and VI (
Table 2) are presented in
Figure 12. Because the load magnitude is proportional to the assembly’s acceleration, the shear effect is considerably greater by higher revolutions of the crankshaft. Considering working case IV, the shear load is totally overlapped over the maximum torque for 0-depth working: It starts at 0.1316 s and lasts 0.02 s, raising the maximum torque by 21.3% until the value 2121.22 Nm. For the other two cases, the maximum torque is raised even more drastically by 78.85% (case V) and 239.25% (case VI), but the absolute value of the torques are reduced to 923.43 Nm and 686.10 Nm.
3.3. Effect of the Inertial Force
Additionally by this third force, the parameter
and the product
are used for determining the action interval of the soil-chip inertia force on the spade mechanism. In addition, the
depth_limit constant block is introduced in order to have control on the interval’s upper limit. For presentation purposes, the
depth_limit is set to 0 (
Figure 13) to have an accentuated inertial effect on the spade, meaning that the displaced soil will be accelerated by the spade until the surface of the soil is reached. To model the real process, this value may be varied until the maximum working depth of the mechanism (28 mm for the considered spading machine). The displaced soil’s mass is calculated based on Equation (10).
In the third block, the load is applied as vector along the normal of the spade plane acting in the middle of the spade, as in the case of the shearing force.
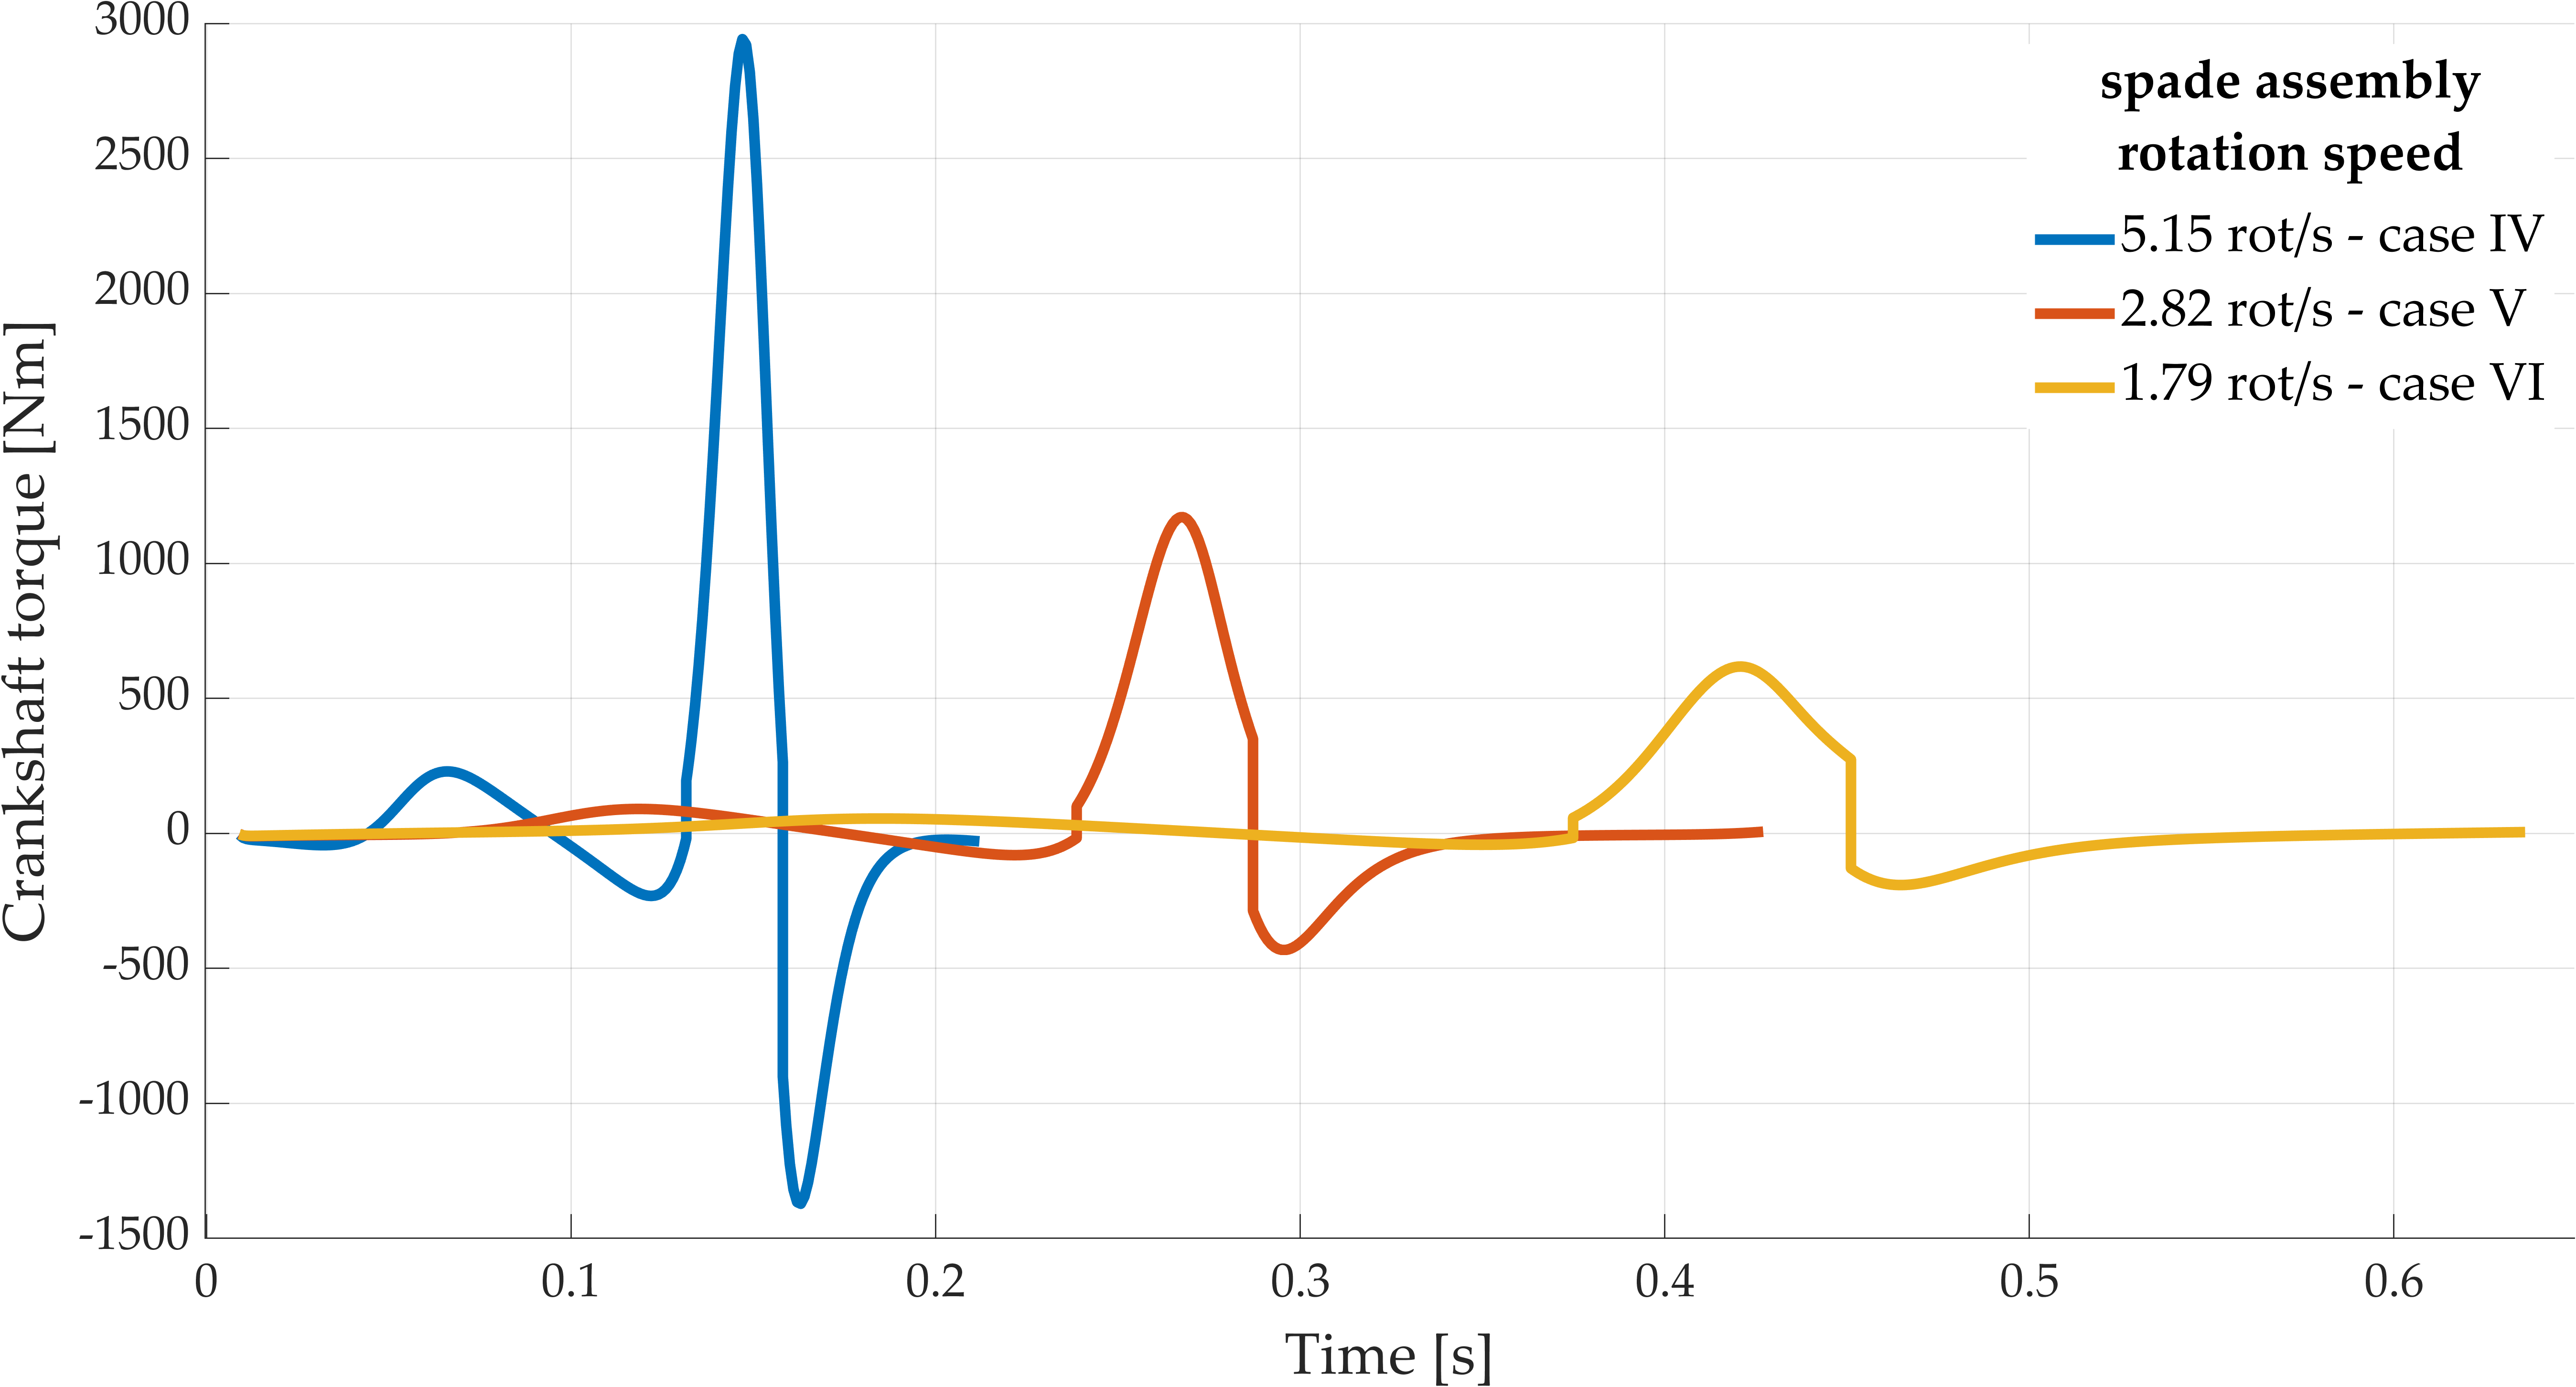
The inertial effect of the displaced soil may be observed in
Figure 14, simulating the soil tillage for working cases IV, V, and VI from
Table 2 and taking into account only the inertial load. Due to the significant differences in the acceleration of the mechanism’s elements in the three cases, the decrease of the inertial effects are substantial, as the crankshaft revolution decreases from case IV until case VI: despite the 205.56% overload (regarding to 0-depth working) in case VI, it will result in a 617.98 Nm maximum torque.
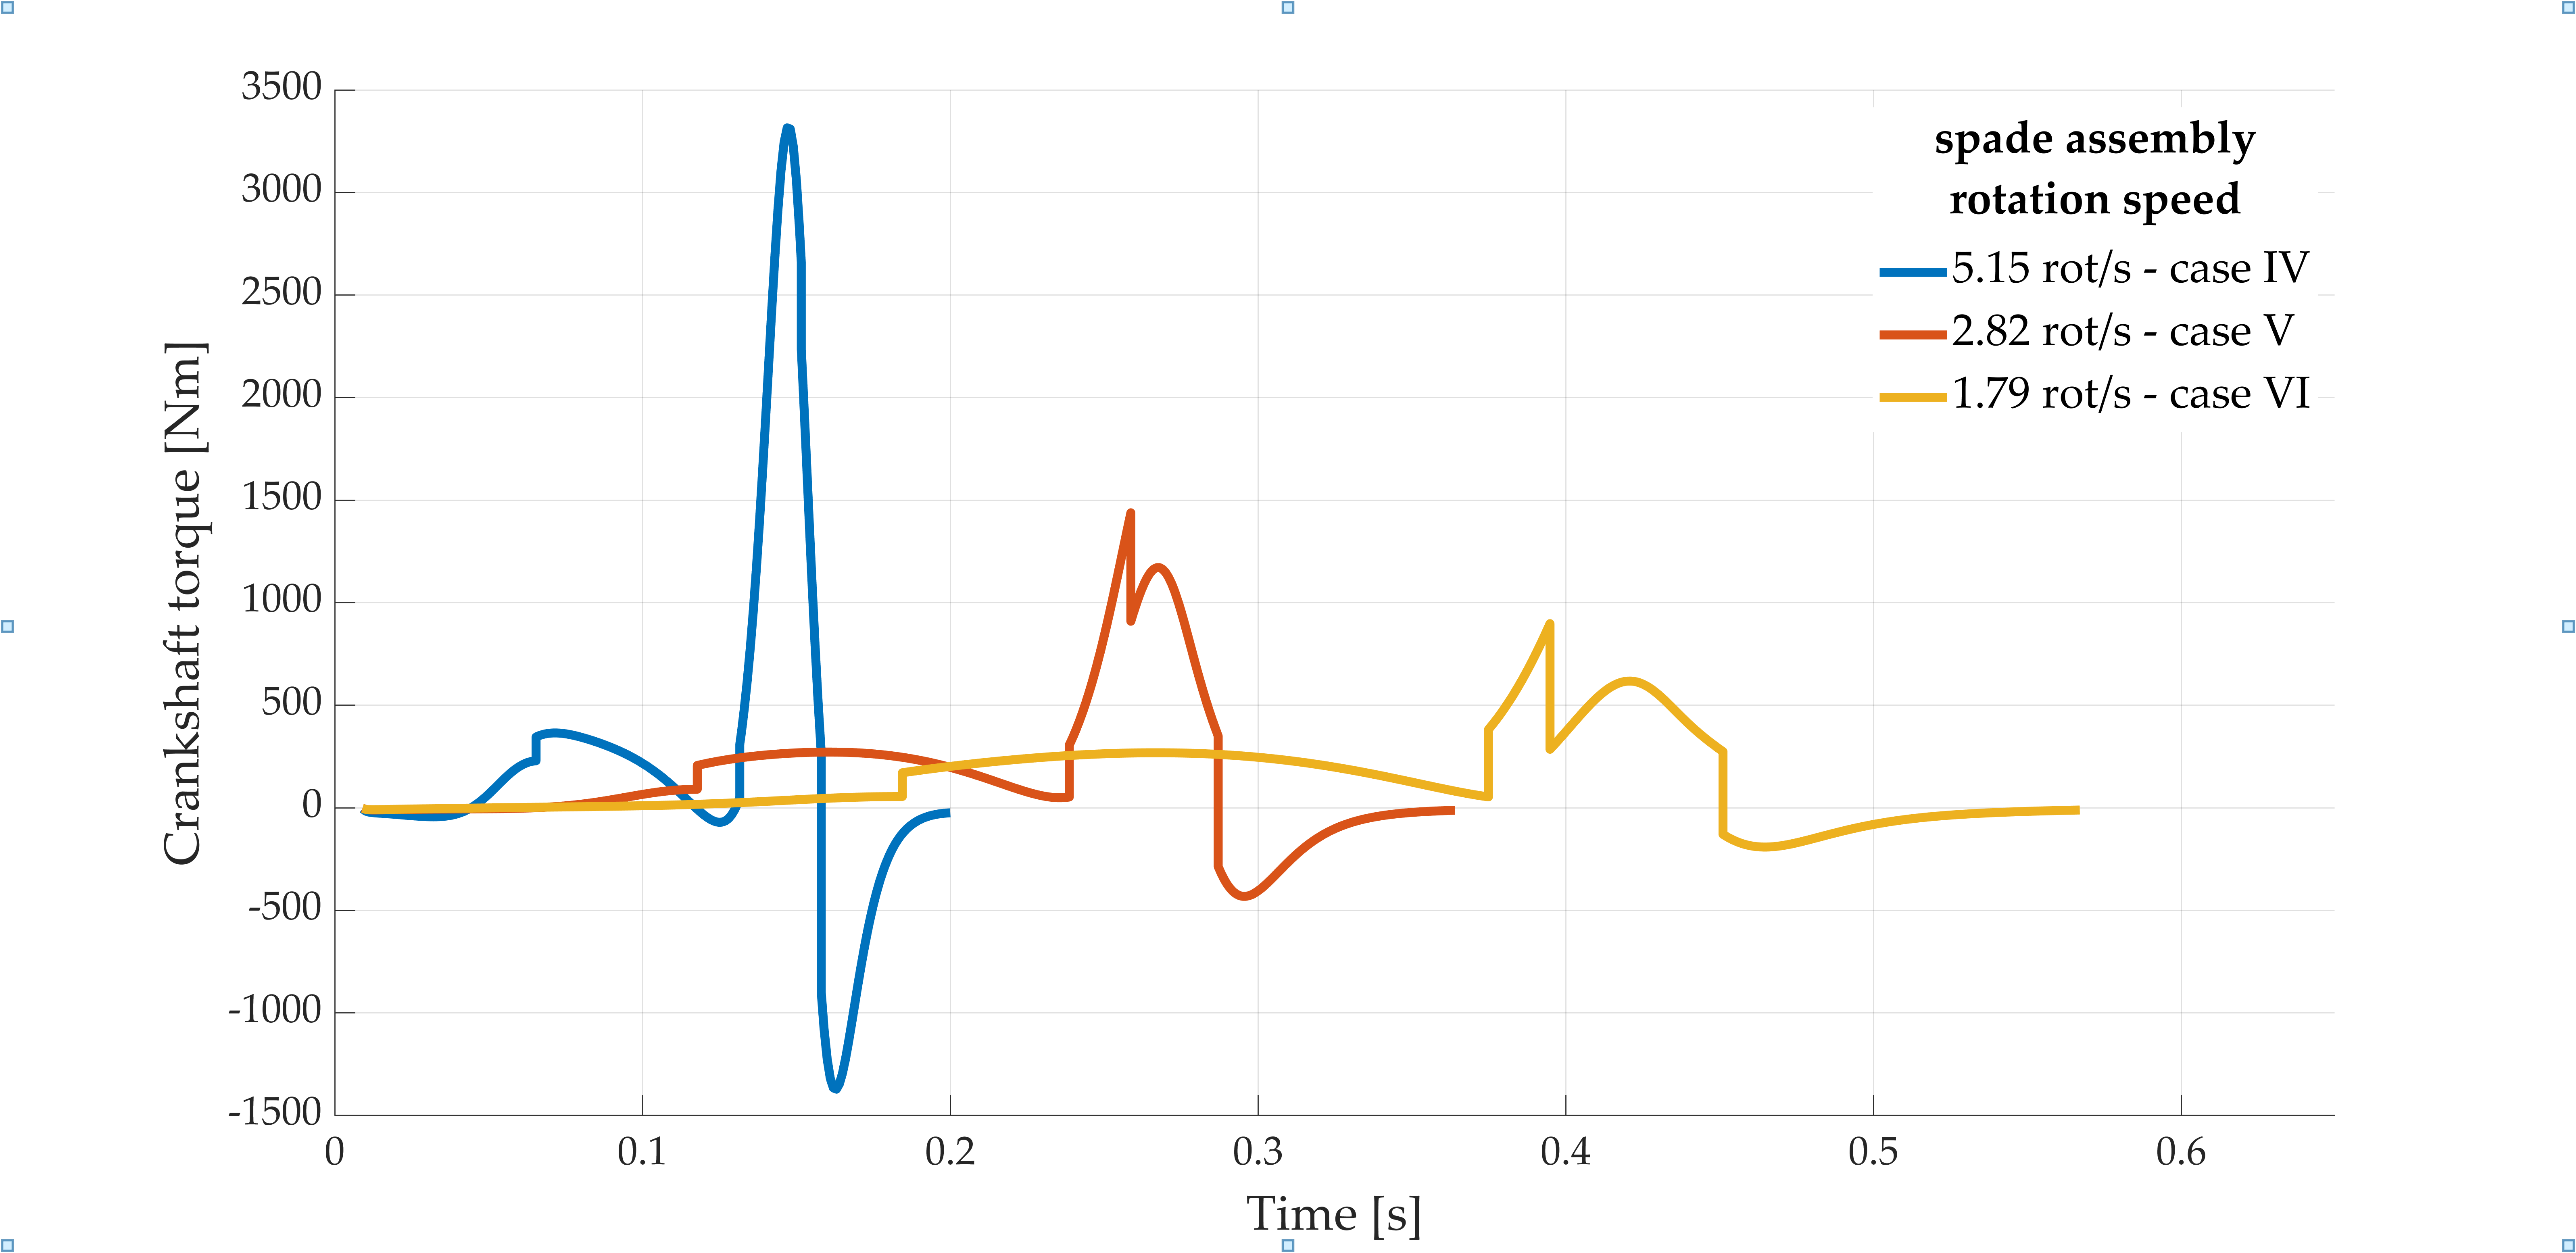
3.4. Combined Effect of the Bit, Shear, and Inertial Forces
As can be seen in
Figure 15, the soil tillage using one spade assembly will result a crankshaft torque by overlapping the loads of the three types of forces.
To prove the correctness of our model, a comparison between the calculated energy values and the measurements from [
8] was made. In this, the energetic need for soil tillage is determined in real conditions: the MSS-140-type spading machine was pulled by U-445-type tractor on loam soil in greenhouse conditions. During the experimental tillage, average advancing speed values were measured, and the associated soil chip thickness was measured. By the results, cases I, V, and IX from
Table 1 may be identified. Using the presented Matlab
® Simulink model, the variation of the crankshaft torque was calculated for the above-mentioned three cases. For the simulation, one further refinement must be made.
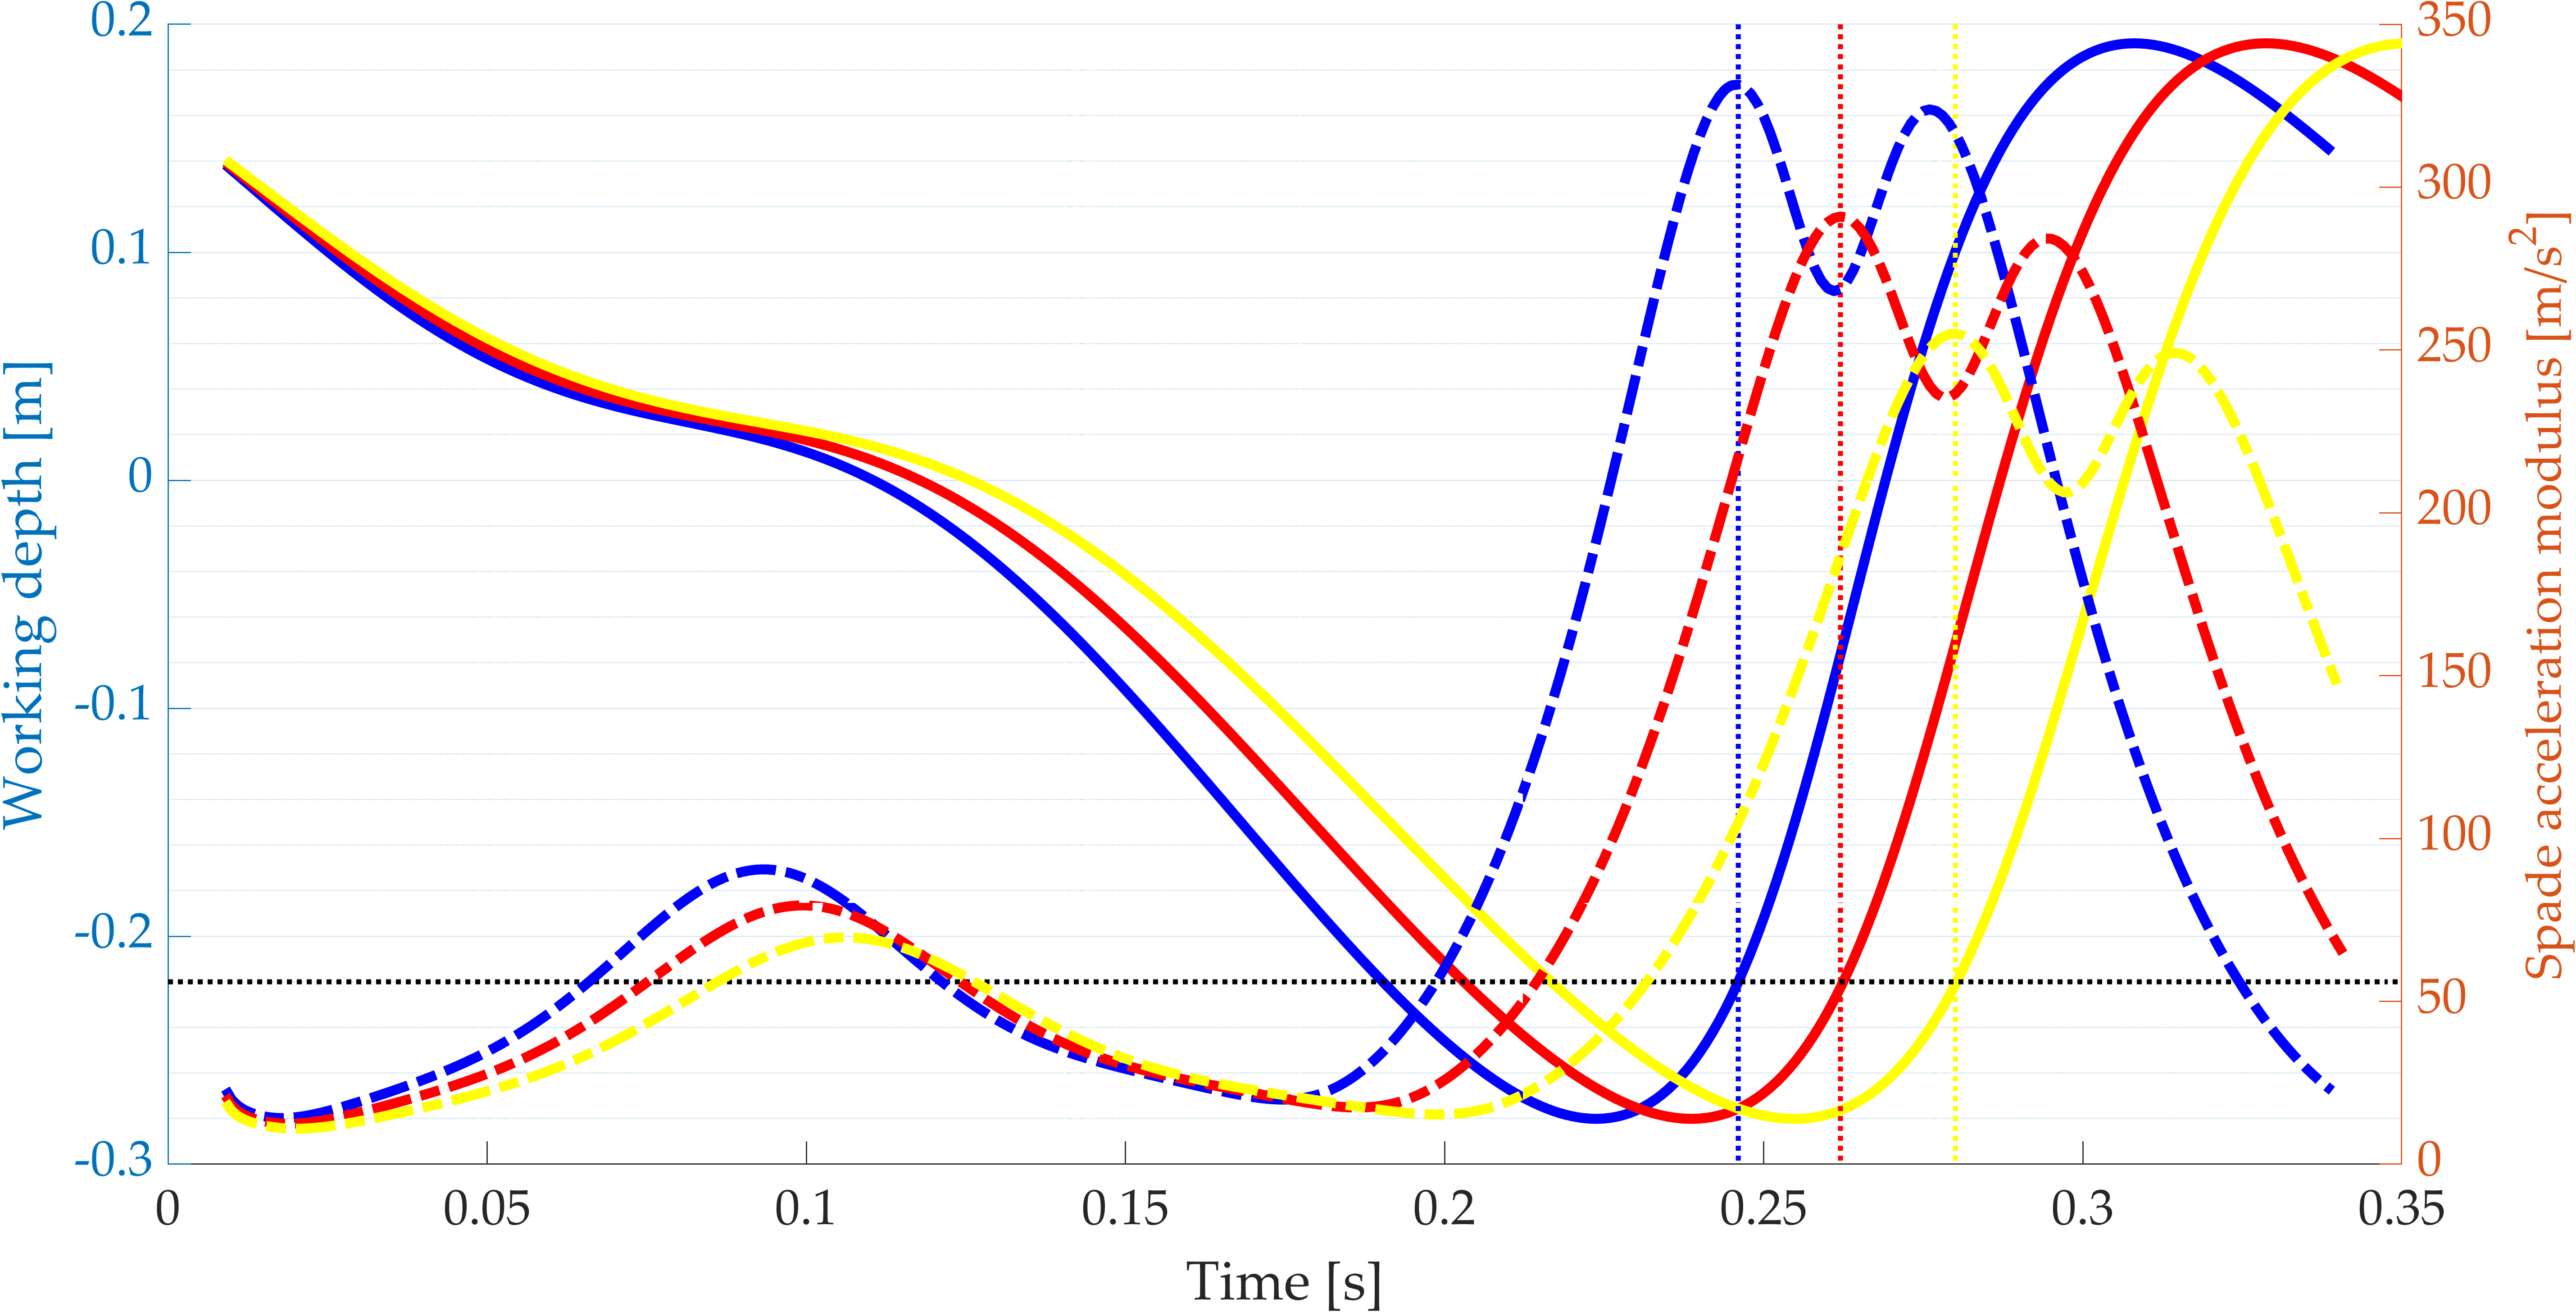
According to
Figure 16, the rear limit (
depth_limit block–
Figure 13) value must be set. The inertial load on the spade is acting from the very first moment of soil displacement (beginning of the soil shear process, at the maximum depth of the spading cycle) until the modulus of the acceleration of the spade decreases. In order to determine this limit point, the acceleration modulus and the variation of the spade-tip vertical displacement is compared in
Figure 16 for three examined cases. As may be observed, regardless of the investigated cases, the acceleration maximum occurs at the depth of 0.22 m, so this value should be used for the rear limit in the
depth_limit block.
3.5. Model Validation
The final goal of our investigation is to compare the energy needs for the soil tillage obtained with the simulation and the energy needs determined with experiments, presented in [
8], for a 15 m soil tillage length. In each of the above presented three cases, the torque variation is calculated during one revolution of the crankshaft, defining the mechanical work for one cycle of soil tillage. Based on the soil chip thickness, the number of the cycles may be determined, which are needed for the 15 m tillage completion. These two computed parameters specified, through their product, the total required mechanical work needed to complete our virtual experiment.
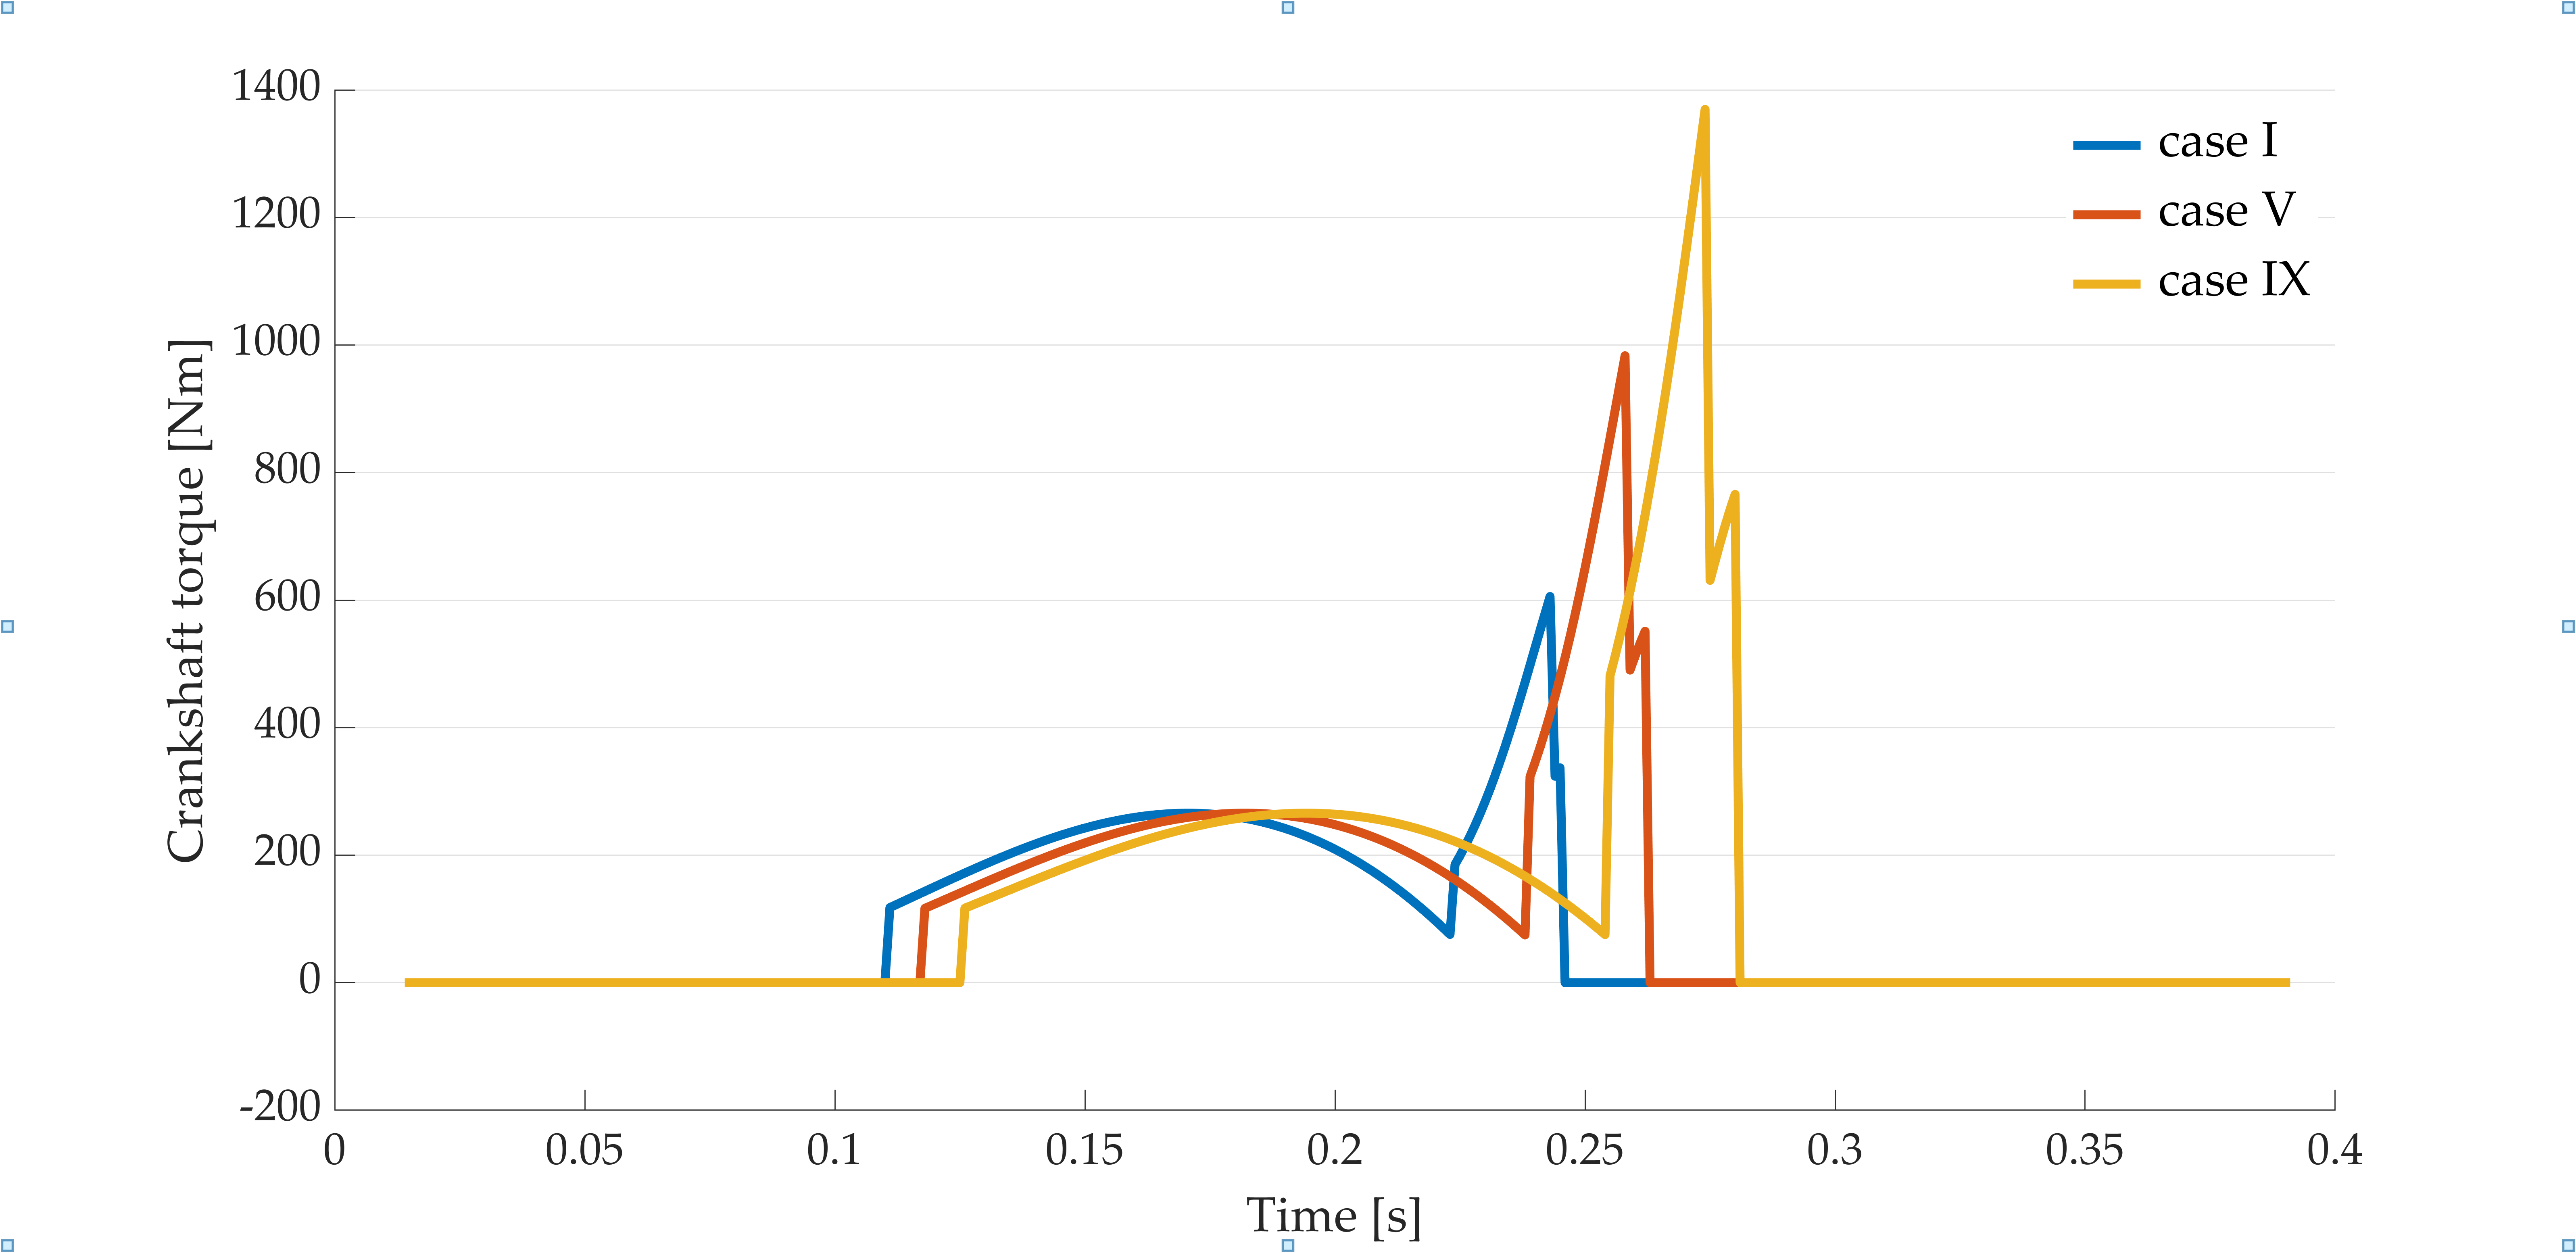
Figure 17 presents the torque values needed for the effective soil tillage process: it is calculated from the torque values obtained by the simulation of cases I, V, and IX (as in
Figure 15 for other cases) and decreased by the torques needed to move the mechanism itself (as in
Figure 7 for other cases) in the three cases. This figure also shows the presence of the three types of loads, as described in the above part of the paper.
Because one cycle represents a rotation of 360° of the crankshaft, the area beneath the curves relative to one rotation, between the [0,2π] interval, determines the mechanical work corresponding to one cycle done by one spade. Taking into account the soil chip thicknesses, the cycle numbers are determined along the 15 m, so the total mechanical work can be calculated. The investigated spading machine is equipped with six spading mechanisms, so the required total amount of mechanical work for the whole tillage is calculated by multiplying the results for a single spade by six. The obtained values are presented in
Table 3.
At this point, the simulation result may be compared with the real experiment result (
Table 4). Based on [
8], the energetic needs were determined taking into account the measured diesel fuel consumption for the tillage processes (
(m
3)), having as parameters the calorific power (
= 41 (MJ/kg)) and the fuel density (
= 820 (kg/m
3)) using the following equation:
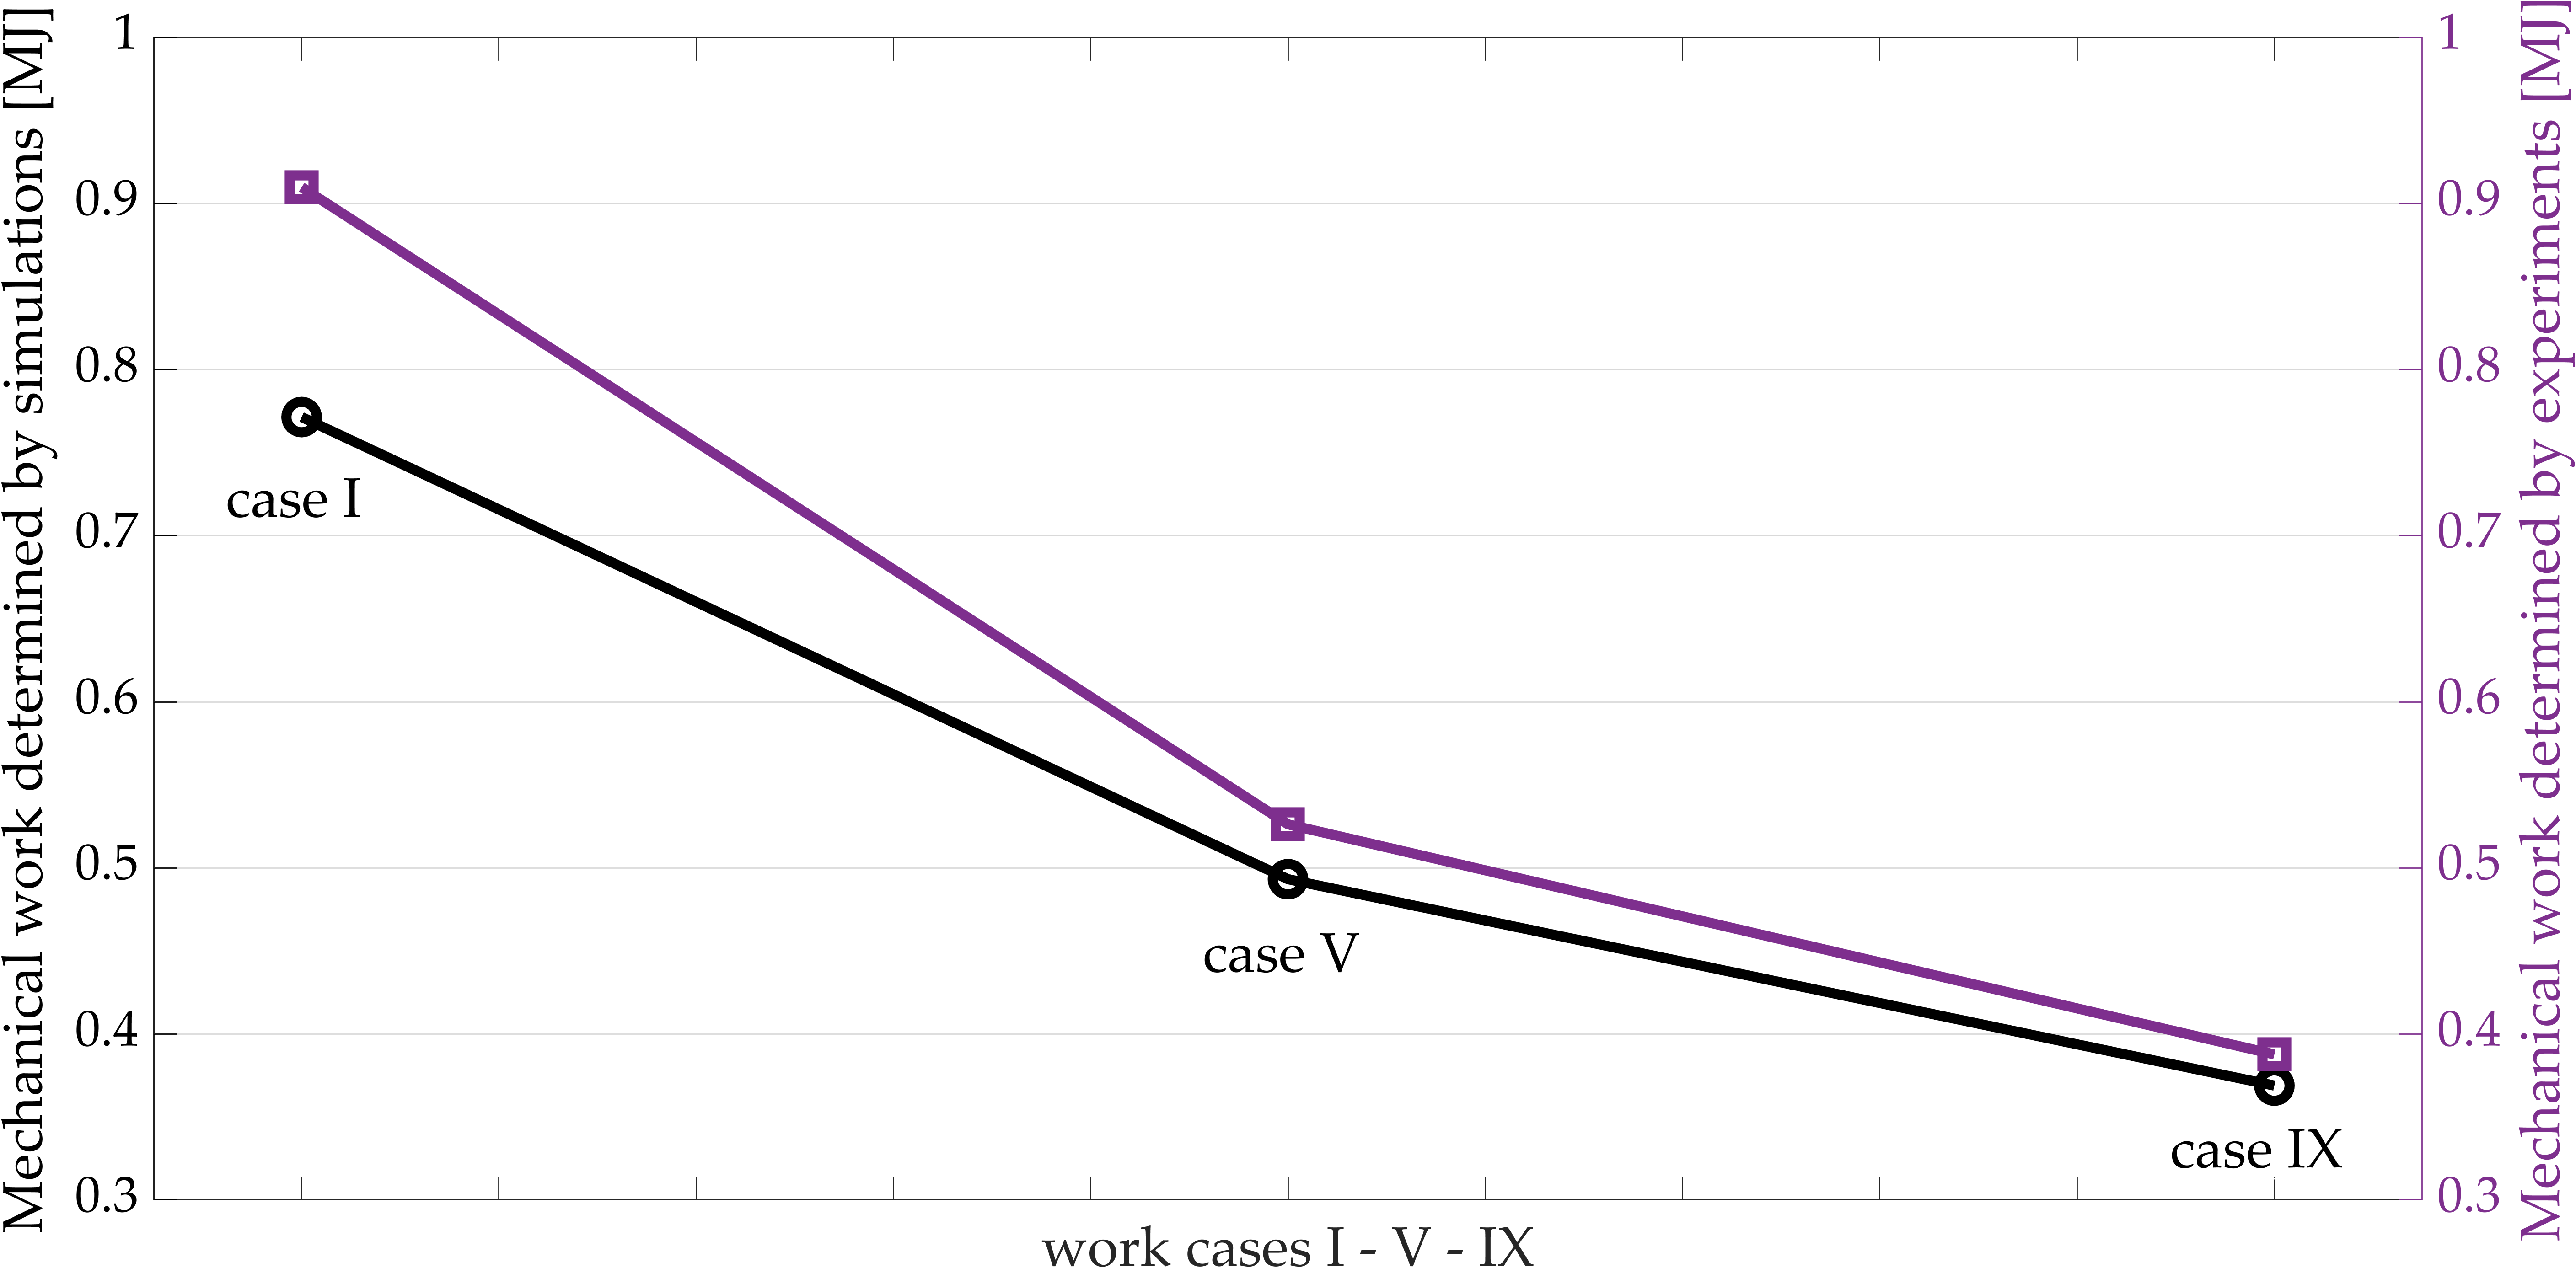
The result from the last columns of
Table 3 and
Table 4 are presented together in
Figure 18 and provide acknowledgment of the correctness of our Matlab
® Simulink model. The numerical comparison is shown in
Table 5.
4. Conclusions
The aim of the present work is to test a new approach to optimize PTO-driven tilling machine operations regarding energy demand. The developed approach was tested in the case of the active tillage machine, the MSS-140-type spading machine. To validate this test, the previously measured fuel consumption of the spading machine was used, obtained in real working conditions.
The presented model calculates the energy requirement for three of the experimental advancing speeds. Those values were compared with the measurement data. The model explains the fuel consumption recorded in previous years: the spading machine has a lower energy requirement at higher speeds. The calculated results are similar to the measured values, the mean difference is 9.91%, and the standard deviation is 3.3%. Differences are considered random mechanical losses.
This new investigation method provides an opportunity for separate monitoring and analysis of loading forces. The model is also suitable for illustrating the dynamics of loads and the difference from idle mode.
The developed methods can be used to estimate the energy demand of a spading machine operating with variable parameters on different soil types. They can be used to optimize the working parameters regarding lower fuel consumption for a required degree of shredding.
The presented examination method can be easily extended to other active tilling machine types. A refinement of the model—a more accurate modelling of the soil chip shear and disclosure processes and forces—will be perfected in the continuation of our work.


