Article

Energy, Exergy, and Environmental (3E) Analysis of Hydrocarbons as Low GWP Alternatives to R134a in Vapor Compression Refrigeration Configurations

by
Morteza Ghanbarpour
1,*,
Adrián Mota-Babiloni
2,
Bassam E. Badran
1 and
Rahmatollah Khodabandeh
1
1
Division of Applied Thermodynamics and Refrigeration, Department of Energy Technology, KTH Royal Institute of Technology, Brinellvägen 68, 100 44 Stockholm, Sweden
2
ISTENER Research Group, Department of Mechanical Engineering and Construction, Universitat Jaume I, Campus de Riu Sec s/n, E12071 Castelló de la Plana, Spain
*
Author to whom correspondence should be addressed.
Appl. Sci. 2021, 11(13), 6226; https://doi.org/10.3390/app11136226
Submission received: 21 May 2021 / Revised: 18 June 2021 / Accepted: 29 June 2021 / Published: 5 July 2021

Abstract

:
The phase-down of hydrofluorocarbons and substitution with low global warming potential values are consequences of the awareness about the environmental impacts of greenhouse gases. This theoretical study evaluated the energy and exergy performances and the environmental impact of three vapor compression system configurations operating with the hydrocarbons R290, R600a, and R1270 as alternatives to R134a. The refrigeration cycle configurations investigated in this study include a single-stage cycle, a cycle equipped with an internal heat exchanger, and a two-stage cycle with vapor injection. According to the results, the alternative hydrocarbon refrigerants could provide comparable system performance to R134a. The analysis results also revealed that using an internal heat exchanger or a flash tank vapor injection could improve the system’s efficiency while decreasing the heating capacity. The most efficient configuration was the two-stage refrigeration cycle with vapor injection, as revealed by the exergy analysis. The environmental impact analysis indicated that the utilization of environmentally-friendly refrigerants and improving the refrigeration system’s efficiency could mitigate equivalent CO2 emissions significantly. The utilization of hydrocarbons reduced the carbon footprint by 50%, while a 1% to 8% reduction could be achieved using the internal heat exchanger and flash tank vapor injection.

1. Introduction

The regulations and legislative acts adopted by the European Union led to the successive phase-out of chlorofluorocarbons (CFCs) and hydrochlorofluorocarbons (HCFCs) and the phase-down of hydrofluorocarbons (HFCs). The F-Gas regulation (EU Regulation No517/2014) aimed to reduce greenhouse gas emissions by 2030, and its focus is on a drastic phase-down of HFCs. Refrigeration technology development made it possible to use some groups of refrigerants, such as hydrofluoroolefins (HFOs) and hydrochlorofluoroolefins (HCFOs), with a much lower global warming potential (GWP) than that of HFCs. In addition to these refrigerants, hydrocarbons have attracted attention as interesting alternatives to HFCs because of their low GWP values [1,2]. In the early twentieth century, hydrocarbons were used as refrigerants in refrigeration systems. Still, nonflammable CFCs replaced them because of the technical and safety concerns related to the use of hydrocarbons at that time. The main drawback of hydrocarbons that limits the use of these refrigerants is their flammability characteristic. To mitigate this problem, a minimal refrigerant charge in a refrigeration system is recommended by experts. Simultaneously, there are safety regulations and precautions that must be met when installing large-volume refrigeration equipment. Containing the hydrocarbon in a sealed system, minimizing the charge of hydrocarbons for a specific application, minimizing the concentration of hydrocarbons in the ambient air (lower than the flammability limit) using a proper ventilation source, and eliminating the source of ignition are some of the main precautionary instructions that must be taken into consideration when using hydrocarbons [3,4,5].
In addition to the very low GWP and zero ozone depletion potential (ODP) values, hydrocarbons have other advantages, such as their low cost, compatibility with mineral and alkyl-benzene oils, and availability [6], as well as excellent thermodynamic and suitable physical and chemical properties. Together, these advantages make hydrocarbons long-term alternatives to heat pumps and refrigeration systems [7].
Many experimental, analytical, and numerical studies have focused on the performance of heat pumps and refrigeration systems when using hydrocarbons as refrigerants [8,9,10,11,12]. These studies examine the use of hydrocarbons in their pure forms or mixed with HFCs or HFOs. The energy performance of a commercial refrigeration system using R290 instead of R22 was studied experimentally by Urchueguia et al. [13]. According to their results, the cooling capacity of the R290 refrigeration unit decreased by 13–20%, while the COP of the unit increased by 1% to 3% compared with R22.
In another study, the performance of a residential air conditioning system was explored by Khalid and Qusay [14]. They investigated the effect of different refrigerants, including R22, R290, R407C, and R410A, on the system’s performance when operating at high condensing temperatures. Their results showed that the highest cooling capacity and power consumption of the system were observed with R410A. By contrast, the lowest power consumption and refrigerant charge were observed when the system operated with R290.
The performance of a reversible water-to-water heat pump when operating with R407C with R290 was investigated by Corberan et al. [15]. Their results indicated that the system’s capacity when using R290 was lower, in the range of 9–13%, compared with the capacity using R407C in the heating mode. By contrast, the COP of the system was higher when using R290. According to the results, a 9% to 15% increase in the heating COP was achieved using R290 instead of R407C.
The energy performance of an automotive air conditioning system using hydrocarbon mixtures composed of R290/R600/R600a was studied experimentally by Wongwises et al. [16], and the results were compared to a case that used R134a. According to their findings, every hydrocarbon mixture ratio resulted in a higher system COP than R134a. Fan et al. [17] developed a mathematical model to evaluate the performance of a modified heat pump system using an R32/R290 mixture for district heating. They employed an internal auto-cascade and an ejector to enhance the performance of the system. Their theoretical study revealed that their modified system had a 9–19% higher COP and a 12–37% higher volumetric heating capacity than conventional heat pumps operated under the same condenser outlet temperature. Ju et al. [18] conducted experimental and theoretical studies to investigate the influence of the R744/R290 blend on the performance of a heat pump water heater with a large heat sink temperature lift. They found that both the COP and heating capacity increased when using the blend R744/R290 with the mass fraction of 12/88% compared with a case that used R22.
According to the literature, the simultaneous use of energy and exergy analysis provides valuable information about the performance of the refrigeration systems and the sources and amounts of exergy losses [19,20,21]. Exergy analysis can identify the design modification required to improve the system’s performance, as it can reveal the relationship between losses of different components of the system. In addition to the refrigeration system’s performance, the system’s environmental impact must be investigated, as the contribution of refrigeration systems to climate change is currently increasing. Total equivalent warming impact (TEWI) is a useful metric to facilitate the decision-making process when choosing a refrigerant with a low GWP [22].
In this study, three different configurations for the refrigeration system were investigated and compared. These configurations include a single-stage cycle, a single-stage cycle equipped with an internal heat exchanger, and a two-stage cycle with vapor injection. Hydrocarbons with suitable critical temperatures, R290, R600a, and R1270, were investigated as low GWP alternative fluids to R134a. This article aims to better understand the refrigeration system’s performance with different configurations using hydrocarbon refrigerants by the simultaneous employment of energy, exergy, and environmental (3E) analyses. It helps to theoretically identify ways to improve the performance of the refrigeration system by modifying the design of the system and properly selecting low GWP refrigerants. The cycle configuration and refrigerant impact on direct and indirect CO2-eq (CO2 equivalent) emissions were studied comprehensively. The results will be helpful to examine the possibility of employing hydrocarbons as a replacement for R134a. The intention of this study is to investigate solutions to mitigate the global warming impact of the refrigeration system while retaining efficient exergy and energy performances.

2. Materials and Methods

2.1. Refrigerants under Consideration

Hydrocarbons as natural refrigerants attract attention due to their comparable critical temperature with common HFCs such as R134a. In this study, R290, R600a, and R1270 were chosen as hydrocarbon refrigerants, while R134a was selected as the reference HFC refrigerant. Table 1 provides a general overview of the relevant characteristics of these refrigerants. The selected hydrocarbons have an ODP of zero, a very low GWP, and good thermodynamic properties, making them ideal candidates for various refrigeration applications. The latent heat of the selected hydrocarbons is higher than that of the reference refrigerant, R134a, which indicates that the refrigerant charge amount can be reduced in the systems operating with hydrocarbons compared with R134a. The properties of refrigerants in Table 1 and the rest of the work have been extracted from REFPROP v10 [23].
The compatibility of hydrocarbons with most of the lubricants used in refrigeration, heat pump systems, and most elastomer and plastic materials used as valve seats, gaskets, and “O” rings is another attractive characteristic of hydrocarbons.

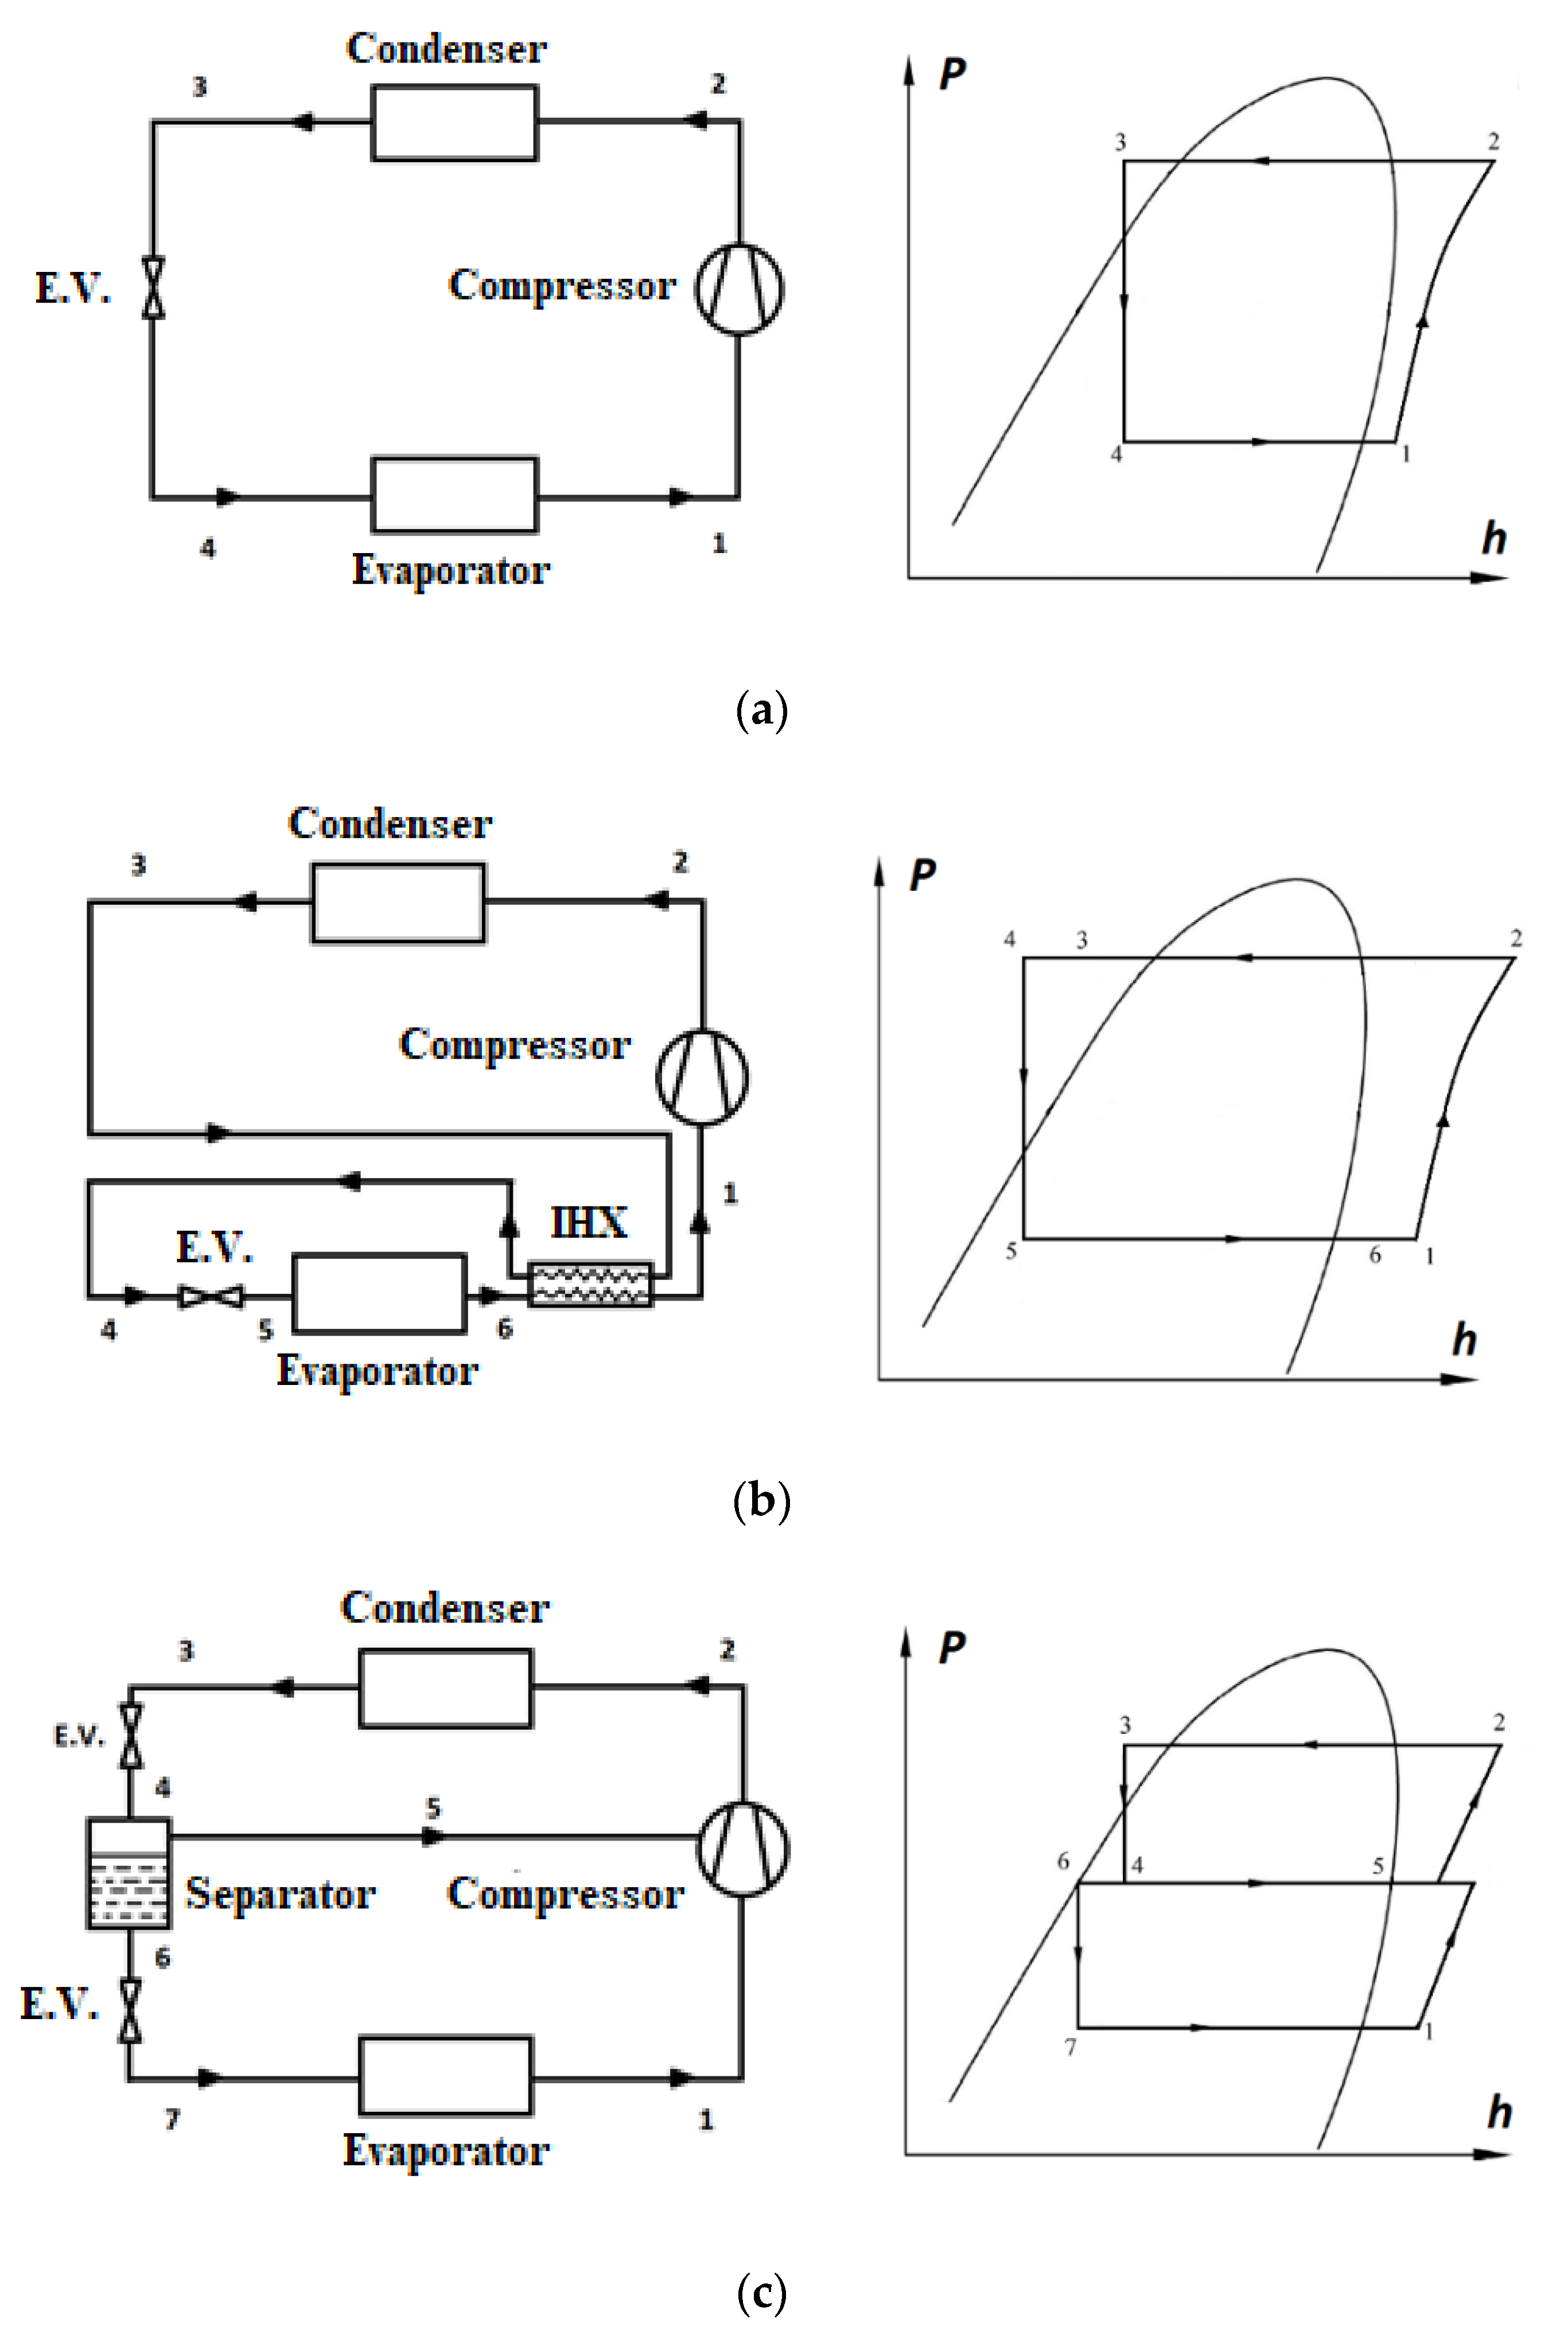
2.2. System Configurations

In this study, three configurations for refrigeration cycles were chosen and investigated. A single-stage cycle (SS) comprising the compressor, condenser, expansion valve, and evaporator was considered a reference, and the performance of the other configurations was compared with this cycle. The second configuration was a single-stage cycle with an internal heat exchanger (IHX). In this configuration, a heat exchanger is added between the suction line and the liquid line to reduce the liquid temperature before the expansion valve, employing transferred heat from the liquid line to the suction line. Finally, the third configuration was a two-stage refrigeration cycle with a flash tank vapor injection (ECO). It is noted that there are other advanced configurations for the vapor compression system that improve the performance of the system. In this study, the single-stage cycle with an IHX was studied as an excellent design to ensure dry compression and improve system performance. The ECO cycle design, which includes a flash tank to inject saturated vapor instead of superheated vapor, is another promising configuration to improve the performance compared with a single-stage vapor compression cycle. The schematic and P-h diagram of these configurations are presented in Figure 1.

2.3. Theoretical Model

According to the law of conservation of mass and the energy balance, the following equations were derived. The total refrigerant mass flow rate for SS and IHX configurations was calculated as shown in Equation (1) [24].
m ˙ r e f = Q ˙ c h e v a p , o u t h e v a p , i n
where Q ˙ c is the cooling capacity, and h e v a p , o u t   and   h e v a p , i n are the enthalpy at the inlet and outlet of the evaporator. For the third configuration with vapor injection and ECO, mass balance gives the following equations:
h 3 m ˙ r e f = h 6 ( m ˙ r e f m ˙ 5 ) + h 5 m ˙ 5
m ˙ 5 = m ˙ r e f ( h 3 h 6 ) ( h 5 h 6 )
The subscript numbers in all equations are referenced from the notation in the configurations shown in Figure 1. The heating capacity in all configurations is shown in Equation (4).
Q ˙ h = m ˙ r e f ( h 3 h 2 )
The effectiveness of the IHX cycle was defined as shown in Equation (5) [24]
ε I H X = T c o l d , o u t T c o l d , i n T h o t , i n T c o l d , i n = T 1 T 6 T 3 T 6
and Equation (6).
m ˙ 3 h 3 + m ˙ 6 h 6 = m ˙ 4 h 4 + m ˙ 1 h 1
W ˙ c o m p is the power consumption of the system and was calculated for the SS and IHX cycles as shown in Equation (7) [24].
W ˙ c o m p = m ˙ r e f Δ h i s , c o m p η i s
where η i s is isentropic efficiency, and Δ h i s , c o m p is isentropic enthalpy difference. For the ECO cycle, the compressor work depends on the refrigerant mass flow rates m ˙ 1 and m ˙ 5 and the changes of the enthalpies in the two lines and can be written as shown in Equation (8) [25]:
W ˙ c o m p = m ˙ 1 ( h 1 , i s h 1 ) η i s + m ˙ 2 ( h 2 , i s h 1 ) η i s
where h 1 , i s and h 2 , i s are the specific enthalpies of refrigerant vapor at the end of the first and second compression processes under the isentropic compression processes, and h 1 and h 1 are the specific enthalpies of refrigerant fluids at the compressor inlet and the beginning of the second compression process. Finally, the COP of the heating mode was calculated using Equation (9).
C O P h = Q ˙ h W ˙ c o m p
The total and specific exergy of a fluid were calculated using Equations (10) and (11), respectively [26]:
E x = m ˙ r e f e x
e x = ( h h o ) T o ( s s o )
where h is specific enthalpy, s is the specific entropy, and ho, so, and To are the enthalpy, entropy, and temperature at the dead (reference) state, respectively. The reference temperature was fixed at zero degrees. This study presents exergy parameters as relative deviations, so a change in reference temperature does not significantly influence the presented results. The exergy destruction for the compressor of the SS and IHX configurations can be calculated as shown in Equation (12).
E x d e s , c o m p = W ˙ c o m p + m ˙ r e f ( e x 1 e x 2 ) = W ˙ c o m p m ˙ r e f [ ( h 2 h 1 ) T o ( s 2 s 1 ) ]
The exergy destruction for the compressor of the ECO configuration was calculated as shown in Equation (13).
  E x d e s , c o m p = W ˙ c o m p + m ˙ 1 [ ( h 1 h o ) T o ( s 1 s o ) ] m ˙ 2 [ ( h 2 h o ) T o ( s 2 s o ) ] + m ˙ 5 [ ( h 5 h o ) T o ( s 5 s o ) ]
where m ˙ 1 , m ˙ 2 , and m ˙ 5 are the refrigerant mass flow rate passing the evaporator, the flash tank vapor injection, and the condenser (total mass flow rate), respectively. The exergy destruction of the condenser was calculated using Equation (14) [27].
E x d e s , c o n d = m ˙ r e f [ ( h 2 h 3 ) T o ( s 2 s 3 ) ] Q ˙ h T ¯ H T O T ¯ H
where Q h ˙ and T ¯ H are the heating capacity and the entropy-averaged temperatures of the secondary fluid at the condenser, respectively [25]. Equation (15) can be employed to calculate the exergy destruction of the evaporator [27]:
E x d e s , c o n d = Q ˙ c T ¯ C T O T ¯ C + m i ˙ [ ( h 1 h i ) T o ( s 1 s i ) ]
where Q c ˙ and T ¯ C are the cooling capacity and the entropy-averaged temperatures of the secondary fluid in the evaporator, respectively [27]. The subscript i in this equation is the evaporator’s inlet point, which would be points 4, 5, and 7 for the SS, IHX, and ECO configurations, respectively. It is noted that m i ˙ is the mass flow rate passing the evaporator, which is equal to the total refrigerant mass flow rate for the SS and IHX configurations. By contrast, it is smaller for the ECO configuration than for the refrigerant’s total mass flow rate, as one portion of the refrigerant goes directly to the compressor from the vapor injection line. The entropy averaged temperatures can be calculated using Equations (16) and (17) [27].
T ¯ H = T s f   c o n d , o u t T s f   c o n d , i n l n ( T s f   c o n d , o u t / T s f   c o n d , i n )
T ¯ C = T H S   e v a p , i n T H S   e v a p , o u t l n ( T H S   e v a p , i n / T H S   e v a p , o u t )
The exergy destruction at the expansion valve is:
E x d e s , E V = m i ˙   T o ( s E V , o u t s E V , i n )
where s E V , i n and s E V , o u t are the entropy at the inlet and outlet of the expansion valve in different configurations, and m i ˙ is the refrigerant mass flow rate passing each expansion valve. The exergy destruction of the internal heat exchanger in the second configuration (IHX) was calculated as shown in Equation (19) [27].
E x d e s , I H X = m ˙ r e f [ ( h 3 h 4 ) ( h 1 h 6 ) ] T o [ ( s 3 s 4 ) ( s 1 s 6 ) ]
The exergy destruction of the flash tank is shown in Equation (20).
E x d e s , E C O = m ˙ 7 [ ( h 7 h o ) T o ( s 7 s o ) ] m ˙ 8 [ ( h 8 h o ) T o ( s 8 s o ) ] m ˙ 9 [ ( h 9 h o ) T o ( s 9 s o ) ]
The total exergy efficiency of the refrigeration system was calculated as shown in Equation (21) [27].
η = 1 E x d e s ,   t o t a l W ˙ c o m p
where E x d e s ,   t o t a l is the total exergy destruction of the system. Another parameter that takes into account the contribution of each component of the system is relative irreversibility (RI) and can be defined for the component i using Equation (22) [26]:
R I i = E x d e s ,   i E x d e s ,   t o t a l
Relative irreversibility provides valuable information about the potential for improvement regardless of the exergy efficiency. A component with a higher RI has greater potential to improve.
TEWI is employed to measure the global warming impact of a cooling/heating sector. This environmental metric incorporates direct and indirect greenhouse gas emissions from a refrigeration system and can be defined as shown in Equation (23) [28]:
T E W I = G W P · L · n + [ G W P · m · ( 1 α r e c o v e r y ) ] + n · E a n n u a l · β
where L, n, m, α r e c o v e r y , E a n n u a l , and β are the leakage rate (kg per year), the system’s lifetime (year), the optimal refrigerant charge (kg), the recovery factor at the end of life, annual energy consumption (kWh per year), and the carbon emission factor (kgCO2-eq kWh−1) related to electricity generation, respectively.

3. Results and Discussion

In this study, the performances of refrigeration systems with different configurations and refrigerants were simulated. The secondary fluid’s heat source inlet and heat sink outlet temperatures were selected to be fixed at 5 to 45 °C. The isentropic and volumetric refrigeration system efficiencies were kept at 70% and 90%, respectively. The cooling capacity was assumed to be 10 kW in all cases, and the superheat and subcooling degrees were kept at 5 and 2 °C, respectively.

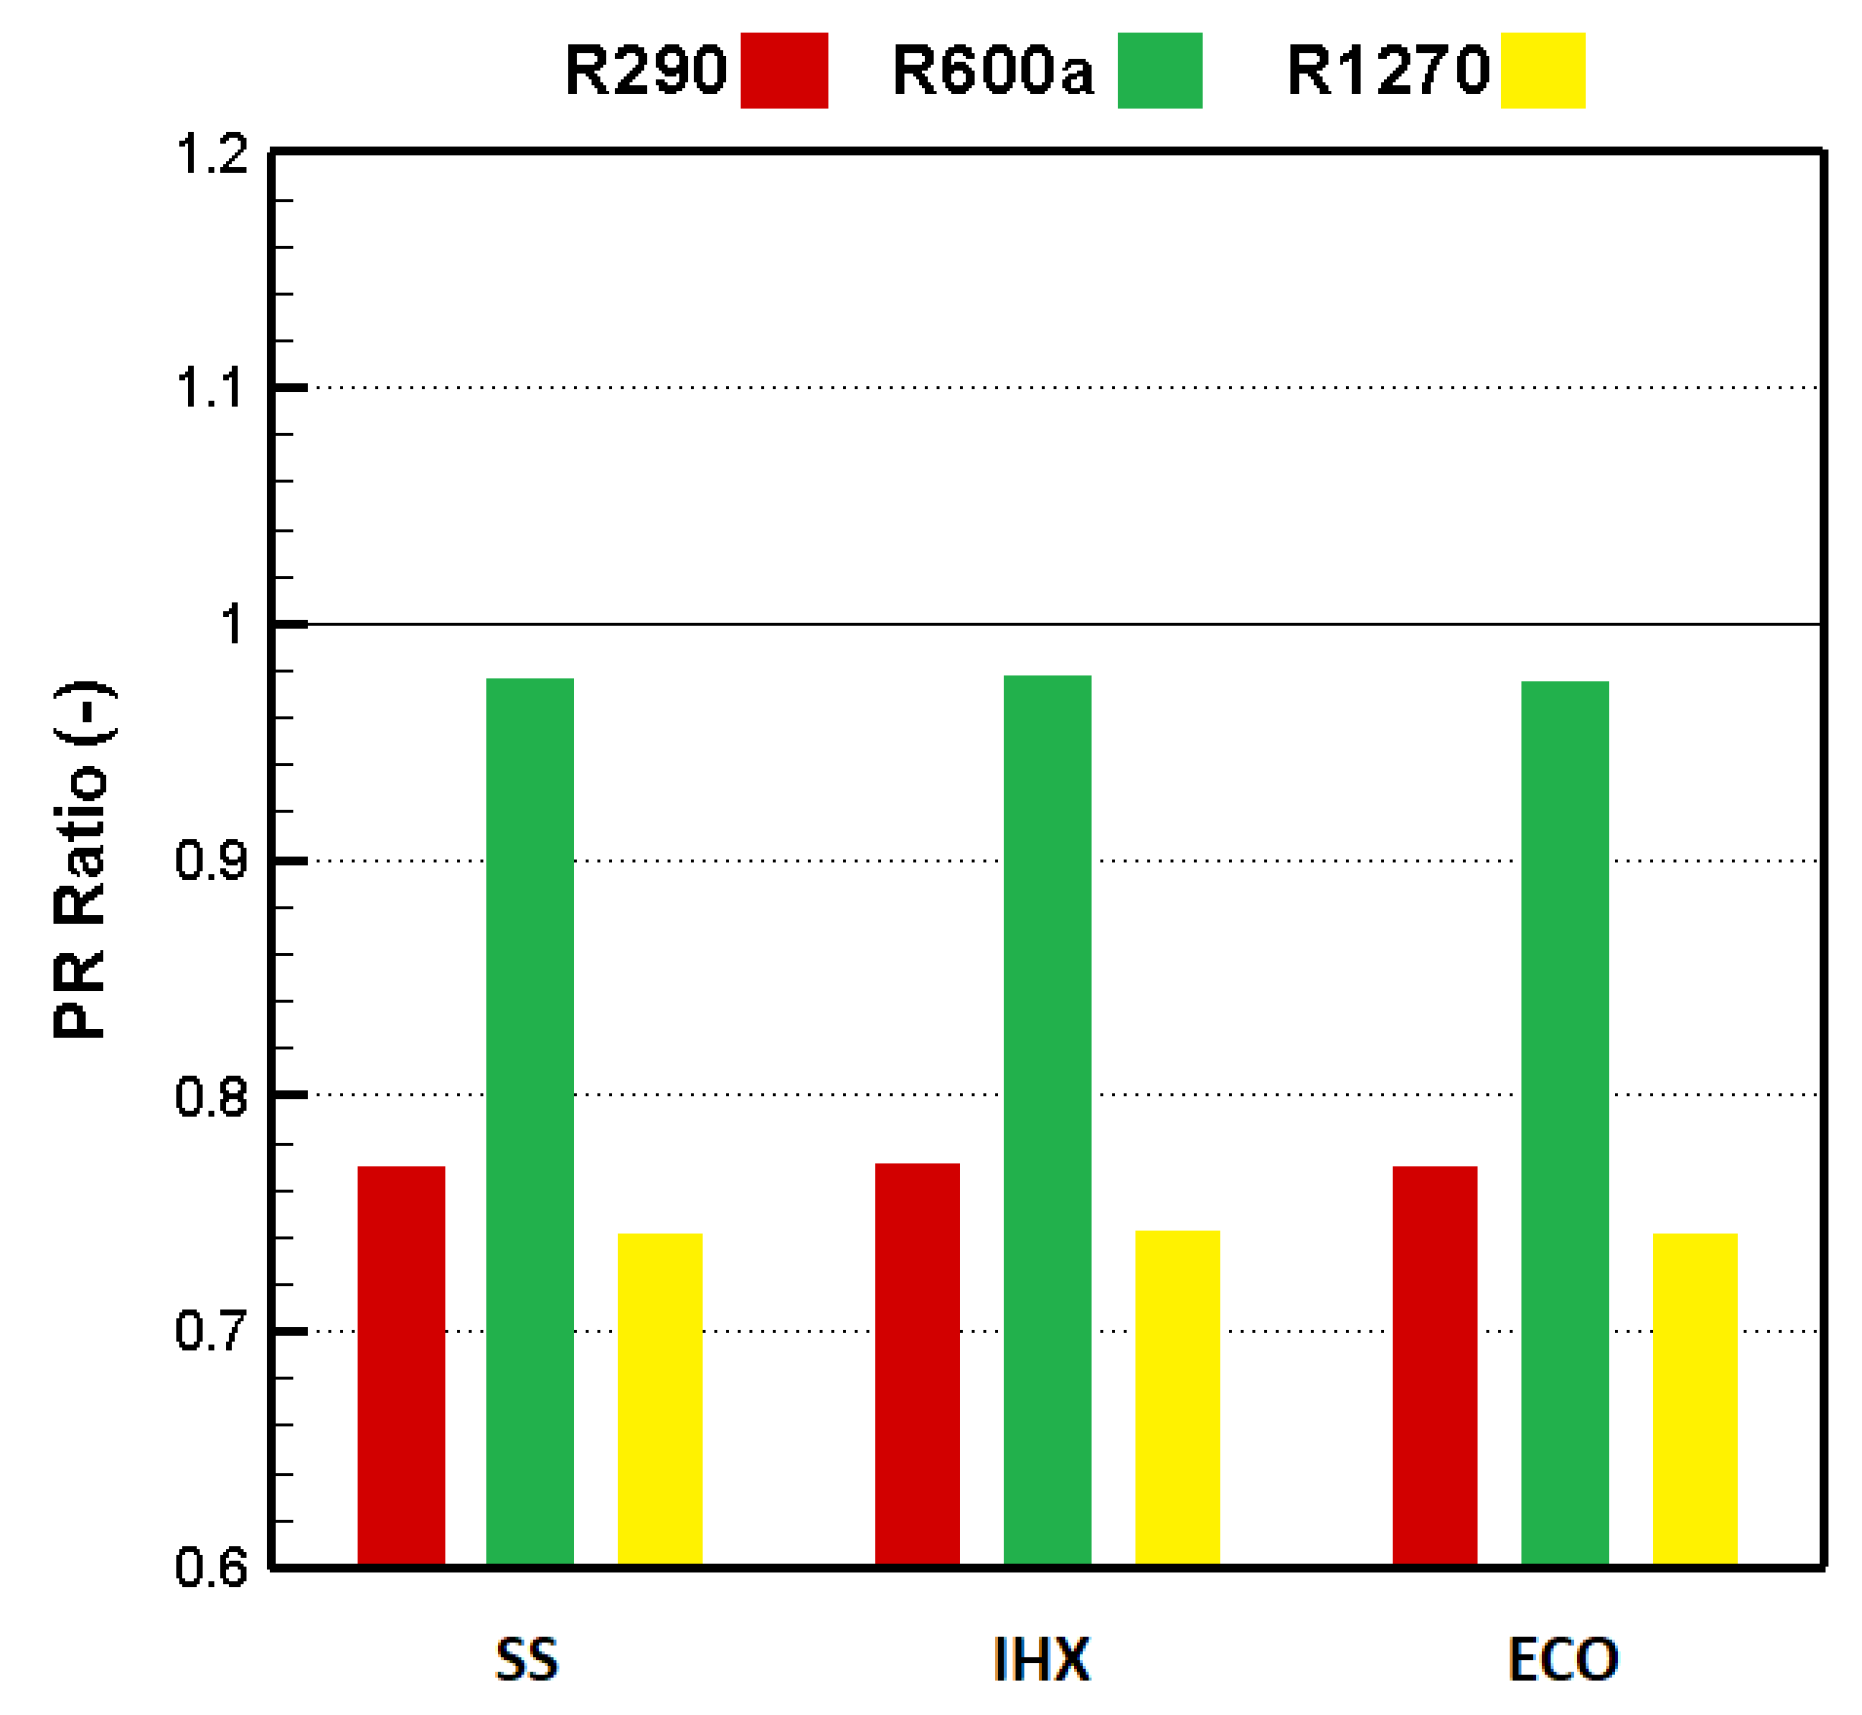
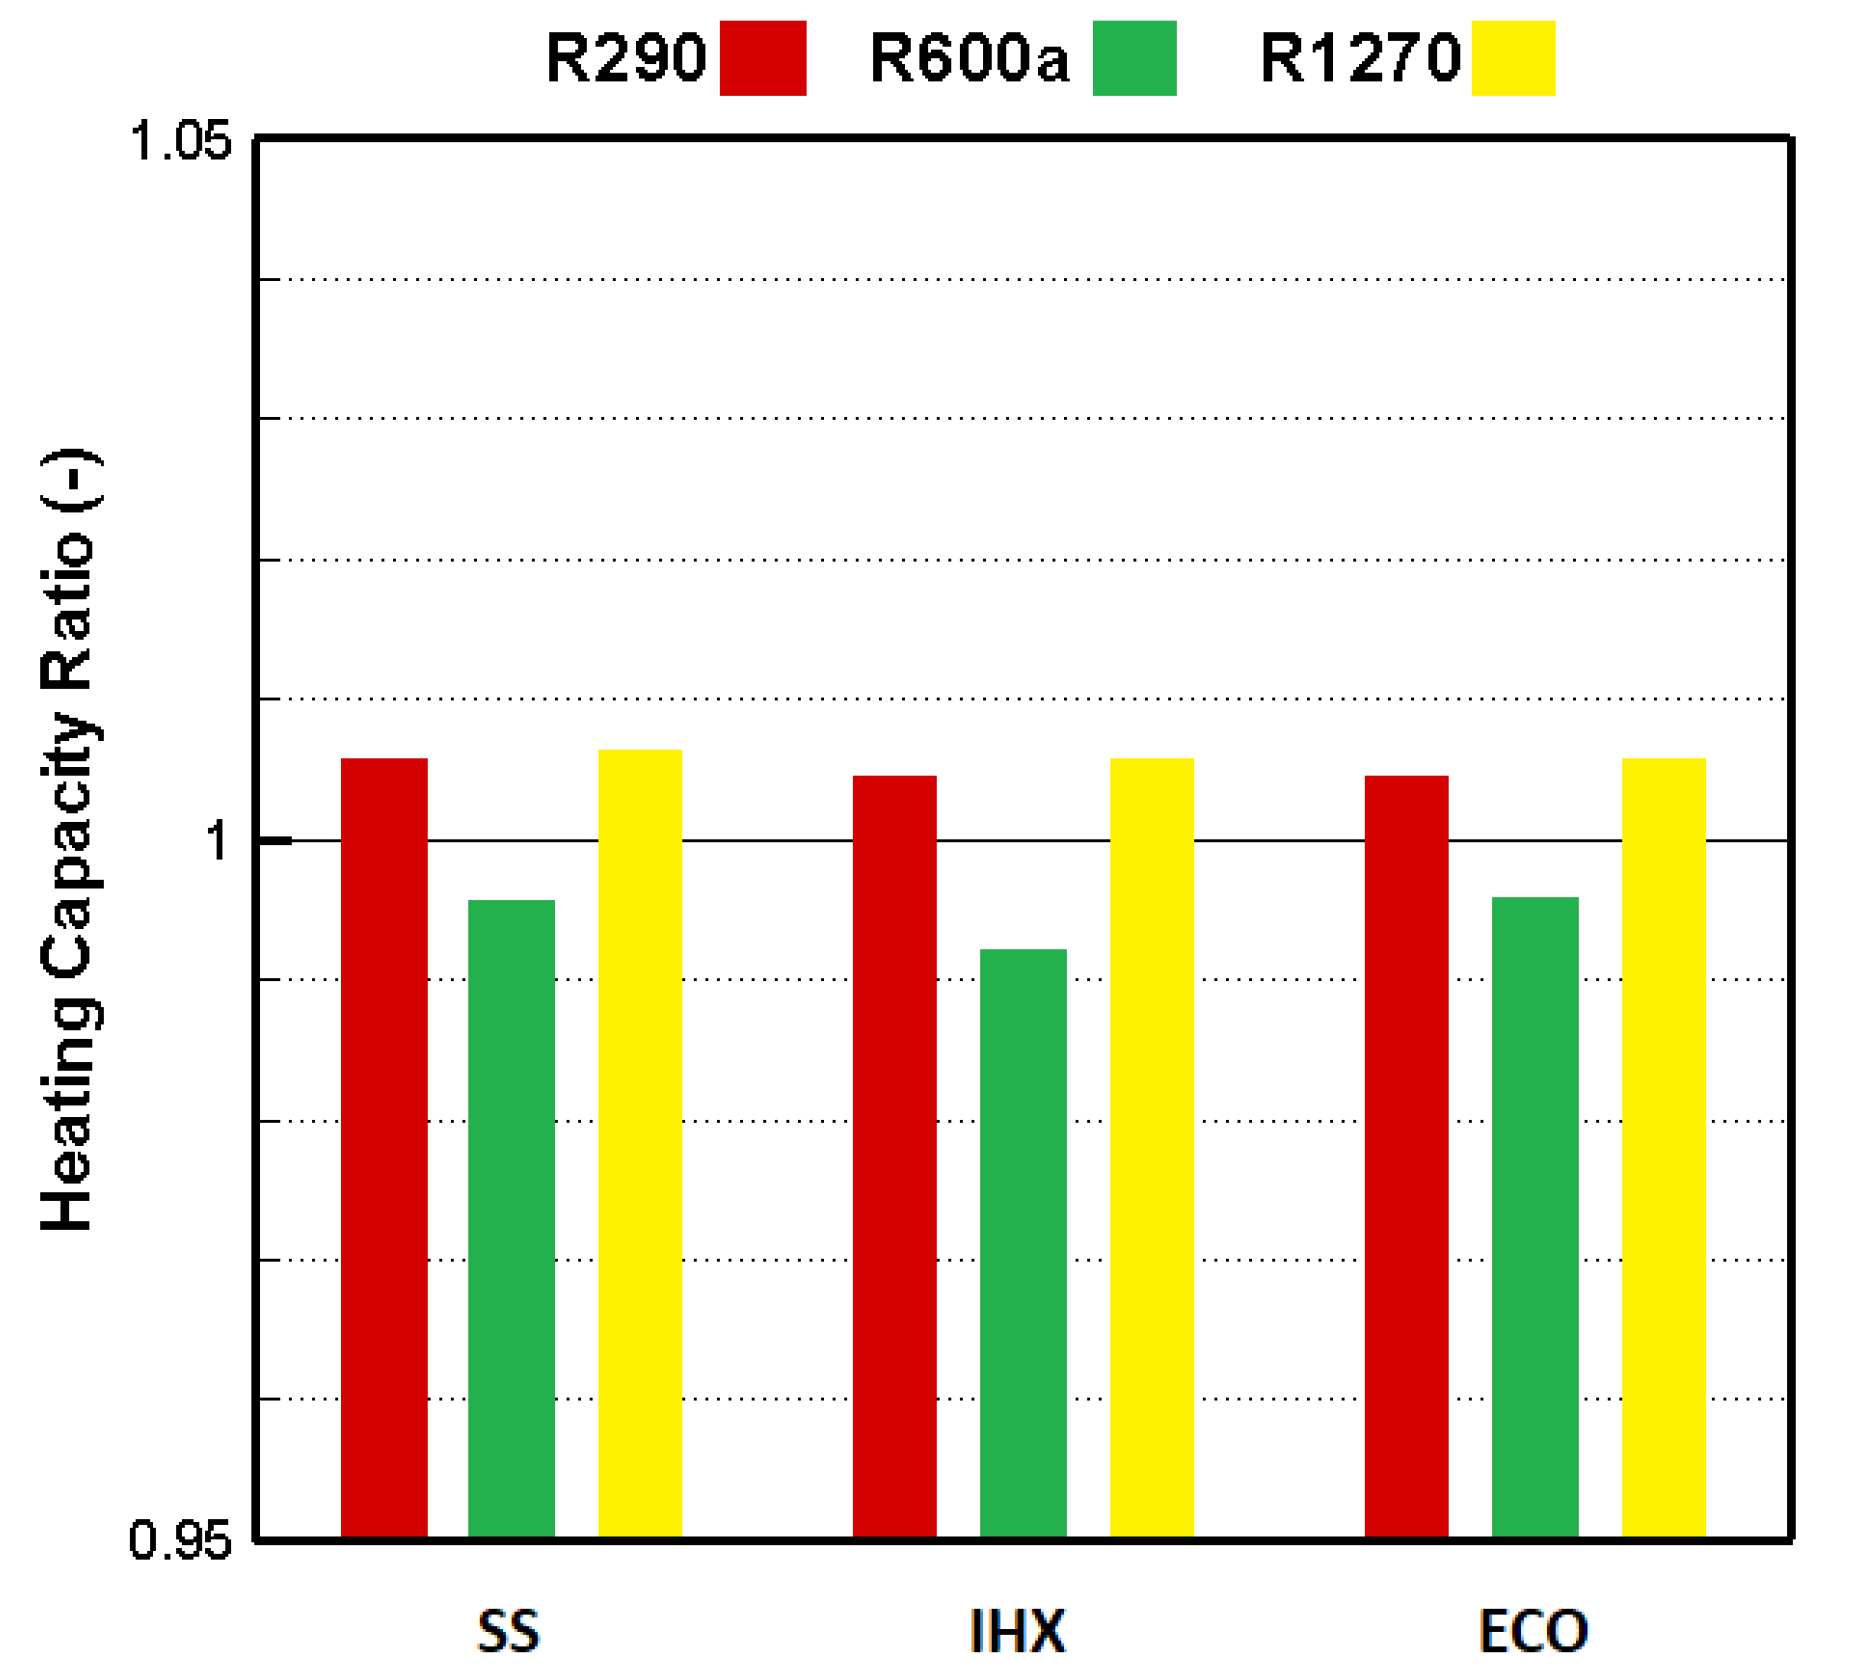
3.1. Energy Analysis

The relative mass flow rate of the refrigerants is presented in Figure 2. According to the results, all selected hydrocarbons had a lower mass flow rate than R134a. The mass flow rates of selected hydrocarbons were 44% to 49% lower than that of R134a. When the cooling capacity is fixed (10 kW in this study), a higher value of latent heat of vaporization lowers mass flow rates [29]. As presented in Table 1, the latent heat of vaporization of R134a was much lower than that for the hydrocarbons, and consequently, R134a exhibited a larger mass flow rate than the selected hydrocarbons.
To investigate whether the selected hydrocarbons could work with the existing compressor as possible drop-in replacements for R134a, the suction volumetric flow should be taken into account. Although the suction volumetric flow is proportional to the mass flow rate, it is also inversely proportional to the suction density of the refrigerant. From Table 1, it is apparent that the density of hydrocarbons is lower than the R134a. So, taking into account the mass flow rate and suction density values of the hydrocarbons simultaneously, it was observed that the densities of R290 and R1270 were lower than that of R134a by almost the same proportion as the mass flow rate. This means that the compressor size for operation with R290 and R1270 cannot be reduced compared with operation with R134a. The ratio between the mass flow rate and suction density for R600a was much lower than that for R134a. Still, this discrepancy could negatively influence heating and cooling capacities when reducing the R600a compressor size because the capacity is proportional to the mass flow rate.
The compressor discharge temperature for different configurations and refrigerants is shown in Table 2. Compared with R134a as baseline refrigerant, it was found that R1270 had a higher discharge temperature, but R290 and R600a had lower discharge temperatures than R134a. These results suggest that a safe substitution of R290 and R600a for R134a is possible, and a lower discharge temperature of R290 and R600a could increase the longevity of the compressor and reduce oil aging. R1270 exhibited approximately a 2% higher discharge temperature than R134a in the tested operating temperature, which must be considered when choosing this refrigerant as an alternative to R134a. It was also revealed that the IHX had a significant influence on discharge temperature. The discharge temperature increased dramatically (between 19% and 25%) with the IHX, but utilizing vapor injection decreased the discharge temperature by approximately 3.8%. It is interesting to note that R600a had the lowest discharge temperature compared with the other tested refrigerants. Using the IHX had the worst influence on this refrigerant, as approximately a 25% increase in discharge temperature was observed when using the IHX single-stage cycle with R600a. Considering the effect of both the refrigerant and configuration, it can be concluded that the IHX configuration when using R1270 is not suitable to supply a high heat sink temperature, as the discharge temperature was relatively high in this case.
Figure 3 and Figure 4 represent the relative compressor power consumption and compression pressure ratios, respectively. The compressor’s power consumption when using R1270 and R290 was higher than that when using R134a by approximately 1.5% to 2%, whereas it was lower when using R600a as an alternative refrigerant. According to the results, all hydrocarbons had a lower pressure ratio than R134a.
The relative heating capacities of the refrigeration systems with different configurations and refrigerants are presented in Figure 5. The latent heat of condensation and the mass flow rate affect the heating capacity [29]. R1270 and R290 had higher heating capacities than R134a, as they had a much greater latent heat of condensation, but R600a had a lower heating capacity than R134a. Although R134a had a lower latent heat of condensation than R600a, this could be compensated with the much higher mass flow rate of R134a than that of R600a. Hence, the heating capacity of R134a was found to be higher than R600a. As it is not desired to obtain lower heating capacity in many applications using a low GWP alternative refrigerant to HFCs, this problem could be solved by appropriating the equipment, e.g., the compressor.
Figure 6 shows the relative coefficients of performance of the systems with different configurations and refrigerants. According to the results, the heating COP of the system when operating with R600a was higher than that using other refrigerants. This can be explained by its lower power consumption compared with other refrigerants, although it had the lowest heating capacity. The increase in power consumption was greater than the increase in heating capacity when the cooling capacity was kept constant. The heating COP of the system when using R290 and R1270 was lower than that using the baseline refrigerant.
The influences of the utilization of the IHX and vapor injection on performance parameters are shown in Figure 7. The influence of utilizing the IHX and vapor injection was obtained by dividing the performance parameters using the IHX or flash tank vapor injection by a similar parameter in the single-stage cycle. As can be seen, the heating capacity decreased when utilizing the IHX and vapor injection, while the reduction in heating capacity was greater with vapor injection than with IHX. For example, the heating capacity when using R290 decreased by approximately 4.2% when using vapor injection, while it decreased by 1.4% with the IHX. The heating COP increased with the IHX and vapor injection, while the enhancement when using vapor injection was greater than that using IHX. Considering the heating COP improvement, the refrigerant that benefited the most from the IHX was the R600a, with approximately a 3.8% increase in the heating COP, while utilizing the IHX decreased its heating capacity by 1.7%.
A mass flow rate reduction in both cases, with the IHX and vapor injection, was observed. By contrast, the decrease in mass flow rate reduction with the IHX was 10.5% for tested refrigerants, and it was 2.2% with vapor injection. The compressor power consumption decreased with both IHX and vapor injection. The reduction in power consumption was much higher when using vapor injection than the IHX. According to the results, the reductions in power consumption with the IHX and vapor injection were 4.2% and 12.7%, respectively.
The IHX and vapor injection utilization had a reverse influence on the compression pressure ratio and discharge temperature. It was shown that they had a weak influence on the compression pressure ratio. The pressure ratio decreased with the IHX by almost 1.6%, but it increased slightly (less than 0.3%) with a vapor injection.

3.2. Exergy Analysis

The relative irreversibility of each component of the refrigeration system with different configurations and refrigerants is presented in Figure 8. The results revealed that the compressor was associated with 42% to 45% of the total system irreversibility in the SS cycle, followed by the expansion valve, which was associated with 26% to 29% irreversibility with different refrigerants. In the IHX cycle, the compressor had 42% to 45% of the total system irreversibility, similar to the SS cycle, followed by the condenser and expansion valve, with about 16% to 19% of the total irreversibility. In the third cycle with flash tank vapor injection, the compressor was associated with approximately 50% of the total system irreversibility, while the flash tank had a negligible RI value.
The reason for the relatively higher RI value for the compressor compared with the other components could be that the compressor’s highest mechanical and isentropic losses occurred in the vapor compression cycle. It is well understood that the component associated with a higher proportion of exergy destruction would be the main candidate for performance improvement, irrespective of its exergy efficiency value. Reducing the exergy destruction associated with components could lead to improvement in performance. The results showed that the modification of the compressor has a great potential to increase the system’s efficiency.
The influence of utilizing the IHX and vapor injection on exergy parameters is shown in Figure 9. It was revealed that the utilization of the vapor injection improved the exergy efficiency of the system by approximately 8% compared with the single-stage cycle. In comparison, the IHX could improve the exergy efficiency by between 2% and 3%. The utilization of vapor injection improved the system’s performance remarkably, irrespective of the refrigerant type, while the improvement by the IHX depended on the type of the refrigerants. Therefore, these results agree with the COP results regarding vapor injection and the IHX presented in Figure 7.

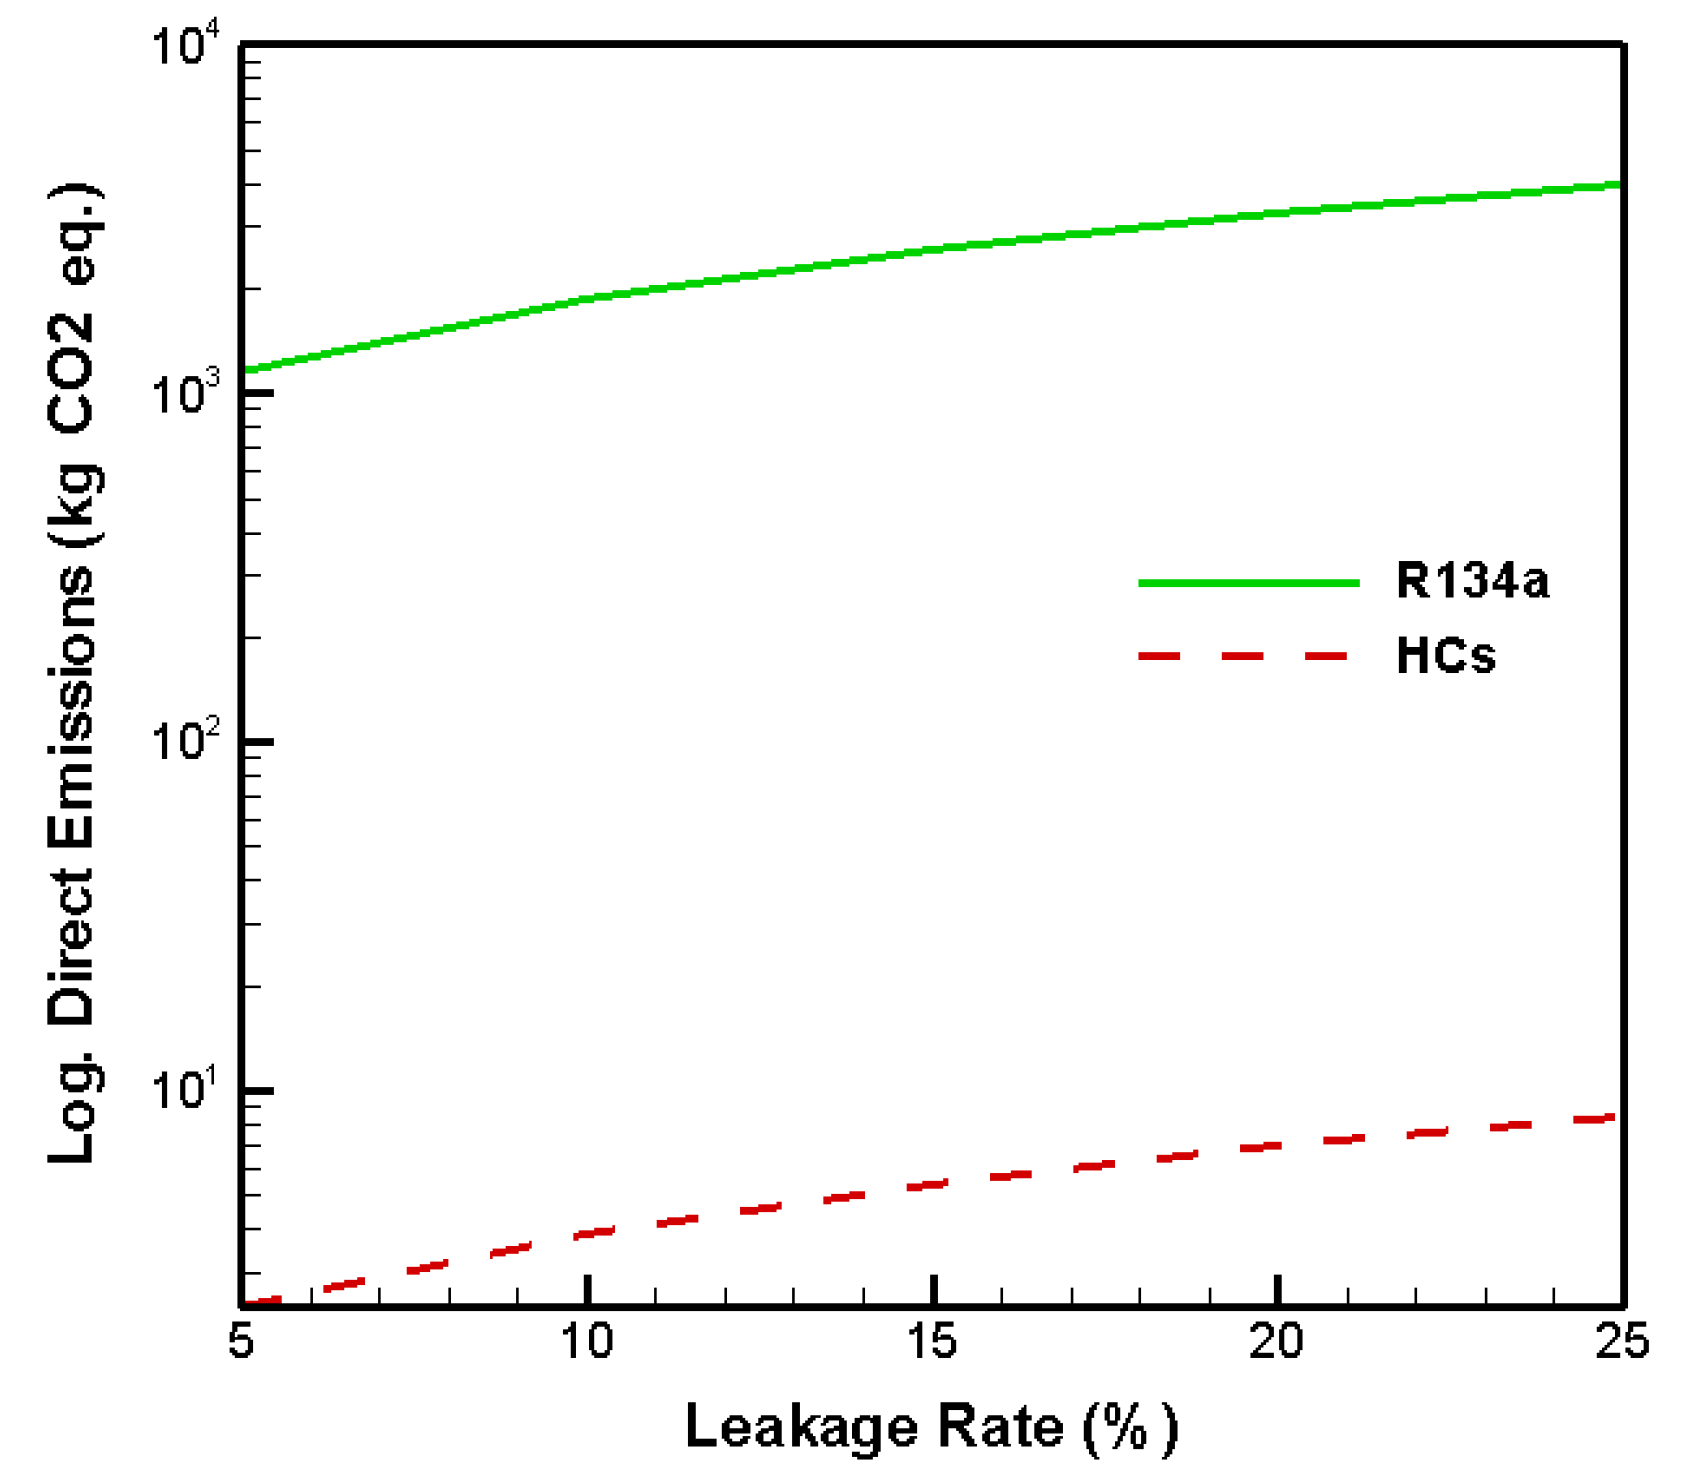
3.3. Environmental Impact Analysis

TEWI was the metric used in this study to investigate the equivalent emissions of different refrigerants and refrigeration cycle designs. According to Equation (23), it is apparent that the total CO2-eq emission comprises two parts: direct and indirect emissions. Direct emissions are mainly dependent on the GWP value and refrigerant leakage rate. An increase in the GWP of refrigerants as well as a higher leakage rate results in higher CO2-eq emissions. Figure 10a represents the influence of GWP and leakage rate on CO2 emissions for 10 years of refrigeration system operation, with the recovery factor assumed to be 0.7. The indirect emissions of a refrigeration system depend on the power consumption of the cycle and the emissions relevant to the energy sources used to operate the refrigeration system. Systems with higher efficiency consume less energy to produce the same cooling/heating and have lower CO2-eq emissions. In addition, various energy sources, such as fossil fuels and renewable energy, have different contributions to CO2-eq emission. When the share of clean energy sources increases, indirect emissions of the refrigeration systems are reduced. Figure 10b shows the influence of the COP and CO2-eq emission factor (kg per kWh) on indirect CO2-eq emissions. These results reveal that the impact of indirect emissions dominates the total CO2-eq emissions over the lifetime of a refrigeration system in most cases. Hence, it is essential to consider the refrigeration system’s efficiency when introducing a low GWP refrigerant as an alternative to a refrigerant with a high GWP value.
The use of hydrocarbons with much lower GWP values than R134a decreased the direct emissions of a refrigeration system. Figure 11 shows the direct CO2-eq emissions of the system when operating with hydrocarbons or R134a for 10 years. It can be seen that R134a significantly contributed to CO2-eq emissions, whereas using hydrocarbons with very low GWP values mitigated the CO2-eq emissions remarkably.
As mentioned above, the improvement in the efficiency of the refrigeration system decreases the total CO2-eq emissions. The influence of the selection of hydrocarbons instead of R134a and the improved design of the refrigeration system on total CO2-eq emissions is shown in Figure 12. The results depicted that hydrocarbons as an alternative to R134a decreased the CO2-eq emissions significantly, while R600a had lower emissions because of its higher efficiency than other studied refrigerants. The improved designs, including an internal heat exchanger and flash tank vapor injection, reduced the CO2-eq emissions by between 1% and 8%.
Emissions from electricity consumption depend on the sources of energy used for electricity generation, and they differ from country to country. If a country has low carbon electricity generation, the total equivalent emissions are relatively low. Hence, to investigate the emissions of a refrigeration system, it is imperative to consider the CO2-eq emission factor as a determinant criterion. Figure 13 shows the total emission of the refrigeration system when operating with R290 in different countries. According to the results, in a country such as Sweden, where the main electricity generation sources are renewable clean energy, the total emissions are much lower than in other countries. These results support the statement that in addition to the phase-down of high GWP refrigerants, countries must move toward clean energy sources for electricity generation to minimize the carbon footprint of refrigeration systems.

4. Conclusions

In this study, energy and exergy performances and the environmental impacts of three different system configurations using low GWP hydrocarbon refrigerants were investigated. R290, R600a, and R1270 were the proposed hydrocarbon refrigerants, and R134a was selected as a baseline. The proposed configurations included a single-stage cycle, a cycle with an internal heat exchanger, and a two-stage cycle with vapor injection.
It was found that the utilization of the IHX and vapor injection had a significant influence on the system’s performance. The COP of the system increased by approximately 3% with the IHX and about 9.9% with vapor injection compared to a single-stage cycle using hydrocarbon refrigerants. The heating capacity decreased when using the IHX and vapor injection compared with the single-stage cycle. It decreased by 1.4% and 4% when utilizing the IHX and vapor injection, respectively. The discharge temperature increased dramatically when using the IHX, while it decreased with vapor injection. Considering the performance of the hydrocarbon refrigerants, R290 and R1270 showed higher heating capacities than R134a but lower COPs. R600a had a higher COP but lower heating capacity than R134a. In this case, a relatively larger compressor size is required to meet the baseline performance.
The compressor had the highest exergy destruction in all cycles to be the main system performance improvement source. The vapor injection utilization improved the exergy efficiency of the system by approximately 8% compared with the single-stage cycle, while the IHX improved the exergy efficiency by between 2% and 3%. The use of hydrocarbons mitigated the CO2-eq emissions of the system compared with R134a remarkably. The CO2-eq emissions decreased by between 1% and 8% when using an internal heat exchanger and vapor injection compared with a single-stage cycle.
The paper proves the energy and exergy benefit caused by advanced configurations (IHX and economizer); however, it also shows the other side of the coin: a slight decrease in heating capacity. Therefore, the trade-off solution between R134a and different refrigerants must be considered for each particular application (e.g., COP versus heating capacity). Exergy analysis shows that particular attention must be devoted to the compressor and improved with configurations. Benefits are extended to the carbon footprint. In light of these results, hydrocarbons are a promising alternative in heat pumps if the refrigerant charge does not limit the implementation. Because of the flammability of HCs, these refrigerants are subject to international safety guidelines and legislation, limiting their use to a per-system charge of no more than 150 g. Therefore, it is highly recommended to investigate the performance of refrigeration systems with a charge amount below the limit with enhanced heat enhancement or new hydrocarbon mixtures, or blended with HFCs/HFOs but with a higher content of hydrocarbons.

Author Contributions

Conceptualization, M.G. and A.M.-B.; methodology, M.G. and A.M.-B.; formal analysis, M.G. and B.E.B.; investigation, M.G. and A.M.-B.; resources, M.G. and A.M.-B.; data curation, M.G.; writ-ing—original draft preparation, M.G.; writing—review and editing, A.M.-B. and B.E.B.; visualiza-tion, M.G.; supervision, R.K.; funding acquisition, R.K. All authors have read and agreed to the published version of the manuscript.

Funding

The research was funded by the Swedish Refrigeration Cooperation Foundation, KYS, and the Swedish Energy Agency.

Institutional Review Board Statement

Not applicable.

Informed Consent Statement

Not applicable.

Data Availability Statement

Not applicable.

Acknowledgments

Adrián Mota-Babiloni acknowledges the financial support of the Valencian Government by means of the postdoctoral contract APOSTD/2020/032.

Conflicts of Interest

The authors declare no conflict of interest.

Nomenclature

Nomenclature
COPcoefficient of performance (-)
E x rate of exergy (kW)
exspecific exergy (kJ kg−1)
hspecific enthalpy (kJ kg−1)
m ˙ refrigerant mass flow rate (kg s−1)
Ppressure (MPa)
mtotal refrigerant charge of the system (kg)
Q ˙ heat transfer rate (kW)
Ttemperature (°C)
W ˙ electric power consumption (kW)
E a n n u a l annual energy consumption (kWh)
Lannual refrigerant leakage rate (kg year−1)
RIrelative irreversibility (–)
sspecific entropy (kJ kg−1 K−1)
Greek symbols
αrecycling factor of the refrigerant
βindirect emission factor (kgCO2-eq. kWh−1)
εeffectiveness (-)
ηexergy efficiency (-)
Δvariation
Subscripts
ccooling
compcompressor
desdestruction
evapevaporator
isisentropic
refrefrigerant
Abbreviations
CFCchlorofluorocarbon
GHGgreenhouse gas
GWPglobal warming potential
HCFChydrochlorofluorocarbon
HCFOhydrochlorofluoroolefin
HFChydrofluorocarbon
HFOhydrofluoroolefin
IHXinternal heat exchanger
ODPozone depletion potential
PRPressure ratio
SSsingle stage
TEWItotal equivalent warming impact

References

  1. Harby, K. Hydrocarbons and their mixtures as alternatives to environmental unfriendly halogenated refrigerants: An updated overview. Renew. Sustain. Energy Rev. 2017, 73, 1247–1264. [Google Scholar] [CrossRef]
  2. Hasbali, A.; Kalinci, Y. A review of heat pump water heating systems. Renew. Sustain. Energy Rev. 2009, 13, 1211–1229. [Google Scholar]
  3. Huang, B.J.; Lee, J.P.; Chyng, J.P. Heat-pipe enhanced solar-assisted heat pump water heater. Sol. Energy 2005, 78, 375–381. [Google Scholar] [CrossRef]
  4. Ito, S.; Miura, N. Studies of a heat pump using water and air heat sources in parallel. Heat Transf. Asian Res. 2000, 29, 473–490. [Google Scholar] [CrossRef]
  5. Sarbu, I. A review on substitution strategy of non-ecological refrigerants from vapour compression-based refrigeration air-conditioning and heat pump systems. Int. J. Refrig. 2014, 46, 123–141. [Google Scholar] [CrossRef]
  6. Zhou, W.; Gan, Z. A potential approach for reducing the R290 charge in air conditioners and heat pumps. Int. J. Refrig. 2019, 101, 47–55. [Google Scholar] [CrossRef]
  7. Dalkilic, A.S.; Wongwises, S. A performance comparison of vapour-compression refrigeration system using various alternative refrigerants. Int. Commun. Heat Mass Transf. 2010, 37, 1340–1349. [Google Scholar] [CrossRef]
  8. Yu, C.C.; Teng, T.P. Retrofit assessment of refrigerator using hydrocarbon refrigerants. Appl. Therm. Eng. 2014, 66, 507–518. [Google Scholar] [CrossRef]
  9. Calleja-Anta, D.; Nebot-Andrés, L.; Catalán-Gil, J.; Sánchez, D.; Cabello, R.; Llopis, R. Thermodynamic screening of alternative refrigerants for R290 and R600a. Results Eng. 2020, 5, 100081. [Google Scholar] [CrossRef]
  10. Ghoubali, R.; Byrne, P.; Bazantay, F. Refrigerant charge optimisation for propane heat pump water heaters. Int. J. Refrig. 2017, 76, 230–244. [Google Scholar] [CrossRef]
  11. Yelishala, S.; Kannaiyan, K.; Sadr, R.; Wang, Z.; Levendis, Y.; Metghalchi, H. Performance maximization by temperature glide matching in energy exchangers of cooling systems operating with natural hydrocarbon/CO2 refrigerants. Int. J. Refrig. 2020, 119, 294–304. [Google Scholar] [CrossRef]
  12. Mohanraj, M.; Jayaraj, S.; Muraleedharan, C.; Chandrasekar, P. Experimental investigation of R290/R600a mixture as an alternative to R134a in a domestic refrigerator. Int. J. Therm. Sci. 2009, 48, 1036–1042. [Google Scholar] [CrossRef]
  13. Urchueguıa, J.F.; Corberan, J.M.; Gonzalvez, J.; Dıaz, J.M. Experimental characterization of a commercial-size scroll and reciprocating compressor working with R22 and propane (R290) as refrigerant. Ecobrium J. AIRAH 2004, 23, 23–25. [Google Scholar]
  14. Khalid, A.J.; Qusay, R.A. Experimental assessment of residential split type airconditioning systems using alternative refrigerants to R-22 at high ambient temperatures. Energy Convers. Manag. 2014, 86, 496–506. [Google Scholar]
  15. Corberán, J.M.; Israel, O.; Martínez, J.G. Charge optimization study of a reversible water-to-water propane heat pump. Int. J. Refrig. 2008, 31, 716–726. [Google Scholar] [CrossRef]
  16. Wongwises, S.; Kamboon, A.; Orachon, B. Experimental investigation of hydrocarbon mixtures to replace HFC-134a in an automotive air conditioning system. Energ. Convers. Manag. 2006, 47, 1644–1659. [Google Scholar] [CrossRef]
  17. Fan, C.; Yan, G.; Yu, J. Theoretical study on a modified heat pump cycle with zeotropic mixture R32/R290 for district heating in cold region. Appl. Therm. Eng. 2019, 156, 702–707. [Google Scholar] [CrossRef]
  18. Ju, F.; Fan, X.; Chen, Y.; Ouyang, H.; Kuang, A.; Ma, S.; Wang, F. Experiment and simulation study on performances of heat pump water heater using blend of R744/R290. Energ. Build. 2018, 169, 148–156. [Google Scholar] [CrossRef]
  19. Malwe, P.D.; Gawali, B.S.; Thakre, S.D. Exergy analysis of vapour compression refrigeration system. Int. J. Therm. Technol. 2014, 4, 54–57. [Google Scholar]
  20. Bayrakci, H.C.; Ozyur, A.E. Energy and exergy analysis of vapor compression refrigeration system using pure hydrocarbon refrigerants. Int. J. Energy Res. 2009, 33, 1070–1075. [Google Scholar] [CrossRef]
  21. El-Morsi, M. Energy and exergy analysis of LPG (liquefied petroleum gas) as a drop in replacement for R134a in domestic refrigerators. Energy 2015, 86, 344–353. [Google Scholar] [CrossRef]
  22. Makhnatch, P.; Khodabandeh, R. The role of environmental metrics (GWP, TEWI, LCCP) in the selection of low GWP refrigerant. Energy Procedia 2014, 61, 2460–2463. [Google Scholar] [CrossRef] [Green Version]
  23. Lemmon, E.W.; Bell, I.H.; Huber, M.L.; McLinden, M.O. NIST Standard Reference Database: Reference Fluid Thermodynamic and Transport Properties-REFPROP; Version 8; National Institute of Standards and Technology: Gaithersburg, MD, USA, 2007.
  24. Royo, C.; Arpagaus, C.; Mota-Babiloni, A.; Navarro-Esbrí, J.; Bertsch, S.S. Advanced high temperature heat pump configurations using low GWP refrigerants for industrial waste heat recovery: A comprehensive study. Energ. Convers. Manag. 2021, 229, 113752. [Google Scholar] [CrossRef]
  25. Qi, H.; Liu, F.; Yu, J. Performance analysis of a novel hybrid vapor injection cycle with subcooler and flash tank for air-source heat pumps. Int. J. Refrig. 2017, 74, 540–549. [Google Scholar] [CrossRef]
  26. Royo, C.; Navarro-Esbrí, J.; Mota-Babiloni, A.; Molés, F.; Albuixech, M. Experimental exergy and energy analysis of a novel high-temperature heat pump with scroll compressor for waste heat recovery. Appl. Energy 2019, 253, 113504. [Google Scholar] [CrossRef]
  27. Pitarch, M.; Hervas-Blasco, E.; Navarro-Peris, E.; Corberán, J.M. Exergy analysis on a heat pump working between a heat sink and a heat source of finite heat capacity rate. Int. J. Refrig. 2019, 99, 337–350. [Google Scholar] [CrossRef]
  28. Mota-Babiloni, A.; Barbosa, J.R.; Makhnatch, P.; Lozano, J.A. Assessment of the utilization of equivalent warming impact metrics in refrigeration, air conditioning and heat pump systems. Renew. Sust. Energ. Rev. 2020, 129, 109929. [Google Scholar] [CrossRef]
  29. Royo, C.; Esbrí, J.; Mota-Babiloni, A.; Albuixech, M.; Molés, F. Thermodynamic analysis of low GWP alternatives to HFC-245fa in high-temperature heat pumps: HCFO-1224yd(Z), HCFO-1233zd(E) and HFO-1336mzz(Z). Appl. Therm. Eng. 2019, 152, 762–777. [Google Scholar] [CrossRef]
  30. 2020 Grid Electricity Emissions Factors v1.4. Available online: https://www.carbonfootprint.com/.
Figure 1. Schematic and P-h diagrams of refrigeration systems: (a) SS, (b) IHX, and (c) ECO.
Applsci 11 06226 g001
Figure 2. Relative mass flow rate using R134a as the reference.
Applsci 11 06226 g002
Figure 3. Relative compressor power using R134a as the reference.
Applsci 11 06226 g003
Figure 4. Relative pressure ratio using R134a as the reference.
Applsci 11 06226 g004
Figure 5. Relative heating capacity using R134a as the reference.
Applsci 11 06226 g005
Figure 6. Relative COP using R134a as the reference.
Applsci 11 06226 g006
Figure 7. The influence of (a) IHX and (b) vapor injection on different performance parameters.
Applsci 11 06226 g007
Figure 8. Relative irreversibility diagrams of each component of the refrigeration system for (a) SS, (b) IHX, and (c) ECO configurations and different refrigerants (Tsource and Tsink of −5 and 35 °C, respectively).
Applsci 11 06226 g008aApplsci 11 06226 g008b
Figure 9. The influence of (a) IHX and (b) vapor injection on different exergy parameters (Tsource and Tsink of −5 and 35 °C, respectively).
Applsci 11 06226 g009
Figure 10. Emissions (kg CO2-eq) of a refrigeration system as a function of different parameters: (a) direct and (b) indirect.
Applsci 11 06226 g010
Figure 11. Logarithmic direct CO2-eq emissions of hydrocarbons and R134a at different leakage rates.
Applsci 11 06226 g011
Figure 12. The influence of (a) refrigerant and (b) the design of the cycle on TEWI.
Applsci 11 06226 g012
Figure 13. TEWI of the refrigeration system when operating with R290 in different countries (emission factors taken from ref. [30]).
Applsci 11 06226 g013
Table 1. Properties of baseline and alternative hydrocarbon refrigerants.
R290R600aR1270R134a
FormulaC3H8C4H10C3H6C2H2F4
Molecular mass (g mol−1)445842102
Ozone depletion potential, ODP0000
100-year global warming potential, GWP1003331430
Safety classificationA3A3A3A1
Critical temperature (K)369.9407.8364.2374.2
Critical pressure (MPa)4.253.634.554.06
Saturation pressure at 280 K (MPa)0.5880.2010.7160.377
Enthalpy of vaporization at 280 K (kJ kg−1)364.5347.4366.6193.2
Vapor density at 280 K (kg m−3)12.85.415.0518.7
Volumetric capacity at 280 K (kJ m−3)4646.91868.931973604.6
Saturation pressure at 341 K (MPa)2.501.052.962.04
Table 2. Discharge temperatures (°C) for different refrigerants and configurations.
SSIHXECO
R134a59.871.757.9
R29058.970.457.1
R600a50.362.249.2
R127065.276.963.1
Publisher’s Note: MDPI stays neutral with regard to jurisdictional claims in published maps and institutional affiliations.

