Article

A Proposed In Vitro Methodology for Assessing the Accuracy of Three-Dimensionally Printed Dental Models and the Impact of Storage on Dimensional Stability

1
School of Medicine and Dentistry, Griffith University, Gold Coast, QLD 4215, Australia
2
Advanced Design and Prototyping Technologies Institute, Griffith University, Gold Coast, QLD 4215, Australia
*
Author to whom correspondence should be addressed.
Appl. Sci. 2021, 11(13), 5994; https://doi.org/10.3390/app11135994
Submission received: 30 May 2021 / Revised: 21 June 2021 / Accepted: 25 June 2021 / Published: 28 June 2021
(This article belongs to the Special Issue 3D Printed Materials Dentistry)

Abstract

:
The objective of this study was to propose a standardised methodology for assessing the accuracy of three-dimensional printed (3DP) full-arch dental models and the impact of storage using two printing technologies. A reference model (RM) comprising seven spheres was 3D-printed using digital light processing (MAX UV, MAX) and stereolithography (Form 2, F2) five times per printer. The diameter of the spheres (n = 35) represented the dimensional trueness (DT), while twenty-one vectors (n = 105) extending between the sphere centres represented the full-arch trueness (FT). Samples were measured at two (T1) and six (T2) weeks using a commercial profilometer to assess their dimensional stability. Significant (p < 0.05) contraction in DT occurred at T1 and T2 with a medium deviation of 108 µm and 99 µm for MAX, and 117 µm and 118 µm for F2, respectively. No significant (p > 0.05) deviations were detected for FT. The detected median deviations were evenly distributed across the arch for MAX at <50 µm versus F2, where the greatest error of 278 µm was in the posterior region. Storage did not significantly impact the model’s DT in contrast to FT (p < 0.05). The proposed methodology was able to assess the accuracy of 3DP. Storage significantly impacted the full-arch accuracy of the models up to 6 weeks post-printing.

1. Introduction

Whether fully digital or hybrid, the digital workflow offers a valuable opportunity for cost-effective and streamlined delivery of dental care. Three-dimensional printing (3DP) is part of the digital workflow, which is being adopted into the dental industry at a rapid rate [1]. 3DP is an additive process involving layer-by-layer (z-axis) deposition of material in the x- and y-axes [2,3]. The fabrication of 3D printed dental models for single crowns, fixed and removable partial dentures, surgical guides, orthodontic aligners, and treatment planning are examples of the adoption of this technology in routine practise [4,5].
Multiple printing technologies have been developed for 3DP, with one of the most established to date being photopolymerisation [6]. Stereolithography (SLA) and digital light processing (DLP) are common photopolymerisation-based 3DP systems [3,7,8]. SLA involves galvanometer mirrors that direct ultraviolet light to selectively polymerise the monomers point by point across the x-y axis before the build platform moves into the z-axis to incrementally build the appliance [1,9]. In contrast, DLP utilises micromirrors to direct the projector light to polymerise the entire x-y layer all at once, resulting in a reduced production time compared to SLA [1,10].
The accuracy of 3D printed dental models has been extensively researched, with a recent systematic review identifying their accuracy varies significantly, between <100 and >500 µm, not only between different printing technologies but also within studies evaluating similar 3D printers [1]. Etemad-Shahidi et al. [1] attributed this to the heterogeneity of the study designs in the included studies, which led to a high risk of bias, calling for standardised testing and reporting protocol in studies investigating 3DP accuracy.
Furthermore, there is currently limited evidence in the existing literature investigating the impact of storage on the dimensional stability of 3D printed dental models [1,11]. Additionally, and to the authors’ knowledge, no studies have investigated the full-arch dimensional stability of 3D printed models. As stated by Joda et al. [11], the fabrication of all types of dental prostheses and appliances is currently not plausible solely through the digital workflow, often requiring analogue input. Therefore, in cases where a combination of analogue and digital workflow is required, the dimensional stability of 3D printed models becomes of direct clinical interest. The dimensional stability of 3D printed models is of critical importance in cases of limited access to 3D printers where service delays are inevitable: increased workload, lack of in-house facilities, and shipping needs of rural and outreach locations. Further complicating the streamlining of the hybrid workflow is the potentially extended time needed for the actual printing of the dental model, inherently dependant on the printing system available, and could span to several hours per model. Henceforth, it is paramount that a 3D printed model remains dimensionally stable during storage to ensure the proper fabrication of the prosthesis for adequate seating, conformity with the patient’s stomatognathic system and the planned treatment especially in multi-unit indirect restoration that requires a passive fit upon insertion, and surgical guides for accurate implant placement [11,12]. If, however, 3D printed models do demonstrate dimensional changes with storage, then such changes should be accounted for as part of the validation process of the workflow.
The objective of this study was to propose a standardised methodology for assessing the accuracy of 3D printed full-arch dental models and the impact of storage on the dimensional stability using two commercially available 3D printing systems.

2. Materials and Methods

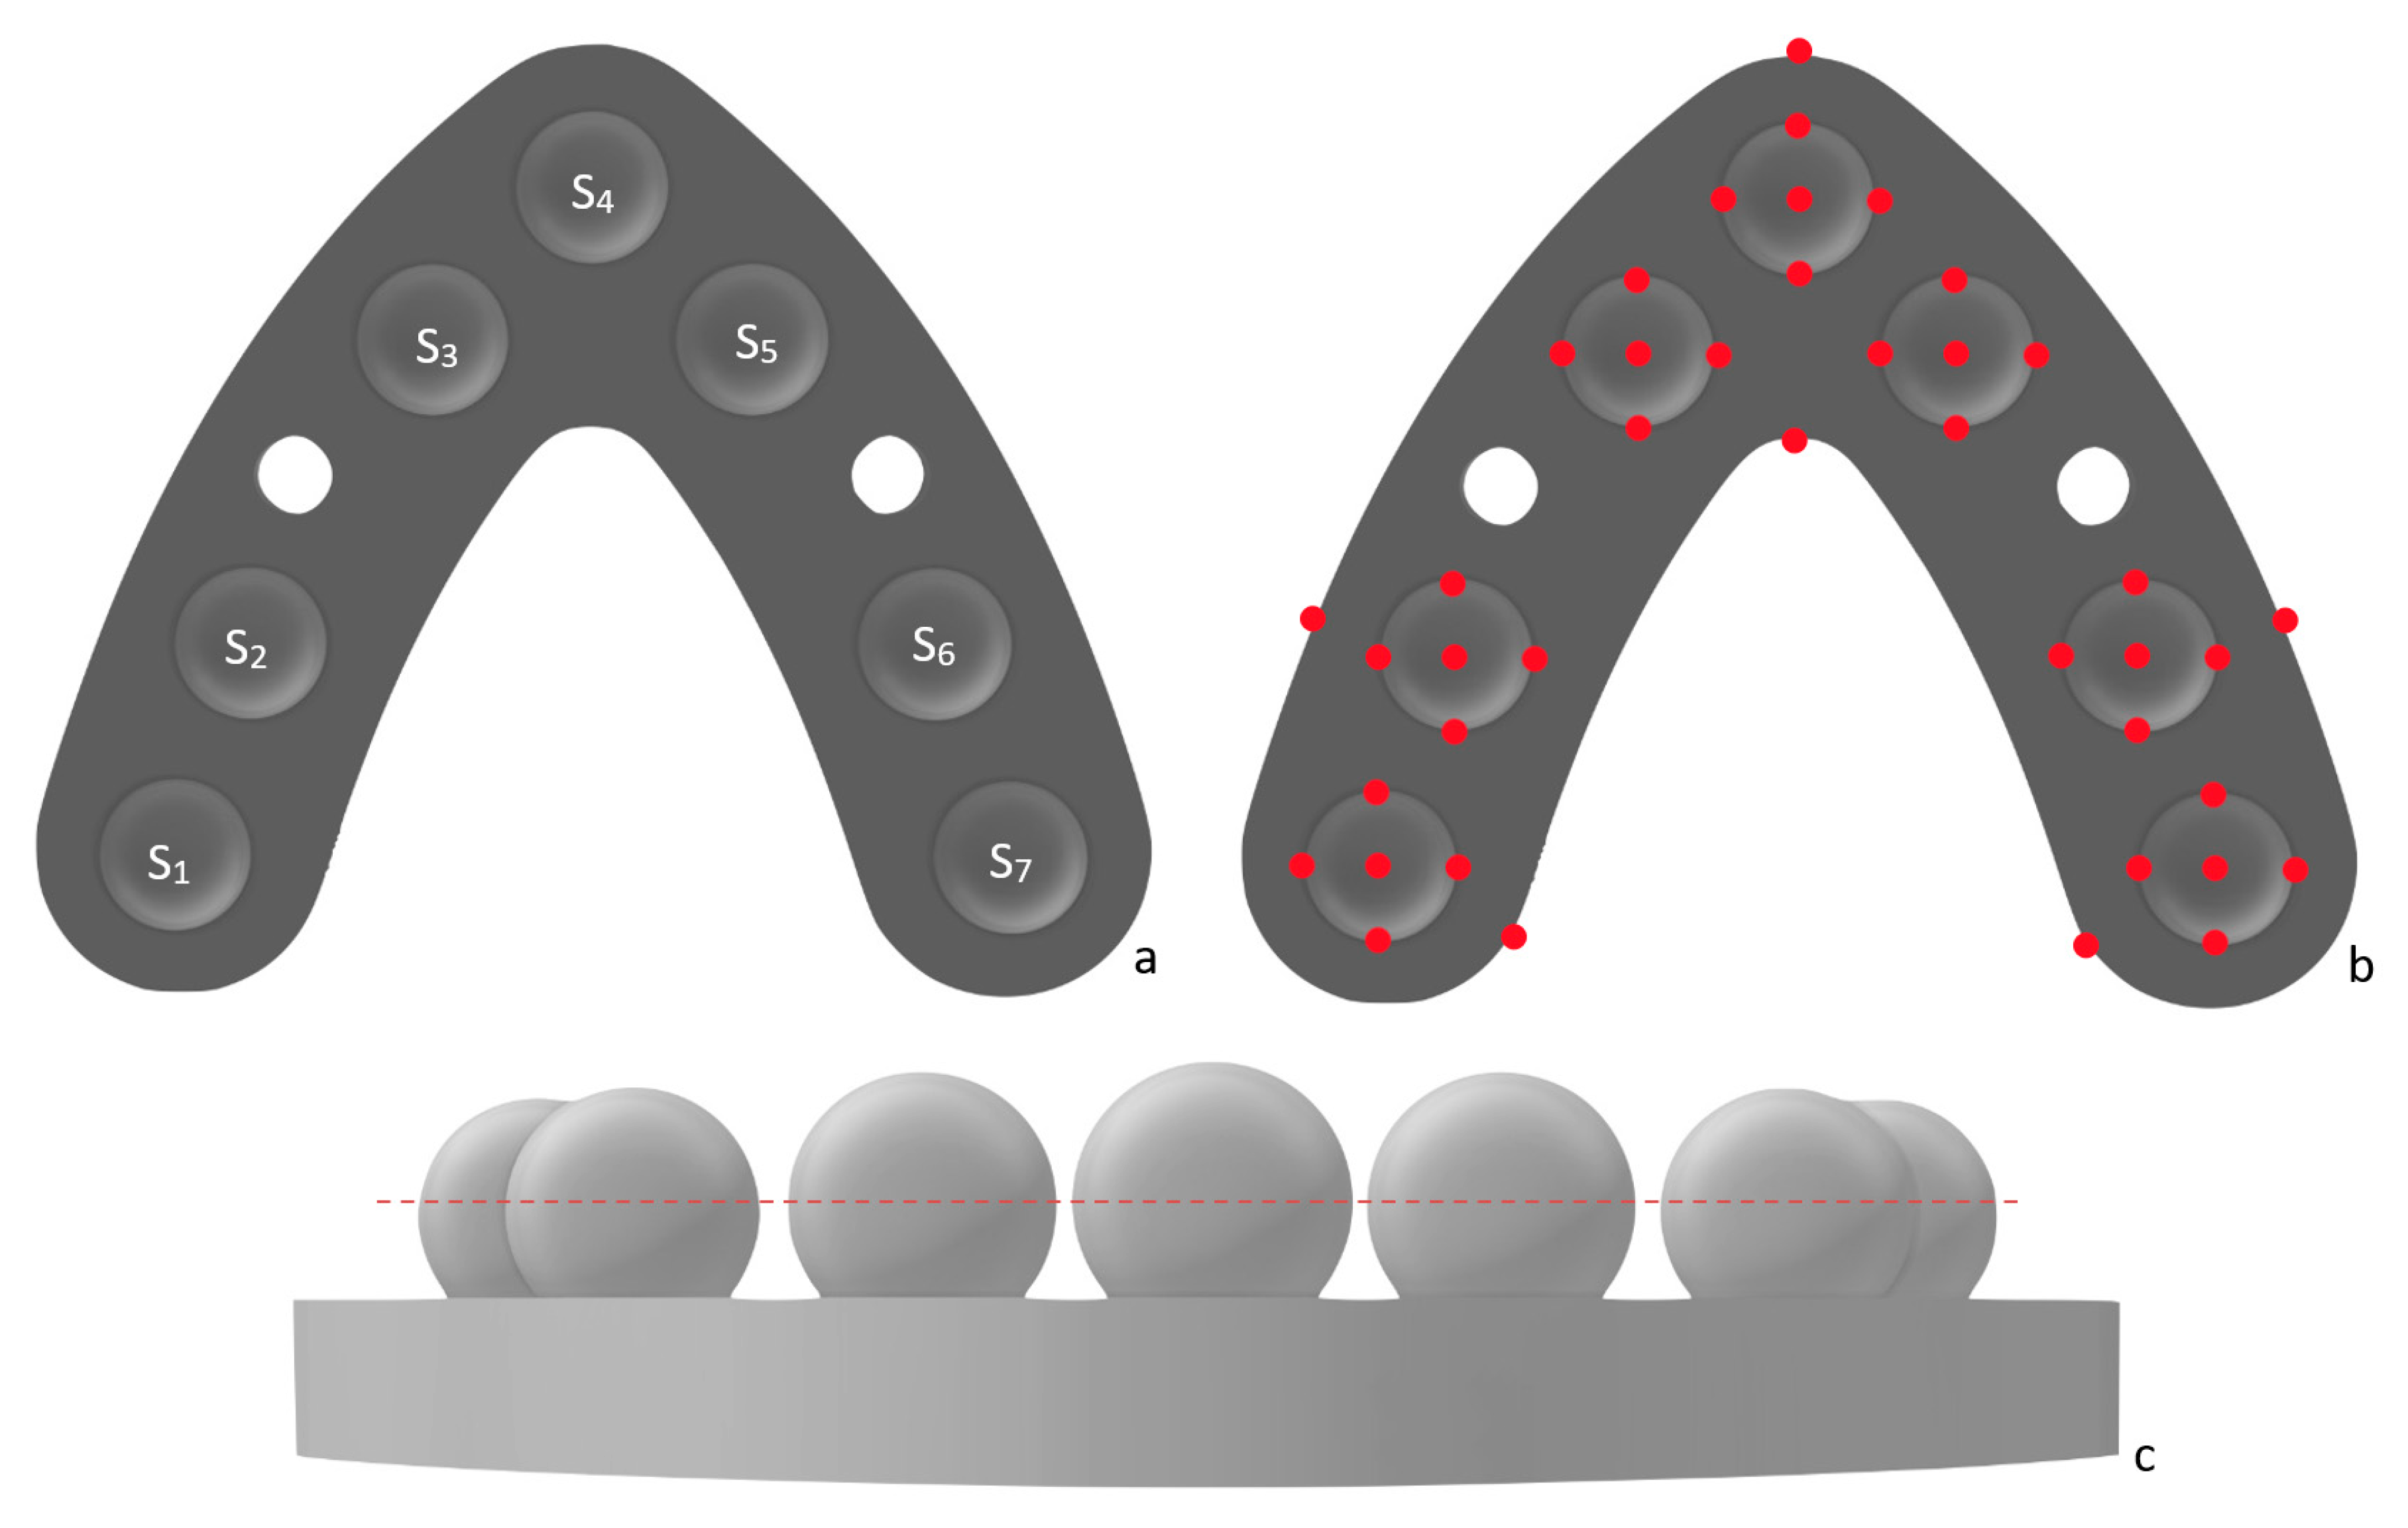
2.1. Reference Model

The reference model was based on a previously published protocol [13] in the form of a horseshoe-shaped model that fits in a standard, medium-sized dental impression stock tray to mimic the dimensions of the dental arch. The STL file of the model was designed using Solidworks (Dassault Systeme, Velizy Villacoublay, France) comprising of a 6.5 mm thick base and seven spheres, approximately 10 mm in diameter, embedded in the base and distributed across the arch to represent the anterior and posterior region of the dentition (Figure 1). The diameter of each sphere, along with the vectors that extend between the hypothetical centres of the spheres of the STL file, were confirmed using surface-matching software (Geomagic Control X, 2014; 3D Systems, Rock Hill, SC, USA) (Table 1 and Table 2).

2.2. Manufacturing 3D Printed Full-Arch Dental Models

Two 3D printers utilising different 3D technologies were assessed: Form 2 (405 nm violet laser, 140 µm laser spot size; Formlabs, Somerville, MA, USA) and MAX UV (385 nm ultraviolet laser; Asiga, Alexandria, New South Wales, Australia) with SLA and DLP systems, respectively, were selected. The STL file of the reference model was imported into Form 2 slicing software (PreForm, Formlabs, Somerville, MA, USA) and the Asiga MAX UV slicing software (Asgia Composer, Asiga, Alexandria, New South Wales, Australia). The slicing software were used to orientate the model at 0 degrees/horizontally with the model base directly on the build platform. The z-axis resolution was set and standardised at 50 µm. Formlabs dental model resin (Formlabs, Sommerville, MA, USA) was used for Form 2 and Fotodent model 385/405 nm resin (Dreve, Unna, Germany) for MAX UV.
The printed models remained in the printer to drip for at least 10 min as recommended by the manufacturer to reduce resin remnant on the models. All models were then washed manually in two baths of 99.5% isopropanol (Thermo Fisher Scientific Australia, Victoria, Australia). MAX UV models were washed for 6 min (total = 12 min) and Form 2 models for 10 min (total = 20 min) in each bath. The MAX UV models were air-dried before post-curing for 10 min with a light-curing unit (Otoflash G171, 280–700 nm, Puretone 3D, Kent, United Kingdom) under nitrogen gas with a total of 6000 flashes. The Form 2 models were post-cured in LC-3D Print Box (NextDent, 315–550 nm, Soesterberg, The Netherlands) for 10 min.

2.3. Assessment of Accuracy

Each sample model comprised 7 spheres and 21 vector measurements extending between the hypothetical sphere centres. Five models (n = 5) were printed for each printer to assess the dimensional (n = 35) and full-arch accuracy (n = 105). The printed models were measured using a coordinate measuring machine (CMM, Absolute Arm 7-Axis, Hexagon, Cobham, UK) with a 50 mm long probe and a 3 mm ruby tip within two weeks (T1) of printing. The Absolute Arm 7-Axis was calibrated according to ISO 10360-12 with a confirmed error of 0.005 mm. The CMM measurements began by outlining the base of the model to establish an area in space on PolyWorks Inspector (Innovmetric, QC, Canada) using six points circumferentially around the base of the model. The dimensions of the spheres were then measured using nine points with four points circumferentially below the equator, four points circumferentially above the equator, and one point at the top-centre of the sphere (Figure 1). The sequence of measurements was from S1 through to S7. The S1 location was then combined with the line vector from S1 to S7 to create a cartesian axis located in the measured centre of S1. The diameter of the spheres was then calculated using the sphere function on PolyWorks Inspector. The hypothetical centre of each sphere was then used to measure the 21 vectors listed in Table 2 on PolyWorks. All models were stored and measured in a temperature-controlled room (24 °C, 1013 hPa), with the same operator completing all measurements. The 3D printed models were stored in the same conditions in a dark storage compartment devoid of light, then measured again six weeks (T2) after printing to assess the dimensional stability of 3D printed models.
The diameter of the spheres was used to assess the dimensional accuracy of the printed models. The full-arch accuracy was assessed based on the combination of the 21 vectors that extended between the hypothetical sphere centres. Specific arch segments were also assessed to identify the pattern of changes through a combination of different cross-arch vectors: left posterior (V1, V2, V7), right posterior (V19, V20, V21), posterior (V5, V6, V10, V11), anterior (V12, V13, V16), and anteroposterior (V3, V18).

2.4. Statistical Analysis

The median deviation was used to assess the trueness, and the interquartile range (IQR) was used to determine the precision. The normality of the data was evaluated using the Shapiro–Wilk test. One-sample Wilcoxon signed-rank test was used to compare the dimensional and full-arch trueness of the two printing systems at T1 and T2 against the reference measurements. The dimensional and full-arch accuracy of the two printing systems were compared using the Mann–Whitney U test. The same test was used to assess significant differences between the left and right posterior arch segments and anterior and posterior arch segments. The dimensional stability of the 3D printed model between T1 and T2 was assessed using Wilcoxon signed-rank test. All statistical analysis was performed using IBM SPSS statistics software (Version 24; IBM, Armonk, NY, USA) with a significance level of 0.05.

3. Results

The dimensional trueness of both tested printing systems was statistically different from the reference measurement (p < 0.05) at both time points. MAX UV demonstrated median deviation of 108 µm and 99 µm whilst Form 2 yielded 117 µm and 118 µm at two- and six-weeks post-printing, respectively. The study found no significant difference from the reference model (p > 0.05) for either 3D printer at both two- and six-weeks post-printing in terms of full-arch trueness.
Comparison of the dimensional accuracy between the two printing systems resulted in a statistical difference (p = 0.005). MAX UV had a lower median deviation (108 µm) and greater precision (27 µm) when compared to Form 2, which had trueness of 117 µm and precision of 59 µm after two weeks post-printing (Figure 2). Similarly, a statistical difference (p = 0.000) was also present for full-arch accuracy, with MAX UV having a smaller error (26 µm) and higher precision (32 µm) (Figure 3).
When the models were stored for an additional four weeks after the initial measurement, no statistical differences were found for the dimensional deviation between the two time points for both printers (p > 0.05). However, statistical differences were detected for full-arch accuracy for both MAX UV samples (p = 0.003) and Form 2 samples (p = 0.000) between two- and six-weeks post-printing indicating a progressive contraction with time (Figure 2 and Figure 3).
The analysis of the individual arch segments did not identify significant differences (p > 0.05) in the deviation between the left and right posterior arch for both printers. Similarly, no statistical difference (p = 0.117) was found between the anterior and posterior arch for MAX UV. However, Form 2 showed significant (p = 0.000) posterior cross-arch shrinkage when the anterior (vectors V12, V13, V16) and posterior arch (vectors V5, V6, V10, V11) segments were compared (Table 3). The Form 2 models also showed a large anteroposterior (vector V3, V18) contraction with a median deviation of 212 µm from the reference measurement with low precision of 124 µm.
The tested DLP system was more than twice as efficient as the SLA system with similar resin consumptions. MAX UV required approximately 37.7 mL of resin for the fabrication of two models in 1 h and 48 min. On the other hand, Form 2 required 37.3 mL to fabricate two models in 4 h.

4. Discussion

The aim of this study was to propose a standardised testing methodology for assessing the accuracy of 3D printed full-arch dental models and the impact of storage on them. The current study utilised the combination of metrology and 3D linear measurements using an industrial coordinate measuring machine and inspection software as a gold standard to reduce the error associated with physical calliper measurements and best-fit superimposition [14,15,16]. Previous studies have relied on the best-fit (iterative closest point) algorithm for superimposition, which may compensate positive deviations and negative ones resulting in the under- or over-estimation of errors [16,17]. On the other hand, physical, digital calliper measurements have been criticised for their poor repeatability, reliance on reference areas that may change over time, and limited access to small areas on the models [18]. The use of varying typodont models in different studies presents significant challenges to the standardisation of testing and meaningful comparison among studies. Henceforth, the current study proposed the use of simple, spherical geometry that can be readily replicated to determine the highest possible accuracy of 3DP whilst avoiding the use of complex tooth morphology that may introduce a greater risk of variation and measurement error [13,19]. Indeed, the choice of spherical geometry was based on the accuracy testing methodology adopted by the International Organization for Standardization in several of its standards, which involves the measurement of spheres, including ISO12836:2015 annex C evaluating digitizing devices for CAD/CAM systems for indirect dental restorations and ISO10360:2009/2020 parts 2 and 5 for acceptance and reverification tests for coordinate measuring systems (CMS). The methodology employed in the current study was also previously validated for assessing the dimensional accuracy and stability of Type IV stone dental models, presenting a suitable follow-up in the assessment of 3D printed dental models [13]. The proposed methodology relied on a direct comparison between the 3D printed samples and the STL image of the reference model, subsequently eliminating errors arising from the scanning of a physical reference model such as scanning system error, the dimensional stability of a stone cast, optical properties of the reference model, operator influence, or light conditions [6,13,20,21,22,23,24].
The dimensional trueness identified in the current study with an error of <120 µm concurred with the accuracy findings reported in similar studies [25,26]. Additionally, for full-arch accuracy, the detected anteroposterior and cross-arch dimensional contraction associated with the SLA printer was also identified in previous studies [16,27,28]. This cross-arch contraction progressively increased towards the posterior aspect as the model diverged, resulting in a reduction in cross-arch support, which was also reported by Papaspyridakos et al. [16]. However, the study by Kim et al. [25] reported greater cross-arch trueness for their SLA printer (ZENITH; Dentis, Daegu, Korea) when compared to their DLP printer (M-ONE; MAKEX Technology, Ningbo, Zhejiang, China). Therefore, the cause of the dimensional distortion for the tested Form 2 models is more likely associated with the resin formulation as the investigation from Lin et al. [29] suggested that different compositions of ethoxylated bisphenol A-dimethacrylate, triethylene glycol dimethacrylate, and urethane dimethacrylate may influence the accuracy of 3DP. Moreover, Reymus et al. [30] reported that the choice of post-curing method played a significant role in the degree of conversion of the photo-sensitive resin – with the Otoflash G171 demonstrating the greatest degree of conversion versus the LC-3D Print Box being the lowest, which possibly explained the delayed dimensional changes identified in the study. The similarities between the results of the current study and literature supports the ability of the simple spherical geometry to assess the dimensional distortion of 3D printed models.
The present study also investigated the dimensional stability of 3D printed models using two printing systems over a period of six weeks. Currently, there are limited data in the literature investigating the dimensional stability of 3D printed models. The dimensional stability of 3D printed models is a clinically important parameter. The study by Jang et al. [31] showed that, although the fit of crowns produced on 3D printed models was acceptable, it remains inferior to conventional dies. This might be attributed to the detected dimensional errors of 3DP that need to be accounted for during the fabrication process of extra-coronal restoration to achieve better fitting restoration with minimal internal and marginal discrepancies. In the current study, the diameter of the seven spheres represents the short-span accuracy, as well as the twenty-one vectors extending between the centres of the seven spheres, representing the full-arch parameter of 3DP, was investigated to elucidate the pattern of dimensional changes exhibited for SLA and DLP manufactured dental models. No significant difference was detected for the diameter of the spheres between 2 weeks and 6 weeks indicating that for short-span application, any errors arising from model storage are expected to be within the reported clinically acceptable thresholds of 120 µm [32,33] and supporting their suitability, from an accuracy perceptive, for single crown and short-span application irrespective of storage time. Furthermore, for both SLA and DLP printers, the magnitude of the detected dimensional changes was similar to those reported for type IV die stone over 8 weeks of storage [34], albeit stone models exhibited expansion, as opposed to the contraction exhibited by 3DP. In contrast, the full-arch findings indicate significant and delayed contraction for both printing systems after storage and in agreement with similar in vitro studies [11,17]. The SLA models in this study exhibited significant contraction in an anteroposterior and cross-arch direction, in contrast to DLP which contracted evenly. Such contraction may impact the fit of full-arch appliances and restorations fabricated using these 3DP models due to their localised and skewed error pattern of >200 µm. On the other hand, the dimensional stability results of the DLP printer were within the clinically acceptable error margin of 59–150 µm [16] required for accuracy-demanding prosthodontic application such as implant-retained fixed prosthesis even after six weeks of storage. These findings do support the notion that a clear understanding of the performance and limitation of the 3D printing system is cardinal for determining their most suitable dental application and the timing of the manufacturing workflow.
The main limitation of this study is its in vitro nature and the reliance on simple object geometry for a reference model. Hence, whilst the methodology facilitates reproduction and standardisation of testing, the derived results represent ideal testing conditions that do not account for other clinical factors such as complex dental morphology and the presence of orthodontic crowding. Moreover, a limitation shared with similar studies is the applicability of the results to the resins used, which, albeit recommended by the manufacturers of the tested SLA and DLP printers for full-arch models, may not fully represent the array of printing resins currently in the market. Future research should be aimed at establishing the effect of different variables such as other resins and alternative post-processing methods on the accuracy of 3D printed full-arch models.

5. Conclusions

Within the limitations of in vitro testing conditions, the proposed methodology was able to assess the accuracy of 3D printed full-arch dental models, identifying greater accuracy with the tested DLP printer. The 3D printed models demonstrated continued dimensional changes over a period of 6 weeks irrespective of the printing system used. Whilst 3DP produced highly accurate models, caution should be exercised when utilising them after prolonged storage, for long-span or full-arch prostheses and appliances, and model analyses.

Author Contributions

Conceptualisation, K.E.A.; methodology, L.H.L., J.G., F.A.-S., L.D., D.S. and K.E.A.; software, L.D. and D.S.; validation, L.H.L. and K.E.A.; formal analysis, L.H.L. and J.G.; investigation, L.H.L. and J.G.; resources, K.E.A.; data curation, L.H.L., J.G. and L.D.; writing—original draft preparation, L.H.L.; writing—review and editing, L.H.L., J.G., F.A.-S., L.D., D.S. and K.E.A.; visualisation, L.H.L. and J.G.; supervision, F.A.-S. and K.E.A.; project administration, K.E.A.; funding acquisition, K.E.A. All authors have read and agreed to the published version of the manuscript.

Funding

This research received no external funding.

Institutional Review Board Statement

Not applicable.

Informed Consent Statement

Not applicable.

Conflicts of Interest

The authors declare no conflict of interest.

References

  1. Etemad-Shahidi, Y.; Qallandar, O.B.; Evenden, J.; Alifui-Segbaya, F.; Ahmed, K.E. Accuracy of 3-Dimensionally Printed Full-Arch Dental Models: A Systematic Review. J. Clin. Med. 2020, 9, 3357. [Google Scholar] [CrossRef]
  2. Abduo, J.; Lyons, K.; Bennamoun, M. Trends in computer-aided manufacturing in prosthodontics: A review of the available streams. Int. J. Dent. 2014, 2014, 783948. [Google Scholar] [CrossRef] [PubMed] [Green Version]
  3. Stansbury, J.W.; Idacavage, M.J. 3D printing with polymers: Challenges among expanding options and opportunities. Dent. Mater. 2015, 32, 54–64. [Google Scholar] [CrossRef]
  4. Cheng, C.-W.; Ye, S.-Y.; Chien, C.-H.; Chen, C.-J.; Papaspyridakos, P.; Ko, C.-C. Randomised clinical trial of a conventional and a digital workflow for the fabrication of interim crowns: An evaluation of treatment efficiency, fit, and the effect of clinician experience. J. Prosthet. Dent. 2020, 125, 73–81. [Google Scholar] [CrossRef]
  5. Braian, M.; Jimbo, R.; Wennerberg, A. Production tolerance of additive manufactured polymeric objects for clinical applications. Dent. Mater. 2016, 32, 853–861. [Google Scholar] [CrossRef] [PubMed]
  6. Dietrich, C.A.; Ender, A.; Baumgartner, S.; Mehl, A.A. validation study of reconstructed rapid prototyping models produced by two technologies. Angle Orthod. 2017, 87, 782–787. [Google Scholar] [CrossRef] [PubMed] [Green Version]
  7. Alghazzawi, T.F. Advancements in CAD/CAM technology: Options for practical implementation. J. Prosthodont. Res. 2016, 60, 72–84. [Google Scholar] [CrossRef]
  8. Dawood, A.; Marti, B.M.; Sauret-jackson, V.; Darwood, A. 3D printing in dentistry. Br. Dent. J. 2015, 219, 521–529. [Google Scholar] [CrossRef] [PubMed]
  9. Alifui-Segbaya, F. Biomedical photopolymers in 3D printing. Rapid Prototyp. J. 2019, 26, 437–444. [Google Scholar] [CrossRef]
  10. Tahayeri, A.; Morgan, M.; Fugolin, A.P.; Bompolaki, D.; Athirasala, A.; Pfeifer, C.S.; Ferracane, J.L.; Bertassoni, L.E. 3D printed versus conventionally cured provisional crown and bridge dental materials. Dent. Mater. 2018, 34, 192–200. [Google Scholar] [CrossRef]
  11. Joda, T.; Matthisson, L.; Zitzmann, N.U. Impact of Aging on the Accuracy of 3D-Printed Dental Models: An In Vitro Investigation. J. Clin. Med. 2020, 9, 1436. [Google Scholar] [CrossRef]
  12. Sabbah, A.; Romanos, G.; Delgado-Ruiz, R. Impact of Layer Thickness and Storage Time on the Properties of 3D-Printed Dental Dies. Materials 2021, 14, 509. [Google Scholar] [CrossRef]
  13. Ahmed, K.E.; Whitters, J.; Ju, X.; Pierce, S.G.; MacLeod, C.N.; Murray, C.A. A proposed methodology to assess the accuracy of 3d scanners and casts and monitor tooth wear progression in patients. Int. J. Prosthodont. 2016, 29, 514–521. [Google Scholar] [CrossRef]
  14. Aly, P.; Mohsen, C. Comparison of the Accuracy of Three-Dimensional Printed Casts, Digital, and Conventional Casts: An In Vitro Study. Eur. J. Dent. 2020, 14, 189–193. [Google Scholar] [CrossRef] [Green Version]
  15. Jin, S.J.; Kim, D.Y.; Kim, J.H.; Kim, W.C. Accuracy of Dental Replica Models Using Photopolymer Materials in Additive Manufacturing: In Vitro Three-Dimensional Evaluation. J. Prosthodont. 2019, 28, e557–e562. [Google Scholar] [CrossRef] [PubMed] [Green Version]
  16. Papaspyridakos, P.; Chen, Y.-W.; Alshawaf, B.; Kang, K.; Finkelman, M.; Chronopoulos, V.; Weber, H.-P. Digital workflow: In vitro accuracy of 3D printed casts generated from complete-arch digital implant scans. J. Prosthet. Dent. 2020, 124, 589–593. [Google Scholar] [CrossRef]
  17. Yousef, H.; Harris, B.T.; Elathamna, E.N.; Morton, D.; Lin, W.S. Effect of additive manufacturing process and storage condition on the dimensional accuracy and stability of 3D-printed dental casts. J. Prosthet. Dent. 2021. [Google Scholar] [CrossRef] [PubMed]
  18. Wan Hassan, W.N.; Yusoff, Y.; Mardi, N.A. Comparison of reconstructed rapid prototyping models produced by 3-dimensional printing and conventional stone models with different degrees of crowding. Am. J. Orthod. Dentofacial. Orthop. 2017, 151, 209–218. [Google Scholar] [CrossRef] [Green Version]
  19. Dong, T.; Wang, X.; Xia, L.; Yuan, L.; Ye, N.; Fang, B. Accuracy of different tooth surfaces on 3D printed dental models: Orthodontic perspective. BMC Oral Health 2020, 20, 340. [Google Scholar] [CrossRef] [PubMed]
  20. Revilla-León, M.; Subramanian, S.G.; Att, W.; Krishnamurthy, V.R. Analysis of Different Illuminance of the Room Lighting Condition on the Accuracy (Trueness and Precision) of An Intraoral Scanner. J. Prosthodont. 2021, 30, 157–162. [Google Scholar] [CrossRef]
  21. Revilla-León, M.; Jiang, P.; Sadeghpour, M.; Piedra-Cascón, W.; Zandinejad, A.; Özcan, M.; Krishnamurthy, V.R. Intraoral digital scans-Part 1: Influence of ambient scanning light conditions on the accuracy (trueness and precision) of different intraoral scanners. J. Prosthet. Dent. 2020, 124, 372–378. [Google Scholar] [CrossRef]
  22. Kim, Y.H.; Han, S.-S.; Choi, Y.J.; Woo, C.-W. Linear Accuracy of Full-Arch Digital Models Using Four Different Scanning Methods: An In Vitro Study Using a Coordinate Measuring Machine. Appl. Sci. 2020, 10, 2741. [Google Scholar] [CrossRef] [Green Version]
  23. Resende, C.C.D.; Barbosa, T.A.Q.; Moura, G.F.; Tavares, L.D.N.; Rizzante, F.A.P.; George, F.M.; Neves, F.D.D.; Mendonça, G. Influence of operator experience, scanner type, and scan size on 3D scans. J. Prosthet. Dent. 2021, 125, 294–299. [Google Scholar] [CrossRef] [PubMed]
  24. Lim, J.H.; Mangal, U.; Nam, N.E.; Choi, S.H.; Shim, J.S.; Kim, J.E. A Comparison of Accuracy of Different Dental Restorative Materials between Intraoral Scanning and Conventional Impression-Taking: An In Vitro Study. Materials 2021, 14, 2060. [Google Scholar] [CrossRef]
  25. Kim, S.Y.; Shin, Y.S.; Jung, H.D.; Hwang, C.J.; Baik, H.S.; Cha, J.Y. Precision and trueness of dental models manufactured with different 3-dimensional printing techniques. Am. J. Orthod. Dentofacial. Orthop. 2018, 153, 144–153. [Google Scholar] [CrossRef] [PubMed] [Green Version]
  26. Hazeveld, A.; Huddleston Slater, J.J.R.; Ren, Y. Accuracy and reproducibility of dental replica models reconstructed by different rapid prototyping techniques. Am. J. Orthod. Dentofacial. Orthop. 2014, 145, 108–115. [Google Scholar] [CrossRef]
  27. Zhang, Z.-C.; Li, P.-l.; Chu, F.-T.; Shen, G. Influence of the three-dimensional printing technique and printing layer thickness on model accuracy. J. Orofac. Orthop. 2019, 80, 194–204. [Google Scholar] [CrossRef] [PubMed]
  28. Nestler, N.; Wesemann, C.; Spies, B.C.; Beuer, F.; Bumann, A. Dimensional accuracy of extrusion- and photopolymerisation-based 3D printers: In vitro study comparing printed casts. J. Prosthet. Dent. 2020, 125, 103–110. [Google Scholar] [CrossRef]
  29. Lin, C.-H.; Lin, Y.-M.; Lai, Y.-L.; Lee, S.-Y. Mechanical properties, accuracy, and cytotoxicity of UV-polymerized 3D printing resins composed of Bis-EMA, UDMA, and TEGDMA. J. Prosthet. Dent. 2020, 123, 349–354. [Google Scholar] [CrossRef]
  30. Reymus, M.; Lümkemann, N.; Stawarczyk, B. 3D-printed material for temporary restorations: Impact of print layer thickness and post-curing method on degree of conversion. Int. J. Comput. Dent. 2019, 22, 231–237. [Google Scholar]
  31. Jang, Y.; Sim, J.Y.; Park, J.K.; Kim, W.C.; Kim, H.Y.; Kim, J.H. Evaluation of the marginal and internal fit of a single crown fabricated based on a three-dimensional printed model. J. Adv. Prosthodont. 2018, 10, 367–373. [Google Scholar] [CrossRef]
  32. Contrepois, M.; Soenen, A.; Bartala, M.; Laviole, O. Marginal adaptation of ceramic crowns: A systematic review. J. Prosthet. Dent. 2013, 110, 447–454.e10. [Google Scholar] [CrossRef] [PubMed]
  33. McLean, J.W.; von Fraunhofer, J.A. The estimation of cement film thickness by an in vivo technique. Br. Dent. J. 1971, 131, 107–111. [Google Scholar] [CrossRef] [PubMed]
  34. Luthardt, R.G.; Kühmstedt, P.; Walter, M.H. A new method for the computer-aided evaluation of three-dimensional changes in gypsum materials. Dent. Mater. 2003, 19, 19–24. [Google Scholar] [CrossRef]
Figure 1. STL image of the reference model. (a) Labelled spheres where S1, S2, S6 and S7 represent the posterior region of the model while S3–S5 represent the anterior region. Attachment vents are present between S2–S3 and S5–S6. (b) Red markings indicating the location for the coordinate measuring machine measurements. (c) Dotted red line indicating the equator of the spheres.
Applsci 11 05994 g001
Figure 2. Boxplot for the median error and precision of the sphere diameter at T1 and T2 for MAX UV and Form 2 3D printed models. o Denotes outliers more than 1.5 IQR but less than three IQR from the end of the boxplot. * Denotes outliers more than three IQR from the end of the boxplot.
Applsci 11 05994 g002
Figure 3. Boxplot for the median error and precision of the full-arch parameter at T1 (two weeks post-printing) and T2 (six weeks post-printing) for MAX UV and Form 2 3D printed models. o Denotes outliers more than 1.5 IQR but less than three IQR from the end of the boxplot.
Applsci 11 05994 g003
Table 1. Reference measurements for the diameter of each sphere based on the reference model.
SphereDiameter (mm)
S19.976
S29.985
S39.956
S49.977
S59.959
S69.982
S79.967
Table 2. Definition of the 21 vectors extending between the hypothetical spheres centre and the corresponding reference measurements based on the reference model.
VectorNameMeasurement (mm)
S1–S2V114.856
S1–S3V238.022
S1–S4V351.889
S1–S5V451.003
S1–S6V551.914
S1–S7V655.003
S2–S3V723.344
S2–S4V837.513
S2–S5V938.610
S2–S6V1044.999
S2–S7V1151.929
S3–S4V1214.493
S3–S5V1321.002
S3–S6V1438.583
S3–S7V1550.990
S4–S5V1614.500
S4–S6V1737.502
S4–S7V1851.887
S5–S6V1923.330
S5–S7V2038.016
S6–S7V2114.860
Table 3. Median deviation and interquartile range (IQR) of arch segments: left posterior; right posterior; posterior; anterior; anteroposterior of MAX UV and Form 2 3D printed models at T1.
PrinterMeasurementsLeft PosteriorRight PosteriorPosteriorAnteriorAnteroposterior
Max UVMedian deviation (µm)209492723
IQR (µm)3112472731
p-value0.1520.117
Form 2Median deviation (µm)9411427856212
IQR (µm)761579488124
p-value0.5760.000
Publisher’s Note: MDPI stays neutral with regard to jurisdictional claims in published maps and institutional affiliations.

