Article

Combining Virtual Reality and Organizational Neuroscience for Leadership Assessment

by
Elena Parra
1,*,
Irene Alice Chicchi Giglioli
1,
Jestine Philip
2,
Lucia Amalia Carrasco-Ribelles
3,
Javier Marín-Morales
1 and
Mariano Alcañiz Raya
1
1
Instituto de Investigación e Innovación en Bioingeniería (i3B), Universitat Politécnica de Valencia, 46022 Valencia, Spain
2
College of Business, University of New Haven, 300 Boston Post Rd, West Haven, CT 06516, USA
3
Fundació Institut Universitari per a la Recerca a l’Atenció Primària de Salut Jordi Gol i Gurina (IDIAPJGol), 08007 Barcelona, Spain
*
Author to whom correspondence should be addressed.
Appl. Sci. 2021, 11(13), 5956; https://doi.org/10.3390/app11135956
Submission received: 21 May 2021 / Revised: 22 June 2021 / Accepted: 23 June 2021 / Published: 26 June 2021
(This article belongs to the Special Issue Applications of Virtual, Augmented, and Mixed Reality)

Abstract

:

Featured Application

The use of virtual serious games, biological implicit measures, and machine learning techniques for the assessment of leadership styles can enhance traditional assessment by integrating behavior-based information.

Abstract

In this article, we introduce three-dimensional Serious Games (3DSGs) under an evidence-centered design (ECD) framework and use an organizational neuroscience-based eye-tracking measure to capture implicit behavioral signals associated with leadership skills. While ECD is a well-established framework used in the design and development of assessments, it has rarely been utilized in organizational research. The study proposes a novel 3DSG combined with organizational neuroscience methods as a promising tool to assess and recognize leadership-related behavioral patterns that manifest during complex and realistic social situations. We offer a research protocol for assessing task- and relationship-oriented leadership skills that uses ECD, eye-tracking measures, and machine learning. Seamlessly embedding biological measures into 3DSGs enables objective assessment methods that are based on machine learning techniques to achieve high ecological validity. We conclude by describing a future research agenda for the combined use of 3DSGs and organizational neuroscience methods for leadership and human resources.

1. Introduction

The importance of leadership styles as predictors of organizational effectiveness is an important topic in organizational behavior research. Traditional leadership theories have focused on the relationship between leaders and employees as being passive. However, more recently, contemporary leadership theories have emphasized a mutual relationship between leaders and employees, wherein leaders obtain employee feedback and adjust their own behaviors and thereby increase the level of mutual trust [1,2]. These theories emphasize employee skills and encourage employees to question current systems and situations to solve problems in rational and creative ways [2]. According to this theoretical framework, a dichotomous approach for the classification of leadership styles has been proposed, namely “task orientation” vs. “relationship orientation” [3] or “concern for people” vs. “concern for task” [4].
Task-oriented leadership (TOL) refers to leaders being more focused on getting tasks done for achieving certain performance goals. Related behaviors in TOL include planning tasks and roles, organizing employees and resources efficiently, and monitoring progress within the team [5,6]. Conversely, relationship-oriented leadership (ROL) refers to leaders fostering positive relationships, good communication, motivation, collaboration, and teamwork among team members. The main behaviors in ROL relate to supporting people’s needs and motivating them, facilitating effective communication, and recognizing teamwork [7].
Conventional TOL and ROL assessment in organizational leadership research has relied on self-reported measures, which present numerous limitations and biases with regard to ecological validity and response veracity [8,9,10]. Specifically, self-reported measures and laboratory settings are often decontextualized from real situations and are not conducive to the display of real-life behavioral responses [10]. Experimental situations can result in anxiety and social desirability bias in the participant to provide a positive image, which results in a negative effect on the veracity of the responses [8,9]. In addition, in the traditional approach, each self-reported scale corresponds to measuring one skill or construct, thereby limiting our ability to capture more than one variable at a time. To overcome these limitations, we propose an assessment method that is based on non-verbal cues and combines the use of a three-dimensional serious game and biological implicit measures used in organizational behavior research.

2. Literature Review

2.1. Evidence-Centered Design for Serious Games

With the introduction of computer games in the 1970s, which produced a rapid increase in playing time among children as well as adults, and thanks to their appeal and playability, researchers began developing “serious” games (SGs) with specific purposes that went beyond common entertainment [11]. Serious games (SGs) are currently applied as an assessment methodology in training for a wide range of skills in various fields, including education, health, and the military, and have shown positive results [12,13,14]. In organizational leadership research, few studies have investigated the effectiveness of SGs as educational training tools to improve leadership skills [15,16]. Moreover, leadership training studies have mainly used two-dimensional SGs, characterized by flat graphics and lower realism, as opposed to using three-dimensional SGs (3DSGs), which include stereographic depth graphics and a higher sense of realism [17]. 3DSG design features, based on fantasy or simulated worlds, storytelling, challenges and rewards, and advanced technologies that allow developing interactive three-dimensional environments, can stimulate user involvement and motivational engagement, provide more ecologically valid assessments and training, and reduce test anxiety and biases as compared to traditional approaches. Furthermore, the 3DSG approach is a stealthy and non-verbal way to assess various behaviors (e.g., decision making, time taken to perform a task) during gameplay, is capable of measuring a wide range of skills, and can capture a vast amount of data over time. Because serious games involve achieving a set of goals while navigating complex situations, they can be used in companies for employee training purposes to develop problem-solving skills.
Evidence-centered design (ECD) has been proposed as a valid and reliable framework of reference for the development of automated stealth assessment test designs [16,18]. ECD is built on the premise that a test is a measurement instrument with which specific claims about the test scores are associated, and that a good test is a good match of the test items and the test takers’ skills. Hence, ECD was conceived in the educational field to improve the validity and reliability of test measures for learners. The ECD framework defines three interconnected core models, namely the competency model(s), structural model(s), and task model(s). The competency model refers to the theoretical skills and abilities (unobservable indicators) that researchers want to measure using the game; the structural model identifies the multifaceted behaviors (observable indicators) that can reveal theoretical skills and abilities; and the task model refers to the tasks or situations that can activate behaviors related to the skills and abilities that researchers intend to measure. Therefore, ECD and 3DSGs allow for the development of various contextual situations, thereby providing greater predictive validity and less bias than traditional assessments [16,19,20,21].

2.2. Biological Implicit Measures of Leadership Behavior

As mentioned previously, leadership styles have been mainly studied using self-reported measures, and only a limited number of studies have taken into consideration the role of implicit leadership signals. Scholars have deemed such an overreliance on explicit measures to be problematic and have suggested that there are opportunities to research implicit measures complementary to conventional organizational behavior surveys or qualitative methods in order to aid theory building and to better understand the role of physiological processes in leader behaviors [22]. Hence, to further leadership research, we assess ROL and TOL styles, which are often measured with self-reported questionnaires, using organizational neuroscience (ON) methods. Behavioral management scholars have used neuro-physiological techniques like heart rate variability, eye tracking, Electroencephalograms (EEG), and Galvanic Skin Response (GSR) in leadership and team research [23,24]. Following previous scholarly works like those by Hannah et al. [25], we also apply a multi-method approach, combining 3D serious games in a virtual reality environment, ON eye tracking, and machine learning to capture and analyze these leader behavior variables. Indeed, leaders’ behaviors could be seen as an outcome of dynamic interactions in social situations, which can depend on various explicit and implicit factors such as decision-making behavior, nonverbal body language, gestures and postures, verbal cues, and eye-gaze patterns. In this regard, the flexibility allotted by the ECD framework is helpful in developing various contextual scenarios in a virtual environment that would require individuals to apply various decision-making behaviors. For this study, we focus on decision-making and utilize Rowe and Boulgarides’ decision style theory [26] to generate the hypothesized relationships between leader behaviors and decision-making styles. According to the theory, an individual’s decision-making style would depend on how one comprehends and perceives the situation and chooses to respond to stimuli. Individual decision-making styles tend to have a high task focus or relationship focus. The cognitive complexity of one’s low tolerance for ambiguity often relates to the individual focusing on tasks and structure, whereas leaders who primarily concern themselves with human and social values tend to focus on relationships [27]. Rowe and Boulgarides [26] linked their decision style typology to individual needs of task and relationship orientation and posited that directive decision-makers are primarily driven by their need for power and behavioral decision-makers are concerned with the need for affiliation [28,29]. Because directive decision-makers have a low tolerance for ambiguity, they have a strong desire for structure, rules, and procedures [27], which is considered similar to initiating structural leadership behavior [30]. An instance of directive decision-making would involve giving clear orders to subordinates and executing the decisions made. While behavioral decision-makers also have a low tolerance for ambiguity, their concern relates to maintaining good relationships by offering psychological support and encouragement to followers in complex situations [27]. An instance of behavioral decision-making involves communicating consistently with followers and seeking and utilizing their feedback when making decisions. Furthermore, we hypothesize that the relationship between leadership and decision-making styles would be detected in an ECD/3DSG framework using ON methods. Social eye-gaze patterns refer to the implicit and automatic tendency to focus one’s attention on others’ behaviors and to interpret social cues of relevance for decision-making behavior (for a review, see [31]). According to social attention theory, visual attention allows people to recognize each other, communicate their mental states, and predict others’ behaviors [32]. Social attention could also be relevant in solving issues relating to teams, such as selecting a leader to follow. Preliminary scientific evidence showed that people were able to predict leadership cues from watching muted speech clips [23,33]. Advanced methodologies like eye-tracking tools can capture subjects’ attention orientation toward stimuli and spontaneous eye-gaze patterns during social situations [33,34]. These tools are capable of providing moment-to-moment indicators of an individual’s rapid and automatic attentiveness to leader cues. Specifically, eye-gaze patterns can capture three indicators: (a) attention orientation to someone or something through the number of fixations (attention directed to stimuli), (b) attentional engagement through duration of fixations (level of processing), and (c) attention patterns to which the stimuli are explored.
Based on this premise, we conduct a study to assess two leadership styles through the combined use of a serious game (as a new behavioral, interactive, and stealth method), and eye-gaze technology. A detailed description of the serious game is provided in the Section 3. The goal of this study is to differentiate participants with high and low scores in leadership styles, captured through their behavioral responses (i.e., decision-making behaviors and eye-gaze patterns) during gameplay as well as through a traditional self-reported measure. Additionally, we apply machine learning (ML) methods to the dataset to explore (a) if, through these data, it is possible to discriminate TOL/ROL styles, and (b) which parameters better discriminate between the two styles in each variable. We also note that the game presented in this study was used by the Neurosteps company (https://neurosteps.com/, accessed on 15 June 2016), with the goal of evaluating leadership styles of professionals who were responsible for leading teams. The usage of this game produced satisfactory results and provided valuable evaluations on many internal aspects, like 360 degree evaluations through skills interviews.
The two main hypotheses tested were as follows: (1) participants’ decision-making behaviors, captured during their entire 3DSG experience, will allow for the classification of TOL and ROL styles; (2) participants’ fixation duration time and number of fixations, both captured through eye tracking during their entire 3DSG experience, will allow for the classification of TOL and ROL styles.

3. Materials and Methods

3.1. Participants

The study sample consisted of 56 subjects, of which 24 were female and 32 were male, with an average age of 38.8 years (SD = 8.2). There were 16 university students and 40 professionals from consulting, pharmaceutical, and banking sectors, all of whom identified as Caucasian. The industry professionals were university educated. Participants submitted their written consent, were well rested, and no participant had consumed alcohol for 12 h or other stimulating beverages like coffee for 4 h prior to their lab appointment. No one reported using medications or drugs. The study was approved by the Universitat Politécnica de Valencia’s (Spain) ethics committee and followed the conventions of the 1964 Declaration of Helsinki.

3.2. Leadership Assessment

The Blake and Mouton Managerial Grid Leadership Self-Assessment Questionnaire [35], which is an 18-item self-reporting scale and measures a respondent’s leadership style across relationship and task orientation, was administered online to each participant. Participants rated the extent to which the scale statements applied to them, using a 5-point Likert scale (1 = never and 5 = always). The task orientation index in the scale comprises scores from 0 to 20, and higher values indicate a greater degree of task orientation. The relationship orientation index comprises scores from 0 to 15, with higher values indicating greater people orientation. The scale was tested for reliability using Cronbach’s Alpha (α) and received a score of 82, which is considered a satisfactory indicator of internal consistency.

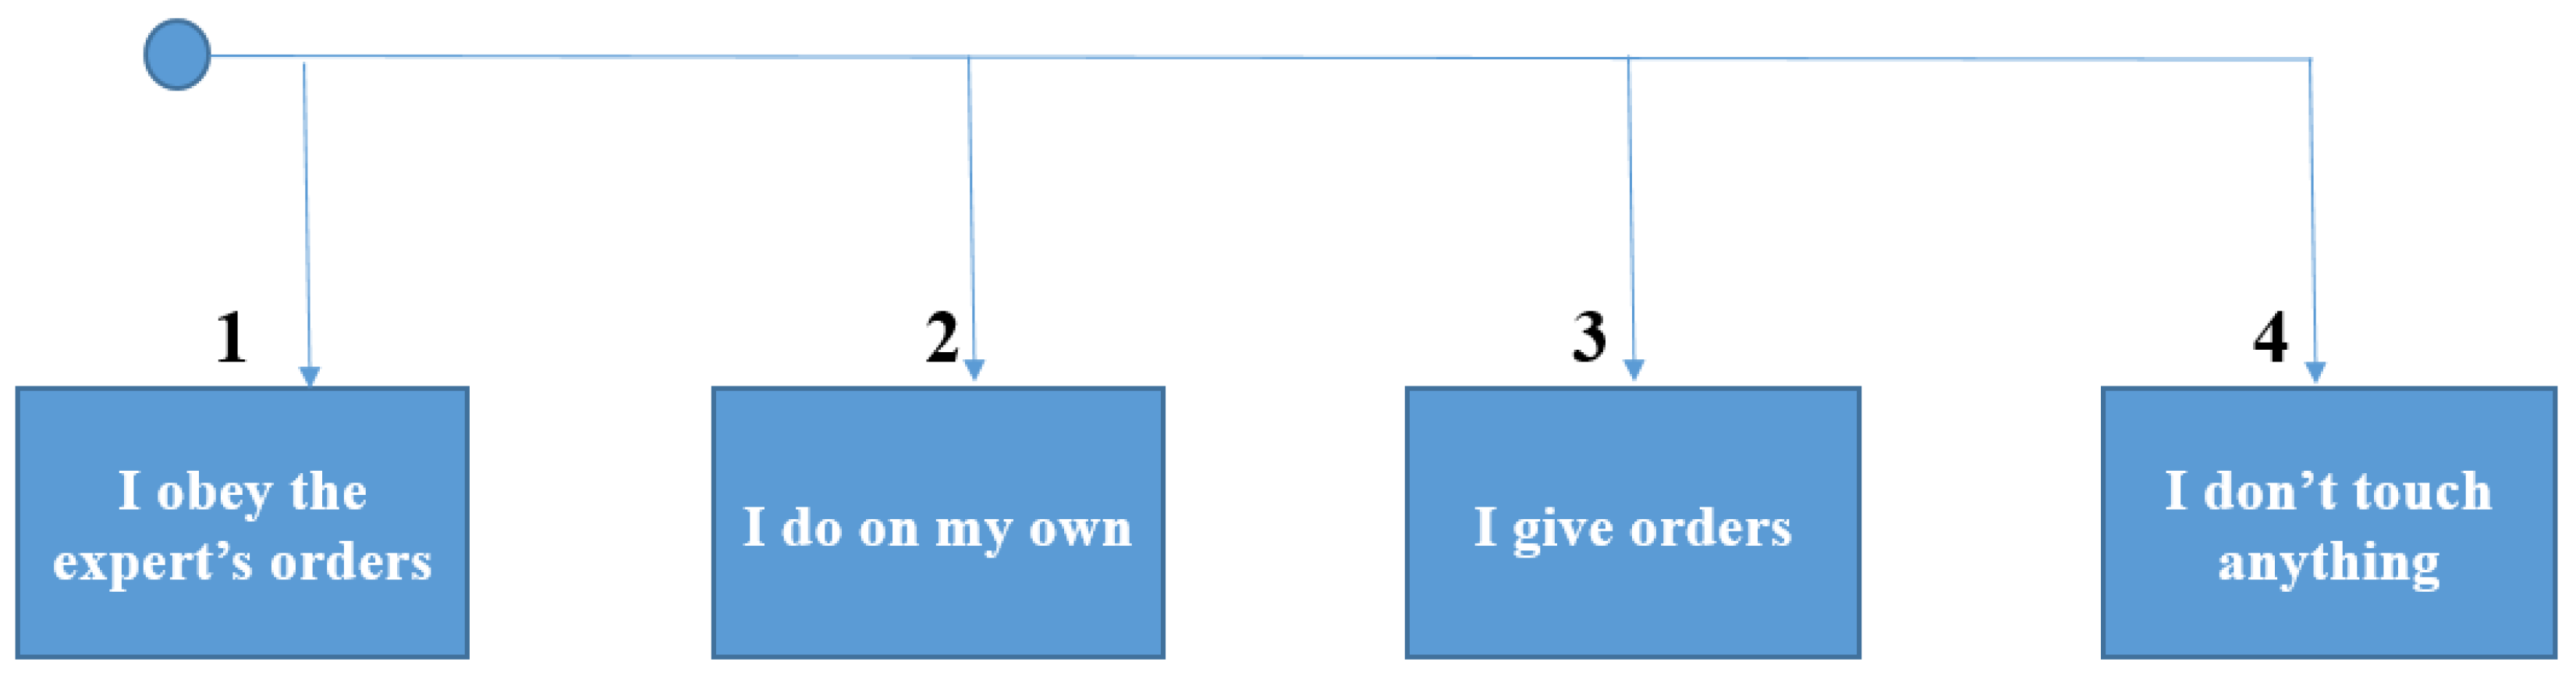
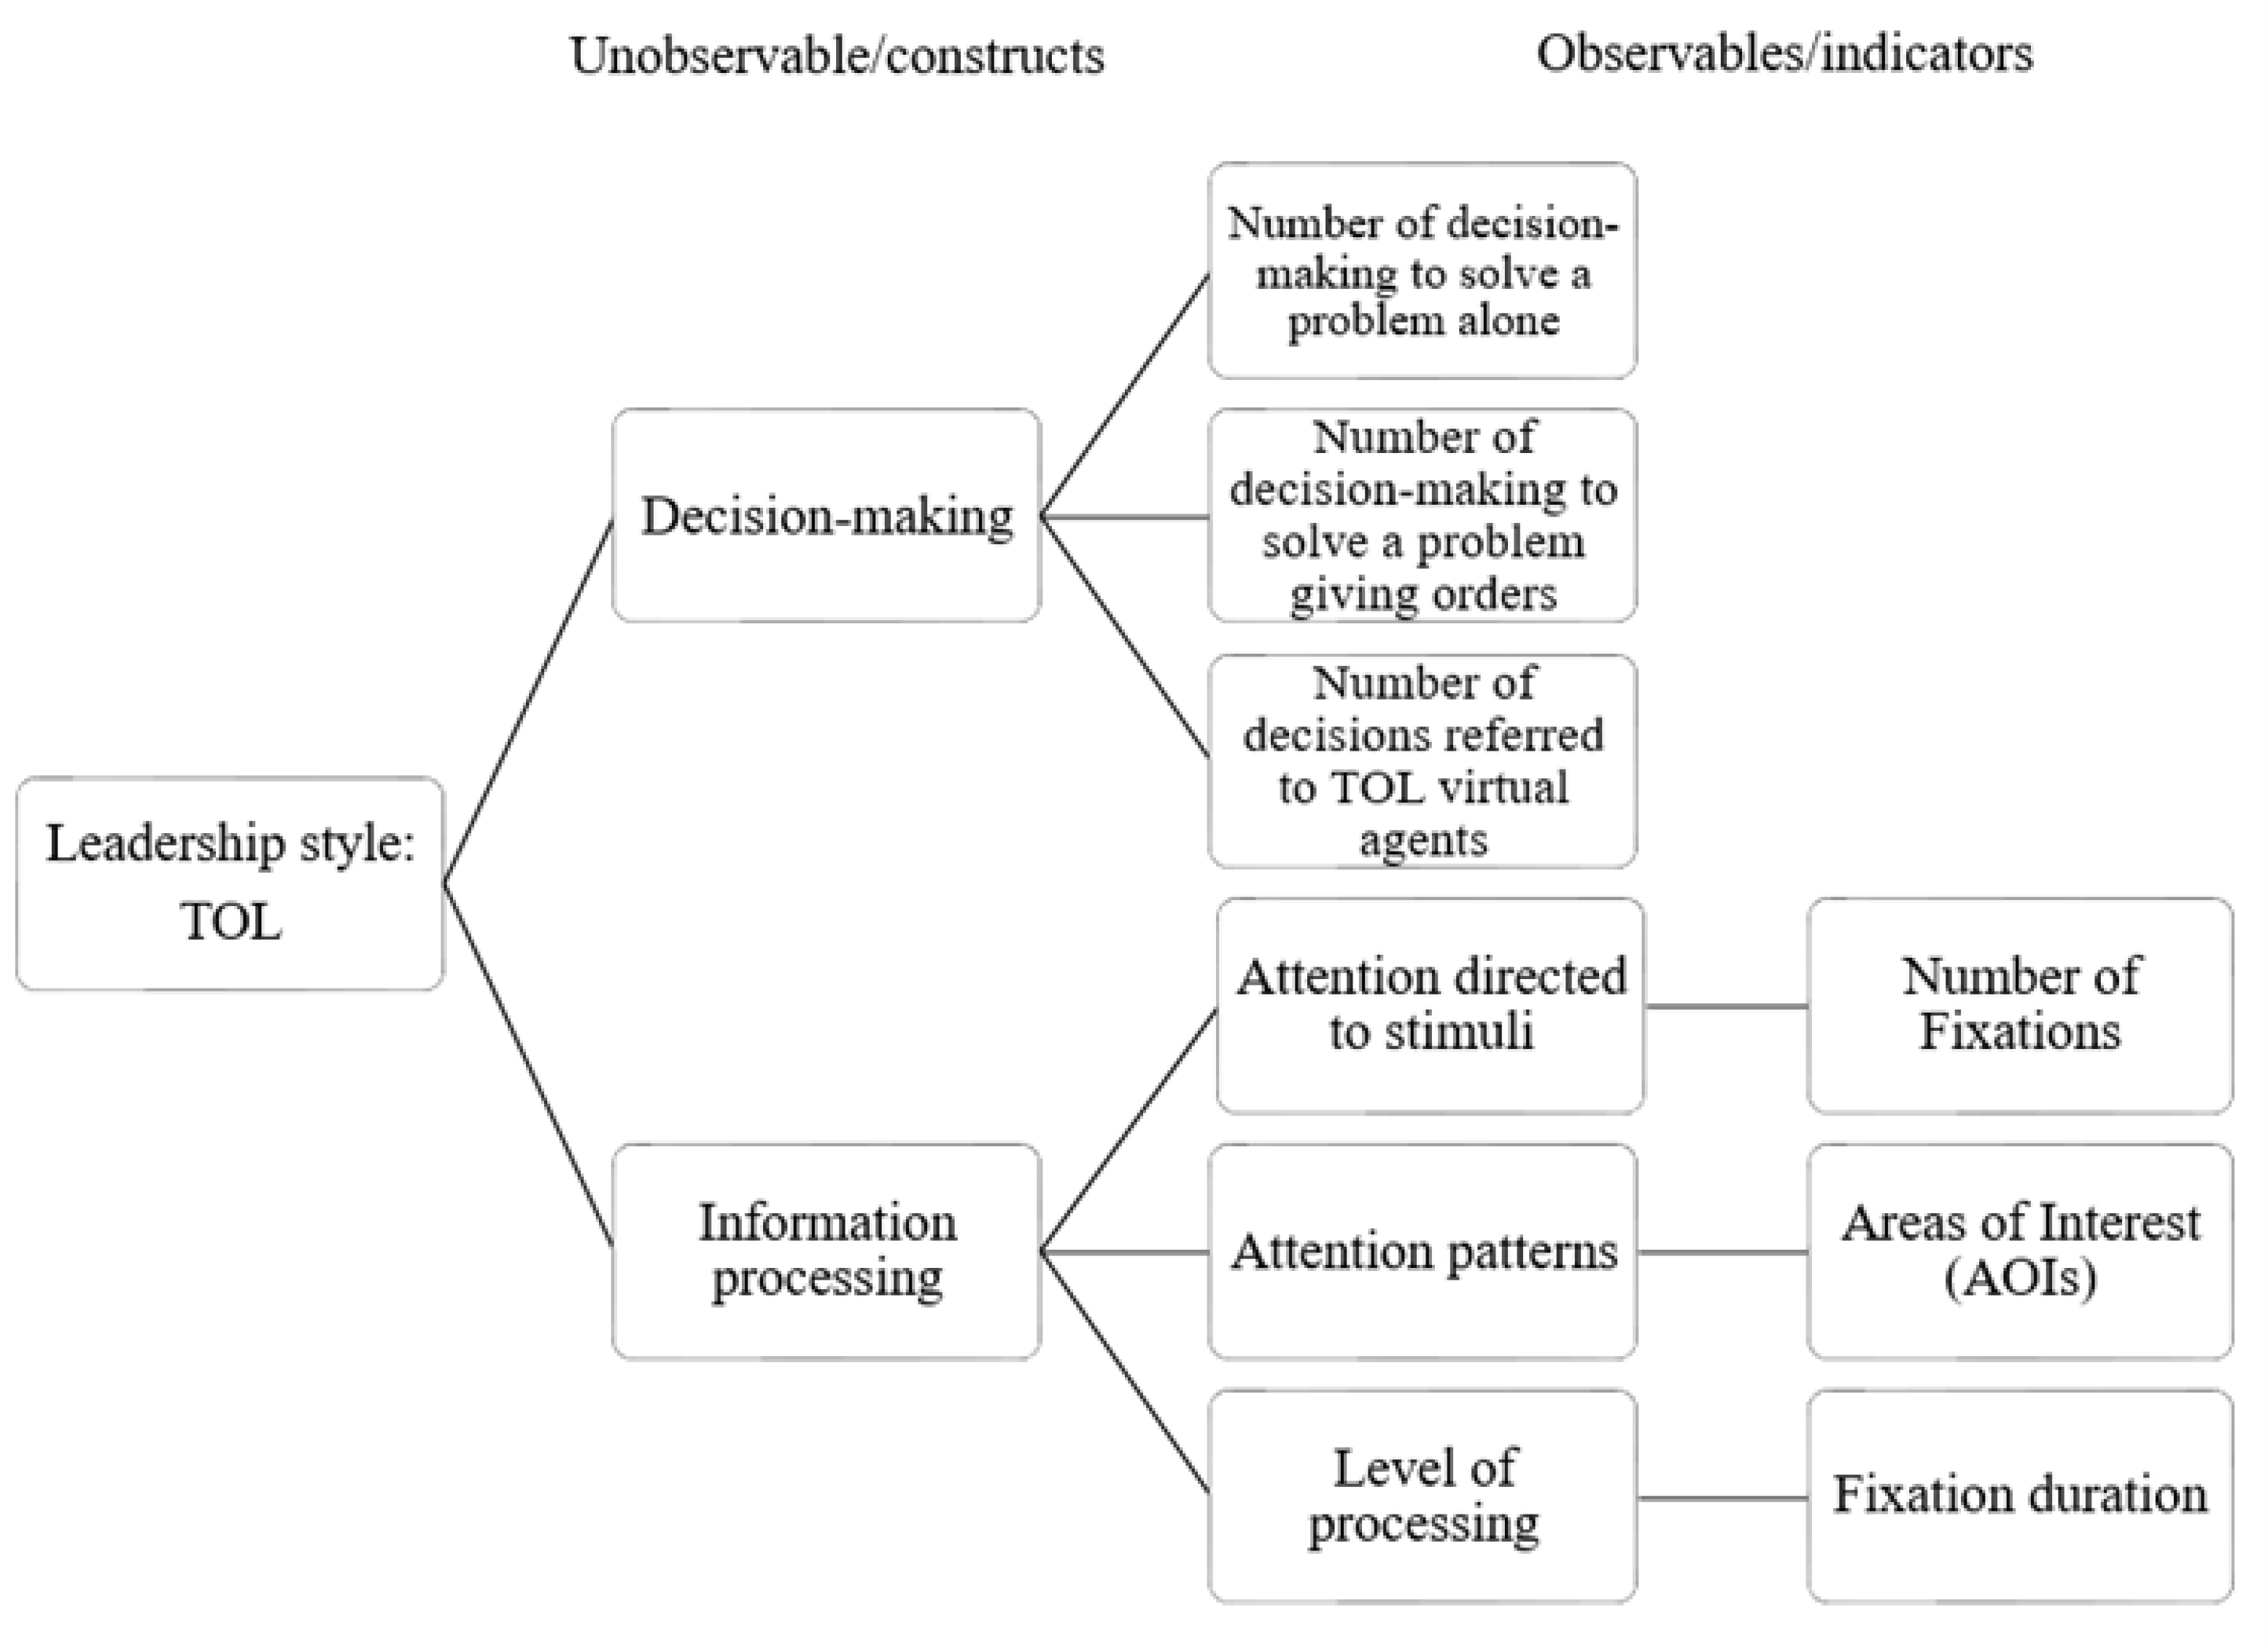
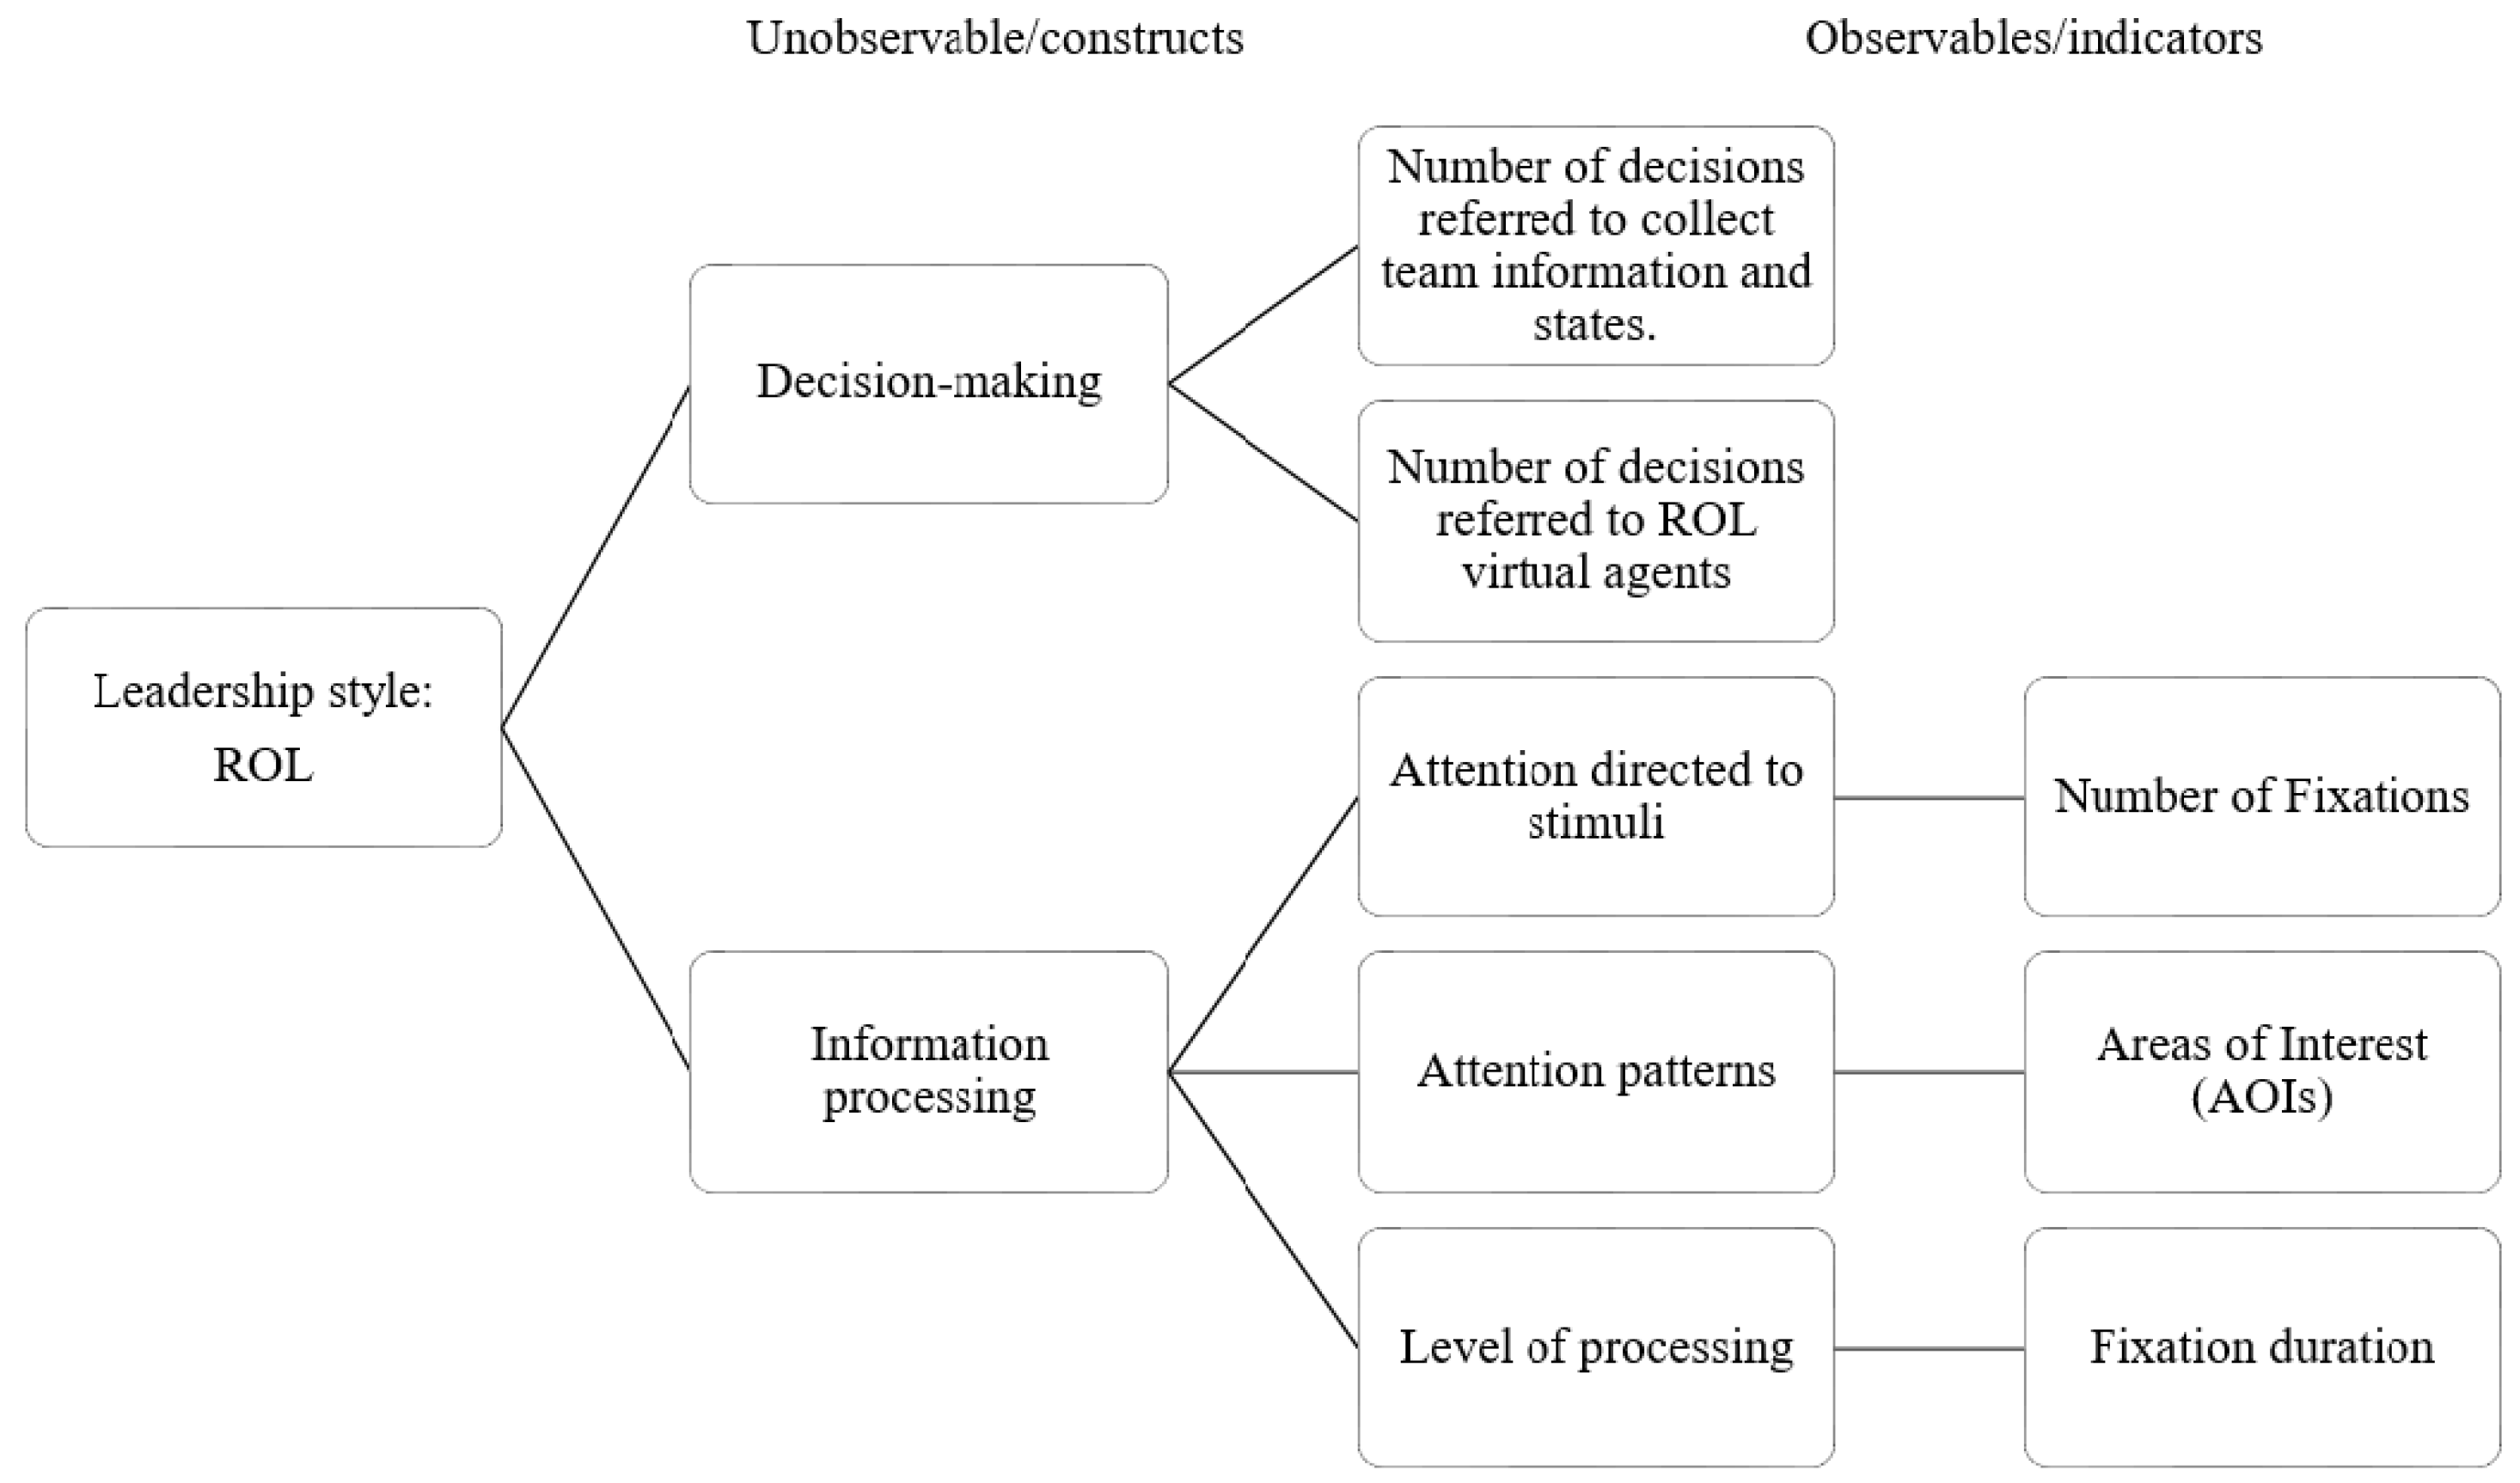
3.3. Serious Game Task Modeling

A story narrative, specifically designed for leadership style assessment, was created in the serious game. We scripted and developed the storyline to capture TOL and ROL responses. The game scenarios take place in a sailing ship, whose goal was to reach a destination by solving several problems during the course of sailing (for more details, see the Supplementary Materials).
The 3DSG involved 4 adult (2 women and 2 men) virtual agents, who were created with specific personality traits and individual competencies that pertained to TOL and ROL styles. Each character was defined and named as an expert, an organizer, an emotional and communicative individual, and a strategist (Figure 1). According to their characteristic profiles, the expert virtual agent (a male) presented logical, analytical, mathematical, and technical thinking styles and behaviors that displayed high intelligence and critical competitiveness (typically classified under TOL). The organizer virtual agent (a female) was characterized by structured and sequential thinking, planning and organizing, presented emotional behaviors, and was introverted, faithful, and tended to display certain manic behaviors (we classified these under TOL). The emotional and communicative virtual agent (a male) was characterized by ideals, was emotional and sensitive to both his own and others’ problems, was easy to communicate with, was poorly organized, displayed a lack of control over himself, and had little independence. In addition, this virtual agent was outgoing, talkative, spontaneous, and playful (we classified these under ROL). Lastly, the strategist virtual agent (a female) was characterized by innovative and holistic thinking and presented creative solutions to everyday problems (we classified her as under ROL).
The 3DSG consisted of 10 scenarios, with a problem situation being presented by one of the virtual agents to the others as well as to the study participant at the beginning of each scenario (for more details, see the Appendix A). To find a solution to a problem, the participant had to make several decisions along the way, with each decision leading the storyline to a different narrative. The new narrative would be based on the virtual agents’ personality traits and competencies. Each decision to be made was developed according to a systematic method that was based on four decision-making behaviors in literature: (a) communication; (b) execution; (c) giving orders; and (d) doing nothing. The communication decision-making style consisted of the leader asking for and collecting information from other team members and always considering their position or opinions before making the final decision. In such a case, the decision-making process was highly related to the ROL style, wherein the group’s opinions are more important for the leader than the execution of actions and the time it takes to solve the problem. Execution decision-making consisted of the leader taking initiative and choosing an action to implement to solve the problem, without considering the opinions or emotional state of the group. In this case, we related the decision-making process to both ROL and TOL styles, as the focus was on solving the problem. Next, in the giving orders decision style, while the opinions of the team are not particularly relevant, the leader does review them. People orientation is low here; however, task orientation is not high, because the leader does not execute the action. We consider this style as being similar to the authoritarian leadership style, wherein there is little consensus from team members. Finally, the user also had the option of doing nothing, where their behavior was based in passivity, which is highly characteristic of passive-avoidant leadership.
The following section introduces the TOL/ROL competency models and their relative indicators. For each competency model, we present a graphic model of the indicators. Unobservable indicators are the theoretical leadership constructs related to decision-making behavior and implicit information processing, whereas observable indicators are the data gathered from user performance and visual attention behaviors (for details, see Appendix B).
The 3DSG system was developed using Unity 5.5.1f1 software with c# programing language in the Visual Studio tool.

3.4. Experimental Procedure

The study consisted of a 60 min session, in which the participants played the 3DSG. The room in which the experiment took place was equipped to avoid distractions. At the beginning of the session, the eye-tracking application was started manually, and the calibration was carried out. Then, the 3DSG began. The total play duration depended on participants’ decision times. The average play duration was noted to be between 20 and 40 min. The application was carried out on an NVIDIA GeForce Gt 740 laptop, and the subject was at an average distance of 60 cm to ensure the correct collection of eye-tracking information. The size of the monitor was 17 in and had a resolution of 1920 × 1080.

3.5. Eye-Tracking Measurement and Data Processing

Visual attention was measured using the eye-tracking device Tobii EYEX [36], which collects eye gaze at 60 Hz. The EyeX SDK for Unity was used to integrate data collection in the virtual environment. The SDK provides user fixations, which is defined as the action of fixing one’s eyesight on a particular point of the environment. Number and duration of fixations as well as the established a priori AOIs were interpreted by Unity; it analyzed whether the participant fixed their sight on a particular virtual agent, while considering the agent’s role at that moment. Specifically, for each eye-tracking (ET) variable, two feature roles were defined in accordance with the situation and virtual agents. Those roles were (a) basic and (b) behavioral. Basic roles consisted of 3 ET features (active, passive, and background) captured during the entire 3DSG. Active role refers to the virtual agents and/or virtual elements that were the protagonist in a situation; passive role refers to the virtual agents and/or virtual elements that are present in the situation but without a protagonist role in that situation; and background role refers to the remaining virtual elements in the virtual scenario (Figure 2).
In addition, five behavioral roles were defined, depending on the situation and on the specific behaviors displayed by each virtual agent in each situation. Those behavioral roles were (a) informative role—participant eye gaze focused on the virtual agents from whom the participant could obtain more information to make the decision; (b) empathy role—participant focused their gaze on those agents who explicitly asked for help or agents who had emotional needs; (c) decision-making role—participant focused eye gaze on those virtual agents with whom they could make a direct decision; (d) authoritarian role; (e) supportive role—participant focused eye gaze on the agent with supportive personality traits. We note that these roles could change throughout the game. For example, Figure 3 shows a situation in which the strategist (Susana) informs the other agents that she wishes to return to the hotel to pick up something; she does not wish to elaborate on it and asks the other agents to consider her feelings (show empathy).
Several variables were extracted during the course of the game (see Table 1). Specifically, 29 variables pertained to the decisions made by participants in the 10 different situations. These included aspects like which action they chose to perform in a particular situation, which character they preferred to perform an action with, and the number of times they asked the characters questions during a particular situation. Fifty-six variables were extracted from the eye-tracking sensor. These variables collected four different metrics (see Table 2), which could be related to either which virtual agent the participant was looking at or to the role the virtual agent had in that moment.

3.6. Statistical Analysis

One person did not complete the questionnaire, and hence, answers from the remaining 55 subjects were analyzed. A multivariate outlier analysis [37] was performed to detect and remove any participant whose leadership score could be considered as extreme. For this purpose, the Mahalanobis distance between participants was calculated using their self-reported ROL and TOL scores. Then, the probability of this distance belonging to a Chi-square distribution was calculated. If this probability was below 0.01, the participant’s scores were defined as outliers, whereupon the participant was excluded from further analysis. After such an analysis, four participants were removed resulting in a final sample size of 51.
Both leadership subscales were categorized into high or low scores based on the mean of each variable, as they were normally distributed (p > 0.05, Shapiro-Wilk test). This was a necessary step for building the Machine Learning (ML) models, described in the following section. This categorization was then used in describing the variables and calculating the mean and standard deviation of low and high scores in each group. Furthermore, contrasts of hypotheses were performed to find any statistically significant difference that could be related to leadership scores. Using the categorization of the leadership scores to define two groups, different statistical tests were applied to the variables from the RV, depending on their nature (numerical/categorical) and normality (p-value of Shapiro-Wilk test). As a first explorative description of ROL and TOL, statistical tests were performed considering both high and low levels. If the variable was categorical, a Chi-square test was performed. If the variable was numerical, either t-test or Wilcoxon test was performed, according to its Gaussianity. Statistical significance level was set as alpha < 0.05.

3.7. Machine Learning

Machine Learning was used to build leadership recognition models based on the behaviors recorded in the serious game. First, a feature selection was performed to reduce the dimensionality. To prevent overfitting, the maximum number of variables that a model could select was set to 15. The feature selection was performed using a backward sequential wrapper [38]. This method starts building a model, using an ML algorithm with all the available features, and measures its performance. Then, at each step, a feature that decreases the performance measure (i.e., Cohen’s Kappa) is removed. Once the set of best features was obtained, hyperparameter tuning was performed. Different hyperparameters were optimized for each ML algorithm (Table 3). Ten equal-sized values in the range defined were evaluated. Since this tuning was limited and not continuous, the final hyperparameters were not optimal. This also helped to avoid overfitting.
After obtaining the best set of features and hyperparameters for each ML algorithm, the model was trained and validated and its metrics (i.e., accuracy, Cohen’s Kappa, Sensitivity (True Positive Rate, TPR) and Specificity (True Negative Rate, TNR)) were obtained. Feature selection, hyperparameter tuning, and model building were all validated using a repeated cross-validation (5 folds, 2 times). Machine learning and statistical analyses were performed in R (version 3.6.1).

4. Results

4.1. TOL and ROL Description

Participants scored 9.43 ± 3.10 on ROL and 6.64 ± 2.19 on TOL. Table 4 shows the description of the two groups (high/low) into which these subscales were divided. A total of 55% of participants had a high score on ROL subscale, while 49% scored high on TOL.

4.2. Statistical Significance of Leadership Styles in the Serious Game

The categorized scores were used to analyze the differences between the high and low leadership groups (Table 5). Participants with a high ROL score tended to spend more time looking at virtual agents when they played a passive role. They looked at the organizer (Martina) for less time. They also tended to not pick any team in situation 5, whereas participants with a low ROL score picked the negative team more often. For TOL, participants with higher TOL scores tended to fix their sight a greater number of times on virtual agents who played a supportive role.

4.3. Automatic Leadership Recognition Models

The leadership recognition models for ROL and TOL achieved 79% and 76% accuracy respectively, as shown in Table 6. In both cases they achieved a kappa higher than 0.5, which is seen in the balance between TPR and TNR. Therefore, the models could correctly identify each group of participants in terms of TOL and ROL with more than 70% accuracy. In terms of the feature selected, the ROL model selected 9 out of its 14 features from among those variables that provided information about the decisions made by the participant (Table 7). The TOL model, meanwhile, selected 7 out of 10 features from those that reported information about the role of virtual agents when participants looked at them (Table 8).

5. Discussion

The current study utilized a 3DSG in a virtual reality environment based on ECD and an ON-based eye-tracking measure to capture the behavioral signals associated with task and relationship leadership. In addition, machine learning was used to build the recognition models, generated from the subjects’ behavioral responses recorded in the serious game. Thus, we offered a multi-method approach to capture and analyze these leader behavior variables. A goal of this study was to emphasize neuroscience methods as a promising tool for assessing behavioral styles of leadership in complex organizational situations. A 3DSG provides behavioral researchers with an avenue to simulate complex scenarios in which managerial decision-making occurs. By seamlessly integrating biological measures into the 3DSG, we showed that such a hypothesis-driven research design can provide objective assessments of leader behaviors with improved ecological validity as compared to self-reported measures. The study included a preliminary analysis of the frequency distribution (high vs. low) of TOL and ROL to investigate differences between the two styles and a broad set of supervised ML models combining decision-making behaviors and eye-gaze patterns to evaluate the discriminability between TOL and ROL. Results can be discussed based on five points: (1) the significant differences between TOL and ROL (high vs. low scores) measures; (2) the use of ML methods for TOL/ROL style discrimination and the features that better discriminate between the two styles; (3) theoretical implications; (4) practical implications; and (5) limitations and future directions.

5.1. High and Low TOL/ROL Differences between Measures

One goal was to identify differences in terms of capturing TOL and ROL in traditional measures and in the 3DSG. Using traditional measures, our findings show that 55% of participants had a high score on the ROL subscale, while 49% scored high on TOL. Statistically significant differences were seen in high and low ROL and TOL styles, suggesting that there were a higher number of participants with high TOL and ROL styles than with low scores. This suggests that the traditional measure was able to define participants with TOL and ROL styles adequately. Starting from this base point, the 3DSG results showed that both styles could be differentiated mainly through the biological implicit measures related to social eye-gaze patterns. The results explained in Section 4.2 seem to suggest that the interactive and dynamic 3DSG is able to provide deeper realistic behaviors, reflecting the complexity of real life behaviors. Consistent with the theoretical framework of ROL-style behaviors, which relate to supporting and motivating people, fostering communication, and recognizing teamwork [7], our results also revealed a higher attention by participants to the passive role agent, while they focused less on the organizer virtual agent (Martina). On the other hand, participants with high TOL gave greater attention to supportive role agents, suggesting the importance for TOL individuals to plan and organize tasks better, along with monitoring the team [5,6]. Regarding decision-making behaviors, participants with a higher ROL style tended to communicate more during interpersonal conflict situations than in problem-solving situations during the 3DSG. This result is, once again, consistent with leadership literature, wherein people with high ROL focus encourage positive interpersonal relationships, collaborations, and teamwork [7]. According to our results, the decision-making behaviors and the biological implicit measures captured during the 3DSG experience were able to classify TOL and ROL styles, thereby supporting our first hypothesis. Furthermore, our results clearly show that decision-making behaviors seem to be more related to ROL and eye-gaze patterns to TOL.

5.2. ML Methods for TOL/ROL Style Discrimination and Features that Better Discriminate between the Two Styles

The leadership recognition models for ROL and TOL confirmed the previous results, achieving 79% and 76% accuracy, respectively, balanced in terms of sensibility and specificity. This suggests a precise identification of each style and supports our second hypothesis. Furthermore, in terms of feature selection, the ROL model selected 9 out of 14 features from participants’ decision-making behaviors, of which four related to communication and execution and one related to giving orders. On other hand, the TOL model selected 7 out of 10 features from eye-gaze patterns, which mainly related to attention orientation toward someone through the number of fixations (attention directed to stimuli) and attentional engagement through duration of fixations (level of processing; Eckstein et al., 2017). Specifically, the seven features selected are more related to the behavioral roles according to the situations (5 of 7) and less related to an active/passive role in a specific moment of a situation (2 of 7), suggesting that, depending on the problem that needs to be solved, TOL individuals focused their visual attention more intently before the final decision. This is consistent with TOL, which refers to leaders being more focused on getting tasks done to achieve specific performance goals [5,6].

5.3. Theoretical Implications

In applying a non-obtrusive neuroscience method (i.e., eye-tracking measure) and a virtually simulated environment to gauge behavioral responses in complex situations, we extend decision-making theory to integrate directive and behavioral decision-making styles with an individual’s task and social orientation. With most empirical studies assessing leader behaviors and decision-based responses using subjective self-reporting measures, we contribute to the related literature by combining neuroscience and VR, following studies like Hannah et al. [25], who also employed ON methods to capture adaptive decision-making and leader self-complexity. As strategic decision-making is theorized to be related to an individual’s cognitive complexity [39], our application of an eye-tracking mechanism helps reveal socio-cognitive responses (manifested through mean time and count of fixated gaze) when people are faced with a complex situation. Hence, we attempted to establish a non-obtrusive neurological basis for Rowe and Boulgarides’ decision style theory [26]. Furthermore, we extend the works of Gerpott et al. [23], who utilized social attention theory to study emergent vs. non-emergent leaders using eye-gazing patterns and suggested conducting future research to test other assumptions about eye gazing relating to effective leadership. In this regard, our study contributes to this theory, as we apply this method for TOL and ROL. Moreover, our research is an empirical examination of the taxonomy of the eye-tracking research proposed by Meißner and Oll [31]. Following this taxonomy, the current study utilized the suggested eye-tracking measures to capture psychological constructs relating to emotional arousal.

5.4. Practical Implications

The present study’s implications for practice lie in whether and how the neurological foundations of an individual’s decision-making style can be retrained in cases where exhibited behaviors are counterproductive to the workplace. Behavioral scholars have argued for and against the relevance of brain plasticity in retraining and developing one’s brain in the context of negative work behaviors [40] and have offered that physiological and biological measures could help address negative behaviors through interventions [40]. Furthermore, similar study designs that employ fMRI or qEEG can help us understand how a leader’s decision-making styles adapt and evolve over their tenure in the organization. Eye-tracking technology has also been utilized in understanding job interviewer bias, wherein participants’ (who were acting as hiring managers) gaze patterns regarding a job candidate’s perceived negative attributes, like facial stigmas or physical imperfections, were measured [41]. Lastly, the application of serious games for organizational training and skill development of employees is also a key practical contribution of the current study.

5.5. Limitations and Future Directions

We note that the small sample size is a limitation of this study; this could compromise the generalizability of our theorized relationships. However, it should be noted that the goal of the study was not to achieve a predictive model that could be applied to a wide general population but to study the possibility of using the behaviors recorded from a serious game to recognize leadership styles. The study shows that machine learning can be used for this purpose. In terms of future directions, as a multi-method study that employs neurological methods and advanced technologies like VR and machine learning, this research is an initial step in studying individual behavioral responses, for both organizational leaders and employees, using non-traditional and newer techniques. There are also opportunities to study leader behaviors beyond ROL and TOL, such as transformational leadership and the associated cognitive mechanisms. To extend the use of VR and eye-tracking in behavioral management research, Meißner and Oll [31] suggest using ‘virtual humans’ to simulate interpersonal encounters during the job selection and interview process to understand interviewee eye movements (like avoiding eye contact) when experiencing stress during the job interview.

6. Conclusions

The current research focuses on the use of VR and implicit measures as a novel paradigm for leadership assessment. We assess ROL and TOL using a combination of psychometric, neurological, and technological methods. Specifically, we employ an interactive serious game in a VR environment as the input variable to assess whether an individual belongs to the ROL or TOL category and then use machine learning to analyze results and create a precise model fit for both leadership styles. In addition, we use an ON-based eye-tracking technique to capture individual subjects’ reactions when exposed to situations that necessitate them displaying either task or relationship leadership behaviors. We view the main contributions of this research as utilizing a more advanced 3DSG as opposed to 2DSG through an ECD framework and the contributions to social attention and decision-making theories.

Supplementary Materials

The following are available online at https://www.mdpi.com/article/10.3390/app11135956/s1, A glimpse of the story narrative can be found here—youtu.be/ks2Paya6x6M (accessed on 24 June 2021). The datasets generated for this study are available on request from the corresponding author.

Author Contributions

Conceptualization, E.P. and M.A.R.; methodology, E.P. and M.A.R.; validation, E.P.; formal analysis, L.A.C.-R. and J.M.-M.; investigation, E.P.; resources, E.P. and M.A.R.; data curation, L.A.C.-R. and J.M.-M. writing—original draft preparation, E.P., I.A.C.G., J.P. and L.A.C.-R.; writing—review and editing, I.A.C.G., L.A.C.-R. and J.M.-M.; supervision, M.A.R. All authors have read and agreed to the published version of the manuscript.

Funding

This research was funded by the Generalitat Valenciana funded project “Mixed reality and brain decision (REBRAND)” 502 (PROMETEU/2019/105).

Institutional Review Board Statement

The study was conducted according to the guidelines of the Declaration of Helsinki and approved by the Ethics Committee of the Polytechnic University of Valencia (Protocol code: P04_04_06_20).

Informed Consent Statement

Informed consent was obtained from all subjects involved in the study.

Data Availability Statement

The data presented in this study are available on request from the corresponding author. The data are not publicly available due to restrictions of privacy policies on sensitive data categories.

Acknowledgments

This work was supported by the Generalitat Valenciana funded project “Mixed reality and brain decision (REBRAND)” 502 (PROMETEO/2019/105).

Conflicts of Interest

The authors declare no conflict of interest.

Appendix A

Figure A1. Situation 1—Bad memory. Note. 1 = doing nothing; 2 = execution; 3 and 4 = communication.
Applsci 11 05956 g0a1
Figure A2. Situation 2—Abandonment. Note. 1 = execution; 2 = doing nothing; 3 and 5 = communication; 4 = giving orders.
Applsci 11 05956 g0a2
Figure A3. Situation 3—Poor connection. Note. 1 = execution; 2 = doing nothing; 3 and 4 = communication; 5 = giving orders.
Applsci 11 05956 g0a3
Figure A4. Situation 4—The letter. Note. 1= doing nothing; 2 = execution; 3 and 4 = communication.
Applsci 11 05956 g0a4
Figure A5. Situation 5—Symptoms. Note. Part I: 1 = doing nothing; 2 = giving orders; 3 = execution. Part II: Conflict: 1.A = Change in attitude: communication, 2.A = no change in attitude: giving orders, 3.A = change in attitude: communication; 1.B = no change in attitude: do nothing, 2.B = change in attitude: communication, 3.B = change in attitude: communication; 1.C = change in attitude: communication; 2.C = change in attitude: communication, 3.C = no change in attitude: execution and communication.
Applsci 11 05956 g0a5
Figure A6. Situation 6—Total calm. Note. 1 = execution; 2 = doing nothing; 3 = communication and giving orders; 4 = communication and consensus.
Applsci 11 05956 g0a6
Figure A7. Situation 7—Survival. Note. 1 = communication; 2 = execution; 3 = giving orders; 4 = doing nothing.
Applsci 11 05956 g0a7
Figure A8. Situation 8—The storm. Note. 1 = communication; 2 = execution; 3 = giving orders; 4 = doing nothing.
Applsci 11 05956 g0a8
Figure A9. Situation 9—The mourning. Note. 1 and 2 = communication; 3 and 4 = communication. 3 < 2 and 4 < 1 = giving orders; 3 < 1 and 4 < 2 = communication.
Applsci 11 05956 g0a9
Figure A10. Situation 10—The island and the award. Note. 1 and 2 = execution; 3, 4 and 5 = communication. 3 < 1, 4 < 1 and 5 < 2 = communication with the group; 3 < 2, 4 < 2, and 5 < 1 = giving orders.
Applsci 11 05956 g0a10

Appendix B

Figure A11. TOL competency model.
Applsci 11 05956 g0a11
Figure A12. ROL competency model.
Applsci 11 05956 g0a12

References

  1. Bass, B.M.; Avolio, B.J. Developing transformational leadership: 1992 and beyond. J. Eur. Ind. Train. 1990. [Google Scholar] [CrossRef]
  2. Dvir, T.; Eden, D.; Avolio, B.J.; Shamir, B. Impact of transformational leadership on follower development and performance: A field experiment. Acad. Manag. J. 2002, 45, 735–744. [Google Scholar]
  3. Fiedler, F.E. A theory of leadership effectiveness. In Mcgraw-Hill Series in Management; McGraw Hill Text: New York, NY, USA, 1967. [Google Scholar]
  4. Hersey, P.; Blanchard, K.H.; Johnson, D.E. Management of Organizational Behavior; Prentice Hall: Hoboken, NJ, USA, 2007; Volume 9. [Google Scholar]
  5. Manktelow, J.; Carlson, A. Leadership Style. Mind Tools Retrieved 2012, 2. [Google Scholar]
  6. Yukl, G. Leadership in Organizations, 5th ed.; Prentice Hall Inc.: New Jersey, NJ, USA, 2002. [Google Scholar]
  7. Anzalone, C. Differences between task-oriented leaders & relational-oriented leaders. Demand Media. 2012. Available online: https://smallbusiness.chron.com/differences-between-taskoriented-leaders-relationaloriented-leaders-35998.html (accessed on 24 June 2021).
  8. Grimm, P. Social Desirability Bias. In Wiley International Encyclopedia of Marketing; Wiley: New York, NY, USA, 2010. [Google Scholar]
  9. Nederhof, A.J. Methods of coping with social desirability bias: A review. Eur. J. Soc. Psychol. 1985, 15, 263–280. [Google Scholar] [CrossRef]
  10. Schmuckler, M.A. What is ecological validity? A dimensional analysis. Infancy 2001, 2, 419–436. [Google Scholar] [CrossRef] [PubMed]
  11. Kato, P.M.; de Klerk, S. Serious games for assessment: Welcome to the Jungle. J. Appl. Test. Technol. 2017, 18, 1–6. [Google Scholar]
  12. Bellotti, F.; Kapralos, B.; Lee, K.; Moreno-Ger, P.; Berta, R. Assessment in and of Serious Games: An Overview. Adv. Human-COMPUT. Interact. 2013, 2013, 1–11. [Google Scholar] [CrossRef] [Green Version]
  13. Pasquier, P.; Mérat, S.; Malgras, B.; Petit, L.; Queran, X.; Bay, C.; Boutonnet, M.; Jault, P.; Ausset, S.; Auroy, Y.; et al. A Serious Game for Massive Training and Assessment of French Soldiers Involved in Forward Combat Casualty Care (3D-SC1): Development and Deployment. JMIR Serious Games 2016, 4, e5. [Google Scholar] [CrossRef] [PubMed]
  14. Shute, V.J.; Wang, L.; Greiff, S.; Zhao, W.; Moore, G. Measuring problem solving skills via stealth assessment in an engaging video game. Comput. Hum. Behav. 2016, 63, 106–117. [Google Scholar] [CrossRef]
  15. Chatziantoniou, N.; Politopoulos, N.; Stylianidis, P. Designing and Developing an Educational Game for Leadership Assessment and Soft Skill Optimization. In Interactive Mobile Communication, Technologies and Learning; Springer: Cham, Switzerland, 2017; pp. 258–265. [Google Scholar]
  16. Vos, L. Simulation games in business and marketing education: How educators assess student learning from simulations. Int. J. Manag. Educ. 2015, 13, 57–74. [Google Scholar] [CrossRef]
  17. Giglioli, I.A.C.; Ripoll, C.D.J.; Parra, E.; Raya, M.A. Are 3D virtual environments better than 2D interfaces in serious games performance? An explorative study for the assessment of executive functions. Appl. Neuropsychol. Adult 2021, 28, 148–157. [Google Scholar] [CrossRef] [PubMed]
  18. Mislevy, R.J.; Almond, R.G.; Lukas, J.F. A brief introduction to evidence-centered design. In ETS Research Report Series; American Psychological Association (APA): Colombia, WA, USA, 2003; Volume 1, p. 29. [Google Scholar]
  19. Alcañiz, M.; Parra, E.; Giglioli, I.A.C. Virtual Reality as an Emerging Methodology for Leadership Assessment and Training. Front. Psychol. 2018, 9, 1658. [Google Scholar] [CrossRef] [PubMed]
  20. Giglioli, I.; Carrasco-Ribelles, L.; Parra, E.; Marín-Morales, J.; Raya, M.A. An Immersive Serious Game for the Behavioral Assessment of Psychological Needs. Appl. Sci. 2021, 11, 1971. [Google Scholar] [CrossRef]
  21. De-Juan-Ripoll, C.; Llanes-Jurado, J.; Giglioli, I.A.C.; Marín-Morales, J.; Alcañiz, M. An Immersive Virtual Reality Game for Predicting Risk Taking through the Use of Implicit Measures. Appl. Sci. 2021, 11, 825. [Google Scholar] [CrossRef]
  22. Becker, W.J.; Menges, J.I. Biological implicit measures in HRM and OB: A question of how not if. Hum. Resour. Manag. Rev. 2013, 23, 219–228. [Google Scholar] [CrossRef]
  23. Gerpott, F.H.; Lehmann-Willenbrock, N.; Silvis, J.D.; Van Vugt, M. In the eye of the beholder? An eye-tracking experiment on emergent leadership in team interactions. Leadersh. Q. 2018, 29, 523–532. [Google Scholar] [CrossRef]
  24. Balthazard, P.A.; Waldman, D.A.; Thatcher, R.W.; Hannah, S.T. Differentiating transformational and non-transformational leaders on the basis of neurological imaging. Leadersh. Q. 2012, 23, 244–258. [Google Scholar] [CrossRef] [Green Version]
  25. Hannah, S.T.; Balthazard, P.A.; Waldman, D.A.; Jennings, P.L.; Thatcher, R.W. The psychological and neurological bases of leader self-complexity and effects on adaptive decision-making. J. Appl. Psychol. 2013, 98, 393–411. [Google Scholar] [CrossRef]
  26. Rowe, A.J.; Boulgarides, J.D. The Decision Maker. Managerial Decision Making: A Guide to Successful Business Decisions; John Wiley and Sons: Hoboken, NJ, USA, 1992; pp. 21–43. [Google Scholar]
  27. Leonard, N.H.; Scholl, R.W.; Kowalski, K.B. Information processing style and decision making. J. Organ. Behav. 1999, 20, 407–420. [Google Scholar] [CrossRef]
  28. Martinsons, M.G.; Davison, R.M. Strategic decision making and support systems: Comparing American, Japanese and Chinese management. Decis. Support Syst. 2007, 43, 284–300. [Google Scholar] [CrossRef]
  29. Torres, P.; Augusto, M. The impact of experiential learning on managers’ strategic competencies and decision style. J. Innov. Knowl. 2017, 2, 10–14. [Google Scholar] [CrossRef] [Green Version]
  30. Halpin, A.W.; Winer, B.J. The observed leader behavior and ideal leader behavior of aircraft commanders and school superintendents. In Leader Behavior: Its Description and Measurement; Stogdill, R.M., Coons, A.E., Eds.; Ohio State University, Bureau of Business Research: Columbus, OH, USA, 1957; pp. 65–68. [Google Scholar]
  31. Meißner, M.; Oll, J. The promise of eye-tracking methodology in organizational research: A taxonomy, review, and future avenues. Organ. Res. Methods 2019, 22, 590–617. [Google Scholar] [CrossRef]
  32. Frischen, A.; Bayliss, A.P.; Tipper, S.P. Gaze cueing of attention: Visual attention, social cognition, and individual differences. Psychol. Bull. 2007, 133, 694. [Google Scholar] [CrossRef] [PubMed]
  33. Tskhay, K.O.; Zhu, R.; Rule, N.O. Perceptions of charisma from thin slices of behavior predict leadership prototypicality judgments. Leadersh. Q. 2017, 28, 555–562. [Google Scholar] [CrossRef]
  34. Eckstein, M.K.; Guerra-Carrillo, B.; Singley, A.T.M.; Bunge, S.A. Beyond eye gaze: What else can eyetracking reveal about cognition and cognitive development? Dev. Cogn. Neurosci. 2017, 25, 69–91. [Google Scholar] [CrossRef] [PubMed] [Green Version]
  35. Blake, R.; Mouton, J. The Managerial Grid: The Key to Leadership Excellence; Gulf Publishing Co: Houston, TX, USA, 1964; p. 350. [Google Scholar]
  36. Gibaldi, A.; Vanegas, M.; Bex, P.J.; Maiello, G. Evaluation of the Tobii EyeX Eye tracking controller and Matlab toolkit for research. Behav. Res. Methods 2017, 49, 923–946. [Google Scholar] [CrossRef] [PubMed] [Green Version]
  37. Filzmoser, P.; Viertl, R. Testing hypotheses with fuzzy data: The fuzzy p-value. Metrika 2004, 59, 21–29. [Google Scholar] [CrossRef]
  38. Doak, J. Cse-92-18-an Evaluation of Feature Selection Methodsand Their Application to Computer Security. UC Davis. 1992. Available online: https://escholarship.org/uc/item/2jf918dh (accessed on 26 June 2021).
  39. Iederan, O.C.; Curşeu, P.L.; Vermeulen, P.A.M. Effective Decision-Making: The Role of Cognitive Complexity in Strategic Decisions; Radboud University: Nijmegen, The Netherlands, 2009. [Google Scholar]
  40. Lindebaum, D.; Jordan, P. A critique on neuroscientific methodologies in organizational behavior and management studies. J. Organ. Behav. 2014, 35, 898–908. [Google Scholar] [CrossRef] [Green Version]
  41. Madera, J.M.; Hebl, M.R. Discrimination against facially stigmatized applicants in interviews: An eye-tracking and face-to-face investigation. J. Appl. Psychol. 2012, 97, 317–330. [Google Scholar] [CrossRef] [PubMed] [Green Version]
Figure 1. Virtual agent character profiles: (a) Expert; (b) Organizer; (c) Emotional and Communicative Individual; (d) Strategist.
Applsci 11 05956 g001
Figure 2. Basic roles: active and passive.
Applsci 11 05956 g002
Figure 3. Example of behavioral roles.
Applsci 11 05956 g003
Table 1. Description of the variables extracted from the decisions made and the behavior of the participant in terms of eye movement during the serious game.
Group of VariablesDefinitionNumber of Variables
SituationsDecision-making29
Eye TrackingRole of the virtual agent the
participant was looking at
in that moment
Mean time (s)9
Mean number of fixations (n)9
Mean fixation time (s)9
Mean time to first fixation (s)9
Virtual agent the participant
was looking at
Mean time (s)5
Mean number of fixations (n)5
Mean fixation time (s)5
Mean time to first fixation (s)5
Table 2. Eye-tracking metrics extracted during the serious game.
MetricDefinition
Mean time (s)Mean time the participant looked at the defined virtual agent/role during the whole experience.
Mean number of fixations (s)Mean number of times the participant fixed the sight on the particular virtual agent/role during the whole experience.
Mean fixation time (s)Mean time that each fixation in a virtual agent/role lasted during the whole experience.
Mean time to first fixation (s)Time to first fixation is the time that elapses from the beginning of the experiment until the first time the eyes are fixed on the virtual agent/role. This metric defines the mean time to first fixation after the whole experience.
Table 3. Machine learning algorithms used, hyperparameters tuned, and values tested. Each algorithm represents a different family of algorithms.
AlgorithmParameterValues
GLMAlpha(0, 1)
SVMC2^(−10, 10)
Sigma2^(−10, 10)
kNNK(3, 5, 7, 9, 11)
Table 4. Descriptive statistics and statistical analysis of participant ROL and TOL subscales.
SubscaleLevelNMeanStandard
Deviation
p-Value
Relationship-oriented
Leadership (ROL)
High2811.80.92<0.001
Low237.261.76
Task-oriented
Leadership (TOL)
High258.21.12<0.001
Low263.070.41
Table 5. Variables where statistically significant differences for ROL/TOL were found. The test performed was selected according to the nature of the variable.
VariableSubscaleTestp-ValueHigh LevelLow Level
S5: CommunicationROLChi-square0.040+: 7%,
−: 7%,
None: 86%
+: 13%,
−: 26%,
None: 61%
Passive Role: Mean TimeROLWilcoxon0.0369.66 ± 1.069.02 ± 1.05
AOI Martina: Mean TimeROLWilcoxon0.0471.02 ± 1.019.57 ± 1.09
Supportive Role: Mean
Fixation Time
TOLt-test0.0480.99 ± 0.400.80 ± 0.22
Table 6. Best model achieved for each leadership subscale and the category of features selected by them. The values shown per metric are the mean values of the 5 × 2 repeated cross-validation iterations.
SubscaleAlgorithmFeaturesAccuracyKappaTPRTNR
DecisionsET: RoleET: Virtual Agent
ROLkNN9320.790.510.710.82
TOLGLM2710.760.520.770.76
Table 7. ROL feature selection.
ROL Features
Decisions9S4: communication
S4: communication
S5: communication
S5: communication
S9: execution
S9: execution
S1: execution
S3: execution
S7: giving orders
ET: Role3Role: Mean Time
Empathy Role: First Fixation Mean Time
Background Role: Mean Time
ET: AOI2AOIMARTINA: Mean Time (organizer)
AOISUSANA: Mean Time (strategist)
Table 8. TOL feature selection.
TOL Features
Decisions2S4: communication
S5: execution
ET: Role7Supportive Role: Mean Time
Supportive Role: Mean Number of Fixations
Decision-making Role: Mean Time
Decision-making Role: First Fixation Mean Time
Informative Role: Mean Time
Passive Role: Mean Fixation Time
Background Role: Mean Number of Fixations
ET: AOI1AOI MARCOS: Mean Time (Communicative)
Publisher’s Note: MDPI stays neutral with regard to jurisdictional claims in published maps and institutional affiliations.

