Article

Correlations between Process and Geometric Parameters in Additive Manufacturing of Austenitic Stainless Steel Components Using 3DPMD

Chair of Welding Engineering, Chemnitz University of Technology, D-09126 Chemnitz, Germany
Appl. Sci. 2021, 11(12), 5610; https://doi.org/10.3390/app11125610
Submission received: 13 April 2021 / Revised: 14 June 2021 / Accepted: 15 June 2021 / Published: 17 June 2021

Abstract

:
The additive manufacturing of components is characterized by a layered build-up. The stability of the build-up process with regard to the component geometry and the layer thickness is essential for the success of the entire system. A prerequisite for this is the exact knowledge of the interrelationships between the process, construction parameters and the resulting component geometry, respectively. These correlations are determined within the study using the 3D Plasma Metal Deposition Process (3DPMD). For this purpose, the process is first subjected to a system analysis. Possible influencing variables were identified with regard to the question “Which system parameters influence the component geometry?” and then prioritized. Then, the influence of control factors (welding current intensity, welding speed, and powder mass flow) was investigated according to the specifications of the Design of Experiments (DOE) method by means of a full-factorial experimental design and evaluated on the basis of metallographic cross-sections. As a result, it was determined that the system parameter powder mass flow only influences the layer thickness and not the wall thickness and is, therefore, available as a process control variable. In sum, comprehensive knowledge of complex relationships between the control parameters and the component geometry in additive manufacturing using 3DPMD was achieved and forms the basis for further scientific work.

1. Introduction

The layer-by-layer design of components made of shapeless raw material is known as additive manufacturing [1]. If this takes place outside a limiting build space and the raw material is melted by means of an electrical arc, the definition of the arc-based free-space process is fulfilled [2]. The basic prerequisite for an error-free and flexible manufacturing process is an exact knowledge of the relationships between the predefined process parameters, construction conditions and the resulting component geometry. The necessity for this is illustrated below by comparing the classic Plasma Transfer Arc technology (PTA) with the additive 3D Plasma Metal Deposition process as an example.
The 3DPMD process is based on the classic PTA [3,4,5] The conventional aim of the PTA process is to enhance the resistance of the component surface to aggressive media, corrosion, abrasion or to replace missing material [6,7]. For this purpose, several welding beads are usually applied to the base material in three to five layers similar to a carpet. Due to this low number of layers, the build-up characteristics are two-dimensional. As a result, any deviations in the resulting bead width or weld seam height do not have a significant effect on the coating or the process quality and are, therefore, of minor importance.
However, additive components often require a high number of layers, with a defined and reproducible slice distance per layer. Therefore, the exemplary deviation of −0.1 mm per layer with a number of 200 layers leads to an increase in the arc length from 10 mm to 30 mm. As a result, the arc voltage increases (=higher heat input) steadily due to the increased arc resistance, resulting in unstable arc conditions with the consequence of process interruption [8,9].
Therefore, the aim of these studies was to detect and evaluate correlations between the process- or build cycle parameters and the resulting component geometry. Based on this, control variables were defined, and the process’ stability and flexibility were increased.
Thus far, the powder-based PTA process in the context of additive manufacturing has mostly been considered with a focus on the presentation of the process potential by the production and characterization of demonstrator components. Zou et al. [10] described the production of hybrid components made of aluminum oxide ceramics (Al2O3) and a nickel-based alloy. A variation of the parameters as well as their influence did not occur. The same applies to Hollis et al. [11], where the focus was on the evaluation of the microstructure of the beryllium component produced by PTA and the determination of its mechanical and technological properties. The possibility of preparing components from 17-4 PH stainless steel through PTA was described in El Moghazi et al. [12]. Withers et al. [13] and Lee [14] used the process for the production of large components (7300*7300*4870 mm) at a maximum melting rate of 22.67 kg/h. No statements were made on general correlations. The manufacturing of simple geometries using PTA in combination with a subtractive process was described in Xinhong et al. [15] and Xiong et al. [16]. In an earlier publication, Xinhong et al. [17] showed that the welding current has a large influence on the part geometry, the powder feed rate has a small influence and the welding speed has a medium influence. Quantitative statements are not provided. Wang et al. [18] described the relationship between the variation of various process parameters and the component geometry for the micro plasma process. It was described that with increasing welding speed, both the height of the component and the layer width decreased in equal relationship. An increase in the welding current, on the other hand, led to opposing behavior. In this case, the layer height decreased, and the wall thickness increased with an increasing welding current. The variation of the powder feed rate had a positive effect on the layer height at a significant level. The wall thickness was almost unaffected by this. Due to the massive differences between the micro plasma process described in the literature [18,19] and the 3DPMD—such as increased deposition rate, higher feedstock flow rates, larger component dimensions [20]—the relationships described must be checked for their transferability or validity. It was expected that deviations in the process will be detected and scaling effects are present.
A review of the literature showed that there have been no fundamental studies of the entire system with regard to correlations between process parameters and component geometry in the field of plasma transferred arc welding in the context of additive manufacturing. However, these are prerequisites for a stable additive process. By means of a comprehensive system analysis, statements on possible process control variables are to be made for the first time, thus laying the foundation for automated additive manufacturing using 3DPMD.

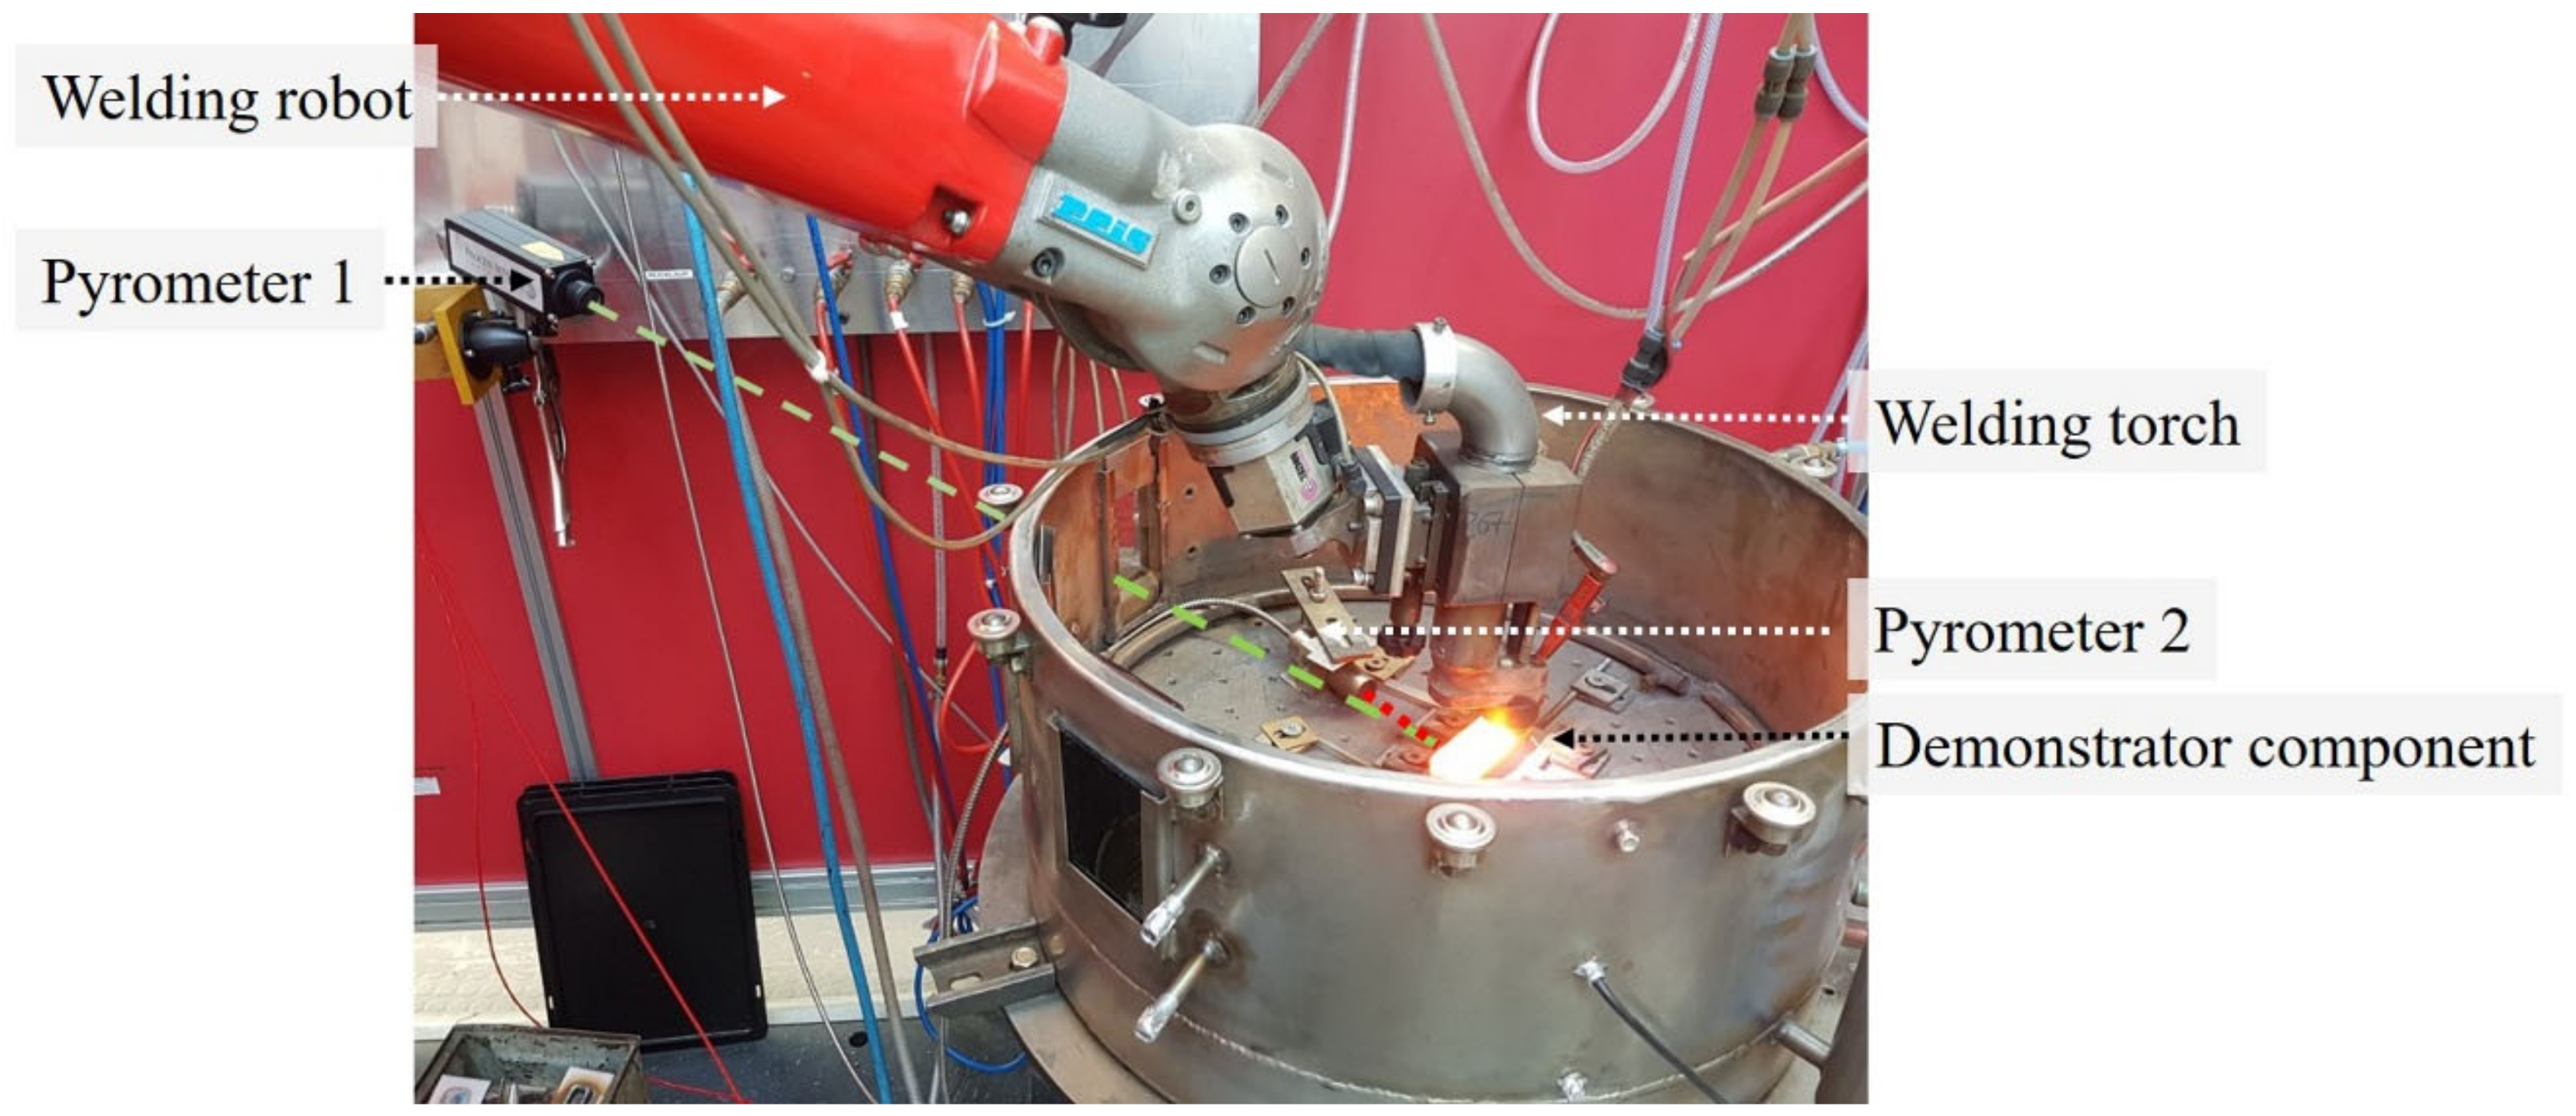
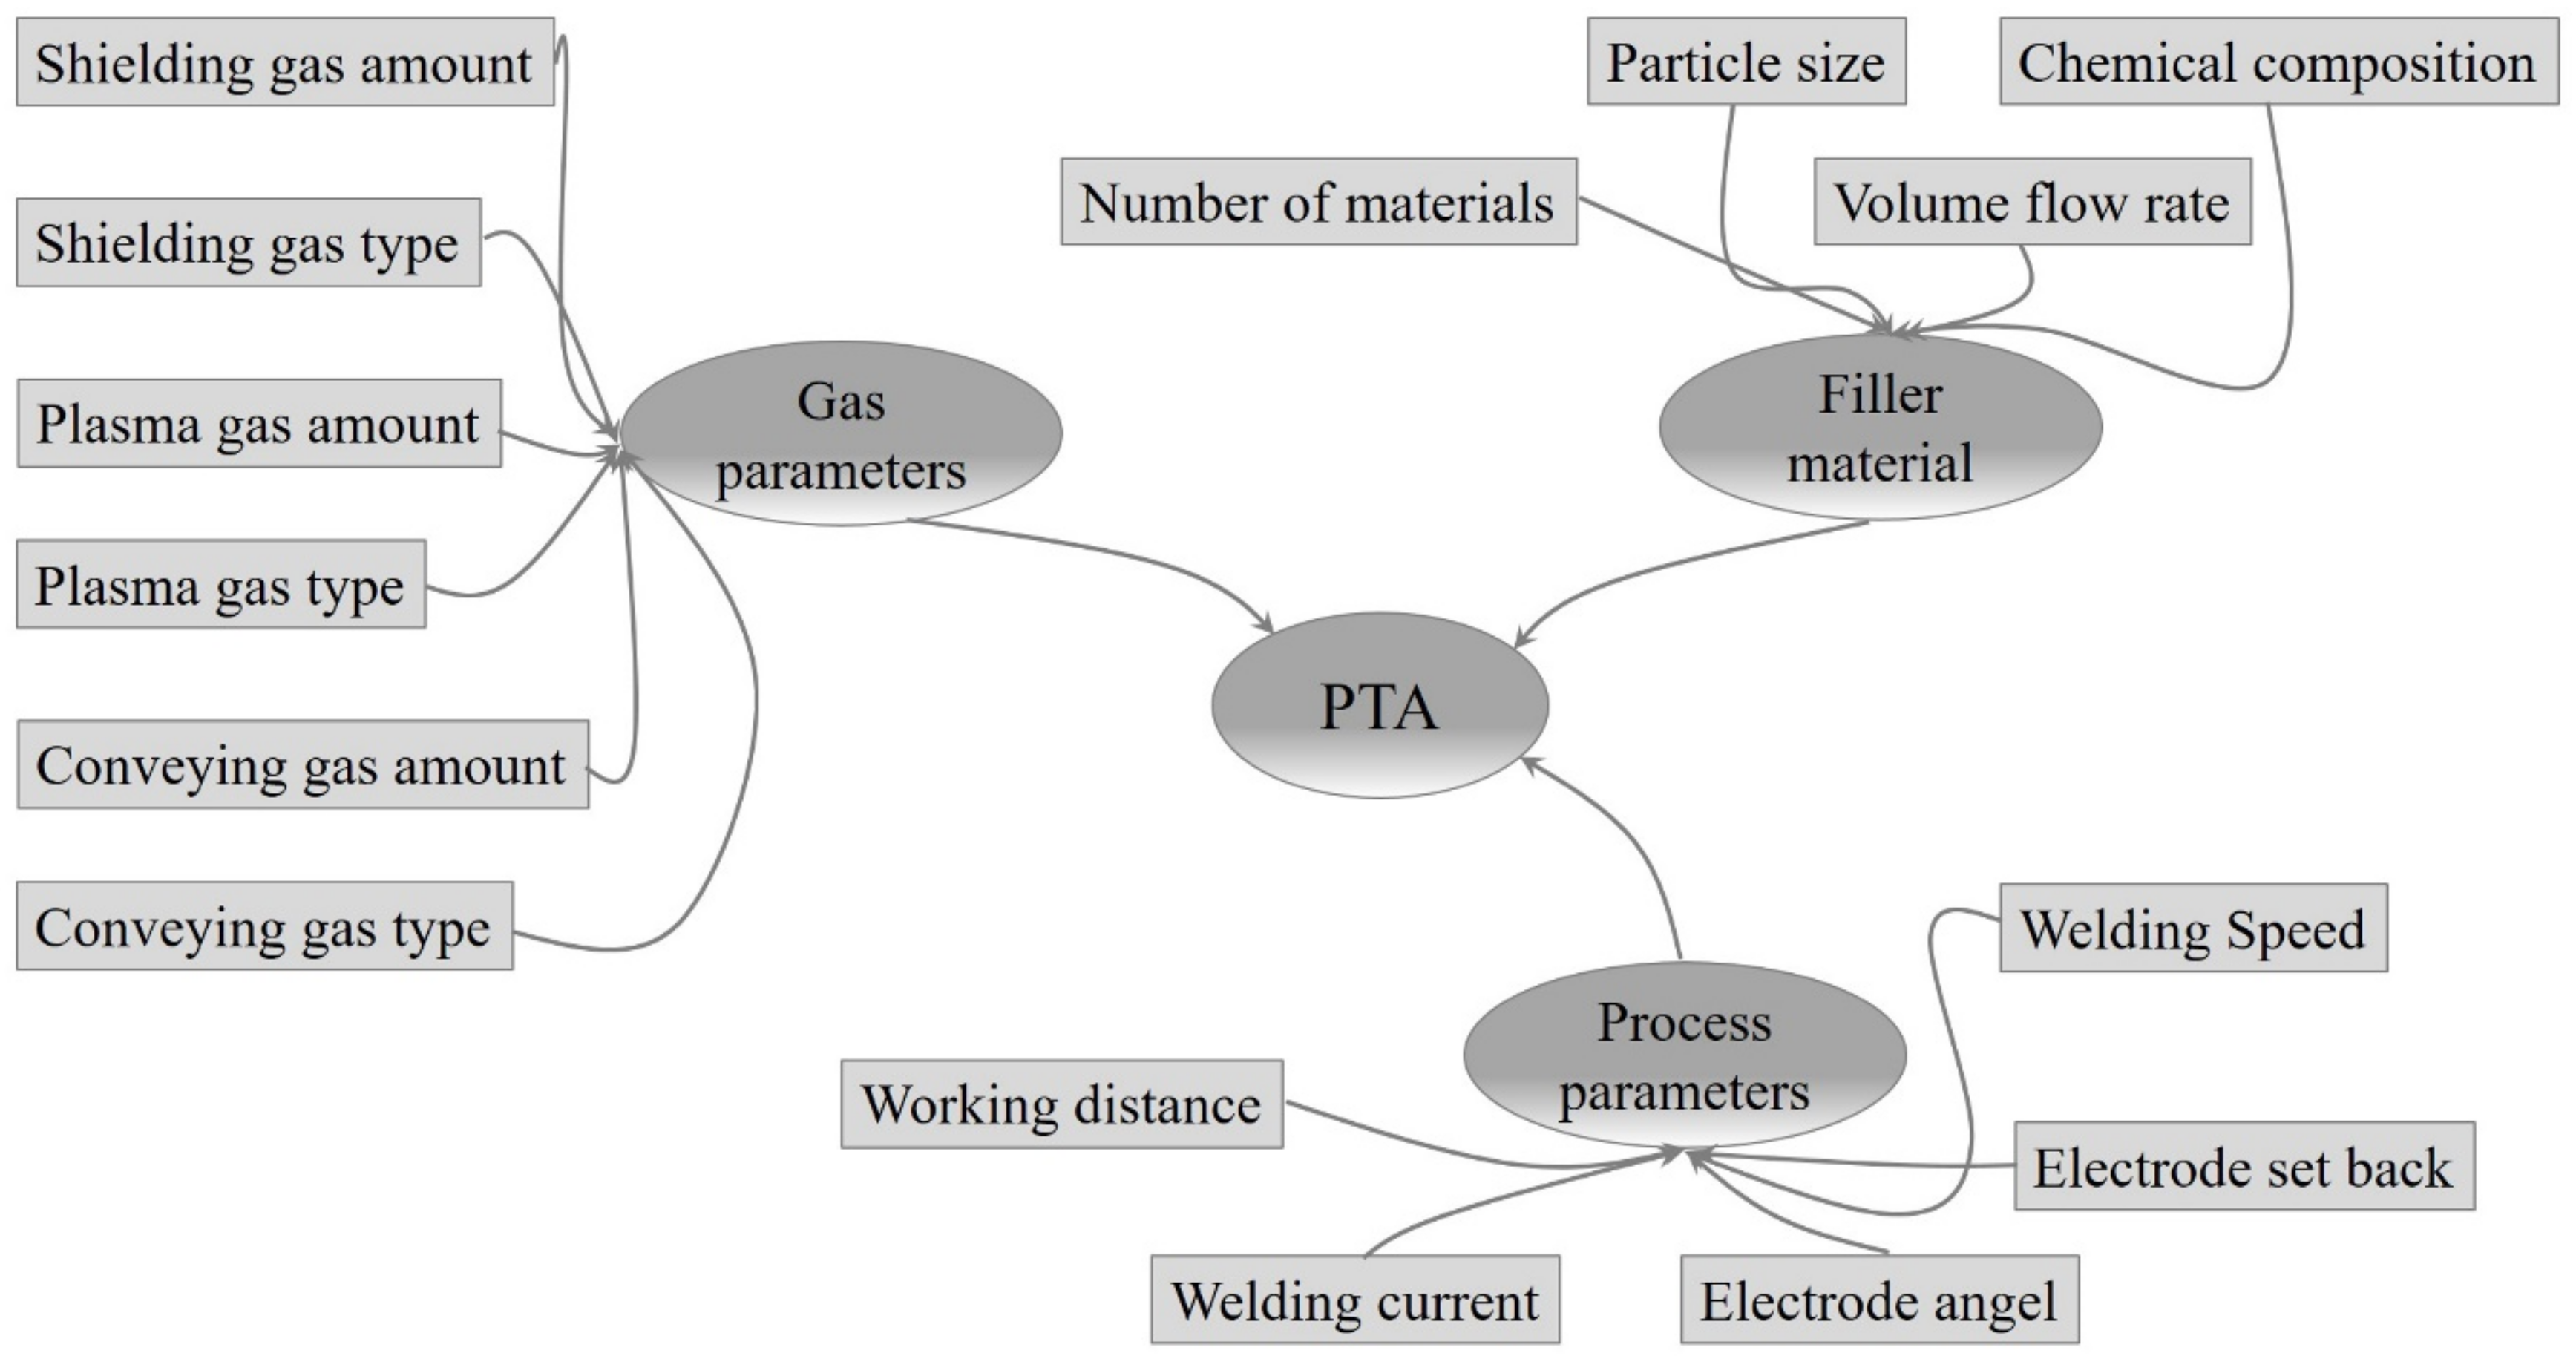
2. Materials and Methods

The experimental setup is shown in Figure 1. The test series were carried out with the power source Plasmastar 500, a standard welding torch (type Plasmastar MV230) in combination with the powder feed unit Plasmastar PFII. The relative movement was realized by a 6-axis welding robot type Reis RV20-16.
The advantage of the PTA process in the context of additive manufacturing is its high flexibility due to a huge number of setting parameters, which can be adjusted mostly independently of each other [9]. The lack of a direct link from the added feedstock mass to the added welding power is an example of this. This is an advantage compared to other arc-based process variants, especially for a multi-material additive manufacturing application with different raw material properties. To visualize the system complexity, Figure 2 shows all parameters that can be varied before or during the building process and forms the basis for the subsequent system analysis.
The system analysis of the PTA process was based on the specifications of the DoE method. The aim of these was to prioritize the parameters shown in Figure 2, asking the question, “Which parameters can be used during the construction process to affect the component geometry directly?” Parameters which correspond to this criterion are defined as control factors. To achieve this, first the process was analyzed in general, then the determined system variables were prioritized and finally control factors were defined. The control factors identified as relevant are the welding speed, the welding current and powder mass flow. The investigation of the control factors was carried out by means of a 2-level full-factorial experimental design with a centered reference point. The settings of the reference parameters were determined in systematic preliminary tests [21]. The parameters of the reference point [21] and the changes of the control factors (see bracketed values) are shown in Table 1.
Demonstrator components in hollow cuboid design with the dimensions b*l*h = 25*110*20 mm were produced to determine the relationships. An argon gas-atomized powder of the alloy 316L (X2CrNiMo17-12-2), particle size 50–150 µm with a spherical shape, was used for all tests.
The evaluation of the part geometry was based on metallographic cross sections. In order to avoid random deviations, three cross sections per component, which are distributed around the circumference of the component, were produced and optically evaluated. The metallographic preparation followed the standard procedure according to ASTM E3-95 [22]. The measurement of the cross sections was carried out with an optical microscope (Zeiss) with integrated evaluation unit. To measure the component temperature during the build-up process, a combination of two pyrometers was used. In order to measure the entire temperature range, the IGAQ 10-LQ Impac two color pyrometer with a measuring range of T = 300–1000 °C was supplemented by a narrow-band METIS MQ11 pyrometer (T = 750–1800 °C). To display the size of the melt pool, a high-speed camera system (Phantom V7) with a frame rate of f = 2000 Hz in combination with a laser illumination unit was used.

3. Results and Discussion

The results of the variation of the control factors are shown in the following main effects diagrams. The influence of the control factors on the respective geometry parameter is shown in standardized form, with the low level of the control factor always being taken as the reference value (≡1.0)

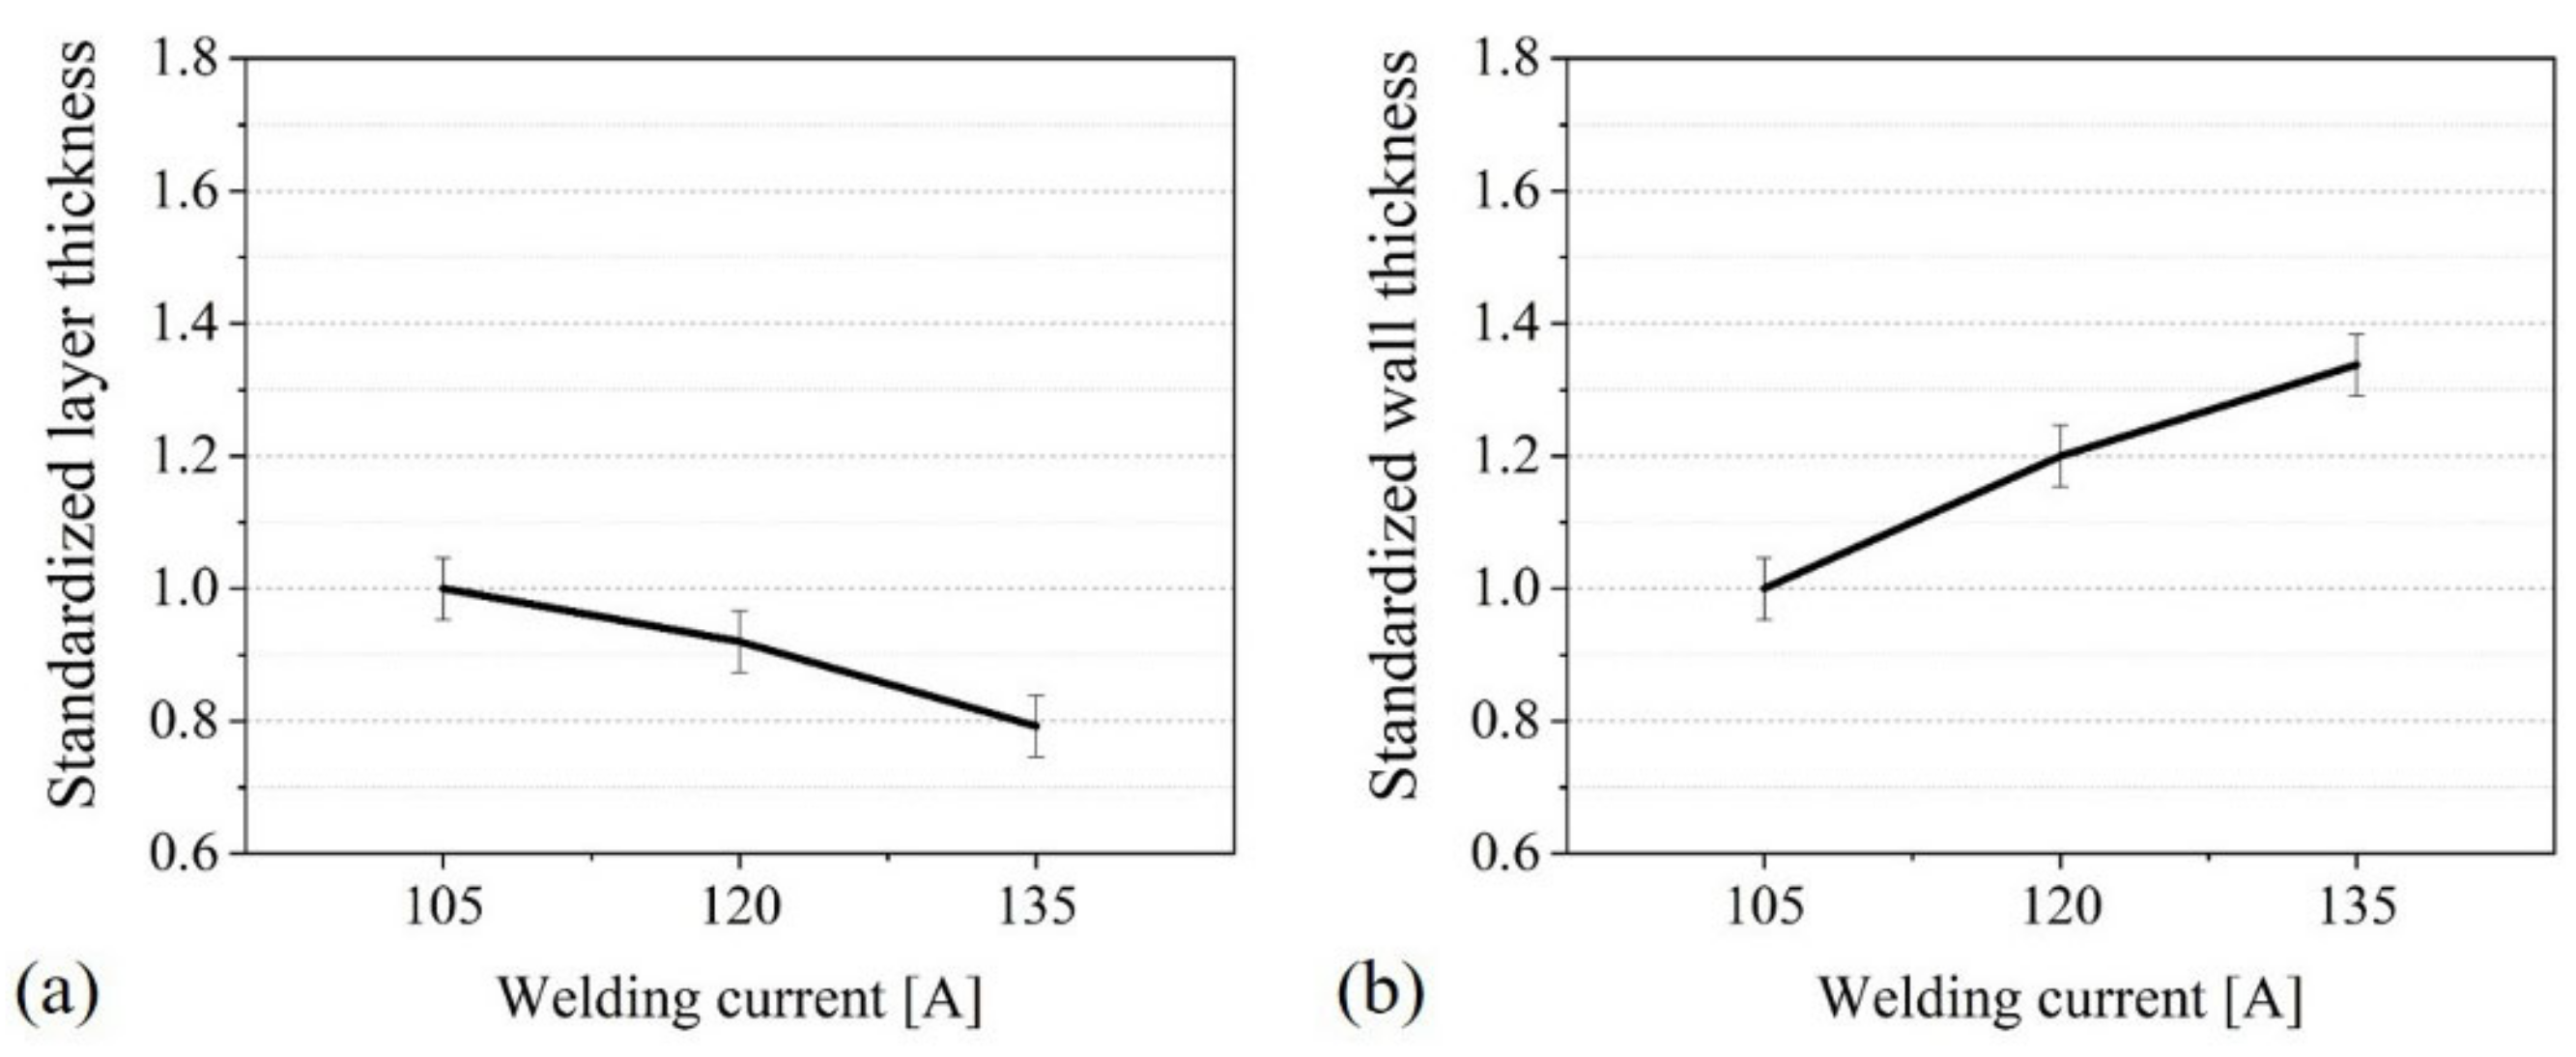
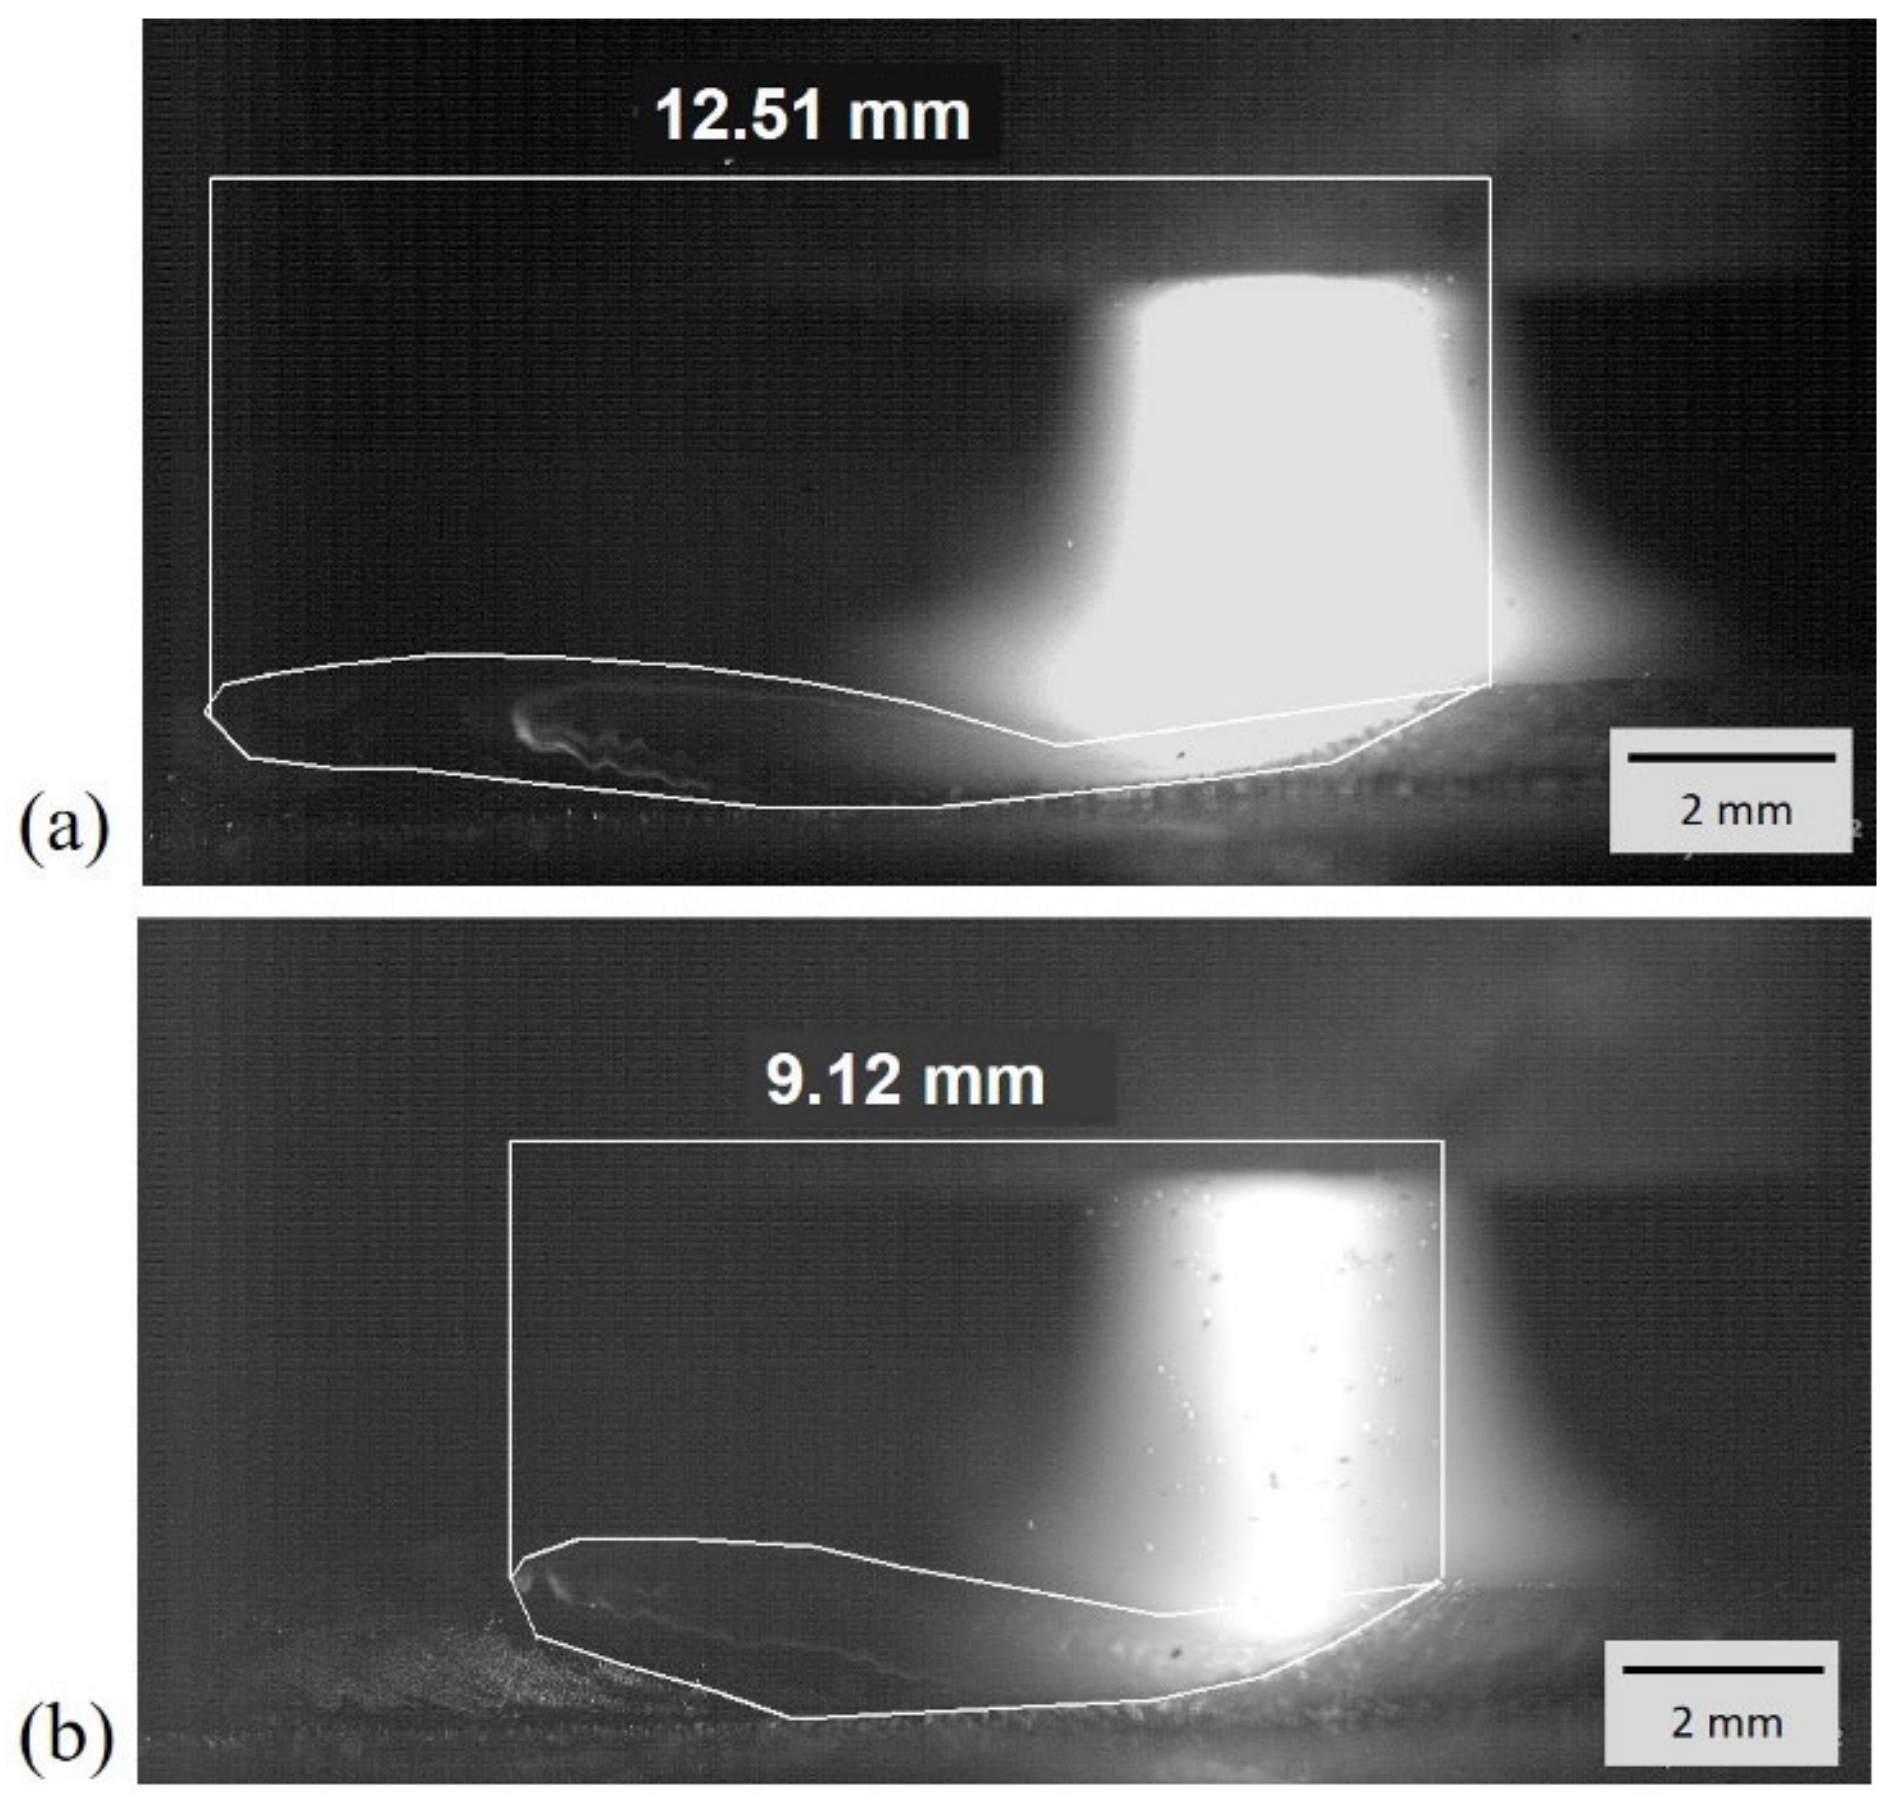
3.1. Welding Current
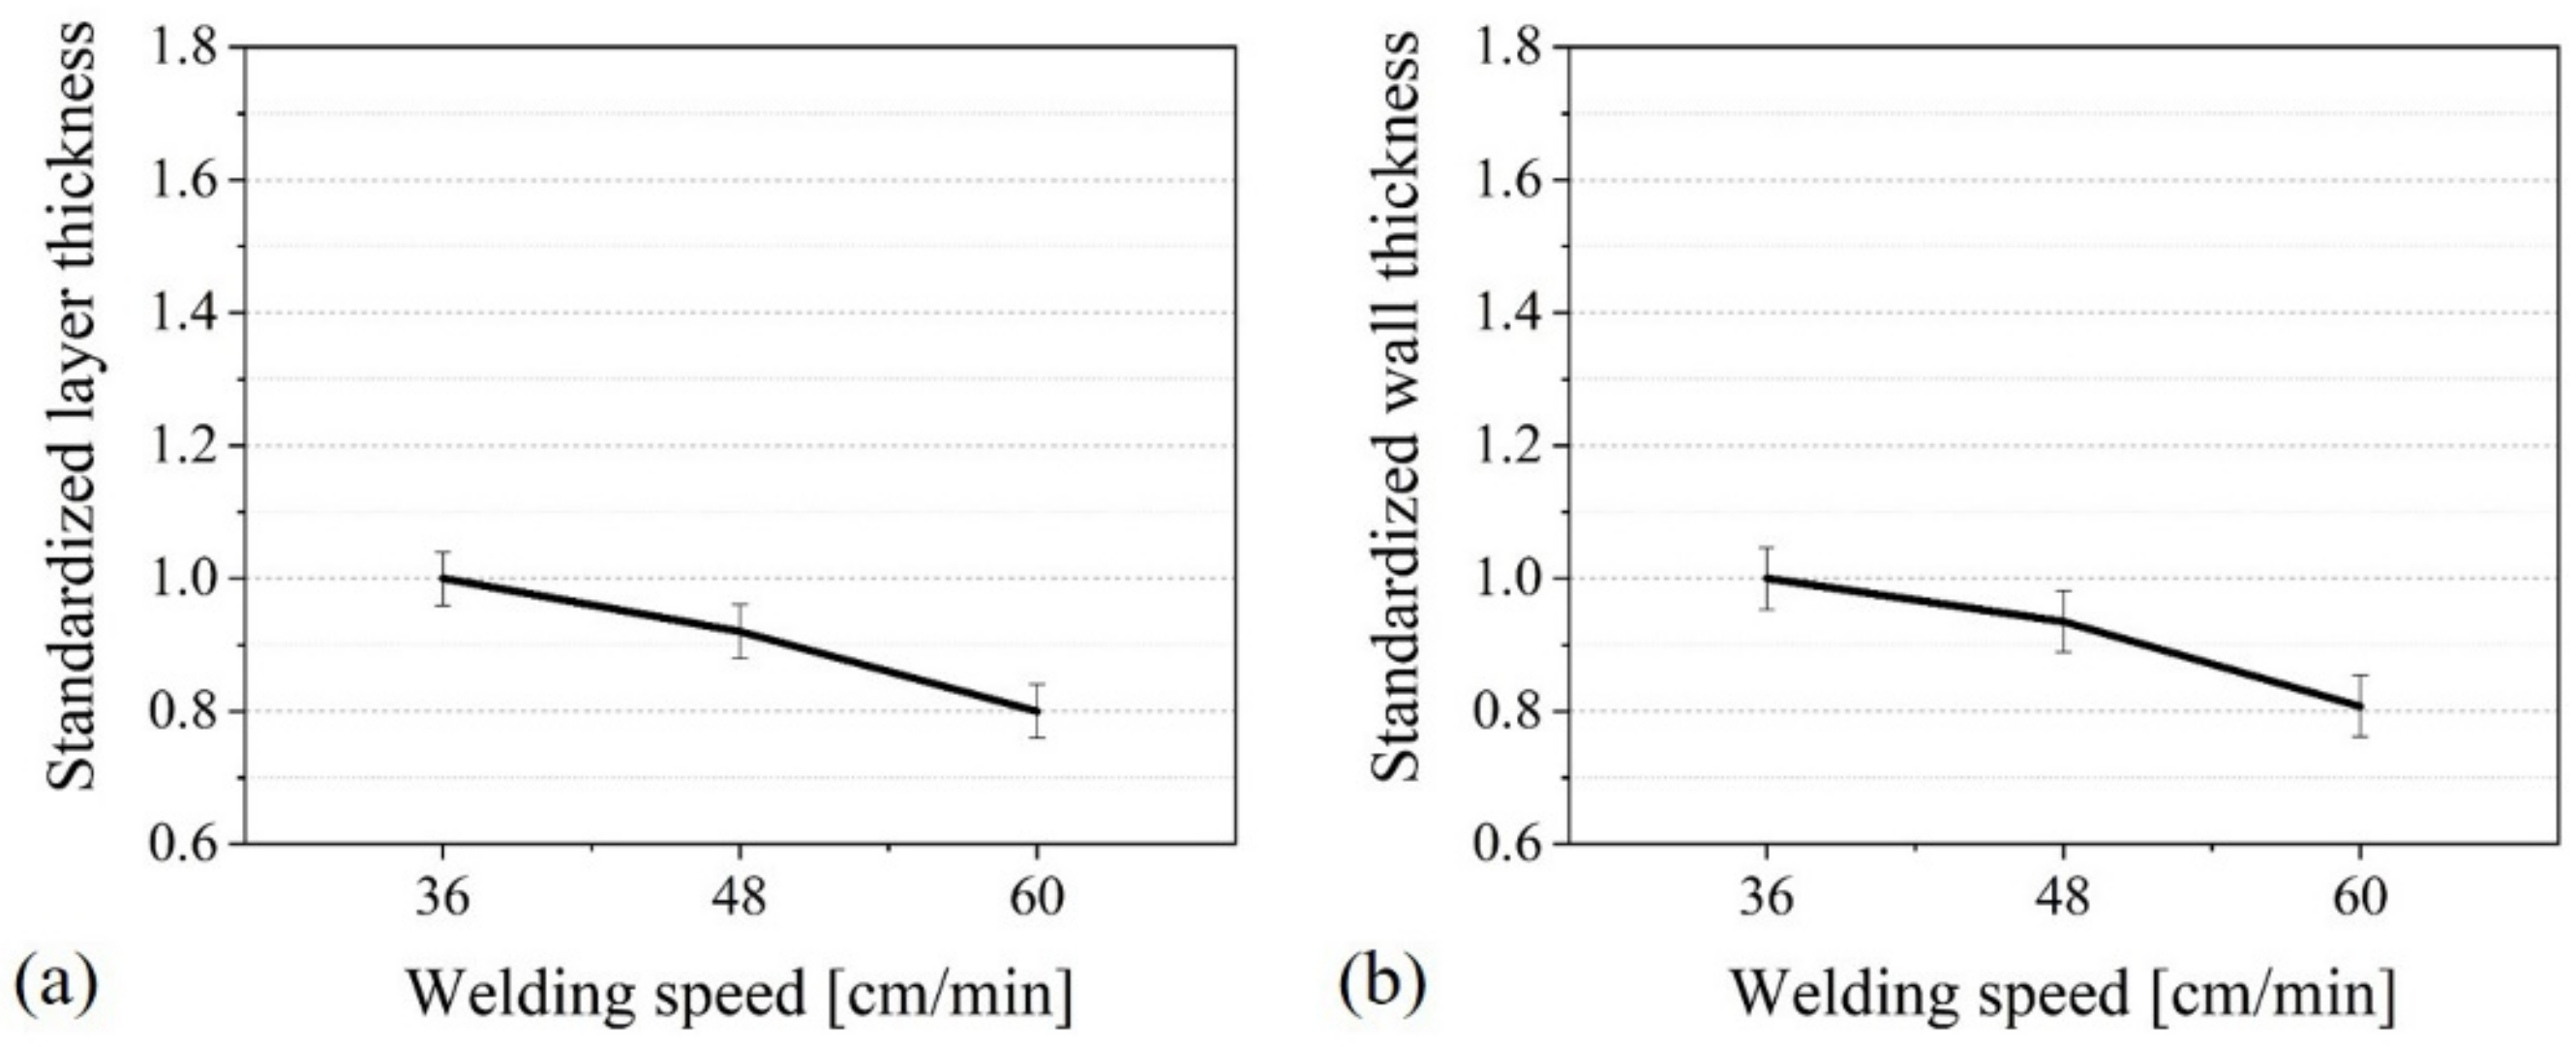
The results of the evaluation show that, as the welding current decreases, the layer thickness increases while the wall thickness decreases (Figure 3).
Under the condition that the framework parameters (Table 1) are constant and the welding current decreases, this also applies to the reduction in the energy input per unit length E Equation (1).
E = U S · I S · η v S
This reduction leads directly to a smaller melt pool size. Figure 4 shows an example of the length of the melt pool as an indicator of the melt pool volume at a welding speed of vs = 36 cm/min and a powder mass flow of mp = 18.3 g/min and varied welding current. It was seen that the reduction in the welding current from Is = 135 A to Is = 105 A causes a reduction in the weld pool length of 27%. This reduced weld pool length can be used as a direct indication of a lower melt pool temperature due to the constancy of all other parameters. Fused metals with a lower temperature are characterized by a higher viscosity, which is why a perpendicular build-up direction is preferred and the wall thickness is reduced. The results obtained are consistent with what is stated in various sources of the literature [17,18].

3.2. Welding Speed

The increase in the welding speed also leads to a smaller weld pool size (assuming Pschw = const) with the consequence of decreasing wall thicknesses. The comparison of the temperature development of the 12th layer resulted in an average layer temperature that was 90 K lower at a welding speed of vs = 60 cm/min compared to vs = 36 cm/min and illustrates the lower energy per unit length. This, in conjunction with a reduced material input per unit length, leads to reduced wall thicknesses as well as a reduction in the layer thickness (Figure 5). Wang et al. [18] concludes with comparative results. Xinhong et al. [17] supports these findings as well.

3.3. Powder Feed Rate

An increase in the powder mass flow (PMF) only resulted in a higher layer thickness (Figure 6a).
The slight deviation of the wall thickness is within the area of uncertainty and is, consequently, not significant. The reason for increasing layer thickness was a combination of increased volume input of filler material per unit length of weld seam and lower part temperature. Figure 6b shows an example of the temperature development of the fourth layer during the production of layers 5–25 (represented by the welding time) at a welding current of Is = 105 A and a welding speed of vs = 36 cm/min. The peak height can be set equal to the energy input into the depth of the component. The lower component temperature at higher PMF (parameters remaining the same) can be justified with formula 2 in combination with formula 3. Where Qi is the required amount of heat in J, mi is the supplied powder mass in g, mP_i is the powder federate in g/min and ΔTi is the temperature difference in K. The variables heat capacity c and welding time tsi can be neglected due to material constancy or equal construction times.
Q i = m i · c i · Δ T i
m i = m ˙ P _ i · t S i
m 1 m 2 = T 2 T 1
By equating Equations (2) and (3) and rearranging them, Equation (4) is created. The mass ratio can be calculated by using the respective powder feed rates, taking into account the correct powder utilization rate. The temperature ratio is described by the respective areas under the temperature–time curve, which is determined by integration, and is to be interpreted as a dimensionless parameter. This results in 0.6985 = 0.7121, which is sufficiently accurate proof of the cause of the lower component temperatures and, thus, for the layer thicknesses increasing with the increase of PMFs.
The significant effect on the layer thickness and the lack of correlation with the wall thickness is also described by Wang et al. [18]. Xinhong et al. [17], on the other hand, describe the influence of a modified powder feed rate on the seam geometry as small. The reason for this contradictory opinion is to be found in the data basis. Xinhong et al. [17] only use a single coating layer as an evaluation parameter, and not an additive structure. This prevents a representation of typical effects in additive manufacturing, such as the multiple remelting of lower layers with associated hardness fluctuation [23], and leads to these deviations.

4. Conclusions

The findings obtained here allow, for the first time, a quantitative description of the essential process variables with the resulting geometry for the PTA process in additive manufacturing. It can be determined that the welding current, the welding speed and the powder mass flow can be defined as control variables and are, thus, directly available for influencing the component geometry during production. An increase in the welding speed leads to a parallel decrease in the layer and wall thickness. An inverse correlation was observed when the welding current was increased. Here, the layer thickness decreased and the wall thickness increased. The variation of the powder mass flow only had an effect on the layer thickness but not on the wall thickness. This makes the control factor PMF particularly suitable as a controlling parameter. The lack of influence on the wall thickness means that this process is a highly effective tool which can be utilized to compensate for differences in the layer thickness during the construction process without influencing the resulting wall thickness.
In summary, the findings obtained here show the suitability of the 3DPMD process for additive manufacturing and, thus, form the basis for further research work.

Funding

The publication of this article was funded by Chemnitz University of Technology.

Institutional Review Board Statement

Not applicable.

Informed Consent Statement

Not applicable.

Acknowledgments

Not applicable.

Conflicts of Interest

The authors declare no conflict of interest.

References

  1. Brandl, E.; Baufeld, B.; Leyens, C.; Gault, R. Additive manufactured Ti-6Al-4V using welding wire: Comparison of laser and arc beam deposition and evaluation with respect to aerospace material specifications. Phys. Proc. 2010, 5, 595–606. [Google Scholar] [CrossRef] [Green Version]
  2. German Standard Institution. DIN EN ISO/ASTM 52900 Additive Manufacturing–General Principles–Terminology; Beuth Verlag: Berlin, Germany, 2018. [Google Scholar]
  3. Rodriguez, J.; Hoefer, K.; Haelsig, A.; Mayr, P. Functionally Graded SS 316L to Ni-Based Structures Produced by 3D Plasma Metal Deposition. Metals 2019, 9, 620. [Google Scholar] [CrossRef] [Green Version]
  4. Rakoczy, L.; Hoefer, K.; Grudzień-Rakoczy, M.; Rutkowski, B.; Goły, M.; Auerbach, T.; Cygan, R.; Abstoss, K.-G.; Zielińska-Lipiec, A.; Mayr, P. Characterization of the microstructure, micro segregation, and phase composition of ex-situ Fe–Ni–Cr–Al–Mo–TiCp composites fabricated by three-dimensional plasma metal deposition on 10CrMo9–10 steel. Arch. Civ. Mech. Eng. 2020, 20, 127. [Google Scholar] [CrossRef]
  5. Hoefer, K.; Mayr, P. 3DPMD–Arc-based additive manufacturing with titanium powder as raw material. China Weld 2019, 1, 11–15. [Google Scholar]
  6. Yilmaz, S.O.; Özenbas, M.; Yaz, M. FeCrC, FeW, and NiAl modified iron-based alloy coating deposited by plasma transferred arc process. Mater Manuf. Process 2011, 5, 722–731. [Google Scholar] [CrossRef]
  7. Shi, K.Y.; Hu, S.B.; Zheng, H.F. On microstructure and fatigue characterization of cast iron alloyed with PTA deposits. Surf. Eng. 2013, 28, 113–121. [Google Scholar] [CrossRef]
  8. Hälsig, A.; Kusch, M.; Mayr, P. Calorimetric analyses of the comprehensive heat flow for gas metal arc welding. Weld World 2014, 59, 191–199. [Google Scholar] [CrossRef]
  9. Richter, E.; Schneider, W.; Schober, D.; Seliga, E.; Weichbrodt, K.-H. Schweißtechnik–Schweißen von Metallischen Konstruktionswerkstoffen; Carl Hanser Verlag: München, Germany, 2006. [Google Scholar]
  10. Zou, H.; Zhang, H.; Guilan, W.; Li, J. Rapid manufacturing of FGM components by using electromagnetic compressed plasma deposition. In Proceedings of the International Conference of Intelligent Systems Research and Mechatronics Engineering, Zhengzhou, China, 11–13 April 2015; pp. 1953–1956. [Google Scholar]
  11. Hollis, K.; Bartram, B.; Withers, J.; Strom, R.; Massarello, J. Plasma Transferred Arc deposition of beryllium. J. Therm. Spray Technol. 2006, 4, 785–789. [Google Scholar] [CrossRef]
  12. El Moghazi, S.N.; Wolfe, T.; Ivey, D.G.; Henein, H. Plasma transfer arc additive manufacturing of 17-4 PH: Assessment of defects. Int. J. Adv. Manuf. Technol. 2020, 7–8, 2301–2313. [Google Scholar] [CrossRef]
  13. Withers, J.; Shapovalov, V.; Strom, R.; Loutfy, R.O. There is low cost titanium componentry today. Key Eng. Mat. 2013, 551, 11–15. [Google Scholar] [CrossRef]
  14. Lee, N. Plasma transfer arc fabrication of enhanced performance barrels. In Proceedings of the NDIA Joint Service Small Arms Symposium, Albuquerque, NM, USA, 15–18 May 2006. [Google Scholar]
  15. Xinhong, X.; Dunmiao, Q.; Chen, J. Direct manufacturing table tennis mould by hybrid plasma deposition and milling. Adv. Mater. 2014, 887, 1219–1222. [Google Scholar]
  16. Xiong, X.; Chen, J.; Quan, D. Directly Manufacturing Mouse Mold by Plasma Deposition Manufacturing. Adv. Mat. 2014, 941, 2190–2193. [Google Scholar] [CrossRef]
  17. Xinhong, X.; Haiou, Z.; Wang, G. Metal direct prototyping using hybrid plasma deposition and milling. J. Mater. Process. Tech. 2009, 209, 124–130. [Google Scholar] [CrossRef]
  18. Wang, H.; Jiang, W.; Valant, M.; Kovacevic, R. Solid freeform fabrication based on micro-plasma powder deposition. In Proceedings of the 14th International Solid Freeform Fabrication Symposium, Austin, TX, USA, 4–6 August 2003; pp. 301–312. [Google Scholar]
  19. Suyog, S.; Christ, P.P.; Neelesh, K.J. Mirco-plasma transferred arc additive manufacturing for die and mold surface remanufacturing. JOM 2016, 7, 1801–1809. [Google Scholar]
  20. Dalaee, M.; Cheaitani, F.; Arabi-Hashemi, A.; Rohrer, C.; Weisse, B.; Leinenbach, C.; Wegner, K. Feasibility in combined direct metal deposition (DMD) and plasma transfer arc welding (PTA) additve manufacturing. Int. J. Adv. Manuf. Tech. 2020, 106, 4375–4389. [Google Scholar] [CrossRef]
  21. Hoefer, K. Qualifizierung des Plasma-Pulver-Auftragschweißens Für Die Generative Herstellung von Bauteilen der Legierung 1.4404. Ph.D. Thesis, TU Chemnitz, Chemnitz, Germany, 2021. Available online: https://nbn-resolving.org/urn:nbn:de:bsz:ch1-qucosa2-740643.
  22. American Standard Institution ASTM E3-95. Standard Guide for Preparation of Metallographic Specimens; ASTM International: West Conshohocken, PA, USA, 1995. [Google Scholar]
  23. Alberti, E.A.; Bueno, B.M.P.; D’Oliveira, A.S.C.M. Additive Manufacturing using plasma transfer arc. Int. J. Manuf. Technol. 2016, 83, 1861–1871. [Google Scholar] [CrossRef]
Figure 1. Experimental setup of the additive process 3DPMD.
Applsci 11 05610 g001
Figure 2. Setting parameters of the PTA process.
Applsci 11 05610 g002
Figure 3. Effect of welding current on layer thickness (a) and wall thickness (b) (standardized representation).
Applsci 11 05610 g003
Figure 4. Weld pool size as a function of welding current at mP = 18.3 g/min. Powder mass flow and vs = 36 cm/min welding speed (a): Is = 105 A; (b): Is = 130 A).
Applsci 11 05610 g004
Figure 5. Effect of welding speed on layer thickness (a) and wall thickness (b) (standardized representation).
Applsci 11 05610 g005
Figure 6. Standardized representation of the effect of welding speed on layer and wall thickness (a). Evolution of the part temperature as a function of the build time and the PMF (b).
Applsci 11 05610 g006
Table 1. Parameter setup for tests.
ParameterParameter Settings
Control factorsWelding current:120 A (105 A; 135 A)
Welding speed:48 cm/min (36 cm/min; 60 cm/min)
Powder mass flow:23 g/min (18.3 g/min; 27.9 g/min)
Framework
parameter
Plasma gas amount:1.5 l/min
Shielding gas amount:12 l/min
Conveying gas:3 l/min
Anode type:Standard
Gas:100% Ar
Working distance:10 mm
Electrode set back:1.5 mmm
Electrode angel:30°
Publisher’s Note: MDPI stays neutral with regard to jurisdictional claims in published maps and institutional affiliations.

